SAFETY AND SHIPPING REVIEW 2019 - An annual review of trends and developments in shipping losses and safety - Allianz Global Corporate ...
←
→
Page content transcription
If your browser does not render page correctly, please read the page content below
ALLIANZ GLOBAL CORPORATE & SPECIALTY

SAFETY AND
SHIPPING
REVIEW 2019
An annual review of trends and developments
in shipping losses and safety
Allianz Global Corporate & Specialty

                                       CONTENTS

                                                     Indonesian Navy patrol boats help to
                                                     put out a fire on board cargo vessel,
                                                     Michael Putra, one of 2018’s total losses.
                                                     Photo: Indonesian Navy

                                                     Passenger ferry, Mestre Simao, was
                                                     grounded at the entrance to the port
                                                     of Madalena on the island of Pico in
                                                     the Azores.
                                                     Photo: Carlos Luis M C da Cruz
                                                             [CC BY-SA 4.0]

                                                     The Indian Navy anchors burning
                                                     container vessel, SSL Kolkata at the
                                                     Ganges Delta.
                                                     Photo: Indian Navy

                                        Photo: ???
                                              ????

2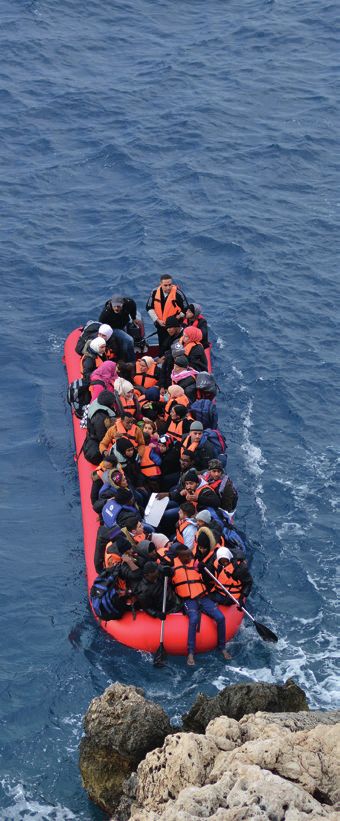
Safety and Shipping Review 2019

                         04          Executive summary

                         08          Shipping loss and incident data 2009 – 2018

             LOSS TRENDS
                 20 Larger vessels bring bigger losses
                 22 Container ship fire issue continues to burn
                 24 Misdeclaration of cargo increasing risk on board
                 26 Lost and damaged container costs mount
                 28 Machinery damage incidents and costs rising
                 30 Human error comes in many forms
                 32 Fewer total losses in Asia but challenges remain
             CLIMATE
                 34 Emissions rules challenge shippers
                 36 Unpredictable weather brings new loss scenarios
             TECHNOLOGY
                 38 Cyber threats increase
                40 Autonomous shipping makes waves
             SECURITY
                 42 Political risk threat continues to evolve
                 44 Stowaways and migrant rescues in safety spotlight
                 46 Rise in piracy incidents
                 47 Sanctions bring risk exposures
                 48 Data and sources
                 49 Contacts
                50 Total losses 1990 – 2018

Cover images: Anti-piracy operations - Cassandra Thompson, US Navy, Wikimedia Commons

                                                                                                                     3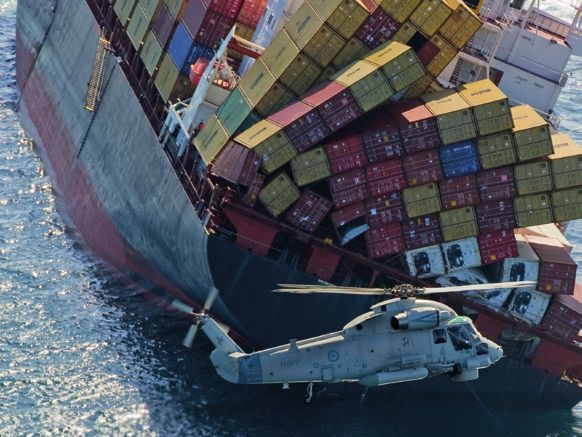
Allianz Global Corporate & Specialty

SAFETY & SHIPPING REVIEW 2019 IN NUMBERS

                                                                   ↓                              30
90% of global                          1,036 total losses          46 total losses in 2018 –           l
trade carried by                       over past 10 years          lowest this century.           fo u o s s e s
                                                                                                      nde ca
international shipping                                             207 losses in 2000             in 2 r in g u s e d
                                                                                                      018 /sin        b
                                                                                                                 k in y
                                                                                                                     g

2,698 shipping incidents
in 2018. Machinery
damage is the top cause

                48 piracy incidents                544 incidents in 2018 in the            1 in 4 losses in 2018
                in Nigeria in 2018 –               East Mediterranean and                  occurred in South China,
                replacing Indonesia                Black Sea – the global hotspot          Indochina, Indonesia and
                as the top hotspot                                                         Philippines – the global hotspot

EXECUTIVE
                                                                   The international shipping industry is responsible for
                                                                   around 90% of world trade. There are around 60,000
                                                                   merchant ships, transporting every kind of cargo. The
                                                                   world fleet is registered in over 150 nations1 , and manned
                                                                   by over a million seafarers, meaning the safety of vessels is

SUMMARY
                                                                   critical. The maritime industry saw the number of total
                                                                   shipping losses of vessels over 100GT plummet during
                                                                   2018 to 46 – the lowest total this century. To put this into
                                                                   context there were 207 total losses reported in 2000.

                                                                   Shipping losses declined by a record level of more than 50%
                                                                   year-on-year from 98 in 2017, driven by a significant fall in
                                                                   hotspots around the world and weather-related losses
                                                                   halving after a quieter year of hurricane and typhoon
                                                                   activity. The 2018 loss year is exceptional compared with
                                                                   the rolling 10-year loss average of 104 (down by 55%).
                                                                   Meanwhile, since 2009, (132), shipping losses have declined
                                                                   by 65%. Improved ship design and technology, stepped-up

4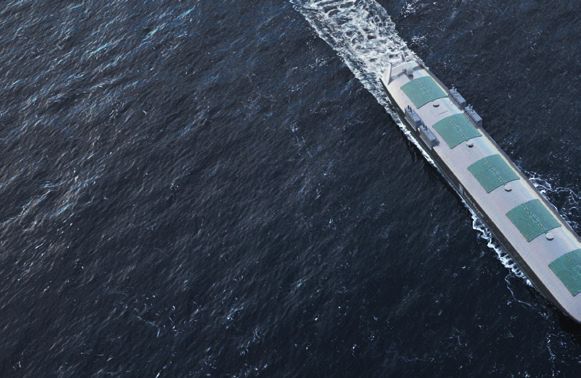
Safety and Shipping Review 2019

                                                    are typically well run and have claims
                                                    frequency rates on a par with European
                                                    counterparts. Newer infrastructure, better
                                                    port operations and more up-to-date
                                                    charts will also help to address safety
                                                    challenges in the region, such as an overall
                                                                                                                      46
                                                    increase in the frequency and cost of
                                                    collision, grounding and fire incidents in
                                                    some locations. The East Mediterranean
   The cost of claims                               and Black Sea region (6) is the second                      shipping losses in
                                                    most frequent loss location.                                2018 – the lowest

              $1.5bn                                Cargo vessels (15) were involved in a third
                                                                                                                   this century

     value of claims from ship                      of losses during 2018, driven by activity in
    sinking/collision incidents1                    the top loss hotspots globally. Foundering
                                                    (sinking) has been the cause of over half of
               $1bn+                                all vessel losses (53%) over the past decade
                                                    and was the primary cause of 65% of losses                     50%+
         value of claims from                       (30) in 2018. Analysis of more than 230,000
         machinery damage                           marine insurance industry claims with a
              incidents1                            value of almost $10bn between July 2013
                                                    and July 2018 by Allianz Global Corporate
                                                    & Specialty (AGCS) shows that ship sinking/                 Annual decline in
                                                    collision incidents are the most expensive                   shipping losses
                                                    cause of loss for insurers, accounting for
                                                    16% of the value of all claims – equivalent
 WEDNESDAY                                          to more than $1.5bn.

   12
                    Wednesday is the
                    most frequent day for           While the number of losses has fallen
                    losses – 12 in 2018 and         significantly over the past year in particular,
   in 2018
                    169 in the last 10 years        the number of shipping casualties or
                                                    incidents (2,698) remains challenging,
                                                    declining by less than 1%. The East
Source: Allianz Global Corporate & Specialty        Mediterranean and Black Sea is the top
                                                    incident hotspot, accounting for one in five
1 B ased on analysis of more than 230,000 marine   incidents globally. Activity is up in this
   insurance industry claims with a value of
   approximately $10bn by Allianz Global            region year-on-year, driven by machinery
   Corporate & Specialty (July 2013 to July 2018)   damage/failure incidents, which is also the
                                                    top cause of shipping incidents globally,
                                                    accounting for 40% (1,079).

                                                    Of the 26,000+ reported shipping incidents
regulation and advances in risk management          over the past decade, more than a third
and safety are driving the sector’s long-           (8,862) have been caused by machinery
term loss improvement. More robust safety           damage or failure – over twice as many
management systems and procedures on                as the next highest cause. Such incidents
vessels is also a factor in preventing              have increased by a third over the past
breakdowns, accidents and other mistakes            decade and costs are rising as well.
from escalating into total losses.                  Historically, it is one of the largest causes
                                                    of marine insurance claims, according to
The South China, Indochina, Indonesia and           AGCS, causing $1bn+ worth of damage
Philippines maritime region remains the             over five years – the third most expensive
major loss location over the past decade.           cause of claims. A growing number of
More than a quarter (26%) of all losses over        engine manufacturers are now installing
the past year globally occurred here (12).          “Internet of Things” devices to collect
However, this represents a significant fall         real-time data which can be used to issue
year-on-year (29 in 2017) and is the first          recommendations to vessels and carry
time the region has seen losses decline in          out maintenance, potentially preventing
four years, reflecting the fact that Asia-          breakdowns before they happen.
based international shipping operations
                                                    1 International Chamber of Shipping
                                                                                                                                     5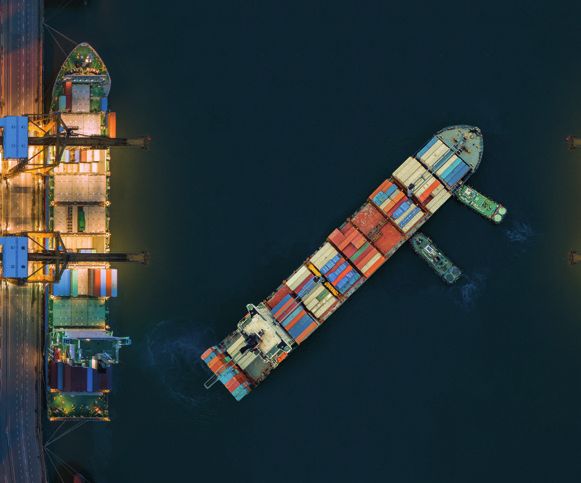
Allianz Global Corporate & Specialty

      8,862

machinery damage
  incidents in 10
years, up by a third
  over this period

                                       Berra G was one of the largest vessels lost according to gross tonnage during 2018.
                                       Photo: Wikimedia Commons

    $10bn                              RISKS IN THE SPOTLIGHT
                                       Larger vessels bring bigger losses:                        a problem exacerbated by larger
                                       Insurers have been warning for years                       vessels, which can make issues more
                                       that the increasing size of vessels is                     difficult to detect, locate and combat.
   Value of 230,000                    leading to a higher accumulation of                        Regulations and guidelines for
  marine insurance                     risk. These fears are now being                            dangerous cargo do exist but are not
  industry claims in                   realized as evidenced by the growing                       always adequately enforced and
    five years. Ship                   number, and cost, of incidents such as                     adhered to. However, a growing
   sinking/collision                   fires on large container vessels; major                    number of ship owners are taking
  incidents account                    losses on car carriers, which average                      innovative steps to address the issue
 for 16% of this total                 two a year; engine failure; and even                       of misdeclared cargo.
                                       the loss of cargo overboard, all of
                                       which are potentially offsetting safety                    On board firefighting capability
                                       and risk management improvements.                          continues to challenge larger vessels.
                                                                                                  If considerable outside assistance is
                                       Such incidents can easily result in                        required to control a blaze, significant
                                       claims in the hundreds of millions of                      damage to the vessel is likely to
                                       dollars, if not more. In future, a worst-                  happen before this occurs,
                                       case scenario involving the collision                      considerably increasing the size of the
                                       and grounding of two large vessels in                      salvage claim. Meanwhile, the loss of
    M TWT F S S                        an environmentally-sensitive location                      hundreds of containers over board
                                       could result in a loss as big as $4bn                      from an ultra large container ship in
                                       when the cost of disruption, salvage,                      early 2019 provides a reminder that
                                       wreck removal and environmental                            damaged goods, including containers,
Wednesday is the most
frequent day for shipping              claims are considered. Loss prevention                     is one of the most frequent generators
losses over the past decade            measures are not always keeping                            of insurance industry shipping claims,
(169) with Saturday (130) the          pace with the upscaling of vessels.                        accounting for one in five claims over
safest day at sea. Twelve of                                                                      five years. Inadequate stowing and
2018’s 46 losses occurred on a
Wednesday.                             Cargo and fire risks mount:                                lashing of cargo on board poses a
                                       Container-carrying capacity has                            serious risk in bad weather.
                                       almost doubled over the past decade
                                       which brings issues as well as benefits.                   Emissions cap challenges shippers:
     J F M A M J                       Fires and explosions on board                              Regulation limiting sulphur oxide
     J A S O N D                       continue to generate large losses with                     emissions from 2020 is likely to be a
                                       an incident occurring every 60 days on                     game-changer for the shipping industry
                                       average. Fire activity increased in                        with wide-ranging implications for cost,
January is the busiest month
for shipping losses around the         2018 with 174 reported incidents – a                       compliance and crew. It is important
world with 117 over the past           trend which continued through early                        shipping plays its part in achieving a
decade, including nine in 2018.        2019. Misdeclared cargo, including                         more sustainable environment but this
                                       incorrect labelling and packaging of                       needs to be done in a way that does
                                       dangerous goods, is believed to be a                       not overburden an industry already
                                       root cause of a number of fires and is                     under pressure. Insurers are concerned

6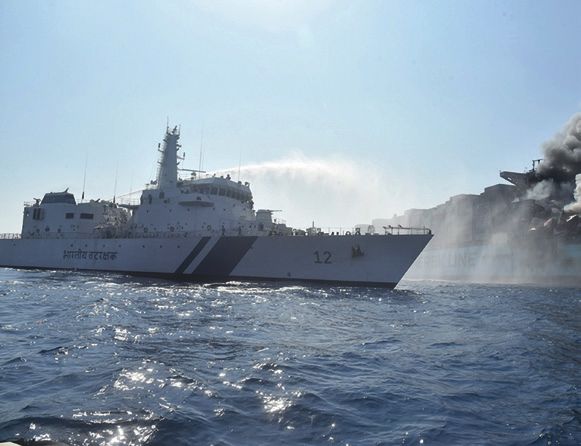
Safety and Shipping Review 2019

The tanker Sanchi sank after a collision with another vessel resulted in a fire.   Dredger, Barlovento Primero was one of 2018’s total losses.
Photo: Bengt-Rune Inberg, shipspotting.com                                         Photo: eldiariomontanes.es, shipwrecklog.com

about a potential increase in the                             and the greater use of sensors have               Companies are responding with an
frequency and cost of machinery                               the potential to improve navigation               uptick in cyber security assessments
breakdown claims following the                                and help avoid incidents. Sensors                 while some insurers are looking to
introduction of low-sulphur fuels if the                      can also reduce machinery claims                  clarify so-called “silent” exposures.
transition is not well-managed. There                         through performance monitoring and                More contingency planning and stress
are also worries that the increased                           early intervention and help mitigate              testing of systems needs to be done to
cost of such fuels may lead to cost                           cargo losses. Yet, at the same time,              combat a growing number of loss
savings in other areas, such as crew                          accidents continue to happen due to               scenarios, such as extortion.
training or maintenance. There is also                        overreliance on technology – even
potential for disruption and delays to                        down to crew members being on their               Security threats evolve and
voyages if there is a lack of compliant,                      phones when a loss event occurs. A                challenge: Political risk remains
compatible fuel at a bunker port.                             generation of seafarers has grown                 heightened around the globe and
                                                              up trusting what they see on a screen             increasingly poses a threat to shipping,
Unpredictable climate brings new                              but it is crucial that crew continue              trade and supply chains through
loss scenarios: The shipping industry                         to have appropriate training and                  conflicts, territorial disputes, cyber-
is no stranger to extreme weather                             develop a solid understanding of the              attacks, sanctions and, of course,
which remains a factor in many                                fundamentals of sound navigation                  piracy. Piracy incidents increased over
accidents. The changing climate is                            and situational awareness.                        the past year, with Nigeria replacing
opening up potential new shipping                                                                               Indonesia as the top global hotspot.
routes in previously hard-to-access                           Automation, crewless ships and the                Nigeria, specifically Lagos, is also the
areas such as the Arctic, which brings                        bottom line: Progress continues to be             location of the highest reported number
concerns about the rescue and                                 made in the area of autonomous                    of stowaway incidents – a long running
salvage challenges an incident                                shipping, particularly in coastal waters          problem for ship owners, which is now
involving a large vessel in a remote                          and with smaller vessels and it is                also challenging commercial vessels,
location would bring, as well as the                          anticipated that such developments                driven by the ongoing migrant crisis.
potential environmental impact. There                         will improve shipping safety. While               Stowaways and migrant rescues at
were 46 reported shipping incidents in                        there will be incidences where                    sea can have serious consequences
Arctic Circle waters during 2018. At the                      technology and automation will                    for ship owners, causing delays and
same time, changing weather patterns                          remove crew from hazard, innovation               diversions and putting crew members
have led to grounding and collision                           should not be driven primarily by                 under pressure, while repatriation is a
incidents in the US from unseasonal                           efficiency and accounting. As ongoing             complex procedure.
high waters following heavy summer                            issues with large container ships and
rains, while record low water levels in                       fires and misdeclared cargo show –
Europe on the Rhine and Elbe have                             innovation and technology is not a
brought supply chain disruption.                              panacea if the root cause of incidents

Trusting technology: The growing
                                                              and losses is not addressed.                                            174
use of connected technology in the                            Identifying cyber exposures:
maritime sector is a positive for safety                      Technological advances also means
and claims. Electronic navigation                             cyber losses will be an increasing
tools, ship-to-shore communications                           feature of marine claims going forward.                             reported fire
                                                                                                                                incidents in 2018
                                                                                                                                                            7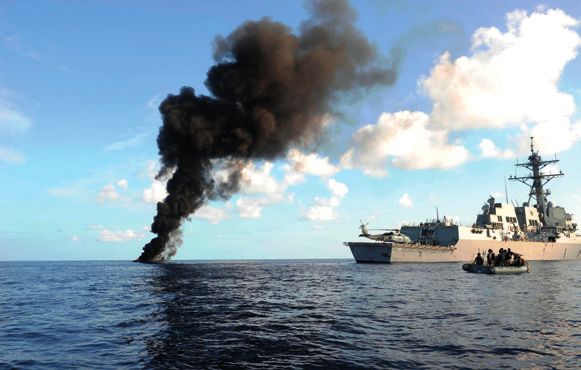
Allianz Global Corporate & Specialty
LOSSES IN FOCUS The analysis over the following pages
covers both total losses and casualties/
incidents. See page 48 for further details
TOTAL LOSSES BY TOP 10 REGIONS
2009-2018 AND 2018
46 total losses in 2018
Russian Arctic and
Bering Sea
77 26
117
4
British Isles, N. Sea, 153
Eng. Channel and
Bay of Biscay Baltic
234 3
2 39
North
Atlantic Japan, Korea and
6 58 North China
West Mediterranean
East Mediterranean
3 and Black Sea 2
West
2 12
Red Sea 28
Indies Arabian Gulf
226 46 and approaches 2 S. China, Indochina,
Indonesia and Philippines
32
Bay of
Bengal
East African Coast
West African Coast
2
8 South
Pacific
All other regions
Total Losses by region: 2009 - 2018
1,036 total losses between Total Losses by region: 2018
2009 and 2018
Source: Lloyd’s List Intelligence Casualty Statistics
Data Analysis & Graphic: Allianz Global Corporate & Specialty
TOTAL LOSSES BY YEAR
LOWEST THIS CENTURY
Annual shipping losses have fallen by more than 65% over the past decade – from 132 in 2009 to 46 in
2018 and are now at their lowest level this century. There were 207 total losses reported in 2000 alone.
150
132
129 127
120 111
99 106
99 98
89
90
60
46
30
0
2009 2010 2011 2012 2013 2014 2015 2016 2017 2018
Source: Lloyd’s List Intelligence Casualty Statistics
Vessels over 100GT only Data Analysis & Graphic: Allianz Global Corporate & Specialty
8
Safety and Shipping Review 2019

                                                                                                                                   2018 REVIEW
                                            TOTAL LOSSES BY TOP 10 REGIONS
2018: The database shows 46 total           FROM JANUARY 1, 2018 TO DECEMBER 31, 2018
losses of vessels over 100GT during
2018 around the world. This compares         Region                                                        Loss Total     Year-on-year change

with 98 during 2017 – a significant          S. China, Indochina, Indonesia and Philippines                      12                 ↓ 17
decline of more than 50%. South              East Mediterranean and Black Sea                                     6                 ↓ 13
China, Indochina, Indonesia and              British Isles, N. Sea, Eng. Channel and Bay of Biscay                4                  ↓4
Philippines remains the top region for       Japan, Korea and North China                                         3                  ↓3
total losses. A quarter (26%) of losses      West Indies                                                          3                  ↑1
occurred here, although the total of
                                             Arabian Gulf and approaches                                          2                  ↓5
12 also represents a significant
                                             Bay of Bengal                                                        2                   =
decline (29 in 2017) – the first time the
                                             North Atlantic                                                       2                  ↑2
region has seen a fall in losses in four
years. Globally, the number of               Red Sea                                                              2                  ↑2

weather-related total losses halved          South Pacific                                                        2                  ↓1
year-on-year from more than 20 in            Other                                                                8
2017 to 10 in 2018.                          Total                                                               46                 ↓ 52

                                            Vessels over 100GT only                                         Source: Lloyd’s List Intelligence Casualty Statistics
                                                                                                Data Analysis & Graphic: Allianz Global Corporate & Specialty

                                                                                                                      2009 – 2018 REVIEW
                                            TOTAL LOSSES BY TOP 10 REGIONS
                                            FROM JANUARY 1, 2009 TO DECEMBER 31, 2018
All figures are based on reported total
losses as of April 1, 2019. 2018 total       Region                                                        Total Loss

losses may increase slightly in future       S. China, Indochina, Indonesia and Philippines                     234
as, based on previous years’                 East Mediterranean and Black Sea                                   153
experience, developments in losses           Japan, Korea and North China                                       117
lead to a number of total losses being       British Isles, N. Sea, Eng. Channel and Bay of Biscay               77
confirmed after year-end. The                Arabian Gulf and approaches                                         58
average variance over the past nine
                                             West African Coast                                                  46
years has been an increase of fewer
                                             West Mediterranean                                                  39
than two total losses per year.
                                             East African Coast                                                  32
However, in some years this can
increase, with up to four additional         Bay of Bengal                                                       28

losses being notified for one year.          Russian Arctic and Bering Sea                                       26
                                             Other                                                              226
                                             Total                                                            1,036

                                            Vessels over 100GT only                                         Source: Lloyd’s List Intelligence Casualty Statistics
                                                                                                Data Analysis & Graphic: Allianz Global Corporate & Specialty

                                            2009 to 2018: The 2018 loss year (46) represents a significant
                                            improvement on the rolling 10-year loss average (104) – down 55%.
                                            South China, Indochina, Indonesia and Philippines (234 total losses)
                                            has been the top loss hotspot since the turn of the century, followed
                                            by the East Mediterranean and Black Sea (153) and Japan, Korea
                                            and North China (117).

                                            Together, the top 10 maritime regions account for three in four (78%)
                                            of all losses over the past 10 years. There have been 1,036 reported
                                            total losses of vessels over 100GT in the past decade.

                                                                                                                                                               9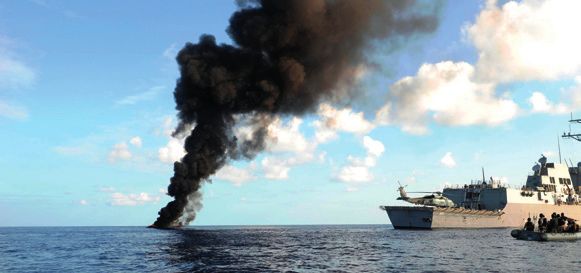
MAJOR LOSSES: 2018
     LARGEST SHIPS LOST
     10 LARGEST VESSELS LOST FROM JANUARY 1, 2018 TO DECEMBER 31, 2018
     (showing approximate location of loss and type of vessel)

                                                                           BERRA G

                                                                                                                    SANCHI

                                                                                      SSL KOLKATA

                                                                                                                                     SHINE LUCK

                                     AUTOEXPRESS 2

                                                             SHAHIN
                                                                                                                                         CANCI
           BULK                                                                                                                        LADJONI 3
           CARGO                                                                     RAYSUT II
           CHEMICAL/PRODUCT
           CONTAINER
           DREDGER                                                                                       JBB RONG
                                                     SHENG MING                                           CHANG 8
           PASSENGER
           RORO
           TANKER

                                                 Vessels over 100GT only                           Source: Lloyd’s List Intelligence Casualty Statistics
                                                                                       Data Analysis & Graphic: Allianz Global Corporate & Specialty

     “Today’s record low loss activity is the culmination of a number of initiatives,
       regulatory responses and innovations, such as improved ship design and more
       robust safety management systems on vessels. At the same time, we are also
       seeing an improvement in the insurance environment with positive signs in the
       hull market, driven by lower claims activity and technical underwriting.
     “However, the lack of an overall fall in shipping incidents, as well as heightened
       political risks to vessel security and compliance with emissions rules in 2020 bring
       new challenges.”
                                                                                                            Baptiste Ossena
                                                                              Global Product Leader, Hull & Marine Liabilities,
                                                                                        Allianz Global Corporate & Specialty

10
Safety and Shipping Review 2019
LARGEST SHIPS LOST
SANCHI
January 6, 2018: In collision with bulker CF Crystal
around 160 nautical miles east of mouth of Yangtze River,
China. Severe fire, listing, oil spillage. Sank January 14.
85,462GT TANKER Six of the largest
vessels lost
SHENG MING occurred in Asia
and Middle East
April 25, 2018: 12 miles off Cape Town with a partially
flooded engine-room. Under tow. Reported sank May 28.
38,403GT BULK
RAYSUT II
May 26, 2018: Grounded at Fazayah Beach,
18 miles west of Salalah, Oman.
10,880GT BULK
Foundered was the
SSL KOLKATA cause of loss for
June 13 2018: Vessel caught fire following an explosion en five of the 10
route from Visakhapatnam to Kolkata, India. Grounded. largest vessels lost
9,956GT CONTAINER
JBB RONG CHANG 8
March 21, 2018: Capsized in the waters off
Parit Jawa, Malaysia.
6,200GT DREDGER
AUTOEXPRESS 2 Sanchi was the
August 6, 2018: Sank in the port of Guanta, largest vessel lost in
Venezuela, due to water ingress. 2018
5,419GT PASSENGER
SHAHIN
April 10, 2018: Sank off Port Sudan. Vessel had been under
arrest by Port Sudan civil court for a considerable period.
4,759GT RORO
SHINE LUCK
June 14, 2018: Ran aground off Kaohsiung port, Taiwan,
due to bad weather.
3,274GT CHEMICAL/PRODUCT
BERRA G
January 19, 2018: Dragged its anchor due to weather
conditions, drifted and ran aground at Eregli, Turkey.
2,995GT CARGO
CANCI LADJONI 3
January 27, 2018: Sank off Selayar Island,
South Sulawesi province, Indonesia.
2,076GT CARGO
11Allianz Global Corporate & Specialty
TOTAL LOSSES BY TYPE OF VESSEL
2009 - 2018 Cargo vessels account for over 40% of
total losses over the past decade.
TOP 5 VESSEL TYPES LOST
80
70
Cargo
60
Fishery 50
40
Bulk
30
20
Passenger
10
Chemical/Product
2009 2010 2011 2012 2013 2014 2015 2016 2017 2018
TOTAL LOSSES BY TYPE OF VESSEL: 2009-2018
2009 2010 2011 2012 2013 2014 2015 2016 2017 2018 TOTAL
Cargo 52 62 38 62 40 31 40 34 55 15 429
Fishery 29 21 14 12 13 15 16 10 8 11 149
Bulk 10 11 14 11 15 5 13 5 7 2 93
Cargo, fishing, bulk, Passenger 5 3 7 7 8 10 7 11 6 3 67
passenger and chemical/ Chemical/Product 11 6 4 8 10 2 3 7 4 1 56
product are the vessel
Tug 5 7 2 6 7 7 6 7 5 4 56
types that have seen the
most total losses over the Container 4 5 3 7 4 4 5 5 3 1 41
past decade, accounting Ro-ro 6 1 3 5 2 5 6 9 1 38
for 75%+ of all cases.
Supply/Offshore 3 2 2 3 2 3 3 2 2 1 23
Tanker 2 4 4 1 1 2 3 17
Dredger 2 2 1 1 1 1 3 2 13
Barge 1 3 1 3 1 2 11
LPG 1 1 1 1 1 5
Unknown 1 2 1 4
Other 5 3 5 3 6 4 4 3 1 34
Total 132 129 99 127 111 89 106 99 98 46 1,036
Source: Lloyd’s List Intelligence Casualty Statistics
Vessels over 100GT only Data Analysis & Graphic: Allianz Global Corporate & Specialty
12Safety and Shipping Review 2019
Cargo vessels accounted for a third of
all total losses during 2018, driven by
activity in the South East Asia, Japan,
Korea and China and Mediterranean
regions in particular. However, loss
activity involving these vessels was 2018 REVIEW
significantly down year-on-year – by
over 70%. TOTAL LOSSES BY TYPE OF VESSEL
JANUARY 1, 2018 TO DECEMBER 31, 2018
Cargo Cargo 15 15
FisheryFishery 8 11
Tug 3
Tug 4
Barge 2
Passenger 3
Bulk 2
Tanker
Passenger 2 3
TankerBarge 2 2
Container
Bulk 1 2
DredgerDredger 1 2
Roro Chemical/Product 1 1
Supply/Offshore
Container 1 1
Roro 1
Supply/Offshore 1
Total 46
Vessels over 100GT only Source: Lloyd’s List Intelligence Casualty Statistics
Data Analysis & Graphic: Allianz Global Corporate & Specialty
Fishing vessel loss activity increased year-on-
year with 11 total losses reported. Passenger
ship total loss activity declined year-on-year.
13Allianz Global Corporate & Specialty
TOTAL LOSSES BY CAUSE
2009 - 2018 Foundered (sunk/submerged), wrecked/stranded, fire/
explosion, machinery damage and collision are the most
frequent causes of total losses over the past decade,
accounting for over 90% of all reported cases.
TOP 5 CAUSES OF LOSS
80
70
Foundered
60
Wrecked/stranded 50
40
Fire/explosion
30
20
Machinery
damage/failure
10
Collision
2009 2010 2011 2012 2013 2014 2015 2016 2017 2018
ALL CAUSES OF TOTAL LOSS: 2009 - 2018
2009 2010 2011 2012 2013 2014 2015 2016 2017 2018 TOTAL
Foundered (sunk) 62 64 46 55 70 50 66 48 60 30 551
Wrecked/stranded (grounded) 24 25 29 27 21 18 20 20 15 9 208
Fire/explosion 14 12 9 14 15 6 9 12 8 4 103
Machinery damage/failure 7 4 6 15 1 5 2 10 9 1 60
Collision (involving vessels) 13 10 3 5 2 2 7 2 1 1 46
Hull damage (holed, cracks etc.) 8 5 3 7 1 5 2 4 5 1 41
Miscellaneous 2 6 2 2 1 2 1 16
Contact (e.g harbor wall) 1 2 1 4
Piracy 1 2 1 4
Missing/overdue 1 2 3
Total 132 129 99 127 111 89 106 99 98 46 1,036
Source: Lloyd’s List Intelligence Casualty Statistics
Vessels over 100GT only Data Analysis & Graphic: Allianz Global Corporate & Specialty
14Safety and Shipping Review 2019
Foundered (sunk/submerged) has
been the cause of over half of all total
losses (53%) over the past decade. In
2018 it was the primary cause of more
than 65% of losses around the world.
Analysis of more than 230,000 marine
insurance industry claims with a value 2018 REVIEW
of €8.8bn ($9.9bn) between July 2013
and July 2018 by AGCS shows that CAUSES OF TOTAL LOSS
ship sinking/collision incidents are the JANUARY 1, 2018 TO DECEMBER 31, 2018
most expensive cause of loss for
insurers, accounting for 16% of the
Cargo 53%
value of all claims – equivalent to
€1.39bn/$1.56bn. Fishery 8%
Bulk 7%
Passenger 5%
Tug 5%
Chemical/Product 4%
Container 3%
Foundered (sunk)
Dredger 3% 30
Supply/Offshore
Wrecked/stranded (grounded) 2% 9
TankerFire/explosion 2% 4
Barge Hull damage (holed, cracks etc.)1% 1
Other Machinery damage/failure 1% 1
Collision (involving vessels) 1
Total 46
Vessels over 100GT only Source: Lloyd’s List Intelligence Casualty Statistics
Data Analysis & Graphic: Allianz Global Corporate & Specialty
15Allianz Global Corporate & Specialty
TOTAL LOSSES IN ALL REGIONS: 2018
This map shows the approximate locations of all 46 reported total losses during 2018.
1
Russian Arctic
and Bering Sea
4
British Isles, N. Sea,
Eng. Channel and 3
Bay of Biscay
6 12
2 2 Japan, Korea and
North China
1 North
Atlantic West Mediterranean East Mediterranean and Black Sea
United States
Eastern Seaboard 2
2 S. China, Indochina,
3 Indonesia and Philippines
2 Arabian Gulf
Red Sea
West Indies and approaches 2
South Pacific
2 Bay of
Bengal
West African Coast
1
South American
West Coast
1
TOTAL
46 S. Atlantic and
East Coast S. America
Regional loss rankings Losses % Share
1 South China, Indochina, Indonesia and Philippines 12 26%
2 East Mediterranean and Black Sea 6 13%
3 British Isles, North Sea, English Channel and Bay of Biscay 4 9%
Japan, Korea and North China 3 7%
4
West Indies 3 7%
Arabian Gulf and approaches 2 4%
Bay of Bengal 2 4%
North Atlantic 2 4%
5 Red Sea 2 4%
South Pacific 2 4%
West African Coast 2 4%
West Mediterranean 2 4%
Russian Arctic and Bering Sea 1 2%
South American West Coast 1 2%
6
10 South Atlantic and East Coast South America
United States Eastern Seaboard
1
1
2%
2%
Vessels over 100GT only
losses from
bad weather Source: Lloyd’s List Intelligence Casualty Statistics
Data Analysis & Graphic: Allianz Global Corporate & Specialty
16Safety and Shipping Review 2019
2018 REVIEW
2018: While the number of total losses ALL CASUALTIES INCLUDING TOTAL LOSSES: 2018
has declined significantly over the past TOP 10 REGIONS
year, the number of shipping casualties
or incidents has remained stable. The Region Casualty Total Year-on-year change
East Mediterranean and Black Sea is East Mediterranean and Black Sea 544 ↑ 81
the top incident hotspot, accounting British Isles, N. Sea, Eng. Channel and Bay of Biscay 494 ↑ 65
for one in five incidents globally. S. China, Indochina, Indonesia and Philippines 231 ↓ 31
Activity is up in the region, driven by Great Lakes 194 ↑ 49
machinery damage/failure incidents. Baltic 163 ↑1
Japan, Korea and North China 115 ↓ 28
Machinery damage/failure was the
West African Coast 111 ↑ 16
top cause of incidents over the past
Iceland and Northern Norway 107 ↑6
year (1,079) accounting for 40%. Fire
and explosion activity increased West Mediterranean 103 ↓ 21
during 2018 with 174 reported North American West Coast 102 ↓ 12
incidents. Other 534
Total 2,698 ↓ 15
Including 46 total losses Source: Lloyd’s List Intelligence Casualty Statistics
Data Analysis & Graphic: Allianz Global Corporate & Specialty
Vessels over 100GT only
2009 - 2018 REVIEW
TOP CAUSES OF SHIPPING ALL CASUALTIES INCLUDING TOTAL LOSSES: 2009 - 2018
CASUALTIES/INCIDENTS 2018 TOP 10 REGIONS
Region Total
East Mediterranean and Black Sea 4,757
British Isles, N. Sea, Eng. Channel and Bay of Biscay 4,099
S. China, Indochina, Indonesia and Philippines 2,348
Baltic 1,621
Japan, Korea and North China 1,522
Great Lakes 1,330
Iceland and Northern Norway 1,089
West Mediterranean 950
North American West Coast 910
West African Coast 770
Other 6,626
Total 26,022
Including 1,036 total losses Source: Lloyd’s List Intelligence Casualty Statistics
Data Analysis & Graphic: Allianz Global Corporate & Specialty
Vessels over 100GT only
Machinery damage/failure 1,079
Collision 319
Wrecked/stranded (grounded) 315 2009-2018: The East Mediterranean and Black Sea region is also the
Contact (e.g. harbor wall) 208
location with the most shipping incidents over the past decade
(4,757), accounting for 18%.
Fire/explosion 174
Other 603 Of the 26,022 reported incidents over the past decade, more than a
third (8,862) was caused by machinery damage or failure – over
2,698 incidents in total including 46 total losses twice as many as the next highest cause of incident, collision (3,648).
The number of machinery damage incidents have increased by a
Vessels over 100GT only
third over the past decade.
Source: Lloyd’s List Intelligence Casualty Statistics
Data Analysis & Graphic: Allianz Global Corporate & Specialty
17Allianz Global Corporate & Specialty
INCIDENTS IN ARCTIC CIRCLE WATERS
ALL CAUSES OF CASUALTIES/INCIDENTS: 2009 - 2018
There have been 522 2009 2010 2011 2012 2013 2014 2015 2016 2017 2018 TOTAL
shipping incidents reported
in Arctic Circle waters over Machinery damage/failure 14 16 12 13 20 27 45 32 46 24 249
the past decade. Driven by Wrecked/stranded (grounded) 14 9 9 8 10 14 6 11 9 8 98
the harsh operating
Collision (involving vessels) 4 10 4 4 2 3 2 4 2 35
environment, machinery
damage/failure is the most Fire/explosion 2 6 6 1 4 2 4 1 3 6 35
frequent cause of incidents, Contact (e.g. harbor wall) 2 4 1 3 6 4 5 1 1 1 28
accounting for almost half
of all cases (47%). Hull damage (holed, cracks etc.) 6 2 2 1 2 1 1 2 2 19
Foundered (sunk) 2 3 1 1 2 1 1 11
Labor dispute 1 1
Miscellaneous 4 4 2 6 5 5 6 4 6 4 46
Total 48 51 39 37 50 55 70 55 71 46 522
Including 15 total losses
Source: Lloyd’s List Intelligence Casualty Statistics
Vessels over 100GT only Data Analysis & Graphic: Allianz Global Corporate & Specialty
2018 REVIEW
CAUSES OF CASUALTIES/INCIDENTS 2018
Cargo 53%
Fishery 8%
Bulk 7%
Machinery damage/failure 5%24
Passenger
Tug Wrecked/stranded (grounded) 5% 8
Chemical/Product
Fire/explosion 4% 6
Container
Miscellaneous
3% 4
Dredger 3%
Collision (involving vessels) 2
Supply/Offshore 2%
Contact (e.g. harbor wall) 1
Tanker 2%
Foundered (sunk) 1
Barge 1%
Total 46
Other 1%
DOWN 25 YEAR-ON-YEAR
Source: Lloyd’s List Intelligence Casualty Statistics
Data Analysis & Graphic: Allianz Global Corporate & Specialty
Vessels over 100GT only
Analysis shows there were 46 reported shipping
incidents in Arctic Circle waters during 2018 – down 35%
with no reported total losses. Machinery damage/
failure was behind more than 50% of incidents.
18Safety and Shipping Review 2019
ALL AT SEA
Ahoy there! The most incident-prone vessel
Three vessels shared this unwanted accolade in 2018 – all of them passenger
ferry services operating to and from Greek Islands. The three ferries were all
involved in eight separate incidents over the year, with one vessel operating in
the Aegean Islands involved in eight incidents in just five months. Machinery
damage/failure was the cause of seven of these incidents; the vessel was also
grounded as it approached port.
Watch out on Wednesday
Wednesday is the most frequent day for shipping losses over the past decade
WED (169) with Saturday (130) the safest day at sea. Twelve, or more than a quarter,
of 2018’s 46 total losses occurred on a Wednesday.
WED
Beware the start – and the end – of the year
WED
January is the busiest month for shipping losses around the world with 117
reported over the past decade, including nine in 2018. Bad weather is often a
factor. December is the second busiest month for losses (104) with one loss
even reported on Christmas Day in 2018.
SWAT teams, swimming pools and sharks –
strange days at sea
WED
Over the past decade there have been many different causes of incidents and
losses on board all kinds of vessels. Here are five of the most unusual:
– A chemical/product tanker had to be boarded by a SWAT team of police
marksman off Lisbon, Portugal after a mutiny by crew over loading and
offloading duties. The vessel eventually sailed two days later
– A passenger ferry operating in South Korea had to be towed back to port
by the coast guard after colliding with a whale. The vessel was later
declared a total loss, as repairs were deemed too expensive
– A passenger ship en route to Hamburg from Rotterdam had to be diverted
towards Helgoland after it encountered rough seas in the North Sea and
water from its swimming pools flooded restaurant areas.
– Seven of the 15 member crew of a chemical/product tanker went on
hunger strike after a salary dispute at Ajman port in the United Arab
Emirates, delaying the vessel by more than week.
And finally…
– A total of 893 kilos of cocaine was found on board a container ship
concealed in frozen sharks while the vessel was off Yucatan in Mexico.
19Allianz Global Corporate & Specialty
LOSS TRENDS
LARGER VESSELS BRING
BIGGER LOSSES
Insurers have been warning for years that the increasing
size of vessels is leading to a higher accumulation of risk.
These fears are now being realized, potentially offsetting
improvements in safety and risk management.
Over the past 50 years container ships have increased in “While we have seen total losses reduce over the past decade,
capacity by almost 1,500%, although many of the risk the benefits are being largely offset by the increased cost of
concerns with them are also applicable to cruise ships, car losses for large vessels. The cost of casualties or incidents is
carriers and other large vessels. In many respects, such rising, with an increase in severity, and this is down to the
vessels are safer and the frequency of shipping losses increasing size of vessels. Such ships generate economies
overall has steadily declined over the past decade. of scale for ship owners but also increased risk, and a
However, the cost of incidents has been increasing, driven disproportionately greater cost when things go wrong.”
in large part by the cost of claims involving large vessels.
For example, data from the Nordic Association of Marine Fires on board large container vessels are now a regular
Insurers (Cefor) has previously shown that the most costly occurrence – there were two in January 2019 alone,
1% of all claims account for at least 30% of the value of following a number of other incidents – and continue to be
total claims in any given year1 . a major concern (see page 22). In addition, the car carrier
Sincerity Ace caught fire in the North Pacific on December
Larger vessels mean far greater accumulations of risks and 31, 2018, the latest large vessel of this type to do so, while
therefore larger values and exposures, both on board Ro-ro cargo ship, the Grande America sank on March 12,
vessels and in ports. Dealing with incidents involving large 2019 after its cargo of vehicles and containers caught fire.
ships, such as fires, groundings and collisions, are also On average, insurers see around two major losses
becoming more complex and expensive. involving car carriers each year.
Ultra large container ships (ULCS) are of particular concern Such incidents can easily result in large claims in the
following a number of fire and explosion incidents, but hundreds of millions of dollars, if not more. A hypothetical
also groundings and collisions. Such vessels, the largest of worse-case loss scenario involving the collision and
which can carry 20,000+ teu (20-foot equivalent unit) grounding of two large container vessels, or a container
containers, require ports with appropriate specialist vessel and a cruise ship, could result in a $4bn loss when
infrastructure to unload cargo or carry out repairs. the costs of salvage, wreck removal and environmental
claims are included, according to AGCS. Potentially, one
“Insurers such as AGCS have been warning for years that insurer could find they have insured more than one vessel
the increasing size of vessels is leading to a higher involved in the same incident, with exposure to hull,
accumulation of risk,” explains Captain Rahul Khanna, machinery breakdown and cargo losses.
Global Head of Marine Risk Consulting at AGCS. “These
fears are now being realized, as demonstrated by the “The size of a vessel can significantly increase salvage and
growing number, and cost, of incidents with ULCS. general average costs. ULCS require specialist tugs and
finding a port of refuge with capacity to handle such a large
ship can be difficult, which increases the salvage operation
1 I nternational Union of Marine Insurance, Global Premiums Up By 2% But costs,” explains Régis Broudin, Global Head of Marine
Challenges Remain For Marine Underwriting, says IUMI, September 2018
201996 Regina Maersk 6,400 teu
1997 Susan Maersk 8,000+ teu
Safety and Shipping Review 2019
2002 Charlotte Maersk 8,890 teu
2003 Anna Maersk 9,000+ teu
50 YEARS OF CONTAINER SHIP GROWTH Container-carrying capacity has increased
2005 Gjertrud
by around 1,500% Maersk
since10,000+
1968teu
and has
almost doubled over the past decade
1968 Encounter Bay 1,530 teu 2006
Emma Maersk 11,000+ teu
1972 Hamburg Express 2,950 teu
1980 Neptune Garnet 4,100 teu
2012
1984 American New York 4,600 teu Marco Polo (CMA CGM) 16,000+ teu
1996 Regina Maersk 6,400 teu
2013
Maersk Mc-Kinney Møller 18,270 teu
1997 Susan Maersk 8,000+ teu
2002 Charlotte Maersk 8,890 teu 2015
MSC Oscar 19,000+ teu
2003 Anna Maersk 9,000+ teu
2017
OOCL Hong Kong 21,413 teu
2005 Gjertrud Maersk 10,000+ teu
2019
2006 24,000 teu
Emma Maersk 11,000+ teu ?
2012
Approximate ship capacity data: Container-transportation.com; AGCS Source: Allianz Global Corporate & Specialty (AGCS)
Marco Polo (CMA CGM) 16,000+ teu
2013
Maersk Mc-Kinney Møller 18,270 teu
Claims
2015 at AGCS. “For example, in the
MSC Oscar 19,000+ teu
“It is very clear that in some shipping
What is general average?
case of the Maersk Honam container segments, loss prevention measures
ship which caught fire at sea in March have not kept pace with the upscaling In event of a loss where cargo is
2017
2018, salvage and general average
OOCL Hong Kong 21,413 teuof vessels,” says Chris Turberville, impacted or expenses incurred, the loss
represented close to 60% of the cargo Head of Marine Hull & Liabilities, is shared proportionately by all parties
with a financial interest.
value. A high contribution has also been UK, AGCS. “This is something that
2019
requested
?
for the Yantian Express,
24,000 teu needs to be addressed from the
container vessel which suffered a fire design stage onwards.”
on board in January 2019.”
Following a number of incidents in HOW A $4BN LOSS SCENARIO COULD OCCUR
recent years, the shipping industry The increasing size of vessels has raised fears about the potential for higher
should question whether it is running losses if a major casualty does occur, particularly one involving two large
acceptable levels of risk for large vessels, such as a cruise ship and a container ship, for example. There are
vessels, according to Captain Andrew many factors to consider when evaluating the potential costs from such an
Kinsey, Senior Marine Risk incident. Below, we consider a worst case scenario casualty involving a
Consultant at AGCS. collision, followed by grounding of both vessels and pollution, in an
environmentally-sensitive location. In this scenario both vessels are then
“There is a push for efficiency and deemed constructive total losses. The potential exposure could be:
scale in the shipping industry but this
should not be allowed to give rise to VESSEL A (CRUISE SHIP) VESSEL B (CONTAINER SHIP)
unacceptable levels of risk,” says Wreck Removal Wreck Removal
Kinsey. (including Site Remediation) $1.25bn $1.25bn (including Site Remediation)
Passenger & $100mn Cargo Liabilities
$200mn
“We continue to see the normalization Crew Liabilities
of risk in the shipping industry. There Bunker Removal/
$100mn
have been welcome technical Bunker Removal/ $100mn
Oil Pollution
Oil Pollution
advances in shipping but we do not
$500mn Liability for Property
yet see a commensurate safer Damage to Cruise Ship
environment. There is now much talk Litigation Costs $100mn
of automation and autonomous $100mn Litigation Costs
vessels and how this will be safer. But Liability for Property $100mn Total loss
in truth, innovation will be driven by Damage to Container Ship
amount
$25mn Crew Liabilities
the bottom line.” $4bn This does not take into account potential limitation funds
approx. and any cross liability calculation and possible offset.
21Allianz Global Corporate & Specialty
Fighting fire on board the Maersk Honam. It was several weeks
before the vessel could be towed to a suitable port of refuge.
Photo: Indian Coast Guard (GODL-India).
In January 2019, the Hapag-Lloyd Yantian Express caught recent years and, sadly, this has proven correct. This is a
fire as the 7,510 teu container ship transited off Canada’s serious and concerning trend. While there have been
eastern seaboard. Just weeks later, as the fire was finally discussions within the shipping industry, we have yet to see
being extinguished on this vessel, fire broke out on a concrete steps to tackle this risk as yet.”
second container ship APL Vancouver off Vung Ro,
Vietnam. The two incidents are the latest in a series of ULCS pose a number of challenges, including the
container ship cargo fires in recent years, which have firefighting capabilities of vessels and the complexity of
included the Maersk Honam in 2018, MSC Daniela in salvage. Fires break out in containers relatively frequently
2017 and CCNI Arauco in 2016. – logistics insurer, TT Club says there is a fire every 60 days
– yet firefighting capabilities have not kept up with the
Insurers such as Allianz and the International Union of upsizing of container vessels.
Marine Insurance (IUMI) have previously warned of safety
concerns surrounding large container vessels, promoting “It should be the industry standard that any vessel, including a
improved ship design and fire-fighting equipment to ULCS, should have the capability built into its design to tackle
prevent and extinguish fires. most on board fires themselves,” says Chris Turberville,
Head of Marine Hull & Liabilities, UK, AGCS. “It is very
“Fire on board ultra large container ships (ULCS) is our clear that this is not currently the case and they require
biggest concern right now,” explains Captain Rahul considerable outside assistance to control a blaze; often by
Khanna, Global Head of Marine Risk Consulting at which time significant damage has been done to the vessel.
AGCS. “Insurers have highlighted this as a growing risk in This also significantly increases the possible salvage claim.”
22Safety and Shipping Review 2019
CONTAINER
SHIP FIRE ISSUE
CONTINUES
TO BURN
Fires and explosions on board such
vessels continue to generate large losses
with an incident occurring every 60 days
on average. What can be done?
Improving the firefighting capabilities of first place. There is clearly a problem
ULCS is critical, but equally challenging with both misdeclared, and incorrect
is the problem of misdeclared cargo packaging of, cargo. Regulations and
(see page 24), which is thought to be
the root cause of a number of fires.
guidelines for dangerous cargo exist,
but they are not being adequately
1,500%
increase in container-
Estimates show the majority (66%) of enforced and adhered to.” carrying capacity on
cargo damage across freight modes, board in 50 years
including container fires, is A container ship fire has yet to result in
attributable to poor packing and a total loss, but incidents in recent
labeling of dangerous materials1 . years have generated some large
losses. It was several weeks before the
Prevention should be a priority for ship Maersk Honam could be towed to a
owners, according to Captain Andrew suitable port of refuge after its fire on
Kinsey, Senior Marine Risk board and this incident is expected to
Consultant at AGCS. “The size of result in one of the largest general
large container ships and their design average claims on record. However, a
is a factor, but the focus should be on total loss of a ship this size could have
preventing fires from starting in the exceeded $1bn.
1 T T Club, Campaign For Greater Container Safety Must Focus First On Dangerous Goods, March 2019
23Allianz Global Corporate & Specialty
MISDECLARATION OF
CARGO INCREASING
RISK ON BOARD
A growing number and array of goods are being
transported by sea and in containers, including electronics
and, increasingly, chemical products. However, dangerous
goods are not always properly declared, which can have
dire consequences given larger vessel sizes.
The growing number of cargo fire incidents at sea – notably to avoid the additional costs and requirements
including at least three in two months at the start of 2019 associated with transporting certain cargos.
– is an obvious cause of concern for the shipping industry, Cargo is handled and stowed according to its declared
prompting questions about what may be behind them. contents and weight, and misdeclaration can have dire
Previous safety issues, such as improper packing, loading, consequences. For example, cargo that carries a risk of
labeling and shipping of hazardous cargoes are in the explosion must be stowed well away from crew
spotlight once again. accommodation, while heat sensitive cargo must be kept
away from hot areas like fuel bunkers and engines.
“With several major incidents in a matter of months, fires on
board container ships – potentially coming from misdeclared Preventing cargo fires saves lives and property at sea, says
cargo – are a hot topic, ” says Régis Broudin, Global Head Volker Dierks, Head of Marine Underwriting, Central and
of Marine Claims at AGCS. “The large size and capacity of Eastern Europe at AGCS. “Increasingly, more goods are
container ships today increases the risk of cargo containerized, and many more substances will be transported
misdeclaration and therefore of something going wrong. on container ships in the future. Yet it is not always
understood about the risks that certain circumstances pose
“Misdeclared cargo can happen on mega container ships (for example, incorrect stowage or temperature).”
by virtue of their sheer volume. The greater the number of
containers stowed, the more chance there is of a mistake, Given the threat posed by container fires, a number of
such as storing dangerous cargo close to a hot spot like the shipping companies have taken steps to address
engine. Meanwhile, the size of the vessel can make it harder misdeclared cargo. Maersk, for example, has instituted a
to access a fire and impede attempts to extinguish it.” policy of not loading hazardous cargo adjacent to living
spaces. It also recently announced that it will now work
The International Cargo Handling Coordination with the US National Cargo Bureau 2 to carry out random
Association has estimated that some six million containers checks of containers while Hapag-Lloyd 3 is using software
contain dangerous goods, and nearly 1.3 million of those to scan bookings to detect undeclared dangerous cargo
boxes aren’t properly packed or are incorrectly identified, that require a deeper investigation. Between 2015 and
according to logistics insurer TT Club1 . Containerized 2017, Hapag-Lloyd identified some 11,000 incorrectly
shipments are misdeclared for a variety of reasons, most declared shipments.
24Safety and Shipping Review 2019
A number of shipping companies already share
information from cargo inspections via the Cargo Incident
Notification System (CINS), which alerts ship owners to
potential misdeclared cargo, prompting additional checks
or a ban. In October 2018, CINS also proposed a common
cargo scanning system that would help shippers search for
bookings that may contain undeclared or misdeclared
dangerous goods 4 .
“I could imagine that the insurance industry would support
any shipping industry initiative that brings increased Misdeclaration of cargo is thought to be the root
transparency on parties that misdeclared cargo,” says cause of a number of fires on board vessels.
Justus Heinrich, Chief Underwriter Marine Hull, Photo: Adobe Stock
Central and Eastern Europe, AGCS.
“One practical solution would be a blacklist of freight
forwarders that misdeclare cargo. Obviously, some
operators already do this, but to gain momentum and
market acceptance more need to get on board.
“As part of the risk assessment, underwriters would be able
to ask a ship owner if they are a member of such a
platform. Being part of such an initiative would
6mn
estimated number
demonstrate that a ship owner is aware of the problem of containers with
and willing to take action to deal with misdeclared cargo.” dangerous goods
1 T T Club, Campaign For Greater Container Safety Must Focus First On Dangerous Goods, March 2019
2 M aersk, Physical Container Inspection Pilot, January 2019
3 H apag-Lloyd, Cargo Patrol – Cargo Protection Reimagined
4 C INS, CINS Cargo Scanning Request For Proposal, October 2018
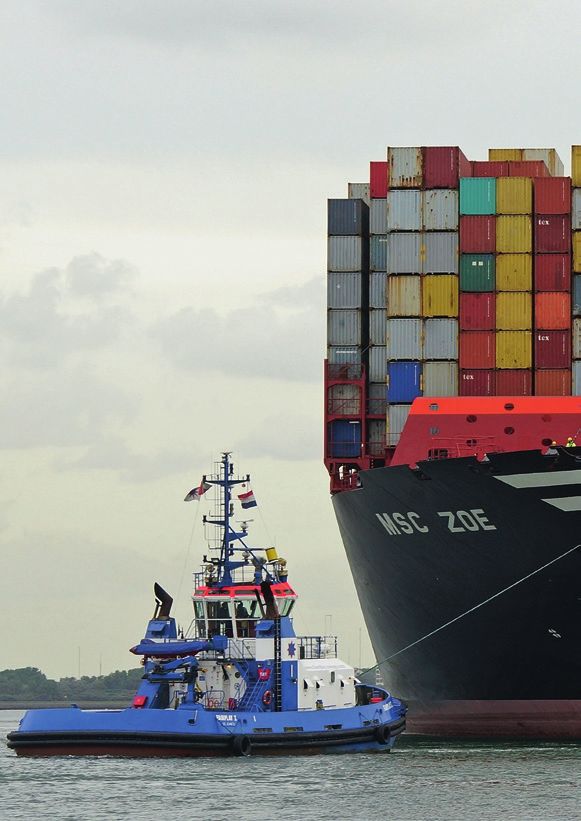
25Allianz Global Corporate & Specialty LOST AND DAMAGED CONTAINER COSTS MOUNT Although it not uncommon for containers to be lost at sea, the risks posed by heavy weather, inadequate stowing and lashing and even environmental concerns means this issue is a growing concern. The container ship MSC Zoe lost hundreds of containers at sea in bad weather. Photo: flickr.com, Kees Torn 26
Safety and Shipping Review 2019

On January 2, 2019 the 19,000 teu                      It is not uncommon for containers to
container ship MSC Zoe lost hundreds                   be lost at sea, particularly during
of containers off the German island of                 extreme weather conditions, but the
Borkum, amid heavy weather. Initially,                 numbers are relatively small. On
some 270 containers were reported                      average, a total of 1,582 containers
lost, but further investigation revealed               are lost at sea each year, according to
that at least 345 boxes were missing                   the World Shipping Council 2 , falling to
and a further 450 were damaged but                     568 containers when discounting
remained on board1 . The contents of                   catastrophic events like sinkings. To
some containers, which included toxic                  put this in context, approximately 130
substances, were washed up on a                        million containers are transported by
number of Dutch islands, raising                       sea each year, with an estimated
environmental concerns. The owner of                   value of more than $4trn.
the vessel, Mediterranean Shipping
Company, vowed to recover every                        Damaged goods, including containers,
missing container and clean any                        is one of the most frequent generator
affected beaches. The salvage                          of insurance industry claims in the
operation used a drone to locate and                   shipping industry, analysis by AGCS
retrieve the containers and their                      shows3, accounting for more than one
spilled contents from the seafloor and                 in five claims. (22% of 230,961 marine
navigation channel. The investigation                  insurance industry clams analyzed
into this incident is ongoing at the time              over the past five years).
of writing.

A common cause of cargo incidents at
sea is heavy weather and lashing
failures. In heavy seas, container
lashing comes under strain as a vessel
heels or tilts. In very large container
ships, where boxes are stacked high
above the water line, the motion is
accentuated, exerting huge pressure
on lashings.

“This can potentially push them to
breaking point,” says Volker Dierks,
Head of Marine Underwriting,
Central and Eastern Europe at
AGCS. “We will know more once the
investigation into the MSC Zoe is
completed, but it could be that lashing
and stowage procedures will need to be
                                                                               1,500+
                                                                            average number of
amended for large container ships.”                                        containers lost at sea
                                                                                each year

1 World Maritime News, Number of Lost MSC Zoe Containers Jumps to 345, February 2019
2 World Shipping Council, Containers Lost At Sea – 2017 Update
3 Allianz Global Corporate & Specialty, Global Claims Review: The Top Causes of Corporate Insurance Losses
                                                                                                          27
Allianz Global Corporate & Specialty
MACHINERY
DAMAGE INCIDENTS
AND COSTS RISING
It is the top cause of shipping incidents
over the past decade – a trend that is
unlikely to change anytime soon, given
rising repair costs and concerns over
maintenance levels and larger vessels.
On September 25, 2016, Ro-ro passenger ferry Historically, machinery damage (including
MV Hebrides hit pontoons and ran aground in engine failure) is one of the largest causes of
Scotland after the vessel suffered a technical marine insurance claims by both value and
failure. A September 2017 investigation1 into the frequency, according to AGCS. Based on
incident found that neither the ship’s engineers analysis of more than 230,000 industry claims
nor shore-based service engineers had access to between July 2013 and July 2018 it accounted
the relevant service instructions. for 12% of the value of all claims (over $1bn in
value), making it the third most expensive cause
In June 2018, the US Coast Guard2 warned that of loss after ship sinking/collision and fire/
fuel contamination at the Port of Houston was explosion (see, right).
causing engine problems – the problem
subsequently spread to other regions as far apart It is a trend that is unlikely to change anytime
as Singapore and Panama and is thought to have soon. In fact, machinery damage claims have
affected hundreds of vessels. been increasing in severity, driven by the rising cost
of repair and the consequence of larger ships.
More recently, in March 2019, the cruise ship, the
Viking Sky, which was carrying almost 1,400 “Generally, there are growing concerns with the
passengers and crew, narrowly avoided running quality of maintenance and the adherence to
aground off western Norway after struggling manufacturers’ guidelines, as well as issues with
with engine problems in bad weather. Almost the quality of components and spare parts. This
500 people had to be winched to safety. The is happening at a time when machinery damage
engine problems have been linked to a lack of losses are becoming more expensive, due to
lubricating oil, possibly caused by the vessel’s higher repair costs and the increased cost of
excessive rolling in waves. spare parts,” says Justus Heinrich, Chief
Underwriter Marine Hull, Central and
Eastern Europe, AGCS.
28Safety and Shipping Review 2018
TOP CAUSES OF LOSS: By value of claims By number of claims
MARINE INSURANCE Ship sinking/collision 16% Damaged goods
(including handling/storage)
22%
Fire/explosion 13%
CLAIMS Damaged goods 12% Crime/disorder 5%
(including handling/storage) Ship sinking/collision 4%
Machinery damage 12% Water damage 4%
(Claims data applies to all aspects of the marine (including engine failure)
insurance sector, not just on board vessels) Machinery damage 3%
Storm 7% (including engine failure)
Other 40% Other 62%
Based on analysis of 230,961 insurance industry claims with
a value of €8.8bn ($9.9bn) between July 2013 and July 2018.
Source: Allianz Global Corporate & Specialty, Global
Claims Review: The Top Causes of Corporate Insurance Unsurprisingly, ship sinking/collision incidents are the most expensive
Losses
cause of loss for insurers, accounting for 16% of the value of all claims
(€1.39bn/$1.56bn). Machinery damage incidents, such as engine
failure, have also caused in excess of $1bn worth of damage, based on
analysis of 230,000 marine insurance claims over five years.
“As vessels get bigger, so do their engines. And The analysis shows the number of machinery
when large engines fail they often cost more to damage incidents have also increased by a third
repair. The size of ship determines where a vessel over the past decade.
can be repaired as only a limited number of docks
can handle large ships, if dry-docking becomes However, a growing number of engine
necessary, while lead times for specialist manufacturers are now installing “Internet of
replacement parts can be six months or longer,” says Things” devices on engines in order to collect
Volker Dierks, Head of Marine Underwriting, vital data in real time, says Captain Rahul
Central and Eastern Europe at AGCS. Khanna, Global Head of Marine Risk
Consulting at AGCS. “This is enabling them to
For the 2019 Safety And Shipping Review, issue timely recommendations to the vessels or a
AGCS analyzed 26,022 shipping incidents problem and to carry out maintenance,
between January 2009 and December 2018. potentially avoiding breakdown.”
Of these incidents more than a third (8,862) were
caused by machinery damage or breakdown,
such as engine failure – the most common cause
of shipping incidents over the past decade – and
over twice as many as the next highest causes
of incidents, collision (3,648) and wrecked/
stranded (3,610).
1 M
arine Accident Investigation Branch, Loss Of Control And Grounding Of Ro-Ro Passenger Ferry Hebrides, September 2017
2 S
afety4Sea, USCG releases alert on recent fuel contamination at Port of Houston, June 2018
29You can also read