POWER BLACKOUT RISKS RISK MANAGEMENT OPTIONS EMERGING RISK INITIATIVE - POSITION PAPER - PREVENTIONWEB
←
→
Page content transcription
If your browser does not render page correctly, please read the page content below
Power Blackout Risks
Risk Management Options
Emerging Risk Initiative – Position Paper
November 2011
Content
1. Summary 3
2. Power blackouts challenge society and economy 4
3. Blackout risks on the increase 5
3.1. How power market trends influence blackout risks 5
3.1.1. Liberalisation and privatisation 5
3.1.2. Renewable energies 5
3.1.3. Huge investments in power supply infrastructure required 6
3.2. Historical power blackout events and future scenarios 8
3.2.1. Historical blackouts 8
3.2.2. What are the causes of blackouts? 9
3.2.3. Average blackout duration per country 11
4. Potential blackout scenario 12
4.1. Consequences 12
4.2. Cost analysis of historic blackout scenarios 15
5. Considerations for risk management 18
5.1. Trends affecting the Business Interruption (BI) risk landscape
and power dependency 18
5.1.1. General impact of blackout in light of changed production processes 18
5.1.2. Specific impact based on car manufacturers 19
5.2. Business Continuity Planning to mitigate power blackout risks 20
5.3. RISK TRANSFER SOLUTIONS 22
5.3.1. Principles of insurability 22
5.3.2. Current risk transfer solutions 23
5.3.3. Future risk transfer products 24
5.3.4. Residual risk acceptance 24
6. Conclusion 25
7. Annex 26
Authors:
Michael Bruch, Volker Münch, Markus Aichinger (Allianz)
Michael Kuhn, Martin Weymann (Swiss Re)
Gerhard Schmid (Munich Re)
Editor:
Markus Aichinger (Allianz)
Grateful acknowledgment to all CRO Forum Emerging Risk Initiative member companies
for their comments and revisions.
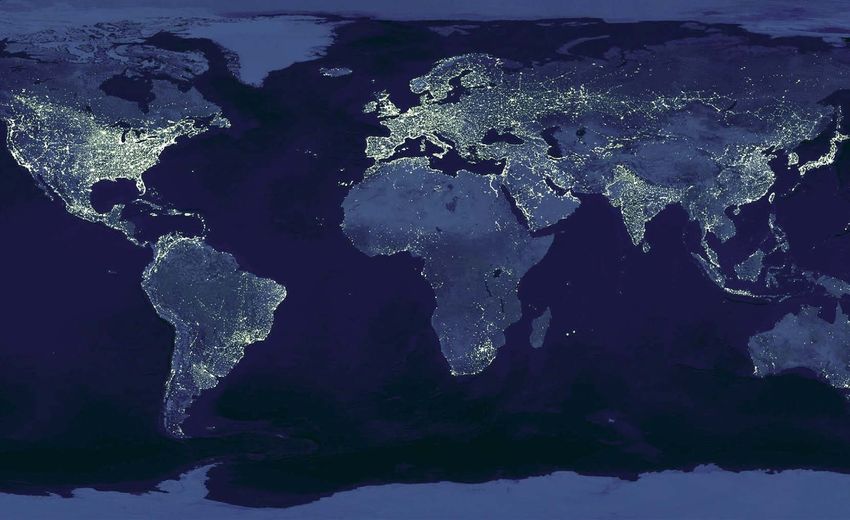
Title picture: Credit: C. Mayhew & R. Simmon (NASA/GSFC), NOAA/ NGDC, DMSP Digital Archive
Layout: volk:art51, Munich | Printing: Mühlbauer Druck, Munich
2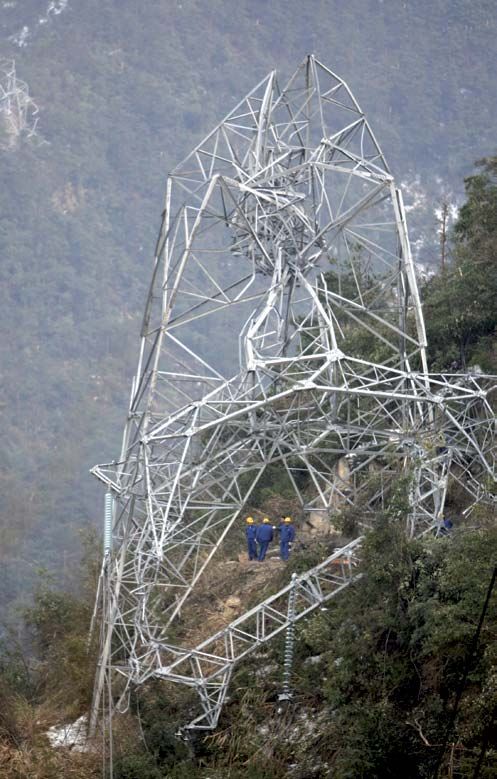
1. Summary

                              Blackouts during the last ten years in Europe and Northern America have demonstrated an increasing likelihood
                              of supra-regional blackouts with accompanying large economic losses. The earthquake, tsunami damage and
                              power shortages that idled thousands of Japan’s factories in 2011 highlighted its role as a key – and sometimes
                              the only – source of auto parts, graphics chips and other high-end components. Many manufacturers are currently
                              using up the inventories that they had in stock before the earthquake. A similar situation could occur as a result
                              of a larger power outage and this risk may further increase in the future. One reason are insufficient incentives to
                              invest in reliable power supply infrastructures. But new and smarter grids including storage capacities (e.g. pumped-
                              storage hydropower plants) are required to handle the future growth of volatile renewable energies, which are
                              located far away from the centres of demand. Furthermore the vulnerability of the power supply industry, the
                              industrial and commercial companies and the public and private sector is high due to the interconnectedness
                              and dependency of all areas on Information and Communication Technology (ICT), navigational systems and
                              other electronic devices.

                              Whereas short term power blackouts are experienced frequently on a local or regional level around the world
                              (e.g. caused by natural catastrophe events like earthquakes, storms, floods or heat waves), societies are not familiar
                              with large scale, long-lasting, disruptive power blackouts. Traditional scenarios only assume blackouts for a few days
                              and losses seem to be moderate, but if we are considering longer lasting blackouts, which are most likely from space
                              weather or coordinated cyber or terrorist attacks, the impacts on society and economy might be significant.

                              So far insurance companies were not affected significantly beyond taking care of their own business continuity
                              management in order to mitigate losses following a blackout. Risk transfer via insurance has usually required
                              physical damage to either the insured’s assets or the assets of specific service providers to trigger a business
                              interruption claim. But only 20% to 25% of business interruptions, such as supply chain disruptions are related to
                              a physical loss1. Therefore insured persons and organisations should be aware that they may face huge uninsured
                              losses. This might trigger an increasing demand for new risk transfer solutions related to power blackout risks in
                              the future.

                              The insurance industry can offer well contained event covers which fulfil the principles of insurance: randomness,
                              assessability, mutuality and economic viability whereas utilities and governments have to increase their efforts to
                              make our power infrastructure resilient against such events.

1
    http://fpn.advisen.com/articles/article140935191888258975.html

                                                                     CRObriefing on Power Blackout Risks                                          3
2. Power blackouts challenge society and economy

Electricity is the backbone of each industrialised society and economy. Modern countries are not used
to having even short power blackouts. The increased dependency on continuous power supply related to
electronics, industrial production, and daily life makes todays’ society much more vulnerable concerning power
supply interruptions. A brownout (reduced voltage) of some minutes or a similar blackout (complete failure of
electricity supply) may cause some inconvenience at home such as having the lights turn off. But a blackout
of a few hours or even several days would have a significant impact on our daily life and the entire economy.
Critical infrastructure such as communication and transport would be hampered, the heating and water supply
would stop and production processes and trading would cease. Emergency services like fire, police or ambulance
could not be called due the breakdown of the telecommunication systems. Hospitals would only be able to work
as long as the emergency power supply is supplied with fuel. Financial trading, cash machines and supermarkets
would in turn have to close down, which would ultimately cause a catastrophic scenario. If the blackout were to
spread across the border lines, which is more likely today due to the interconnection of power grids between
different countries, the impacts would escalate as a function of the duration of the interruption.

The following position paper highlights the risks and future trends linked to power blackouts. It further explores risk
management options including operational risk management measures, the importance of a high quality business
continuity management plan and risk transfer options. Furthermore it emphasizes the insurance industry’s options
to expand coverage based on physical damage and to consider new non-physical damage insurance solutions.
This might be insurance cover or alternative risk transfer solutions, which respond and cover emerging risks such
as power outages, but also political risks, pandemics and/or supply chain disruptions.

                                                                                                           picture alliance/dpa

4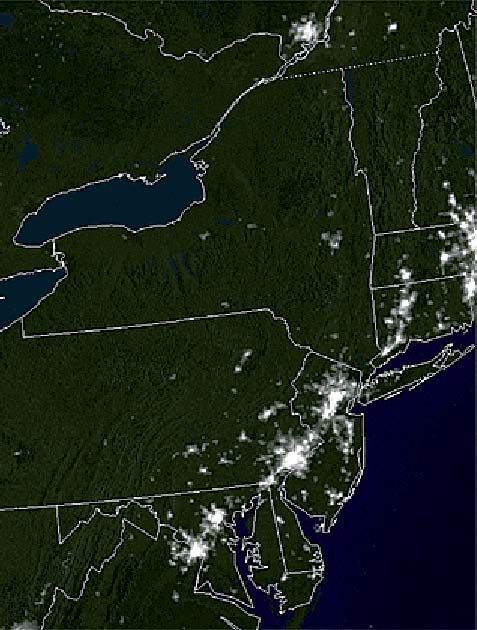
3. Blackout risks on the increase

                                     3.1. How power market trends influence blackout risks

                                     The worldwide power supply industry experienced two major changes in the last ten to twenty years:

                                     • Liberalisation and privatisation

                                     • Expansion of renewable energy production capacities

                                     3.1.1.	Liberalisation and privatisation 2
                                     Nowadays, most industrialised countries have 10 to 20 years experience with privatisation and liberalisation of
                                     electricity systems. The liberalisation of the market resulted in the separation of power generation and transmission
                                     and distribution (T&D) business. This process has created an additional interface which can adversely impact
                                     communication and coordination activities between operators on both sides. The past blackout events reveal (see
                                     boxes in 3.2.1 and annex) that underlying causes are also partly linked to the privatisation and liberalisation trends
                                     due to missing incentives to invest in reliable, and therefore well maintained, infrastructures. The discrepancy is
                                     further described in chapter 3.1.3.

                                     3.1.2.	Renewable energies 3
                                     Efforts to mitigate climate change across the world are focusing on the expansion of renewable energy production
                                     e.g. onshore and offshore wind farms, solar and biomass power plants. Half of the estimated 194 gigawatts (GW)
                                     of newly added electric capacity worldwide in 2010 is represented by renewable energies which was an increase of
                                     8% compared to 2009. According to the World Wind Energy Association (WWEA), about 175,000 megawatts (MW)
                                     of energy are now being produced by wind power stations around the world. Leading producers are the United States,
                                     China and Spain. The European Union intends to increase the renewable energy share of total energy production to
                                     20% by 2020.

Figure 14: The top three countries for Renewable Energy electricity production

                         Wind                              Hydroelectricity                      Geothermal                                 Solar Photovoltaic                Biomass

                          430                              3,428                                  62.5                                      18.2                              210

     [TWh]                                                                                                                                           6.9     6.2
     2010                         94.7                              721                                  16.5                                                                         55.6
                                           50.7                             396                                    10.3                                               2.9                      33.8      27.1
                                                   43.0                              366                                           7.0

     Total electricity                                                      81.7
     production
                                                                                     58.1
     [TWh]
     Percentage of
     RE [%]
                                                   14.3     16.0    17.1                                            16.6
                          2.0     2.2                                                                                             4.5                                                           5.7       5.9
                                           1.2                                                    0.3     0.4                               < 0.1   2.3      1.0      0.3      1.0     1.3
                          World

                                  U.S.A.

                                           China

                                                   Spain

                                                            World

                                                                    China

                                                                            Brazil

                                                                                     Canada

                                                                                                 World

                                                                                                         U.S.A.
                                                                                                                  Philippines

                                                                                                                                Indonesia

                                                                                                                                            World

                                                                                                                                                    Spain

                                                                                                                                                                                                         Brazil
                                                                                                                                                            Germany

                                                                                                                                                                      Japan

                                                                                                                                                                              World

                                                                                                                                                                                      U.S.A.

                                                                                                                                                                                               Germany

2
    http://www.psiru.org/reports/2009-12-E-Indon.doc
3
    http://www.ren21.net/Portals/97/documents/GSR/GSR2011_Master18.pdf
4
    http://www.energies-renouvelables.org/observ-er/html/inventaire/pdf/12e-inventaire-Chap02.pdf

                                                                                              CRObriefing on Power Blackout Risks                                                                                 5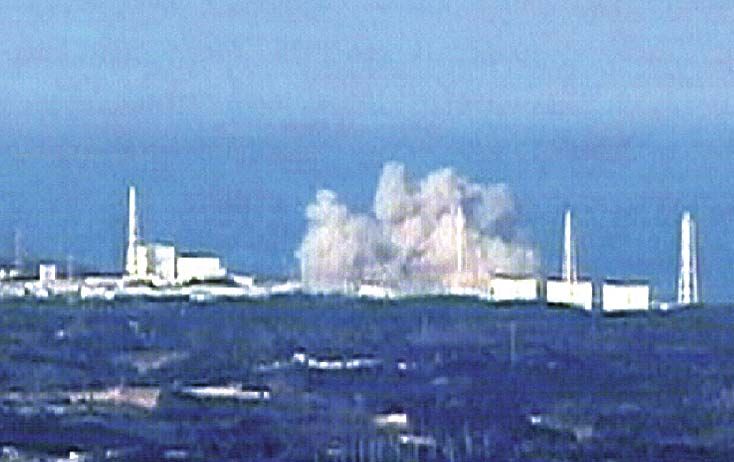
A downside of renewable energy particularly, wind and solar technologies, is the volatile supply of power. Not only
may a scarcity of electricity result in a power blackout, but an oversupply can also lead to grid instabilities as they
alter the frequency within the network. For example wind energy in East Germany during strong wind conditions
can provide up to 12 GW, which is more than all German coal and gas fired power plants considered together. This
is not critical as long as there is enough electricity demand, but may lead to grid instabilities in cases of insufficient
demand as there is not enough electricity storage capacity available. To get rid of excess electricity, transmission
system operators (TSOs) often have to pay an extra fee to the electricity market (EEX – European Energy Exchange,
Leipzig). Otherwise wind park operators have to be convinced to stop the wind turbines immediately in order to
prevent grid instabilities and blackouts. Conversely wind turbines must be stopped due to safety reasons if the
wind speed exceeds 30 m/sec. This scenario may cause, within one hour, power gaps equal to the performance
of two nuclear power plants. In such cases conventional reserve power plants are required to step in instantly.

In addition, the location of e.g. windfarms (onshore and offshore) is often far away from the centres of demand.
Electricity has to be transported from sparsely populated regions to large electricity consumers in metropolitan
areas. Therefore, new energy infrastructure (new high voltage transmission lines, transformers and energy
storage capacities such as pumped-storage hydropower plants or thermal storage facilities) are needed.

Grids need to become much “smarter” to handle these enormous technical challenges. Therefore a large-scale
smart grid is needed that integrates and automatically and efficiently coordinates the activities of all players both
on the electricity supply and the demand side.

3.1.3. Huge investments in power supply infrastructure required5
The following figure from the grid study published by dena (German Energy Agency 6 ) shows how many critical
issues have to be taken into account to plan a future transmission grid that responds to both the increased
proportion of renewable energy production and future requirements of a modern and sustainable power supply:

Figure 2: Challenges for a future transmission grid

              Flexible Line Management
                                                                                                                            Environmental Impact Public Acceptance
                        High Temperature Conductors
                                                                                                             Availability & Economic Efficiency
                                     Innovative Transmission Technologies

                                                                    100% Integration of Renewable Energy

         39% Renewable Energy                                                                                                                 Alternative Solutions and Grid
                                                       System Security in the Transmission Grid
           Sources until 2020                                                                                                                    Extension Requirements
                                                European Electricity Market              Market-Driven Operation of Power Plants

                                           System Services                                                         Increasing Flexibility

                           Voltage Support & Short-Circuit Power                                                                   Power Storage

           Islanding & System Restoration                                                                                                   Demand Side Management

                                                                                                                                                                 Source: dena

5
    EIA, Annual Energy Outlook 2011, http://www.eia.gov/neic/speeches/newell_12162010.pdf
6
    http://www.dena.de/fileadmin/user_upload/Download/Dokumente/Studien___Umfragen/Summary_dena_Grid_Study_II_2.pdf (November 2010)

6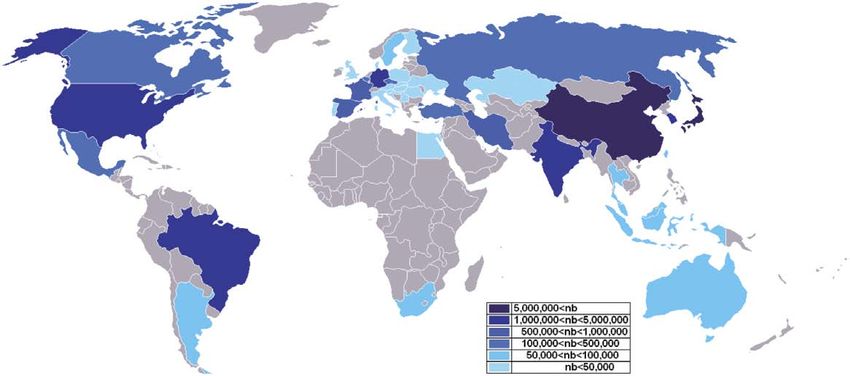
The dena grid study concludes that for Germany alone an additional 3,600 kilometres of 380 kilovolt lines will
be required by 2020. For comparison, since 2005 just 80 km of new power grids were erected.
For the European Union grids investments of EUR 23-28 bn are needed over the next five years. This could only
be realised if investment and permitting processes are pushed and financing incentives for TSOs are supported
by the EU members, regulator bodies and industry.
Worldwide an investment of USD 13.6 trillion will be required by 2030 in order to meet increasing demand
(International Energy Agency, IEA). IEA concludes that 50% of this amount needs to be invested in transmission
and distribution and another 50% in generation of electricity.
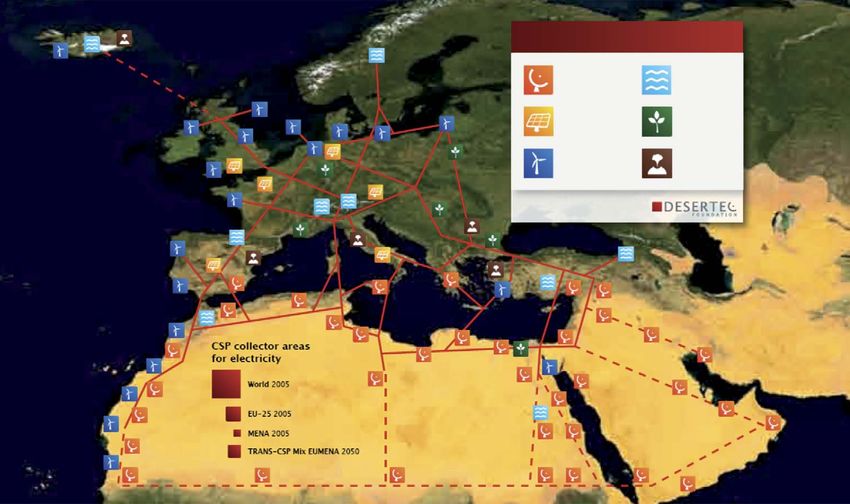
One of the most prominent projects that address these requirements is the Desertec project. The below chart
highlights the necessity of long distance transmission capabilities in order to efficiently use and distribute
renewable energies.
DESERTEC-EUMENA
Concentrating
Solar Power Hydro
Photovoltaics Biomass
Wind Geothermal
CSP: Concentrated Solar Power
Squares indicate the area required to meet the respective power demand
Source: Desertec Foundation
CRObriefing on Power Blackout Risks 7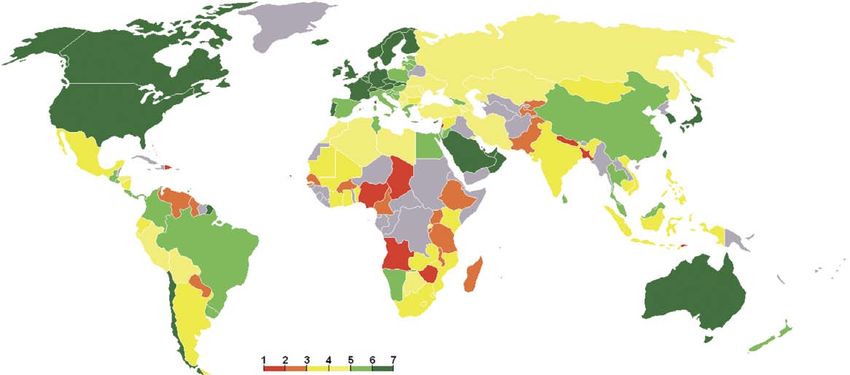
3.2. Historical power blackout events and future scenarios
3.2.1. Historical blackouts
The ten most severe blackouts concerning affected population and duration
New Zealand South West Europe (parts of Germany, France, Italy, Belgium,
20.02.1998 Spain and Portugal)
Technical failure, a chain reaction caused by a line failure 04.11.2006 (detailed description see Annex)
4 weeks MMM 70,000 Human error, the fault originated from Northern Germany, from the control area of
E.ON Netz. On November 04, 2006, a high voltage line had to be switched off to let a
ship pass underneath. Additionally during that time there was a strong wind which fed
Brazil (70% of the territory) into the grid 10,000 MW from wind turbines to Western and Southern Europe grids.
11.03.1999 Insufficient communication about this switch-off led to instabilities of the frequency
Natural event, a chain reaction was started when a lightning strike in the grid and to the overloading of lines, which ultimately resulted in the splitting of
occurred at 22h at an electricity substation in Bauru, São Paulo the Electricity Transmission network into three zones: West, East and South-East.
State causing most of the 440 kV circuits at the substation to trip. The Western zone lacked power and the Eastern zone had too much power.
Urban chaos led by huge traffic jams and public subway and 2h MMM 15,000,000
suburban trains systems that were out.
5h MMM 97,000,000
Brazil (most states) + Paraguay
10.11.2009
U.S.A. (North-East) + Canada (Central) Natural event, heavy rains and strong winds caused three transformers on a key high-
14.08.2003 (detailed description see Annex) voltage transmission line to short circuit, cutting the line and automatically causing all
A combination of lack of maintenance, human error and equip- of the hydroelectric power plant’s 20 turbines to shut-down due the abrupt fall of power
ment failures caused an outage that affected large portions of demand (the world’s second largest hydroelectric dam).
the Midwest and Northeast United States and Ontario, Canada. Thousands of people were trapped in elevators, subways and suburban trains. Road
This area typically has a total electric load of 61,800 MW. The traffic was also chaotic as the power outage darkened traffic lights, and the police were
blackout began a few minutes after 4:00 pm Eastern Daylight put on high alert as an outbreak of crime was feared. Only large office buildings and
Time and power was not restored for 4 consecutive days in hotels with generators were lit. The country’s largest airports were also using generators
some parts of the United States. and providing limited emergency service, they said. Brazil’s phone network largely
4 days MMM 50,000,000 collapsed, but its mobile-phone network was still operating.
Economic losses: about USD 6 bn 25min to 7h MMM 87,000,000
Italy (all Italy, except Sardinia) Brazil (at least 8 states in northeastern: Alagoas, Bahia, Ceará,
28.09.2003 (detailed description see Annex) Paraíba, Pernambuco, Piaui, Rio Grande do Norte and Sergipe)
Technical failure, a domino effect that ultimately led to the 04.02.2011
separation of the Italian system from the rest of the European grid.
Technical failure, a failure in an electronic component that was part of protection
30,000 people were trapped on trains. Several hundred passengers
system of the concerned substation.
were stranded on underground transit systems. Many commercial
16h MMM 53,000,000
and domestic users suffered disruption in their power supplies for
up to 48 hours. The subway had to be evacuated.
18h MMM 56,000,000 Deaths: 4 India
02.01.2001
Indonesia (Java Island) Technical failure, failure of substation in Uttar Pradesh.
Some major hospitals were able to function using back-up generators but others were
18.08.2005
paralysed and some major surgeries had to be cancelled. The water supply also broke
Technical failure, power failed along the electrical system that down after treatment plants and pumping stations stopped functioning. Millions of
connects Java, Bali, and Madura, causing outages in Java and people were unable to draw water from underground wells because the pumps were
Bali. This led to a cascading failure that shut down two units of not working. The northern rail system was in chaos as electric trains halted blocking
the Paiton plant in East Java and six units of the Suralaya plant the lines. More than 80 trains were stranded for about 15 hours across the region.
in West Java. Railway authorities used diesel engines to pull the electric trains to their destination
7h MMM 100,000,000 but there was a shortage of diesel locomotives. Major cities including New Delhi
rapidly clogged with traffic as the traffic signals went out. Land and mobile phone
services were severely affected. Airline computers failed, stopping the reservation
Spain procedures. Although Delhi international airport was able to avoid major flight
29.11.2004 disruptions by using stand-by generators, most of the airport was in darkness.
Human error/technical failure, overloaded transmission line 12h MMM 226,000,000
5 blackouts within 10 days MMM 2,000,000 Economic losses: USD 110 m
8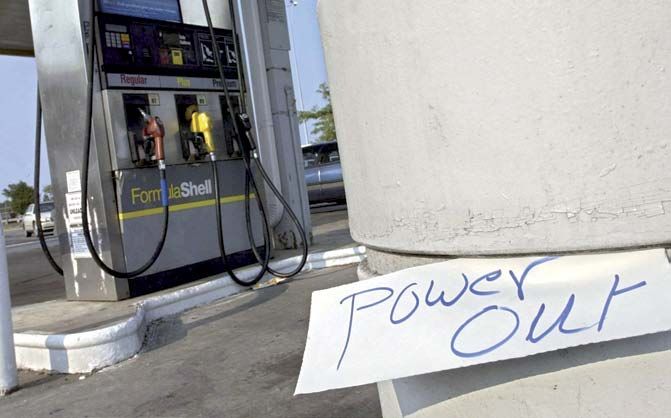
3.2.2.	What are the causes of blackouts?

Figure 3: Potential causes of power blackouts

                                                                                  Climate change

                                                                                               Economic upswing

                    • Ice storm                         Mega cities                                                                           Heat waves
                    • Snow storm                                                               Increased demand
                    • Wind storm
                    • Lightning
                    • Flood                                                                                                                                • Lack of cooling water
                                                                                                  Blackout                                                 • Lack of hydro capacity

                                                                   Failure of transmission                            Failure of production

     Solar storm                            Lack of investment,
                                                                                             • Terrorism
                                           ageing infrastructure
                                                                                             • Earthquake
                                                                                             • Construction defects
             Increased volatility due to                                                     • Operating Errors
               solar and wind power

                            Typically power blackouts are not caused by a single event but by a combination of several deficiencies. There is
                            no outage known where a faultless grid collapsed completely due to a single cause. The following preconditions
                            are the basis for a high power outage risk:

                            • High grid utilisation or high power demand

                            • High power plant utilisation

                            • Defects due to material ageing

                            If the following events occur in combination with the above mentioned conditions there is a very high likelihood
                            for a power blackout to occur:

                            • Power plant shutdown for revision or due to supply failures (e.g. cooling water shortage during heat waves)

                            • Unforeseen simultaneous interruptions of several power plants

                            • Human failure during maintenance work or switching operations

                            • Simultaneous grid interruption e.g. short circuit caused by tree contact, excavation work, balloons drifting into
                              power lines, cars hitting utility poles, provisional shutdown due to electrical overloading risk

                            • Sudden simultaneous high power demand, e.g. simultaneous usage of air conditions during hot summers

                            • Power line collapse or electrical equipment breakdown due to natural hazards (e.g. wind, earthquake, snow
                              or ice load, flood, lightning, space weather, extreme temperatures)

                            • Insufficient communication between transmission/distribution system operators (TSO/DSO) and power suppliers

                            • Cyber attacks

                                                                            CRObriefing on Power Blackout Risks                                                                       9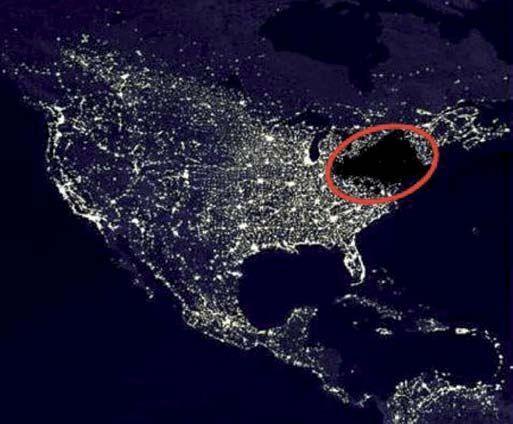
Power supply as potential terrorism and military target

Power supply industry is classified as a critical infrastructure. These are organisational and physical structures
and facilities of such vital importance to a nation’s society and economy that their failure or degradation would
result in dramatic consequences.
For this reason, power supply systems have always been military targets and can also be in focus for terrorist
groups which want to undermine economic and social stability.

Bombing:
Acts of war, terrorism and sabotage may focus on dams, power plants, substations and high voltage
transmission lines.
During the Korean 1952 war U.S. military attacked several dams and power plants to wipe out roughly 90% of
North Korean electricity generation.
In April 1995 anti-nuclear energy activists bombed the main 380 kV supply line for Vienna in Ebergassing
(Austria). Two of the four bombs detonated too early because of the electric induction too early and killed the
activists without causing damage to the line.
In January 2005 a high voltage line was damaged by terrorists in Georgia.
Several terrorist groups have threathened to destroy dams in the U.S., leading to high security efforts and the
closure of many dams since 9/11.

Cyber attacks:
During the last decade the likelihood of so-called cyber attacks increased. Such attacks try to shut down
or destroy critical power supply components, e.g. large generators or transformers, via the Internet.
Vulnerability for cyber attacks has risen substantially due to the ongoing move from propriety software to
IP-(internet protocol) based systems that use commercial software, which can be attacked by intruders.
The U.S. Aurora test in 2007 showed how a generator room at the Idaho National Laboratory was remotely
accessed by a hacker and a USD 1 m diesel-electric generator was physically destroyed.
Another example, the Stuxnet virus which was developed to obtain control over the operation of Iran’s nuclear
power plants, demonstrates new possibilities in cyber attacks used not only by individual criminals or terrorists,
but also by foreign states.

HEMP and IEMI attacks:
It is well known that nuclear bombs emit a strong electromagnetic pulse. If detonated at high altitudes (>  100 km)
above the earth’s surface such bombs are called a HEMP (high altitude electromagnetic pulse) weapon. Already
in 1962 a military test 400 km above the Pacific proved the power of such an attack.
As an unintended side effect the power and telephone infrastructure of Hawaii was affected despite the small
bomb (1.4 Mt) and the far distance (1500 km) from the point of detonation.
IEMI (Intentional Electro Magnetic Interference) attacks use special high power electromagnetic weapons without
any of the side effects of a classic explosion and with limited impact area.
Both such weapons have the capacity to cause similar types of damage, such as severe solar storms (see
separate box). HEMPs or IEMIs can lead to severe physical damage to all unprotected electronics and transformers
by inducing several 100 to 1000s of volts. Typically microchips operate in the range of 1.5 to 5 volts and are
therefore not capable of withstanding such voltages. The impact area can be in the range of several hundred
meters to an entire continent.
In the U.S. the Commission to Assess the Threat to the United States from Electromagnetic Pulse
Attack (http://www.empcommission.org) researches the effects and mitigation measures to such attacks.

10
3.2.3.	Average blackout duration per country

                                 Figure 4: Outages per year and duration, 20097

                                                                           1400                                                                                                    9                                                   Average duration
                                                                                                                                                                                                                                       of each outage
                                                                                                                                                                                                                                       in hours
                                                                                                                                                                                   8
                                                                           1200                                                                                                                                                        Average number
                                                                                                                                                                                                                                       of outages
                                                                                                                                                                                   7                                                   per year
                                                                           1000

                                                                                                                                                                                       Average duration of each power outage (hours)
                                                                                                                                                                                   6
                                 Average number of power outage per year

                                                                           800                                                                                                     5

                                                                           600                                                                                                     4

                                                                                                                                                                                   3
                                                                           400
                                                                                                                                                                                   2
                                                                           200
                                                                                                                                                                                   1

                                                                              0                                                                                                    0
                                                                                      All       East Asia     Eastern        Latin     Middle East   OECD   South Asia    Sub-
                                                                                   countries    & Pacific    Europe &      America &    & North                          Saharan
                                                                                                            Central Asia   Caribbean     Africa                           Africa
                                                                                  Countries grouping
                                                                                                                                                                                       Source: World Bank

                                Reliability of power supply varies significantly across regions (Figure 4). Even within OECD countries the quality of
                                supply is not uniform and power outages quite severly impact economy. The United States, as an example, has an
                                average of nine hours of disruptions each year for every consumer. Those interruptions are estimated to result in
                                economical losses of least USD 150 bn each year. Compared to other industrialized countries the reliability of the
                                U.S. grid is 5-10 times less than in major European countries. The average electricity consumer in U.S. has to
                                cope with approx. 30 times more service interruptions each year than in Japan or Singapore. U.S. grid stability
                                will decrease in the future if there are not enough investments in the infrastructure.
                                The October 2007 study, “2007 Long-Term Reliability Assessment,” of NERC (North American Electric Reliability
                                Corporation) came to the following conclusions: 8

                                • Long-term capacity margins on the nation’s transmission systems are inadequate to protect these systems
                                  from interruptions such as brownouts or blackouts. Absent immediate investments, this condition will worsen
                                  over the next decade;

                                • Projected increases in peak demand for electricity exceed projected additions of generation capacity;

                                • The areas of greatest concern are California, the Rocky Mountain states, New England, Texas, the Southwest,
                                  and the Midwest.

                                • In total, the U.S. will require about 120 GW of new generation just to maintain the minimum 15 percent
                                  capacity margin required for system reliability.

7
    World Bank study, http://siteresources.worldbank.org/EXTESC/Resources/Approach_paper_annexes_14_October_2009.pdf
8
    http://www.oe.energy.gov/DocumentsandMedia/Attachment_1_Nextgen_Energy_Council_Lights_Out_Study.pdf.pdf

                                                                                                                      CRObriefing on Power Blackout Risks                                                                                                 11
4. Potential blackout scenario
A regional blackout lasting more than several days already could be considered as a “worst case” scenario.
Most back-up and security systems will fail after a longer period without electric power, leading to an almost
complete failure of most critical infrastructures.
As shown before such a scenario could be caused by a wide range of events.
For example, during the European heat wave of 2003, generation of electricity of power plants, incl. nuclear
plants, had to be reduced due to the scarcity and high temperatures of the adjacent water bodies which are
substantial for cooling purposes. Almost all rivers had record low water levels leading to reduced hydroelectric
generation. Due to the massive lack of wind even wind generation capacity was down significantly. Prolonged
heat waves may additionally result in a drop in biomass production due to reduced growth of plants.
If such preconditions coincide with a high electricity demand and increasing instability in the power grid, there
is the potential for a supra regional collapse.
A comparable collapse can also be caused by a severe geomagnetic storm or an HEMP attack, due to the simul-
taneous damage to several key transformer locations and/or high voltage transmission lines. (OECD report 2011.9)
4.1. Consequences
Most critical systems such as hospitals, first responder facilities, water and sewage systems and stock
exchanges have backup power generation in place. However, these typically have only enough fuel for several
hours to a maximum of a few days.
Immediately after a blackout, it is not possible to purchase any goods without cash as no electronic payment
is possible. The 2003 blackout illustrated that after 3 to 6 hours without power most fuel stations and the
refineries had to close down, leaving the public without fuel for cars or backup generators as the pumps did
not operate. Aluminium melting furnaces will already sustain irreversible physical damage after 4-5 hours without
electricity.
Governments have typically, however, implemented emergency fuel storages to keep most critical facilities
alive for several weeks up to a month.
After one month with no electrical power, water, transportation, emergency services, critical manufacturing,
and chemical sectors can face widespread outages within the affected region. The loss of water systems due
to a power outage leads to many cascading effects. Hospitals, schools, nursing homes, restaurants, and office
buildings all rely on water to operate. Water is used for drinking, sanitation, and heating and cooling systems
in those facilities. Many manufacturing operations either use water as an ingredient in their processes or rely on
wastewater systems to remove and process their manufacturing waste. Fire fighters depend on water to carry
out their emergency response, and access to safe water is necessary for providing mass care services and
preventing the spread of disease. Without electricity most heating systems do not operate. During winter typical
homes can cool to below freezing level within few days. It must be expected that people will try to heat their
homes using open fires, leading to many homes burning while there is no water for emergency response teams.
9
http://www.oecd.org/dataoecd/57/25/46891645.pdf
12Space weather
The term space weather summarizes different astrophysical effects the earth is exposed to. Constantly emitted
clouds of electrically charged particles (plasma) from the sun into space are called solar wind. Large eruptions
of plasma from the sun‘s corona are known as coronal mass ejections (CME) and create solar storms. The sun
follows an 11 year cycle of changing solar activity with the next maximum expected in 2013. During a solar
maximum 1 CME reaches the earth’s orbit every 5 days on average, while during a solar minimum only 1 CME
reaches our planet every 45 days.
A solar storm that reaches earth, generates intensive showers of particles and gigantic currents in the ionosphere
(producing bright auroras) and induces major alterations in the geomagnetic field resulting in a geomagnetic storm.
Large scale electric conductors in the changing magnetic field, whether cables or pipes, run currents called geo-
magnetically induced currents (GIC). Depending on the underneath geology long power lines connect (or short
circuit) regions of different geoelectric potential. This can trigger GIC (up to 200 Ampere or more over time spans
of more than 10 seconds) to enter the power grid through transformer grounding cables. The electromagnetic
induction is higher the longer the transmission line and more severe for east-west directed transmission lines.
While power grids normally work with alternating currents they are not designed to handle direct currents (like GIC)
induced by a geomagnetic storm. Those currents affect the electricity infrastructure, in particular high-voltage
regulating transformers and substations, but also telecommunication networks and even pipe lines are exposed.
GIC could hold the power to not only cause tripping of transformers but also damage or even destroy transformers,
resulting in a different quality of power outage, i.e. not only large-scale but also long-lasting.
The first historical event where GIC appear to be linked to a large loss was a telegraph breakdown on September 2,
1859 – the so-called Carrington event. The day before, scientists detected a spectacular solar flare that had
triggered a series of CMEs, followed by the largest aurora ever reported. At the same time, the extreme geo-
magnetic storm overloaded telegraph lines worldwide, causing short circuits and fires in telegraph stations and
ultimately a breakdown in service.
More recently on March 13, 1989, during a large magnetic storm accompanied by vivid auroras visible as far
south as Hawaii and Cuba, GICs hit power lines from the Hydro-Québec power network. This led to a blackout
affecting 6 million people and losses of more than CAD 10 million. The increasing dependence of society on
electricity and electronics, and of course satellites (e.g. GPS timing signals), leads to a growing exposure to
strong space weather events, amplified by over-aged or sometimes degraded high-voltage equipment. >
CRObriefing on Power Blackout Risks 13Scenario of large-scale and long-lasting power outage Worst case solar storm scenario: • A severe geomagnetic storm (similar to the Carrington event of 1859) distorts the Earth’s magnetic field creating colourful aurora effects on the night sky. Multiple transformers fail (either tripping or damage) with cascading effects leading to a widespread power outage in the Northern Hemisphere (mainly affected areas include Canada, U.S.A., Scandinavia and Russia). Water, food, and fuel supply is disrupted, financial transactions stop, communication channels are interrupted and transportation of goods get challenging. As transformers have typical replacement periods of several months up to a year the power blackout might last longer than a few months. U.S. Storyline for worst case U.S. impacts* • Affected U.S. regions with > 130 m people affected • Assumptions: strength as May 1921 event (10 x strength of 1989 events, but less strong than 1859 Carrington event) • 300 transformers affected; delivery time per transformer about 12 months • Economic costs > USD 1 trillion • Further impacts include satellite damage, GPS signal disturbance, telecommunications break-down and industry dependent on electricity. This worst case scenario is mainly based on assumptions of widespread catastrophic transformer damages, long term blackouts, lengthy restoration times, and chronic shortages which will take 4 to 10 years for a full recovery. Such a scenario – although unlikely – can have devastating economic impacts and will also impact many industries. The insurance industry covers which could potentially be affected include: – Property: commercial and industrial business as well as personal lines – Liability: general liability, Directors and Officers liability – Credit: risk of businesses running into insolvency – Marine: no loading/unloading of cargo – supply chain disruptions – Space: dramatically enhanced radiation risk for astronauts, damage to solar panels and electronics of satellites, malfunction of steering on-board computers – Aviation: loss of communication, polar routes have to be rerouted. What lies ahead? As far as solar activity is concerned, for centuries it has been shown that a very constant cycle exists that peaks every 11 years. In 2008, we hit a low point. The next peak is expected around 2013. Technological mitigation options to protect against GIC impacts include engineering solutions (increasing the electrical robustness against GIC, hardening of equipment) and improved operating procedures (based on reliable forecasts). The simplest but probably also most expensive solution would be the provision of back up transformers. Costs per transformer are in the range of USD 10 million. But there are also other possible exposures leading to large scale power blackout such as terrorist attacks (e.g. using Electro-Magnetic Pulse bombs – see separate box) or cyber attacks. * after John Kappenman (Metatech Corp.) 14
Figure 5: Consequences of blackouts

 Health care and treatment insufficient
                                                                                                                                                      Business interruption in manufacturing process
                       Morbidity increase            Restricted operation of medical facilities                     Road traffic restrictions
                                                                                                                                                      Restricted operation of medical facilities
                       Mortality increase

      Business interruption in manufacturing process           Rail/Marine traffic restrictions                     Telephone network collapse               Restricted operation of medical facilities

                                                                                                                                                                      Cruise restrictions
 Stock market bust                                                                                   Consequences of
                            Loss of trust in banks        Payment transaction restrictions                                             Air traffic restrictions     Decrease in retail and wholesale turnover
           Bank runs                                                                                    Blackout
                                                                                                                                                                     Sharp decline in tourism

                                                                                Mass litigation                                                          Mass litigation
                                                                                                                   Business interruption in
                                                                                                                                                         Production decline in manufacturing sector
                                            Consumption decrease                                                   manufacturing process
                                                                          Internet breakdown
                                               Stock market bust                                                                                         Restricted operation of medical facilities

                                      Direct costs of blackouts are lost production, idle labour and facilities, damage to electronic data, spoiled food
                                      and damaged products, damage to equipment or customer refunds. Indirect costs are looting, accidental
                                      injuries, legal costs, loss of water supply. In general indirect costs exceed direct ones by up to 5 times.

                                      4.2. Cost analysis of historic blackout scenarios10
                                      Analyses of historic blackout events in U.S. show average electric customer interruption costs for medium and
                                      large industrial clients of between USD 15,709 for a 30 minute blackout and USD 93,890 for an 8 hour interruption.
                                      There is a wide range of costs depending on the industrial sector (medium & large clients). For an 8 hour event
                                      agricultural firms have the lowest costs with USD 41,250 per event, whereas construction firms have costs of
                                      USD 214,644 – a factor of 5.11

                                      It is difficult to get a clear picture of the incurred costs linked to blackouts. Other studies show much higher
                                      losses per event:

                                        Industry typical financial loss                                                    per event

                                        Semiconductor production                                                           EUR 3,800,000

                                        Financial trading                                                                  EUR 6,000,000 per hour

                                        Computer centre                                                                    EUR 750,000

                                        Telecommunications                                                                 EUR 30,000 per minute

                                        Steel works                                                                        EUR 350,000

                                        Glass industry                                                                     EUR 250,000

10
     http://www.leonardo-energy.org/webfm_send/2793
11
     Estimated Value of Service Reliability for Electric Utility Customers in the United States, Lawrence Berkeley National Laboratory 2009

                                                                                                  CRObriefing on Power Blackout Risks                                                                      15
The well known 2003 blackout in U.S. and Canada seems to be the highest economical loss ever during an outage with an estimated total cost of USD 4 bn to USD 8 bn. But even short blackouts which occur several times during a year in the U.S. sum up to an annual economic loss between USD 104 bn to USD 164 bn. Such short term outages or even just dips in voltage seem to be harmless, however, they can have severe impacts in case production and supply chain depend on accurately synchronised production processes. Paper manufacturing is a prominent example of such a business, but also the production of semiconductors. Apart from the reduced output and the waste of raw materials, the inability to supply the customer is critical due to the ever increasing interdependencies of supply chains. Costs per customer differ significantly between residential, commercial, and industrial customers. The costs can be described as the Value of Lost Load (VoLL), which is the estimated amount that customers would be willing to pay to avoid a disruption in their electricity service. Highest costs accrue during the first hour and then declining slowly thereafter, but they additionally differ according to various elements: • Industry sector • Size of the enterprise • Duration and frequency of past events • Time of day and by season of the year • Proportionate to household income 16
Some examples of impacts on specific industries during the 2003 blackout in U.S.
                                   and Canada.12/13

                                   • Daimler Chrysler: lost production at 14 of its 31 plants. 6 of those plants were assembly plants with paint
                                     shops. The company reported that, in total, 10,000 vehicles were moving through the paint shop at the time
                                     of the outage had to be scrapped.

                                   • Ford Motor Company: at Ford’s casting plant in Brook Park, Ohio, the outage caused molten metal to cool
                                     and solidify inside one of the plant’s furnaces. The company reported that a week would be required to clean
                                     and rebuild the furnace.

                                   • Marathon Oil Corporation’s: the blackout was responsible for triggering emergency shutdown procedures
                                     at the Marathon Oil Corporation’s Marathon Ashland refinery about 10 miles south of Detroit. During those
                                     procedures, a carbon monoxide boiler failed to shut down properly, causing a small explosion and the release
                                     of a mixture of hydrocarbons and steam. As a precautionary measure, police evacuated a one-mile strip
                                     around the 183- acre complex and forced hundreds of residents to seek shelter elsewhere.

                                   • Nova Chemicals Corporation: reported that plant outages resulting from the August 14 blackout reduced
                                     third-quarter earnings by USD 10 m or 12 cents per share. The power outage hit production at its Corunna,
                                     Moore Township, Sarnia, and St. Clair River, Ontario, and Painesville, Ohio, facilities.

                                   • Duane Reade Inc.: the largest drug store chain in the metropolitan New York City area reported that the
                                     August 14 blackout forced the closure of all of the company’s 237 stores. The company estimates that lost
                                     sales as a result of the interruption totalled approximately USD 3.3 m.

                                   • Airports: were closed in Toronto, Newark, New York, Detroit, Cleveland, Montreal, Ottawa, Islip, Syracuse,
                                     Buffalo, Rochester, Erie, and Hamilton. Together they cancelled over 1,000 flights.

                                   • New York City: the comptroller’s office estimated that losses topped USD 1 bn, including USD 800 m in gross
                                     city product. The figure includes USD 250 m in frozen and perishable food that had to be dumped.
                                     The Restaurant Association calculated that the city’s 22,000 restaurants lost between USD 75 m and USD 100 m
                                     in wasted food and lost business. Broadway lost approximately USD 1 m because of cancelled performances.
                                     New York City’s mayor estimated that the city would pay almost USD 10 m in overtime related to the outage.

                                   • Financial Markets: the lights went out after 4 p.m., which meant that the major U.S. stock exchanges had
                                     already closed – limiting the impact on financial markets. All the major exchanges and markets were up and
                                     running on Friday, but many trading companies were still without power as the trading day began.

12
     The Economic Impacts of the August 2003 blackout, prepared by the Electricity Consumers Resource Council (ELCON) – February 9, 2004
13
     http://www.policyholderperspective.com/2009/06/articles/first-party-property/2003-blackout-held-to-involve-property-damage-sufficient-
      to-support-claim-under-property-policy/

                                                                                       CRObriefing on Power Blackout Risks                         17
5. Considerations for risk management
5.1. Trends affecting the BI risk landscape and power dependency
5.1.1. General Impact of blackout in light of changed production processes
Manufacturers embraced “just in time” production in the 1990s, imitating Japan’s auto makers. They cut stock-
piles of parts and won discounts by buying more parts from a smaller group of suppliers. But that left them
without a cushion of raw materials to ride out even small disruptions.
As an indicator of the above vulnerability, the Earthquake, Tsunami damage and power shortages that idled
thousands of Japan’s factories in 2011 highlighted its role as a key — and sometimes the only — source of auto
parts, graphics chips and other high-end components. In fact, today, many manufacturers are currently using
up the inventories that they had in stock before the earthquake. A similar situation could occur as a result of a
larger power outage.
Consequences of the 2011 Japan Tohoku Earthquake for mobile phone & computers
manufacturers
• Apple: some parts of iPad (e.g. the flash memory, the super-thin battery, the built-in compass, the glass
overlaying and the touchscreen) are produced exclusively by Apple Japan. That is why Apple had difficulties
obtaining these components (logistical disruptions), even months following the event.
• Toshiba: has shut 1 of its 2 LCD (liquid crystal display) plants to recalibrate sensitive equipment knocked out
by the earthquake. Hitachi too has shut its LCD Tokyo factory because of damages and power cuts. Indeed,
LCD used in mobile phones and satellite navigation may be in short supply.
• Sony: has shut down 5 of its 6 laptop batteries factories in Japan. Other computer-makers may be hit by
shortages of these batteries.
Consequences for silicon users
Japan represents 60% of the global silicon wafer supply. The silicon wafers are used in many integrated circuits
and other micro devices, which are key parts used to make a wide range of electronic equipment. Some of the
biggest silicon manufacturing units in Japan have been damaged by the earthquake and tsunamis and shortages
may appear in a short time. Even if there are still alternative sources for these components, alternative suppliers
might also be facing shortfalls because of the increasing demand, making it difficult for the manufacturers to find
supplies elsewhere.
Figure 6: Japan’s shares in silicon industry (% of global suppliers)
12%
60% 23%
Japan
World
Silicon Wafers TFT LCD Panels Semi-conductors
Source: IHS Global Insight
185.1.2. Specific Impact based on Car Manufacturers
The vulnerability of automotive manufacturers to the power outages is very pronounced, as the automotive
industry has been the first industry to apply just-in-time production. A long supply interruption means a significant
risk of stock shortage, resulting in a high risk of production loss.
According to the site www.automotive-index.com, the majority of the automotive suppliers are still located in
developed countries (Canada, Germany, U.S., etc.). However, many suppliers are also increasingly located in
developing countries. The energy supply in these countries is less reliable, as can be seen in Figure 7. When
comparing the map of electrical power supply by country with the map of car manufacturing (Figure 8) and their
suppliers, it becomes obvious that the spread of locations show a significant production in countries with lower
power reliability, such as Turkey, India, Malaysia and Indonesia.
Figure 7: Quality of electricity supply by country, 2010
1 = insufficient and suffers frequent interruptions 7 = sufficient and reliable Source: World Economic Forum
Figure 8: Number of produced cars per countries in 2009
Source: OICA
CRObriefing on Power Blackout Risks 195.2. Business Continuity Planning to mitigate power blackout risks
A well organised and implemented business continuity plan (BCP) is vital for the survival of a company
in case of a power blackout, as well as to gain access to insurance solutions for such risks. The holistic structure
of BCP includes both a company’s internal factors, such as organisation, infrastructure and information and
decision-making channels, and external factors, such as technology, customers, suppliers, environment, nature
and social setting.
A successful BCP bases on a risk analysis which consists of
• Risk Identification Analysis (RIA)
• Risk evaluation
• Risk mitigation/adaption
• Risk Control
Once the risks have been identified and evaluated, it is advisable to draw up a list of measures. This will show
the energy company specific areas of weakness of any business interruption in a systematic way. Examples of
all four risk management steps are outlined in the following table:
Figure 9: Risk Management steps incl. examples
Risk Identification Risk Evaluation Risk Reduction Risk Control
Probability of
No. Weak point Cause Amount of loss Measure Effectiveness Priority Costs Responsibility
occurrence
1. Power supply Age over Power outage Twice a year Replacement by Prevention of Prio 1 EUR 15 m CEO
infrastructure of 60 years of facility and new equipment power outage one off costs
the company production and machines
estimate: including
EUR 20 m a day maintenance
program
2. Blackout risk of Main Stop of single Five times Main suppliers Prevention of Prio 1 EUR 5 m to CEO of main
main suppliers suppliers production line a year install own power production 8m supplier
due to depend- without EUR 10 m loss supply stop
ency of public own or a year
power supply emergency
power
supply
3. Loss of public Wild fire Power outage Several times Underground No exposure Prio 2 Falls under CEO of public
power grids due caused by of facility and especially installation of the to loss for the responsibility supply com-
to wild fire heat and production during the high voltage power lines of the power pany and CEO
drought estimate: summer time power lines and supplier of manufactur-
EUR 20 m a day additional power volunteer ing company
backup financing/
participation
of the manu-
facturing
company
20At the end of the threat analysis, the following key questions arise regarding business continuity management.
• Are the critical functions and processes in the company defined?
• Does useful documentation exist concerning frequency, scale and causes of business interruptions?
• Do comprehensive disaster recovery plans exist where the necessary strategies, data and operating
resources are laid down for business recovery?
• Are the IT and communication systems sufficiently protected, so that they can resume operation within
the required time following incidents?
• Are there plans which are tested and updated regularly by means of practice drills?
Description of Business Continuity Planning (BCP) elements
Business continuity organisation
concerns all divisions of the company and requires cooperation at all hierarchy levels. Only a clearly structured
business continuity organisation can ensure that strategies are developed, established, maintained and properly
implemented in an emergency.
People involved in preparing and maintaining the business continuity plan need to be acquainted with the
company’s infrastructure and processes and suited to the tasks in question. Responsibilities within the BC
process as a whole need to be clearly defined at all times.
The top position in the BC management should be held by a representative of the highest company level to
ensure high strategic priority within the company. A crisis team could operate locally and objectively in the
closest possible proximity to the emergency while emergency service teams were safeguarding the infrastructure
and recovery teams were already starting with specific disaster recovery activities.
Business Impact Analysis (BIA)
is the cornerstone of BCP, as it forms the basis of the further recovery strategy. In order to determine the relevant
business processes at risk of failure and describe them in detail in terms of their importance and impact, questions
are put to the senior management. Based on the information received, an analysis is carried out to ascertain how
long the company can continue to operate without its existence being jeopardised if areas identified as being at
risk fail. Here, any interdependency and contingency losses arising from the power outage must also be taken
into account.
The business impact analysis results in statements about:
• Loss potentials
• Restart times for critical business functions, and also
• Emergency staff, infrastructure and contingency workplaces
Disaster recovery plans
lay down, step by step, the procedure to be followed – from the alerting routine to resumption of the business
function.
The result should be a group-wide business continuity guideline that defines the key data of the BCP and which
the entire Board of Management approves as a binding requirement. The BC guideline will include the business
continuity organisation, the business continuity master plan and all the measures for maintaining, exercising,
auditing and developing the BCP.
CRObriefing on Power Blackout Risks 21Testing and developing the BCP The best business continuity planning can fail in an emergency if it is not constantly adapted to current conditions and regularly practised. Tests, training, audits and simulations are the supreme discipline of business continuity planning. Internal and external audits are also used to ensure the quality of BCP. To this end, as part of its responsibilities, the BC management checks whether the rules agreed beforehand are complied with in the individual business units and whether the BC organisation and BC set-up tally with the planning in everyday life. As a result of the increased reduction of redundancies and the outsourcing outlined before, the BCM Manager has to include power supply as one of the business critical processes into the BCP. This could be addressed in various ways: • Ensure, that for business critical processes multiple sources are available • Ensure, that the impact of a power outage is reduced by investing in technical backup units (e.g. emergency power supply) • Ensure, that cost benefit analysis relocating or outsourcing business critical processes take the additional risk of power outages into account, which might lead to the decision to locate the process in another country than originally planned. 5.3. Risk transfer solutions 5.3.1. Principles of insurability Insurance clients benefit from protection against unexpected losses and peak risks as well as freed up capital which can be deployed otherwise. The insurance industry enables therefore economic growth and innovation by reducing volatility and providing capital relief. Depending on their needs and the insurance markets’ product range, coverage extent and conditions vary. In order to transfer risks to the insurance industry a set of criteria has to be considered: • Randomness: The time and location of an insured event must be unpredictable and occurrence itself must be independent of the will of the insured (i.e. accidental). • Assessability: The frequency that an event will occur and severity of the resulting damage can be estimated and quantified within reasonable confidence limits. • Mutuality: A large number of endangered parties must join together to build a risk pool in which risk is shared and diversified at economically fair terms. • Economic viability: Insurers must be able to charge a premium that corresponds to the underlying risk including capital costs and expenses. 22
5.3.2.	Current risk transfer solutions
Therefore, blackout related risks can be separated into insurable versus not insurable risks.

Insurable
• Property damage (PD), business interruption (BI), insurance for utilities

• BI extensions insuring failure of power supply for commercial and industrial enterprises

• PD insurance for private households

Not insurable
• Unlimited and uncontrolled covers for generally insurable exposures

• Frequent losses (e.g. short term power blackouts)

• Operational risks

Electricity producers, distributors and consumers of electricity have various options to insure risks arising from
power outage.

Electricity producers and distributors
Producers usually buy property damage and business interruption insurance. These covers cushion or prevent
financial loss due to a reduction in turnover, if such reduction is due to material damage to insured property
on the insured premises. Covered perils are fire, explosion, social perils and natural perils in fire business
interruption insurance and various types of machinery failures in respect of machinery breakdown insurances.

In general, distributors of electricity have the same options for business interruption coverage as producers.
Since the distribution net with its transmission and distribution lines is usually heavily exposed to natural perils
such as wind, ice storm and earthquake, insurance coverage may be limited regarding both property damage
which triggers BI and insured perils.

BI insurances for both producers and distributors usually avoids frequency losses by respective monetary
deductions. These provide for self-insurance by the insureds in case of minor interruptions in electricity supply.

Some fairly new insurance products offer financial income protection against adverse weather conditions.
These normally apply to reduced electricity consumption arising in connection with warmer than expected winter
seasons, i.e. do not depend on accidental loss events. Often such covers are determined by indexes – so-called
parametric covers – rather than by the actual loss sustained as is the rule in Property and Casualty insurance.

In addition, special BI extensions exist which cover financial loss in connection with failure to produce or deliver
electricity following malfunction of data that was not caused by a physical loss or damage. Insured perils include,
data corruption or malfunction of data due to operating errors, hacker attacks or data malware.

Consumers
Consumers range from industrial and commercial enterprises to public authorities. Industrial and commercial
enterprises buy insurance against both material damage and BI due to failure of electricity. Usually for both types
of covers material damage on the premises of the insured is required. Such coverage only exceptionally includes
the transmission and distribution lines as the accumulation potential is considered to be high. In case the feared
event does not occur at the insured’s location but at a supplier’s site, this type of BI extension is called dependent
BI or contingent BI.

                                       CRObriefing on Power Blackout Risks                                             23
You can also read