EVALUATING THE POTENTIAL OF SEABASED S WAVE POWER TECHNOLOGY IN NEW ZEALAND - LINNEA JONSSON & MARCUS KRELL - DIVA
←
→
Page content transcription
If your browser does not render page correctly, please read the page content below
UPTEC ES11 002

                                Examensarbete 30 hp
                                         April 2011

Evaluating the Potential of
Seabased´s Wave Power Technology
in New Zealand

Linnea Jonsson & Marcus Krell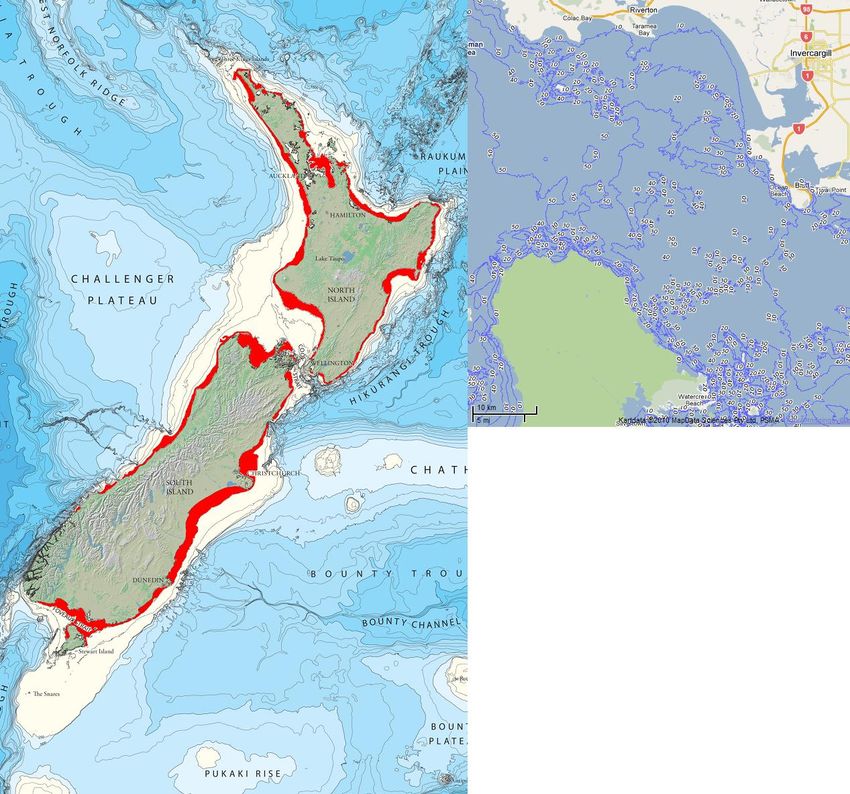

Abstract
                                      Evaluating the potential of Seabased's wave power
                                      technology in New Zealand
                                      Linnea Jonsson & Marcus Krell

Teknisk- naturvetenskaplig fakultet
UTH-enheten                           The aim of this thesis is to provide Seabased Industry AB with a decision basis for
                                      entering the New Zealand market. With the moderate wave climate around the
Besöksadress:                         Swedish coast, the main market for Seabased’s technology is on the international
Ångströmlaboratoriet
Lägerhyddsvägen 1                     market.
Hus 4, Plan 0                         The physical conditions in New Zealand are suitable for Seabased’s technology in
                                      terms of wave climate, bathymetry and seafloor types. There is an abundance of wave
Postadress:                           energy all around the country’s coasts with a large variety of wave climates.
Box 536
751 21 Uppsala                        Within about 15 km of the shoreline on the west coast, with a few exceptions, the
                                      mean annual power resource is at least 30 kW per metre wave front. The most
Telefon:                              energetic locations can be found along the Southland coast, where the mean annual
018 – 471 30 03                       resource per meter wave front is around 50 kW.
Telefax:                              The electrical distribution system has a layout with a high capacity national grid, which
018 – 471 30 00                       runs along the middle of the country, and outlying weaker grids reaching the coasts.
                                      This might prove disadvantageous at times since the grid might have to be
Hemsida:                              strengthened in order to receive large amounts of power at the fringe.
http://www.teknat.uu.se/student
                                      The weaker grids at the coast may however also prove to be an advantage, since this
                                      opens up for a secondary market. At points where the demand at times surpass the
                                      lines capacity many line companies are looking into the possibility of strengthening the
                                      grid locally by installing diesel generators. As these locations mostly are around the
                                      coasts this may prove a good secondary market for Seabased.
                                      The wholesale electricity price is today around 400 SEK (80 NZD)/MWh and is
                                      forecasted to stay there for the next few years and then increase to 500 SEK (100
                                      NZD)/MWh by around 2018. This is mostly due to an end of available geothermal
                                      resources. There are no subsidies to any power generation in New Zealand.
                                      To build a wave power park one needs resource consent. It may prove easier to first
                                      receive this for a smaller instalment, and the knowledge gained in this process will
                                      then help in receiving consent for a full scale park. A national goal exists of increasing
                                      the amount of renewable electrical generation from 73% today to 90% by 2025.
                                      Work is ongoing to make it easier to receive resource consent for marine energy
                                      instalments.
                                      The conclusion is that the market is expected to be ready for full approach by
                                      Seabased Industry AB within five years, and would then be a very suitable market. It is
                                      however considered to exist opportunities to approach the market already today for
                                      smaller instalments to build a local knowledge base which may prove useful when a
                                      full approach is made.

                                      Handledare: Mikael Eriksson
                                      Ämnesgranskare: Rafael Waters
                                      Examinator: Kjell Pernestål
                                      ISSN: 1650-8300, UPTEC ES11 002
Sammanfattning
Målet med detta examensarbete har varit att förse Seabased Industry AB med ett
beslutsunderlag för huruvida man ska träda in på den Nya Zeeländska marknaden. Med ett
mycket måttligt vågklimat runt Sveriges kust finns Seabased’s huvudmarknad internationellt.
De fysiska förutsättningarna i Nya Zeeland är mycket väl lämpade för Seabased’s teknik i
form av vågklimat, batymetri och typ av sjöbotten. Det finns ett överflöd av vågenergi runt
hela landets kust med en stor variation av vågklimat.

Inom 15 km från kustlinjen på västkusten, med ett fåtal undantag, är vågkraftspotentialen
minst 30 kW per meter vågfront. De mest energiintensiva platserna finns kring Southlands
kust, där det årliga medelvärdet per meter vågfront är runt 50 kW. Detta kan jämföras med 2-
10 kW/m i Sverige.

Det elektriska distributionsnätet har en layout med ett nationellt stamnät som sträcker sig
genom mitten av landet och ett svagare nät som når ut mot kusterna. Detta kan innebära en
nackdel tidvis då nätet ofta behöver stärkas för att kunna ta emot stora effekter ute vid kusten.
Det kan dock lika gärna visa sig vara en fördel, då detta öppnar upp för en sekundär marknad.
I delar av nätet där man tidvis har ett större kraftbehov än nätet klarar av överväger många
nätbolag att stärka nätet lokalt med hjälp av dieselgeneratorer. Då dessa platser oftast ligger
vid kusten kan detta visa sig vara en god sekundär marknad för Seabased.

Det elpris genereringsbolagen får ligger idag runt 400 SEK (80 NZD)/MWh och förutspås
ligga kvar på ungefär samma nivå de närmaste åren, för att sedan stiga till 500 SEK (100
NZD)/MWh omkring år 2018. Detta beror mestadels på att man då förväntar sig ha slut på
tillgängliga geotermiska resurser. Det finns i dagsläget inga subventioner till någon form av
elgenerering i Nya Zeeland.

För att bygga en vågkraftspark behöver man tillstånd. Det visar sig ofta vara enklare att få
tillstånd för en mindre installation, och erfarenheterna från denna kan sedan hjälpa till vid
ansökan av en fullskalig vågkraftspark. Det existerar ett nationellt mål att öka andelen
förnyelsebar el från dagens 73% till 90% år 2025. Arbete pågår med att förenkla
tillståndsprocessen för installeringar av marin elgenerering.

Slutsatsen är att den Nya Zeeländska marknaden kommer vara redo för ett inträde i full skala
inom fem år, och att det kommer vara en mycket lämplig marknad. Det anses dock att
möjligheter finns att närma sig marknaden redan idag för en mindre installation för att bygga
upp en lokal kunskapsbas som kan vara till stor nytta när man ger sig in på marknaden fullt ut.

                                                i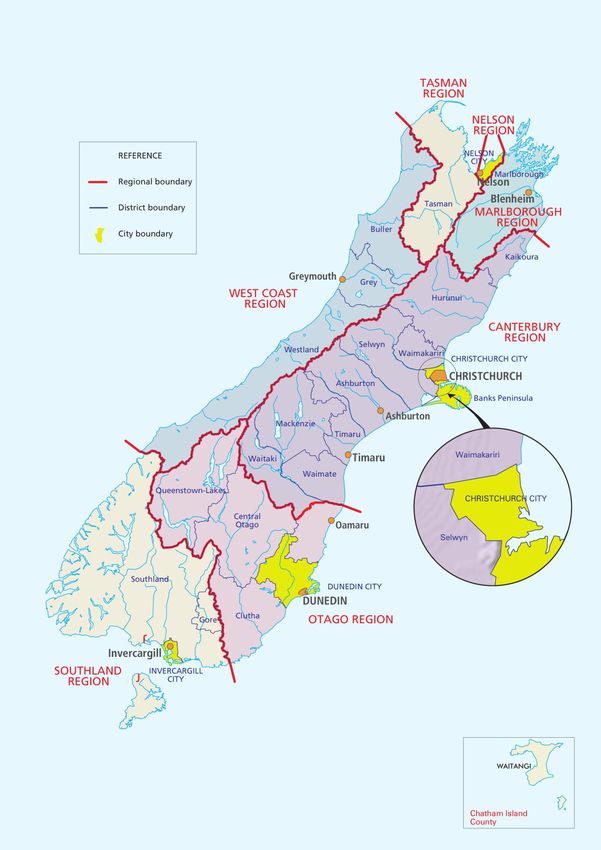
Table of Contents
Sammanfattning .......................................................................................................................... i
Glossary ..................................................................................................................................... iv
Map of New Zealand .................................................................................................................. v
1. Introduction ............................................................................................................................ 1
2. Background ............................................................................................................................ 1
   2.1 Authors ............................................................................................................................. 1
   2.2 Seabased ........................................................................................................................... 1
   2.3 The project ........................................................................................................................ 2
3. Aim & Scope of thesis ........................................................................................................... 2
   3.1 Method and content .......................................................................................................... 2
   3.2 Limitations ....................................................................................................................... 3
4. Theory (L. Jonsson)................................................................................................................ 3
   4.1 Real ocean waves ............................................................................................................. 3
      4.1.1 Description of waves ................................................................................................. 4
      4.1.2 Waves and power transport ....................................................................................... 5
   4.2 Power absorption .............................................................................................................. 6
      4.2.1 Power absorption for a park ...................................................................................... 7
   4.3 Utility factor ..................................................................................................................... 8
5. Physical aspects (M. Krell)..................................................................................................... 9
   5.1 Climate ........................................................................................................................... 10
   5.2 Wave climate & tides ..................................................................................................... 10
   5.3 Bathymetry & seafloor types .......................................................................................... 12
   5.4 National electrical system .............................................................................................. 15
   5.5 Local grids and owners .................................................................................................. 15
   5.6 Typhoons and earthquakes ............................................................................................. 16
6. Political and social aspects ................................................................................................... 17
   6.1 New Zealand electricity market ..................................................................................... 17
      6.1.1 Background (history/ownership/structure) (M. Krell) ............................................ 17
      6.1.2 Participants & spot market (M. Krell) ..................................................................... 18
      6.1.3 Politics & policies for wave power (L. Jonsson)..................................................... 19
   6.2 Legislations and restrictions ........................................................................................... 19
      6.2.1 Legislative documents affecting marine energy projects (L. Jonsson) ................... 19
      6.2.2 Application process for resource consent (L. Jonsson) ........................................... 20
      6.2.3 Affected parties in a resource application (M. Krell) .............................................. 21
      6.2.4 Assessment of Environmental Effects (L. Jonsson) ................................................ 22
      6.2.5 Indigenous population (M. Krell) ............................................................................ 23
      6.2.6 Time and Costs involved in Obtaining Consents (L. Jonsson) ............................... 24
   6.3 Application process for grid connection (M. Krell) ....................................................... 24
7. Economical aspects (M. Krell) ............................................................................................. 26
   7.1 Electricity prices ............................................................................................................. 26
   7.2 Indicative unit cost for different generation options ...................................................... 27
   7.3 Energy Outlook .............................................................................................................. 27
8. Competing interests .............................................................................................................. 30
   8.1 Marine life restrictions (M. Krell) .................................................................................. 30
   8.2 Fishing (M. Krell) .......................................................................................................... 31
   8.3 Navigational and military restrictions (M. Krell)........................................................... 32

                                                                       ii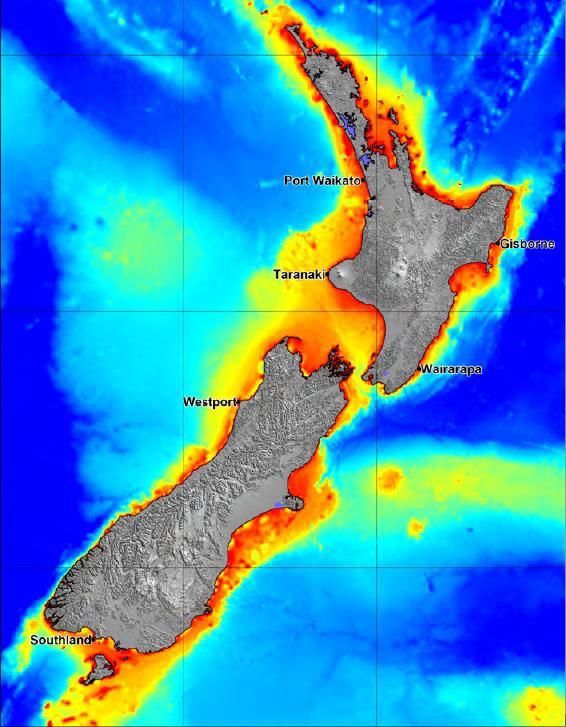
8.4 Domestic marine energy projects (L. Jonsson) .............................................................. 33
9. Analysis ................................................................................................................................ 37
   9.1 Site selection .................................................................................................................. 37
      9.1.1 Southland ................................................................................................................. 38
      9.1.2 Waikato ................................................................................................................... 38
   9.2 Energy production examples for a 10MW facility in NZ (L. Jonsson) .......................... 39
      9.2.1 Assumptions for a 10MW wave park ...................................................................... 39
      9.2.2 Site specific results .................................................................................................. 40
   9.3 Contacted parties ............................................................................................................ 44
      9.3.1 Public authorities ..................................................................................................... 44
      9.3.2 Companies ............................................................................................................... 45
      9.3.3 Other contacts .......................................................................................................... 46
10. Conclusions ........................................................................................................................ 47
   10.1 Physical conditions ....................................................................................................... 47
   10.2 Electrical distribution system ....................................................................................... 47
   10.3 Energy market outlook ................................................................................................. 47
   10.4 Resource consents ........................................................................................................ 48
   10.5 Suitable location for deployment ................................................................................. 48
   10.6 Alternative markets ...................................................................................................... 49
   10.7 Final recommendation .................................................................................................. 49
11. Discussion .......................................................................................................................... 49
12. References .......................................................................................................................... 51

                                                                     iii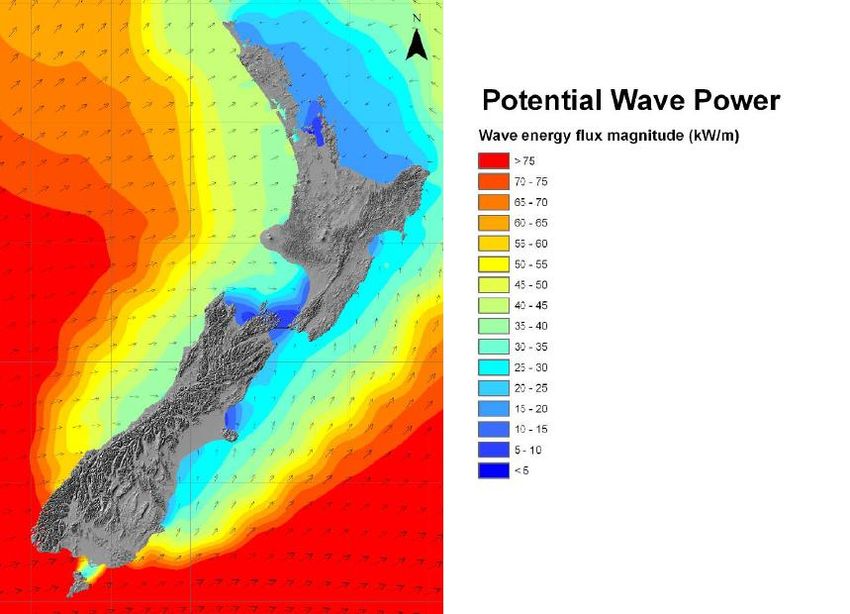
Glossary
AEE                     Assessment of Environmental Effects
AWATEA                  Aotearoa Wave and Tidal Energy Association
Bathymetry              The study of underwater depth of lake or ocean floors.
Benthos                 the organisms that live on, in or near the seabed
CMA                     Costal Marine Area, the foreshore, seabed and the coastal waters,
                        and the air space above the water
Crown entity            an organisation that forms part of New Zealand's state sector,
                        where the governance of the organisation is split from the
                        management of the organisation
Distributed generation equipment used, or proposed to be used, for generating electricity
                        that is connected, or proposed to be connected, to a local
                        distribution network, or to a consumer installation that is
                        connected to a local distribution network; and is capable of
                        injecting electricity into that local distribution network, but is not
                        directly connected to the national grid
ECNZ                    Electricity Corporation of New Zealand, former governmentally
                        owned company
EECA                    Energy Efficiency and Conservation Authority
ESA                     Electricity Supply Authorities
Iwi                     the largest everyday social units in Māori populations, in most
                        contexts equivalent to a tribe
LVMS                    Low Voltage Marine Substation, connection point for individual
                        WECs.
Māori                   the indigenous population of New Zealand
MEDF                    Marine Energy Deployment Fund
NZCPS                   New Zealand Costal Policy Statement
Power capture ratio     Percentage of incoming energy that can be absorbed by a WEC
Power flux              amount of power transported per meter wave front, usually kW/m
RCP                     Regional Coastal Plan
RMA                     Resource Management Act, 1991
RPS                     Regional Policy Statement
Significant wave height The average of the highest ⅓ of the waves in a measured burst.
                        Often denoted Hs
Tāngata whenua          a Māori term for the indigenous population of New Zealand
WEC                     Wave Energy Converter

                                              iv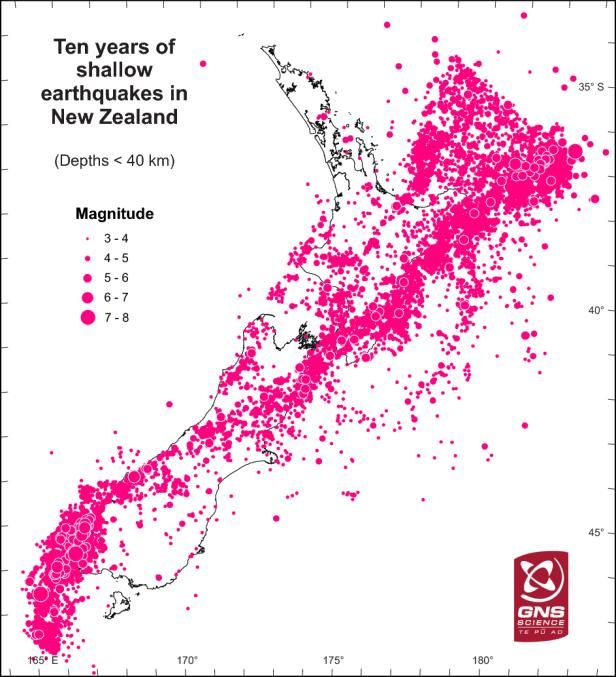
Map of New Zealand
Locations mentioned in this thesis

                                  Kaipara Harbour
                                                Auckland
                                                                                                East Cape

                               NORTH ISLAND                      Cook Strait

                                                                               Wellington
                                                        Picton
                                           Nelson

                                                                                    Wairarapa

                Southern Alps
                                                    Christchurch

                                           SOUTH ISLAND
                     Central
   Fiordlands        Otago
                                 Dunedin
                  Invercargill
   Foveaux Strait Bluff

           Stewart Island

                                                    v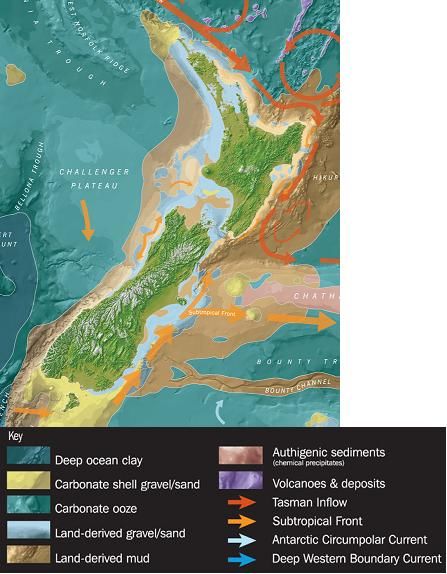
vi
1. Introduction
Many countries are today looking towards redirecting their energy systems towards renewable
resources. This is both for reasons of independence of imported fossil fuels and to reach a
more sustainable energy system. In some cases the driving forces are even purely economical.

The amount of renewable energy resources available on Earth is vast. Even if unavailable and
unfavorable areas are subtracted there is still more than 40 TW of wind power and about 580
TW of solar power available for us to use. Only a tiny portion of this resource is being used
today, but that portion is growing by the day. As a point of reference the mean electrical
power need in the world for 2010 is projected at about 2.35 TW.1

Even though the first patent of a wave energy conversion device is from 1799, there is
virtually no energy utilized from ocean waves at present. Despite the energy resource from
ocean waves is estimated to be in the range of 1-10 TW.

Different wave energy conversion devices have been tried in a more scientific way since the
1970’s, but no technology has yet successfully managed construction, durability, economy
and ecology in order to take wave power into a commercial stage.

Even though solar power and wind power are growing exponentially on the world energy
markets wave power is still not present. This is very much because of the large engineering
challenge of harnessing the massive power of ocean waves. Until the viability of a device that
turns ocean waves into useful electric energy has been verified, wave power will remain
absent from the worlds energy systems.

2. Background
2.1 Authors
This report has been written by Linnea Jonsson and Marcus Krell, both M.Sc. students at
Uppsala University in Energy Systems Engineering.

Mikael Eriksson, manager of wave power resources at Seabased Industry AB, has supervised
the project.

2.2 Seabased
Seabased Industry AB (hereinafter Seabased) is a wholly owned subsidiary of Seabased AB.
The company was founded in 2001 and was originally an innovation and patent holding
company closely associated with the research being done at the Swedish Centre for
Renewable Electric Energy Conversion at the Ångström Laboratory, Uppsala University. The
research is directed by Professor Mats Leijon who together with Associate Professor Hans
Bernhoff are the founders and majority owners of the company.

The company’s business idea is to develop and sell wave energy converting (WEC) systems,
se figure 2.1 below. Seabased has developed a unique technological concept based on point
absorbers (i.e. buoys) on the ocean surface that follows the vertical motion of the waves. This
motion is transferred via a wire to direct a linear generator placed on the sea floor. The

1
    Rahm, Magnus (2010). Ocean Wave Energy.

                                               1
irregular voltage induced by each WEC is rectified. The system is modular, and after
rectification the WECs are connected and the voltage is transformed into suitable amplitude
and frequency before being connected to the grid.
Figure 2.1 WEC and park concept
2.3 The project
With the moderate wave climate around the Swedish coast, the main market for Seabased’s
technology is on the international market. It is therefore strategically important to identify
markets where the comparative advantages of wave power can be exposed. Both physical
aspects such as wave climate and bathymetry must be suitable, but also political and financial
climate as well as public opinion is important factors when choosing initial markets.
Seabased has previously investigated their potential on the Asian market. This project, where
the focus is on the New Zealand market, was suggested by the authors based on their
knowledge of the country; isolated grid, much hydropower, shortage of electrical energy and
strong public opinion and political incentives for renewable energy.
3. Aim & Scope of thesis
The purpose of the project is to investigate the conditions for a possible establishment of a
wave power park of linear generators in New Zealand. This may then serve as a decision basis
for Seabased regarding an entry to the New Zealand energy market.
3.1 Method and content
In order to evaluate if New Zealand is a suitable market, there has been several factors taken
into consideration, on a national as well as local level; political, legal, economic,
environmental, and social.
In addition, the study also looks at the prevailing competitive forces on New Zealand’s
renewable energy market and domestic marine energy market. Finally, the analysis will bring
up possible locations, mode of entry as well as the energy outlook of New Zealand.
2The basic method chosen for this project has been to identify what we needed to know in
order to place a wave power farm in a specific area. To do so we have set up some basic
assumption regarding the dimensions of a park and each specific generating unit. These basic
assumptions have limited the scope of facts needed, i.e. all cases for every park size are not
presented.
By choosing the method described above, the content of this thesis will include both a general
description of the national state of the mentioned factors, production calculations for six sites
and a more thorough description of two specific sites.
As a complement to facts found in scientific reports and official reports from companies and
official authorities a study visit to New Zealand has been completed. During the trip meetings
have been held with utilities, renewable generating companies, research companies, lobby
groups and government agencies to get a more detailed picture of the possibilities for
introducing Seabased’s technology in New Zealand.
3.2 Limitations
This project has the following limitations;
Assumed plant has a power of 10 MW.
- A similar size plant is planned for Swedish conditions, and thus choosing this size
for our study makes comparing Swedish and NZ conditions easier.
Calculations have only been done for a square park design.
- All calculations are only comparing different sites and are very simplified. For this
reason we have chosen the simplest park layout for the calculations.
Regulations regarding connection to regional grids and not the national grid.
- A park of 10 MW would most likely be connected to a regional grid.
Only brief investigation of deployment equipment.
- Limitation due to time frame of the project.
4. Theory (L. Jonsson)
In order to understand the fundamentals of wave power, some knowledge about basic terms
and concepts is needed. This section will not deal with all aspects of wave power theory, but
will include the relevant information for this thesis. A great part of the theory is taken from
the thesis Ocean Wave Energy2.
4.1 Real ocean waves
There are a number of different types of waves in the ocean; this chapter will however only
include those mainly generated by winds. Other types of waves are tsunamis and tidal waves.
Wind blowing over a free water surface creates a shear stress between the water surface and
the wind. This results in energy being transferred from the wind to the wave. Wind waves
form what is called a sea and when the sea is fully developed, the waves have absorbed as
much energy as they can from wind of that velocity. The length of water over which a given
wind has blown is called fetch. A schematic over the formation of waves are illustrated in
figure 4.1.
2
Rahm, M. (2010) Ocean Wave Energy. Uppsala University
3Normal wind waves are highly irregular meaning that they, at best, can be approximated by a
linear combination, a Fourier series, of harmonic components. Swell is a formation of long-
wavelength surface waves and are far more stable than normal wind waves, since they often
have travelled outside the region in which they were created. Real ocean waves can be swells,
normal wind waves or a mixture of both.
Figure 4.1 A schematic of waves developed and propagation stages (Baddour, 2004)
4.1.1 Description of waves
The characteristic for the motion of water particles depends on the depth of the water, as
illustrated in figure 4.2 below. The water particles (the blue dot in figure 4.2) move in a
circular orbit while in deep water (case A in figure 4.2). The radius of the orbit decreases with
the depth of the water.
As a harmonic wave progresses towards the shoreline, the wave transforms. The orbit of the
water particle becomes more elliptic (case B in figure 4.2 is in shallow water), the wave gets
steeper and will eventually break. These waves are very irregular and hard to describe
mathematically.
For linear waves, i.e. real ocean waves which can be described by a linear combination of
harmonic waves of different frequencies, the deep-water approximation simplifies theoretical
analyses. The deep-water approximation can be used when the depth (h in figure 4.2) is
greater than half the wave length λ, i.e. h >> ½ λ.
The principal terminology used when discussing waves are;
Crest: The high point of a wave
Trough: The low point of a wave
Wave height: Vertical distance from through to crest.
Wavelength λ: Horizontal distance from one crest to the next.
Time period T: The time in seconds for a wave crest to travel a distance equal
to one wave length.
Wave frequency f: The inverse of the wave period.
Wave depth h: The distance from mean sea level to sea floor
4Note that there is a direct relationship between wave period and wavelength but wave height
is independent of either3.
Figure 4.2 Wave characteristics, where A is in deep water and B is in shallow water
4.1.2 Waves and power transport
Since not two waves are alike, the local behaviour of waves is collected through long-term
series of wave data. The wave data is collected through two methodologies, where the first is
based on measurement and observations and the second on modelling.
The time series, containing information about measured period of time and the surface
elevation, can be reduced to spectrums and some characteristics parameters, such as the
significant wave height Hs, given in meters, and the energy period Te, given in seconds.
The spectral density function, or simply the spectrum, of a sea state is denoted , given in
m2/Hz. From the spectrum, so-called spectral moments, which give statistical information
about the waves, are defined as
Eq. 4.1
where is the frequency. The significant wave height is given by
Eq. 4.2
where is the zeroth spectral moment. describes the average height of the highest of
the waves.
3
Baddour, E. (2004) Unpublished. Energy from waves and tidal currents, Institute for Ocean Technology
National Research Council.
5The energy period Te is defined as
Eq. 4.3
The wave power flux J [kW/m], for one meter wave front is found through
Eq. 4.4
where for polychromatic ocean waves in deep water.
When calculating for J, the amount of data is reduced by sorting Te and Hs in a scatter
diagram – an example is shown in figure 4.3. The value in each bin represents the probability
of occurrence of that combination of Te and Hs.
Figure 4.3 An example of a scatter diagram (Bernhoff, 2009)
4.2 Power absorption
By assuming that the energy absorption is constant for all wave heights and periods, the
power absorption Pabs of one WEC can be written as,
Eq. 4.5
where is the power capture ratio (absorption), d is the diameter of the buoy and J is the
incident power transport.
6To give an estimate of energy production during a time period, the power absorption is
weighted with a scatter diagram according to
Eq. 4.6
where Ti,j is the amount of time for a certain sea state and Pabs i,j is the power absorbed for that
same sea state. Ti,j is calculated by using the probability of occurrence, which can be retrieved
from a scatter diagram in the bin at position i,j.
4.2.1 Power absorption for a park
The design of a wave park is in this thesis simplified to a number of rows where the WECs
are placed at the equal distance b meters apart, as seen in figure 4.4 below. The rows are
placed p meters apart, where the distance p is 10 times the diameter of the buoy4. The
direction of the incoming wave front with wave energy flux J0 is simplified to only the case
where it is perpendicular to the first row of WECs.
Figure 4.4 A wave power park with six buoys, placed b meters apart in a row and p meters apart between
rows. The incoming wave front‘s direction is in line with the arrows.
For this case, the incoming wave energy flux is
Eq. 4.7
where definitions are as before. After the first row, the incoming wave energy flux , that
will hit the second row is
Eq. 4.8
4
Bernhoff, H. (2009) Exercises for Wave Power Course. Uppsala University
7The incoming wave energy flux to the third row would be
Eq. 4.9
After n rows, the wave energy flux would be
Eq. 4.10
The power capture ratio for a park is calculated through
Eq. 4.11
where n is the total number of rows in the park.
4.3 Utility factor
The utility factor is the ratio of average generated power to the installed power of the power
plant. No power plant will produce energy at the rated power for all hours of the year. For
intermittent power sources, the utility factor is strongly dependent on the available power
source, e.g. wind or waves. Examples of utility factors for different types of generation are
shown in figure 4.5.
The utility factor is defined by
8Figure 4.5 Examples of utility factor for different types of energy sources. The red sections are the range
possible utility factor depending on location and technology.5
5. Physical aspects (M. Krell)
New Zealand consists of two main islands, the North and South Islands, which are separated
by the Cook Strait. The country has over 15, 000 km of coastline and has the fourth largest
Exclusive Economic Zone in the world.
The South Island is divided along most of its length by the Southern Alps with several peaks
higher then 3000m and has a region of fiords in the south-western corner, called Fiordland.
The North Island is less mountainous but more volcanic. The central part has high volcanic
activity and is rather mountainous, while the land around the edges is a flatter area.
Sweden and New Zealand have many geographic and demographic similarities. The countries
have almost identical lengths and population densities, although New Zealand has
approximately half the surface of Sweden. Consequently the population is about half of
Sweden’s, a bit over 4 million.
It is quite helpful to think of New Zealand as “Sweden up-side-down”. The North Island is
mostly arable land and is densely populated (76% of population) and with over one quarter of
the population living in Auckland (pop. 1.3 million). The North Island stands for 79% of New
Zealand’s total GDB.
5
Wave Power Project – Lysekil. (2010-09-15). Website.
9The South Island is home to one quarter of the population, and about half of them live in three
larger cities (Christchurch, Dunedin and Invercargill). The South Island is quite similar to
Norrland, with a lower population density than the North Island, remote areas and a large
mountain range in the west. Here the economy is strongly based on tourism and primary
industries.
5.1 Climate
The climate of New Zealand is mostly cool temperate to warm temperate with a strong
maritime influence. Temperatures generally vary from about 23 ºC in summer to 12 ºC in
winter, with a generally warmer climate in the north and cooler in the south.
Rainfall varies from 300 mm per year in Central Otago to up to 8000 mm per year in places
west of the Southern Alps. Most New Zealand cities receive between 650 mm and 1500 mm
per year. Generally the west coast is wetter and the east coast dryer.
5.2 Wave climate & tides
New Zealand has two wave climate systems of different origin. The south and west coasts are
swell-dominated (wavelengths around 150m) while the east and north coasts are sea-
dominated (wavelengths 50-100m). This is due to swells originating from, mostly
uninterrupted, circumpolar weather systems in the Southern Ocean hitting New Zealand from
the south west. The eastern and northern coasts are thus sheltered from this swell, and the
waves here originate from more local weather systems.
The total available wave power resource in New Zealand is estimated to 180 GW6 by
integrating the flux magnitude passing the 50 m depth contour around the country. This would
correspond to approximately 1500 TWh per year.
Within about 15 km of the shoreline on the west coast, with a few exceptions, the mean
annual power resource is at least 30 kW per metre wave front. The most energetic locations
can be found along the Southland coast (the south coast of the South Island), where the mean
annual resource per meter wave front is around 50 kW. The south eastern part of the South
Island experiences about the same energy resources, and the next most energetic location can
be found between Wairarapa and East Cape on the North Island, with mean wave energy of
about 10 kW/m wave front7.
A map of mean spectral wave power (1997- 2007) around New Zealand can be seen in figure
5.1 below.
6
de Vos, R. et al. (2009) EnergyScape Basis Review Section 2 Renewable Resources. NIWA
7
Power Projects Ltd, (2008) Development of Marine Energy in New Zealand.
10Figure 5.1 Mean spectral wave power around New Zealand8
For dimensioning purposes extreme wave conditions are of interest. Table 5.1 below show
values for the significant wave height and single wave maximum wave height expected in a
50 and 100 year storm9 at six locations around New Zealand. The locations of the measuring
sites can be seen in figure 5.2 below. No definitive information was found regarding
corresponding values for the wave period during these conditions, but estimation is that the
period would not exceed 16 seconds10.
Table 5.1 Extreme wave heights around New Zealand
Site Lon Lat Mean Hmax(50) Mean Hmax(100)
(WGS84) (WGS84) Hs(50) Hs(100)
NI NE 176,625 –33.750 12,84 30,1 13,86 32,5
NI NW 168.750 –34.875 12,25 28,7 13,04 30,5
NI SE 178.875 –41.625 13,07 30,6 13,95 32,7
SI W 167.625 –42.750 14,48 33,9 15,46 36,2
SI SE 173.250 –47.250 16,5 38,7 17,71 41,5
SI SW 164.250 –49.500 18,11 42,4 19,3 45,2
8
Power Projects Ltd, (2008) Development of Marine Energy in New Zealand.
9
Stephens, S A. & Gorman, R M. (2006). Extreme wave predictions around New Zealand from hindcast data.
New Zealand Journal of Marine and Freshwater Research. Vol. 40: 399-411.
10
Komar, P D. (2005) Environmental Change, Shoreline Erosion & Management Issues.
11Figure 5.2 Measuring sites of extreme wave conditions8
The tidal range in New Zealand varies from about half a metre (in Picton at neap tides) to
almost 4 metres (in Nelson at spring tides)11.
Tidal information for a few locations can be seen in appendix I.
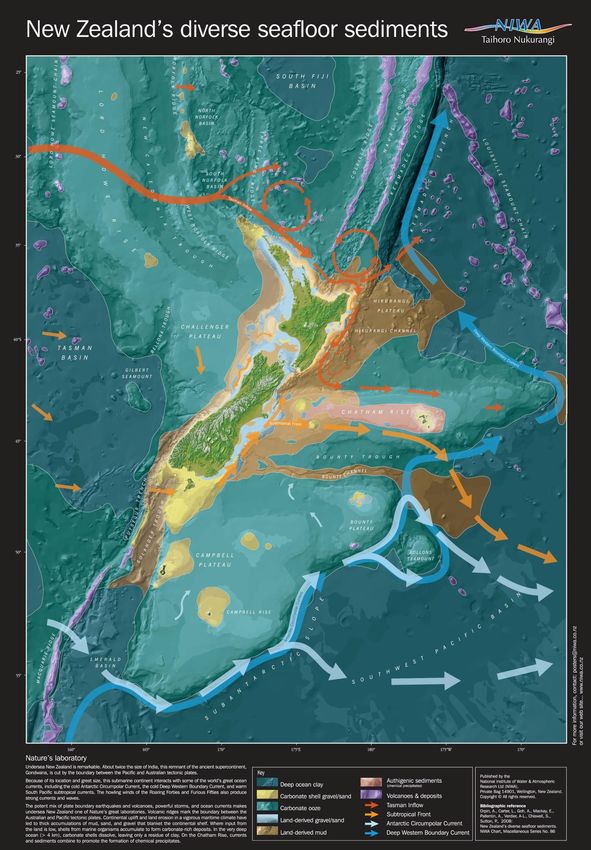
5.3 Bathymetry & seafloor types
The New Zealand bathymetry varies around its coastline. The landmass is relatively young
and still has volcanic activity, earthquakes and geothermal areas. All this is due to the fact that
the country is positioned on the boundary of the Australian and Pacific tectonic plates, see
figure 5.9. The boundary runs generally in the SW-NE direction, along the Southern Alps and
of the east coast of the North Island.
A general view of the sea depths can be seen in figure 5.3 below. The red markings indicate
depths of less than 50 metres. To get a more detailed picture of sea depths around the
coastline an online tool made available by the National Institute of Water and Atmospheric
Research (NIWA) is available for free. It offers overlays of depth curves of 10, 20, 30, 40, 50
and 100 metres, foreshore sediment types, coastal landform types etcetera. A snapshot of the
tool can be seen in figure 5.4 below, and the tool can be found at;
http://wrenz.niwa.co.nz/webmodel/coastal (2010-09-17)
11
Land Information New Zealand. Tidal levels. (2010-09-23). Website.
12Figure 5.3 & 5.4 Depth
The southern half of the west coast of the South Island is mostly mud, but the northern half is
generally gravel and sand. The east coast of the South Island is predominantly gravel and
sand, with the occasional patch of mud. A general overview of the sea floor sedimentation
types can be seen in figure 5.5 and in higher detail in appendix II.

Figure 5.5 Sea floor sediment compositions 13

13
     NIWA, bathymetry. (2010-09-22). Website.

                                                14
5.4 National electrical system
New Zealand has an electrical system
with a frequency of 50Hz and general
domestic voltage of 230/240V14.
The total use of electrical energy in 2009
was 38 TWh. The electrical power comes
mainly from hydropower (57%), gas
(20%) and geothermal (11%). Wind
covers 3.5% of the generation.
Approximately 73% of the electricity
generation in 2009 was from renewable
sources (incl. geothermal). This is
graphically represented in figure 5.6.
New Zealand has about 5 GW of installed
hydropower, 712 MW of installed
geothermal power and around 371 MW of
installed wind power15.
Figure 5.6 Electricity generation by fuel type 2009 14
5.5 Local grids and owners
In 1998 the Electricity Reform Act came into power, requiring retail, generation and
distribution companies to be separate, preventing line companies from being generators or
retailers. These rules have however been reformed so that distribution companies now can
own generation, within certain restrictions16.
The distribution of electricity is divided in two levels. The state owned enterprise Transpower
owns and operates the national high voltage grid, see figure 5.7 below, and local distribution
companies which owns and operates lower voltage grids, see figure 5.8 below.
There are currently 28 local distribution companies in New Zealand. Most are regionally
based, and ownership varies from publicly listed companies to community owned trusts.
14
Four Corners. New Zealand Infrastructure (2010-09-16). Website.
15
Ministry of Economic Development (2010). New Zealand Energy Data File 2010.
16
New Zealand Parliament (2008), Electricity Industry Reform Amendment Bill.
15Figure 5.7 & 5.8 Map of Transpower's grid & map of distribution network areas
5.6 Typhoons and earthquakes
New Zealand is hit by a tropical cyclone once every eight to nine years17.
The national institute of Geological and Nuclear Sciences (GNS) records about 15 000
earthquakes in New Zealand every year, however most of them are never felt by people.
Generally a severe earthquake hits the country every decade, and in the period between 1992
and 2007 New Zealand experienced over 30 earthquakes with a magnitude of 6 or more.
A rather large earthquake hit the city of Christchurch in September 2010, the country’s largest
earthquake in nearly 80 years hit Dusky Sound in the Fiordlands in 2009, and an offshore
quake close to Gisborne in 2007 caused buildings to collapse.
A general distribution of earthquake magnitude and location can be seen in table 5.2 and
figures 5.9 and 5.10 below.
Table 5.2 Frequency of Occurrence of Earthquakes (since 1960)
Magnitude Annual Average "Rule of Thumb"
4.0-4.9 333 1 per day
5.0-5.9 26 2 per month
6.0-6.9 2 2 per year
7.0-7.9 - 1 per 3 years
8.0 or over - 1 per century
17
Wikipedia. Climate of New Zealand (2010-09-17). Website.
16Figure 5.9 Distribution of earthquakes and the Figure 5.10 Ten years of shallow earthquakes in
boundary of the Pacific and Australian tectonic New Zealand 18
plates 19
6. Political and social aspects
6.1 New Zealand electricity market
6.1.1 Background (history/ownership/structure) (M. Krell)
Prior to 1987, electricity generation and transmission was a responsibility of a Government
Department, the Ministry of Energy. Local distribution and supply was the responsibility of
electricity supply authorities (ESA), which were electorally oriented statutory monopolies20.
In 1987 the Electricity Corporation of New Zealand Ltd (ECNZ) was set up as a state owned
company (or state owned enterprise, SOE). The purpose of ECNZ was to own and operate the
generation and transmission assets of the Ministry of Energy, while policy and regulatory
activities largely were kept within the ministry.
In 1988 ECNZ set up Transpower as a subsidiary to run the transmission network, turning
ECNZ into a strictly generating company. The Ministry of Energy was abolished, and its roles
were transferred to what today is the Ministry of Economic Development.
All ESAs are corporatized, either owned by local trusts or kept in local authority ownership.
Transpower was split from ECNZ and the Electricity Market Company was set up to support
the electricity market framework for wholesale trading.
18
GeoNet. Earthquake (2010-09-17). Website.
19
GeoNet. About GeoNet (2010-09-17). Website.
20
Energy and communications branch of Ministry of Economic Development (2009). Chronology of New
Zealand electricity reform.
17ECNZ was split at two different times into Contact Energy, Genesis Power, Meridian Energy
and Mighty River Power. Ownership was separated for line and energy businesses, and
Contact Energy was privatized.
The Electricity Commission was established to take over governance of the electricity
industry. It would secure reserve generation and regulates the operation of the electricity
industry and markets.
In the winters of 2001, 2003 and 2008 dry periods and high energy demand led to energy
shortages. Public awareness campaigns were implemented to save energy by about 10%,
which was achieved and supply was ensured without interruption.
6.1.2 Participants & spot market (M. Krell)
As mentioned in section 5.5 above, the electricity sector in New Zealand consists of four main
components; generation, transmission, distribution and retail21.
On the wholesale market (also called spot market) a generator can compete to sell its
electricity to electricity retailers and other purchasers, e.g. large industrial users. The trade is
done through the electricity market operator The Marketplace Company Ltd (M-co), which is
owned by NZX (New Zealand Exchange).
Some of New Zealand’s largest generating companies are;
Contact Energy Ltd (privately owned)
Genesis Power Ltd (government owned)
Meridian Energy Ltd (government owned)
Mighty River Power Ltd (government owned)
Todd Energy Ltd (privately owned)
TrustPower Ltd (privately owned)
On the retail market electricity retail companies compete to sell the electricity they have
purchased on the wholesale market to end consumers. Retailers may also buy electricity
directly from embedded generators, i.e. smaller generators connected directly to distribution
networks (may be applicable for wave power).
Some of New Zealand’s electricity retailers are;
Contact Energy Ltd
Empower Ltd
Energy Online
Genesis Power Ltd
Meridian Energy Ltd
Mercury Energy Ltd
Bay of Plenty Electricity
King Country Energy
Trust Power Ltd
21
Electricity Commission. Industry. (2010-09-24). Website.
186.1.3 Politics & policies for wave power (L. Jonsson)
The New Zealand Energy Strategy in its latest form was the draft released in June 2010, and
will, after receiving feedback, replace the 2007 New Zealand Energy Strategy. This document
proposes the Government’s strategic direction for the supply and use of energy and thereby
covers a wide range of policies, actions and definitions.
The strategy states that in 2009, 73 % of the NZ electricity was from renewable sources i.e.
hydro, geothermal and wind resources. The renewable target for electricity generation is to
increase this share to 90 % by 2025 providing that this does not affect security of supply. If
one assumes that the need for electrical energy increases at the same rate of 2% annually22,
this would be equivalent to an increase of renewable electricity production of almost 22 TWh.
Relevant government actions for wave power are:
Continuing to work with industry associations and councils to remove unnecessary
barriers to the uptake of medium and smaller scale renewable technologies.
Continuing the Marine Energy Deployment Fund to 2011 and encouraging the
emerging industry as appropriate.
The Marine Energy Deployment Fund Projects
The Marine Energy Deployment Fund, MEDF, is managed by the EECA and aims to bring
forward the development of marine energy in New Zealand, by supporting the deployment of
generating devices23. The fund was established in October 2007, with NZ$8 million set aside
for the fund and its administration. So far, three out of four rounds have ended, resulting in
funding to three deployment projects further described in chapter 8.4.
6.2 Legislations and restrictions
6.2.1 Legislative documents affecting marine energy projects (L. Jonsson)
The main piece of legislative document affecting marine energy projects is the Resource
Management Act 1991, RMA, which among other things states that for activities affecting the
environment a resource consent application must be issued to the right consent authority or
authorities.
Following the RMA in the legislative document hierarchy is the New Zealand Coastal Policy
Statement, NZCPS. The NZCPS is only relevant for activities which have significant or
irreversible adverse effects on the Coastal Marine Area, CMA. The new NZCPS that came
into effect on the 4th of December 2010 specifically states that the Department of
Conservation (DoC), as an affected party in an resource consent application (see section 6.2.2
below), should “recognise the potential contributions to the social, economic and cultural
wellbeing of people and communities from use and development of the coastal marine area,
including the potential for renewable marine energy to contribute to meeting the energy needs
of future generations”24.
22
Ministry of Economic Development (2010). New Zealand Energy Data File.
23
Energy Efficiency and Conservation Authority. Marine Energy Deployment Fund. (2010-09-24)
24
Department of Conservation (2010). New Zealand Costal Policy Statement.
196.2.2 Application process for resource consent (L. Jonsson)
The resource consent comes in three different versions; notified, non-notified and limited
notified25, depending on for example the type and scale of the activity consent is applied for.
The difference between them is the requirements of the applicant and the level of involvement
of the affected parties. For a non-notified and the limited notified, you’ll have to address
submissions from the consent authority as well as from certain affected parties determined by
the consent authority. These groups could be the local DoC office or local fishermen, and
you’ll need a signed letter from all these groups for the application. For a notified consent,
public submissions and hearings are required and anybody can raise a question about the
effects the project will have. This then has to be proven by the project owner not to be an
issue.
In general, a small-scale renewable energy project in New Zealand should start by
determining whether resource consent is required or not. This is done by presenting the actual
and potential environmental effects to the consent authority or authorities and through this
start a discussion. The project developer is responsible for approaching the right authority or
authorities and for meeting the consent authority’s information requirements. The authorities
will after being approached determine if resource consent is required or not, and if so whether
it will be notified, non-notified or limited notified.
More specifically when it comes to marine energy projects26 any marine energy device or
project must secure consents from regional and local councils under the RMA 1991, prior to
undertaking any physical works. For specific requirements regarding regional and district
plans, one would have to contact the authorities separately in order to establish information
requirements and policies. In general though, regional and local authorities may have different
requirements on project developers, depending upon their operative plans. When receiving the
resource consent, physical work has to start within five years.
Table 6.1 below presents an overview of the policies, statements and plans relevant for
renewable energy projects in the range of 10kW- 20MW.
Table 6.1 Overview of policies, statements and plans relevant for renewable energy projects
Consent Authority Policy Statements and plans Consents
Minister of Conservation New Zealand Coastal Policy Restricted coastal activities
Statement (NZCPS)
Regional councils Regional Policy Statement
(RPS) Coastal permits
Regional Coastal Plan (RCP) Land-use consents
Regional Plans Water permits
Discharge permits
District and city councils District plans Land-use consents
Subdivision consents
25
Huckerby, John, AWATEA/Power Projects, 2010-11-15
26
Power Projects Ltd, (2008) Development of Marine Energy in New Zealand.
20Application forms can be obtained from the consent authority and typically requires the
following information:
A description of the proposal and its location
An assessment of environmental effects (AEE)
Any information required by a plan or regulations
A statement specifying all other resource consents you may require from any consent
authority
Identification of the persons affected by the proposal and any consultation undertaken
A list of the names and addresses of those who have given their written approval
(completed written approval forms should be attached to the application)
Plans of the proposal, e.g. a site plan, elevations and cross-sections
6.2.3 Affected parties in a resource application (M. Krell)
The Department of Conservation, DoC, is generally the first affected party on the list. Their
mission is to conserve New Zealand’s natural and historic heritage for all to enjoy now and in
the future. In the context of an affected party in a resource consent application they will raise
questions relating to the use of land and other natural resources as well as the effect on
benthos, marine wild life and tourism. They also work with Māori in most aspects of their
conservation efforts.
Their primary concern27 for a marine energy project will be the marine mammals; whales, sea
lions and dolphins, and the risk of these entangling themselves in the lines and colliding with
the buoys. A question raised is that if they avoid the park, will this lead to a change in the
migration routes altogether. There is however observation data available as well as ongoing
research about migratory routs.
Another concern is the effect of electric and magnetic fields on sharks and rays, since they
navigate using electroreception. When meeting the queries from DoC statistical analyses for
different factors will be asked for. For example, Crest Energy has been asked to place a
smaller number of generators in order to gather data before deploying their full-scale park.
Research done in other countries then New Zealand can be used, if it is clear that the location
of research does not affect the results.
There are local variations in the work of DoC, depending on the natural resource of the
region. The Southland region has a strong profile within eco-tourism and will take visual
effects into account when processing any consent application. Due to the tourism industry
here, there is a very slim chance of being granted a non-notified consent application, but it
will most likely be a notified no matter the size of the project28. This region’s biggest concern
is however the recent boost in the whale population. This raises serious concerns for the
possibility to receive resource consent for Foveaux Straight and most of the southern coastline
of Southland.
Commercial fishing will most likely not be a problem29since the fisheries usually work in
areas further out from the coastline. However, the recreational fishing could be a concern.
27
Ericksen, Kris, Department of Conservation, 2010-11-17
28
Funnell, Greig, Department of Conservation Southland, 2010-12-01
29
Hopkins, Anthony, Crest Energy, 2010-11-05
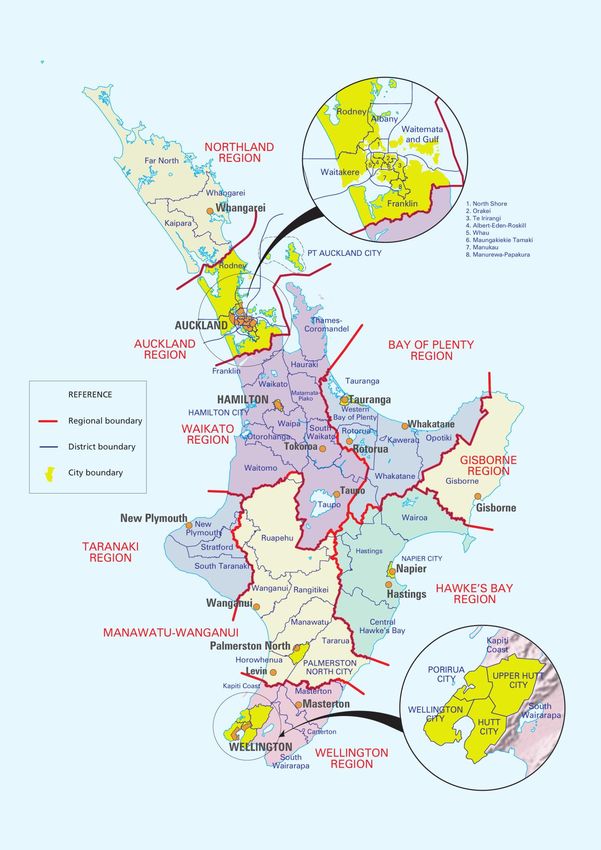
21A map with boundaries of all local and regional councils can be seen in figure 6.1 below and
in appendix III.
Figure 6.1 Map of local and regional councils 30
6.2.4 Assessment of Environmental Effects (L. Jonsson)
An assessment of environmental effects, AEE, is a critical part of the resource consent
application and is administratively speaking an attachment to the resource consent
application. There are guidelines to obtain from the Fourth Schedule of the RMA, section 88,
but most likely the council will be able to provide more specific requirements including
information needed for the council plan. As recommended for the resource consent as a
whole, the AEE should be discussed with the consent authorities at an early stage.
Generally speaking the AEE should contain the following information31:
A description of your proposed activity.
An assessment of the actual and potential effects on the environment of your activity.
Where the above effects are likely to be significant and a description of available
alternatives.
A discussion of the risk to the environment from hazardous substances and
installations.
30
Local Government New Zealand, Local Government Sector. (2010-10-16). Website.
31
Ministry for the Environment (2006). A Guide to Preparing a Basic Assessment of Environmental Effects.
22For contaminants, an assessment of the nature of the discharge and sensitivity of the
receiving environment to the adverse effects and any possible alternative methods of
discharge, including discharge into any other receiving environment.
A description of how the adverse effects may be avoided, remedied or mitigated.
Identification of the persons affected by the proposal, the consultation undertaken, if
any, and any response to the views of any person consulted.
Where an effect needs to be controlled, a discussion of how it can be controlled and
whether it needs to be monitored. Where appropriate, a description of how this will be
done and by whom.
More general information about the AEE can be obtained from the AEE report32 - there is also
relevant extracts from the Resource Management Act to be found in the reports’ Appendix 1.
6.2.5 Indigenous population (M. Krell)
The indigenous population of New Zealand are named Māori, or sometimes referred to by
themselves as Tāngata whenua. They came from the Polynesian islands in canoes and settled
in New Zealand in the 13th century. In 1840 the Treaty of Waitangi was negotiated between
the British Crown and northern chiefs. This made the Māori British subjects in return for a
guarantee of Māori property rights and tribal autonomy. Conflicts in the Māori and English
copies of the treaty resulted in a brief civil war in which much Māori land was confiscated by
the colonial power33.
The effect today is that the debate of what rights the Māori as a group actually have according
to the treaty is ongoing. For example 20% of all fishing quota are given directly to Māori34,
but a Māori claim to the rights of New Zealand’s foreshore and seabed was refused in 2004 in
favour of the Crown. This decision is however presently up for debate in parliament at the
moment, and will most likely result in some compromise between the Crown and the Māori.
The important issue is to be aware that the traditional rights of the Māori are at times unclear,
but that local Māori should be consulted when planning a project in order to avoid conflict.
Even though the rights may be unclear they still have a strong say in most matters35.
The Māori may however be a large asset instead36. The New Zealand government has an
ongoing process to finally settle all historical claims against the Crown by the Māori.
Settlements are done for each Iwi (tribe), and mostly end in financial compensation in cash
and/or Crown-owned property37. This means that the Iwis which have made settlements now
has financial power, and are mostly very keen on investing in their own area. For example the
Iwi on Chatham Islands are keen on investing in the wave power project there (CHIME)38.
Another example is the telecom company 2Degrees which is partially owned (~20%) by the
Māori trust Te Huarahi Tika.
Considering the relatively large economical value of wave power it should be rather easy to
get Iwi to take a positive side towards a possible project.
32
Ministry for the Environment (2006). A Guide to Preparing a Basic Assessment of Environmental Effects.
33
Wikipedia. Māori. (2010-09-15). Website.
34
The New Zealand Seafood Industry. Quota Management System (2010-09-15). Website.
35
Hopkins, Anthony, Crest Energy, 2010-11-05
36
Ericksen, Kris, Department of Conservation, 2010-11-17
37
Office of Treaty Settlements. What is a Treaty Settlement? (2010-01-06). Website.
38
Venus, Garry, Chatham Islands Marine Energy, 2010-11-05
23You can also read