Brazil country report - International experiences in designing and implementing renewable energy auctions for sub-Saharan Africa - Energy and ...
←
→
Page content transcription
If your browser does not render page correctly, please read the page content below
Brazil country report
International experiences in designing and
implementing renewable energy auctions for
sub-Saharan Africa
Energy and Economic Growth Research Programme
PO Number: PO00022908

July 2020

Maurício T. Tolmasquim, Tiago de Barros Correia and Natália Addas Porto,
Federal University of Rio de Janeiro
Contents
List of figures and tables 3
Acronyms and abbreviations 4
1. Introduction 5
2. Brazil overview 7
2.1. Brazilian power sector 8
 2.1.1. Introduction 8
 2.1.2. Power sector structure 12
 2.1.3. Tariff setting and financial sustainability 14
 2.1.4. Regulatory and policy framework 16
3. Renewable energy auctions 19
3.1. Auction design 22
 3.1.1. Auction demand 24
 3.1.2. Qualification criteria and process 26
 3.1.3. Bidder ranking and winner selection 29
 3.1.4. Buyer and seller liabilities 32
 3.1.5. Securing the revenue stream and addressing off-taker risk 34
3.2. Auction implementation 35
4. Results 37
5. Lessons learned and recommendations 42
5.1. Auction implementation 42
5.2. Auction design 43
6. Conclusion 45
7. Final thoughts 46
Appendix A: Analytical framework 47
References 49

 2

List of figures and tables
Figures
Figure 1: Contributors to the Brazilian GPD, December 2019............................................................................................. 7
Figure 2: Installed electricity generation capacity (MW), 2004–2019 .......................................................................... 13
Figure 3: Brazilian capital structure, 2019 ................................................................................................................................. 14
Figure 4: Brazilian distribution tariff setting mechanism ................................................................................................... 16
Figure 5: Brazilian regulatory framework .................................................................................................................................. 17
Figure 6: Brazilian auction scheme ................................................................................................................................................ 19
Figure 7: Lead time to commercial operation of the auction projects……………………………………………………..21
Figure 8: Auction process overview……………………………………………………………………………………………………..22
Figure 9: Auction stages………………………………………………………………………………………………………………………23
Figure 10: Auction demand: Centralised procurement ........................................................................................................ 25
Figure 11: First phase: Uniform-price auction ......................................................................................................................... 30
Figure 12: Second phase: Pay-as-bid auction ............................................................................................................................ 30
Figure 13: Preliminary phase for transmission dispute: Pay-as-bid auction ............................................................. 31
Figure 14: Continuous trade reverse auction (since 2017) ................................................................................................ 32
Figure 15: Accounts receivable scheme....................................................................................................................................... 35
Figure 16: Brazilian auction implementation scheme .......................................................................................................... 36
Figure 17: Brazilian auction outcomes: Contracted capacity............................................................................................. 37
Figure 18: Brazilian auction outcomes (MW): New capacity of RES .............................................................................. 37
Figure 19: Brazilian auction outcomes: Prices ......................................................................................................................... 38
Figure 20: PV power plants: Compliance with construction timetable ......................................................................... 39
Figure 21: Wind power plants: Compliance with construction timetable ................................................................... 39
Figure 22: Biomass power plants: Compliance with construction timetable ............................................................. 40

Tables
Table 1: Brazilian key economic indicators ................................................................................................................................. 8
Table 2: Key institutions in the Brazilian electricity sector ................................................................................................ 11
Table 3: Number of agents in the Brazilian electricity market, various years ........................................................... 12
Table 4: The Brazilian electricity sector, December 2019................................................................................................... 13
Table 5: PROINFA’s first-phase outcome .................................................................................................................................... 18
Table 6: Key auction information ................................................................................................................................................... 21
Table 7: The Brazilian auction basic design ............................................................................................................................... 24
Table 8: (Pre)qualification criteria ................................................................................................................................................ 26
Table 9: Brazilian price caps in 2018 and 2019 ....................................................................................................................... 29

 3

Acronyms and abbreviations
ACL Ambiente de Contratação Livre (non-regulated market of energy)
ACR Ambiente de Contratação Regulada (regulated market of energy – captive consumers
 supplied by the distributions companies)
ANEEL Agência Nacional de Energia Elétrica (Brazilian National Electricity Agency)
BNDES Banco Nacional de Desenvolvimento Econômico e Social (Brazilian Development Bank)
CONAMA Conselho Nacional do Meio Ambiente (body to establish the directives of the
 permitting process)
CAPEX Capital expenditure
CCEE Câmara de Comercialização de Energia Elétrica (new Brazilian market operator that
 replaced MAE)
CMSE Comitê de Monitoramento do Setor Elétrico (Electricity Sector Monitoring Committee)
CNPE Conselho Nacional de Política Energética (National Council for Energy Policy)
EPE Empresa de Pesquisa Energética (Energy Research Office – the federal body
 responsible for energy planning and the prequalification of registered projects)
GDP Gross domestic product
IBAMA Instituto Brasileiro do Meio Ambiente e dos Recursos Naturais Renováveis (Brazilian
 National Environmental Agency)
IPP Independent power producer
MAE Mercado Atacadista de Energia (Brazilian first market authority that was replaced by
 CCEE)
MCO Marginal cost of operation
MMA Ministério do Meio Ambiente (Ministry of Environment)
MME Ministry of Mines and Energy
ONS Brazilian Independent System Operator
PDE Plano Decenal de Expansão de Energia (ten-year energy expansion plan)
PPA Power purchase agreement
PROEOLICA Programa Emergencial de Energia Eólico (wind power plant programme)
PROINFA Programa de Incentivos às Fontes Alternativas de Energia Elétrica (alternative energy
 programme)
PV Photovoltaic
RES Renewable energy sources
SELIC Sistema Especial de Liquidação e de Custódia (Special System for Settlement and
 Custody)
SPV Specific purpose vehicle
WACC Weighted average cost of capital
WPE Wind Power Energia

 4
1. Introduction
The development of renewable energy sources (RES) in Brazil was the outcome of the public
policies and regulatory reforms implemented during the 1990s and 2000s. The Brazilian
government launched the first institutional reform in 1995 to restore investment capacity and
attract private capital to the power sector, after severe hyperinflation and fiscal crises in the
1980s.
The institutional model designed in 1995, however, was not able to guarantee security of
supply, and Brazilian consumers had to endure rationing of energy in 2001. Consequently, on
15 March 2004, the federal government approved Act 10.848, which started the second
institutional reform of the Brazilian energy system, with four explicit aims (Tolmasquim,
2014): guarantee security of energy supply and resource adequacy in investment; ensure fair
and cost-reflective tariffs; reintroduce central planning to cope with demand growth (indicative
for generation expansion and determinative for transmission expansion); and build a stable
regulatory framework.
Regarding security of supply and the fairness of tariffs, the second reform promoted the use of
energy auctions as the primary mechanism to procure energy and capacity with a long-term
focus.
The first auction concluded under the framework of the second institutional reform, realised on
12 December 2004, procured energy from existing power plants. The auction acquired 1 192.7
TWh at an average price of US$23.12/MWh. The total amount transacted, considering the 8-
year duration of the contracts, surpassed US$27.5 billion.
The first procurement for greenfields projects was performed on 16 December 2005, with 30-
year contracts for hydropower plants and 15-year contracts for thermal power plants, including
biomass. For this first auction the lead time was three, four and five years for both technologies.
The outcome was the acquisition of 564 TWh at the average price of US$53.16/MWh. The total
amount transacted, considering the duration of the contracts, surpassed US$29.9 billion.
These two first auctions laid the foundation for implementing methodology and designing the
Brazilian auction programme.
Between December 2004 and October 2019, the Brazilian programme performed 82 rounds and
contracted 9.571 TWh of energy (Table 6). Regarding only new power plants, the amount of
contracted energy was 8.180 TWh, adding 105.2 GW, 76.8 GW of which were from RE (see
Figures 17 and 18). The success of the Brazilian auction programme depended to a large extent
on the attention given by the public authorities to the design of the auctions, including the
regulatory framework and the implementation process. In fact, since 2004, the auctions have
been performed following the same rules and structure, with only minor adjustments in
contractual clauses and in the bidding mechanism to mitigate the risk of connection delays.
Brazil’s experience highlights the importance of considering three main goals when designing
auctions. First, auctions must be attractive enough to investors to generate competition and to
achieve optimal prices. Second, the auction design must ensure the commitment and reliability
of the bidders and their technical and financial capability to build projects on schedule and
deliver the promised energy. Third, the auction design should ensure the acquisition of the right
mix of energy sources to safeguard the security of the electric system (Viscidi & Yépez, 2020).
To improve the attractiveness of the auctions, the public authorities provided comprehensive
information about the auction programme, schedule and technologies through a 10-year power
system expansion plan, including generation and transmission.

 5
The bidding stage of the auction is preceded by a qualifying phase to ensure the commitment
and reliability of the bidders. Developers must provide the land use rights and the preliminary
environmental permit necessary to develop their projects and demonstrate technical and
financial capability to build projects on schedule and deliver the promised energy. Bidders must
also provide a bid bond before joining the bidding stage of the auction, and winners must
provide surety and performance bonds before contract signing.
To ensure energy security and the optimal mix of sources, the Brazilian auctions procure energy
using both technology-neutral and technology-specific auctions. Reserve capacity is also
procured by public auctions, using the same scheme and methodology developed for energy
procurement.
The following sections provide an introduction to Brazil and its power sector; a description and
analysis of the Brazilian auction design, including auction volumes, qualification criteria and
processes, bidder ranking and winner selection, buyer and seller liabilities and approaches to
project derisking and credit enhancement; a reflection on the key lessons learned with the
Brazilian experience; and some conclusions.

 6
2. Brazil overview
Brazil is South America’s largest country, and the fifth largest in the world, covering over 8
million km². With a Gross Domestic Product (GDP) of US$2.020 billion in 2019 (Table 1 and
Figure 1), and 210.15 million inhabitants, Brazil was the ninth largest economy in the world
before the COVID-19 pandemic. However, the Brazilian economy had been struggling with a
lack of dynamism since 2014: GDP grew by 0.5 per cent in 2014; contracted by 3.55 per cent
and 3.28 per cent respectively in 2015 and 2016; grew by 1.32 per cent in 2017 and 2018, and
by 1.14 per cent in 2019. The unemployment rate rose from 6.4 per cent in January 2014 to
13.7 per cent in March 2017.

Figure 1: Contributors to the Brazilian GPD, December 2019

 3.1%
 7.0%

 4.9%
 Industry and construction
 31.3%
 5.0% Finance, real estate and services
 Public services
 Trade
 11.2% Transport
 Agriculture
 Energy, comunication and utilities
 Other
 12.0%

 25.5%

Source: Brazilian Central Bank (www.bcb.gov.br, accessed June 2020)

Interest rates (Special System for Settlement and Custody/Sistema Especial de Liquidação e de
Custódia, or SELIC1) and inflation have been on a downward trajectory since 2016. In April
2020, the annual consumer price index was 2.4 per cent, below the target of 2.5–5.5 per cent
and considerably lower than the 10.67 per cent recorded in December 2015 (Table 1). The
SELIC dropped from 14.25 per cent in December 2015 to 3 per cent in May 2020.

1
 The central bank/interbank lending rate.

 7
Table 1: Brazilian key economic indicators
 December 2015 December 2019 April 2020
 Population 203.48 million 210.15 million -
 GDP US$1.802 billion US$2.020 billion -
 GDP annual variation -3.55% 1.14% -
 GDP per capita US$8.856 US$9.612 -
 Unemployment rate (%) 8.9 11 12.6
 Consumer price index (%) 10.67 4.31 2.4
 Basic interest rate (%) 14.25 4.5 3.75
 Corporate tax rate (%) 34 34 34
 Sale tax rate (%) 17 17 17
 Social security rate for companies 28 28 28
 (%)
 Social security rate for employees 11 11 11
 (%)
Source: Brazilian Central Bank (www.bcb.gov.br, accessed June 2020)

2.1. Brazilian power sector
2.1.1. Introduction
The Brazilian power sector was initially dominated by state-owned companies. The distribution
service was provided by monopolist companies owned by local state or municipal governments.
Generation and transmission were mainly supplied by the subsidiaries of the federal company
Eletrobras, 2 and by companies owned by the state-level governments of São Paulo, Minas
Gerais, Goiás and Paraná (Companhia Energética de São Paulo, or Cesp; Companhia
Energética de Minas Gerais, or Cemig; Companhia Energética de Goiás, or Celg; and
Companhia Paranaense de Energia, or Copel, respectively). Eletrobras was responsible for
planning the expansion of transmission and power generation and the dispatch of power plants.
The federal government retained the exclusive authority to enact electricity sector legislation
and was responsible for calculating end-user tariffs.
The state-led model worked well until the second oil shock in 1979 and the deepening of the
Brazilian fiscal and hyperinflation crisis during the 1980s. In fact, between 1970 and 1995,
installed capacity had grown by 435 per cent. Still, the power companies lost their financial
health and investment capability due to the tariff control imposed by the federal government to
reduce the impact of inflation.
To restore the investment capacity and attract private capital to the power sector, the Brazilian
government launched the first institutional reform in 1995, with the following goals (World
Bank Group: Energy and Extractives, 2012):
 • Electricity generation, transmission, distribution, and trading/marketing should
 be unbundled into separate segments;
 • Electricity generation should become a competitive activity at the risk of the
 Independent Power Producers (IPP), with prices set by the market;
 • Large consumers should be allowed to buy energy freely in the market;
 • The transmission utilities should remain as a natural monopoly, with regulation
 ensuring open access to generators, distribution companies, free consumers and
 other transmission utilities;

2
 Furnas, Chesf, Eletronorte, Eletrosul, Eletronuclear and Itaipu.

 8
• The distribution companies should also be treated as a natural monopoly and
 should remain responsible for providing distribution services with open access
 to free consumers and for buying energy from IPPs to supply their regulated
 customers;
 • An independent regulator would serve as a watchdog for the market, interpreter
 of specific legislation and guarantor of the stability of rules;
 • Boosting supply as an investment opportunity must be left to the market
 agents.
The institutional reform was only completed in 1997 when Congress approved the legal
framework 3 that creates the National Electricity Agency (Agência Nacional de Energia
Elétrica, or ANEEL), the Independent System Operator (ONS) and the Wholesale Energy
Market Authority (Mercado Atacadista de Energia, or MAE).
According to the initial model, large consumers could sign power purchase agreements (PPA)
directly with the IPPs or energy traders. In contrast, the other consumers remained supplied by
the local distribution company under a regulated tariff defined by ANEEL.
The signed contracts, both by free consumers and distribution companies, had to be registered
with the MAE. Any deficit between what was contracted through PPAs and what was consumed
needed to be bought by free consumers and distribution companies on the spot market at the
marginal cost of operation (MCO) calculated by the ONS.
The ONS was also responsible for the dispatch of power plants (considering the MCO in a tight
pool4 approach), planning for the expansion of the transmission grid and granting grid access
to consumers and producers.
The Brazilian Ministry of Mines and Energy (MME) remained responsible for providing
general guidance on sector regulation and granting concession contracts to large hydropower
plants, transmission lines and privatised distribution companies.
New transmission utilities were auctioned as public–private partnership concessions based on
a Build, Operation and Transfer model, and every new concession of a transmission utility was
established as a specific purpose vehicle (SPV).
The institutional model designed in 1995 was not able to guarantee security of supply. In April
2001, the central hydropower plants’ reservoir levels had dropped to around 32 per cent of their
maximum capacities, with energy deficit risks topping 15 per cent, 10 percentage points higher
than the acceptable threshold of 5 per cent.
On 1 June 2001, the government was forced to decree electricity rationing in Southeast, Centre-
West, North and Northeast Brazil. The government established consumption quotas as the main
rationing mechanism. In parallel, government also surcharged consumers for excess
consumption, introduced bonuses for residential consumers whose energy use fell below their
targets, and scheduled power cuts for residential consumers exceeding their quotas. The
rationing resulted in total electricity consumption shrinking by 25 per cent. Residential
consumption fell by 13 per cent and remained at this level during the following years, while

3
 Acts 9.074, 9.427 and 9.648.
4
 In the tight pool model, the dispatch is centralised and based on predetermined variable costs. For comparison,
in the loose pool model, the dispatch is centralised, but the generators are free to offer any price they like; such an
approach is also referred to as price-based pools. Finally, the dispatch can be decentralised and entirely based on
price.

 9
self-production increased from 7.5 per cent to 10.5 per cent of consumption in six months
(Hermes de Araújo et al., 2008).
In the same year, the government set up a commission to identify the structural and contextual
causes of the imbalance between energy supply and demand. As the commission noted, the
power sector institutions could have addressed the vulnerability of the Brazilian power system
earlier, as this system had been teetering on the verge of collapse since 1999. Adverse
hydrology merely precipitated the energy crisis, which was entirely foreseeable under the
circumstances in place at that time. The main factor behind Brazil’s electricity crisis was the
delay in the start-up of operations of power generation and transmission projects, together with
the absence of new generation companies.
Indeed, the main reasons for the rationing were that the installed capacity did not follow the
energy demand growth. The economic signal provided by the spot market in a hydro system
with big reservoirs was too risky for investors who depend only on the spot market revenue.
Most of Brazil’s electricity is supplied by large hydroelectric plants. Unlike coal, oil or gas
plants, their cost of operation is practically zero. Thermal plants play an essential role in
complementing the water system, but not in competing with it. While the market would happily
accept and pay a reasonable price for the production of new natural gas plants in the dry season,
a ‘wet’ year would see little demand for gas generation, and the price paid for electricity would
remain at a low level.
In short, building gas plants would be like making a climate-based bet for the next decade.
Three rainy years in a row and the project would be bankrupt. Considering this, the lack of
investment in Brazil is not a mystery. State-owned companies had their investments restricted
due to a federal budget deficit and private companies considered the risks too high and the
profits too low.
The experience built up by Brazil during its rationing crisis in 2001 underscored the need to
modify the market design of the Brazilian power sector. The absence of long-term PPAs was
too risky for private capital.
Consequently, on 15 March 2004, the federal government approved Act 10.848, which started
the second institutional reform of the Brazilian energy system, with four explicit aims
(Tolmasquim, 2014): guarantee security of energy supply and resource adequacy in investment;
ensure fair and cost-reflective tariffs; reintroduce central planning to cope with demand growth;
and build a stable regulatory framework.
Regarding security of supply and the fairness of tariffs, the second reform of the Brazilian
energy system promoted (Correia et al., 2006):
 • The segregation of the regulated market (Ambiente de Contratação Regulada, or
 ACR) into one where distribution companies procure energy contracts to supply
 the captive consumers, and a free market (Ambiente de Contratação Livre, or
 ACL) where IPPs, energy traders and free consumers can transact energy;
 • The use of an auction scheme to procure energy for the ACR;
 • The use of long-term contracts in the ACR to reduce price volatility and enable the
 use of accounts receivable arrangements as collateral for project financing
 (seeFigure 15;
 • The obligation of contractual coverage by distributors and free consumers, leaving
 the spot market only for imbalances;

 10
• The obligation to back all contracts with firm energy (physical coverage5) certified
 by the Brazilian MME to each power plant. In practice, the contracts must indicate
 the power plants that will produce the energy and be limited to the firm energy
 certified by the MME for each power plant. This avoids the situation in which a
 plant sells more energy through bilateral contracts than it can produce given a
 certain risk level established by governmental regulation.
The second reform also restored central planning and the role of the MME in the oversight of
the sector, with the creation, in 2004, of the Electrical Sector Monitoring Committee, and of
the Energy Research Office (Empresa de Pesquisa Energética, or EPE) to support MME with
energy planning. The ONS retained the responsibility for short-term planning in transmission.
Finally, to improve the regulatory framework, the reform replaced the MAE with a new market
operator (Câmara de Comercialização de Energia Elétrica, or CCEE) with more robust and
more transparent governance and under the direct oversight of ANEEL (Table 2).

Table 2: Key institutions in the Brazilian electricity sector
 National Council for The CNPE is the council of ministries (Mines and Energy, Foreign Affairs,
 Energy Policy (CNPE) Economy, Infrastructure, Agriculture, Science and Technology, Environment,
 Regional Development, Security Office and president of the EPE) and
 representatives of states, civil society and university that advise the president of
 the Republic in the formulation of energy policies.
 Electricity Sector The CMSE is formed by representatives of the MME, ANEEL, ONS and CCEE and
 Monitoring Committee is responsible for monitoring energy security.
 (CMSE)
 Brazilian Ministry of The MME is responsible for designing policies and ensuring the adequacy of
 Mines and Energy (MME) energy supply, setting goals for universal electricity access and greenhouse gas
 emissions, and long and medium-term central planning.
 Brazilian National ANEEL is responsible for regulating the entire value chain of the electricity sector,
 Electricity Agency (ANEEL) including tariff and rate setting for distribution and transmission services and the
 approval of the ONS annual budget. ANEEL is also responsible for generation and
 transmission auctioning. The board of ANEEL is composed of 5 directors, all
 appointed by the Brazilian president and confirmed by the Senate.
 Brazilian Independent The ONS is responsible for granting grid access for producers and users, for short-
 System Operator (ONS) term planning, for determining reinforcements and improvements in
 transmission assets, subject to ANEEL’s approval, and for dispatching power
 plants according to the merit of cost and transmission constraints. Five directors
 compose the board of the ONS, 3 indicated by the MME and 2 elected by the
 IPPs and transmission agents.
 Brazilian Market Authority The CCEE is responsible for measuring the generation and consumption of each
 (CCEE) agent in the market, including the losses in the grid, for identifying contractual
 imbalances, and for clearing the market at the spot price. The CCEE is also
 responsible for the management of sectorial charges and funds used for
 fostering renewable sources and for subsidising low-income and rural customers
 supplied by distribution companies in the regulated market. The board of the
 CCEE is composed of 5 directors, the chairman indicated by the MME and 4
 elected by the IPPs, the distribution companies, the free consumers and the
 energy traders.

5
 In Portuguese, garantia física. It refers to the expected generation of energy that the power plant will be able to
provide under critical conditions, especially regarding the seasonality and variability of RE sources.

 11
Brazilian Energy Research The primary role of the EPE is to support the MME with studies and research on
 Office (EPE) long and medium-term energy and transmission planning. The ONS retains
 responsibility for short-term transmission planning.
 Brazilian National IBAMA is responsible for the social and environmental licensing of generation
 Environmental Agency and transmission projects with national impact. State-level agencies license
 (IBAMA) projects with local impact.
 Independent Power As a general rule, the IPPs are subject only to technical regulation regarding
 Producers (IPPs) standards for operation and dispatch and the social and environmental
 conditions for licensing. Large hydropower plants, however, need a concession
 grant to exploit the generation potential of the rivers.
 Transmission SPVs The transmission SPVs are responsible for building, operating and, at the end of
 the concession contract, transferring the transmission assets auctioned by
 ANEEL, as well as providing the investment in the reinforcements and
 improvements requested by the ONS and approved by ANEEL.
 Distribution companies The distribution companies are responsible for building, operating and, at the
 end of the concession contract, transferring distribution assets in their service
 area, and for contracting energy through the auctions of the ACR to supply their
 regulated customers.
 Energy traders The energy traders are agents that buy energy from IPPs to resell to free
 consumers.
 Free consumers The free consumers are large users of electricity that choose to procure their
 energy in the ACL, contracting with energy traders or IPPs. Once the choice for
 the ACL is made, free consumers must remain in the open market for at least 5
 years.
Source: Authors’ compilation

2.1.2. Power sector structure
The second sectorial reform was successful in creating a buoyant market with an increasing
number of agents, especially IPPs, energy traders and free consumers (Table 3).

Table 3: Number of agents in the Brazilian electricity market, various years
 Year 2000 2005 2010 2019
 Independent power producers 17 87 290 1 488
 Energy traders 5 47 93 341
 Free consumers 0 470 940 7 057
 Self-producers 0 14 34 76
Source: CCEE (www.ccee.org.br, accessed June 2020)

The energy supply mix had also evolved, from a system strongly dependent on sizeable
hydropower plants with a relatively small nuclear and fossil complement, to a system with deep
penetration of wind, biomass and solar (Table 4 and Figure 2).

 12
Table 4: The Brazilian electricity sector, December 2019
 GW %
Total capacity 174.02 100
Large hydro 102.99 59.2
Wind 15.59 9.0
Gas 15.56 8.9
Biomass and waste 15.15 8.7
Oil 8.59 4.9
Small hydro 6.10 3.5
Coal 3.20 1.8
Solar photovoltaic (PV) 2.89 1.7
Nuclear 1.99 1.2
Others 1.96 1.1
 Urban electricity access rates 99.96%
 Rural electricity access rates 98.20%*
 Peak demand 85.97 GWh/h
Note: * This value includes both on-grid and off-grid supply solutions.
Source: ANEEL (www.aneel.gov.br, accessed June 2020) and EPE (www.epe.gov.br, accessed June 2020)

Figure 2: Installed electricity generation capacity (MW), 2004–2019

 200 000
 180 000
 160 000
 140 000
 120 000
 100 000
 80 000
 60 000
 40 000
 20 000
 0
 2004 2005 2006 2007 2008 2009 2010 2011 2012 2013 2014 2015 2016 2017 2018 2019

 Nuclear Coal Oil Natural gas Biomass Large hydro Small hydro Wind Solar

Source: EPE (www.epe.gov.br, accessed June 2020)

The capital structure remained mixed, with state-owned and private companies competing in
all activities and the private sector focused on new capacity investment rather than on the
privatisation of state-owned companies (Figure 3).

 13
Figure 3: Brazilian capital structure, 2019

 Generation Distribution Transmission
 3.4% 2.4%

 14.8%
 24.4% 33%

 72.2% 67%
 82.8%

 Private Private
 Private
 Public
 Public - Federal Public - State-level
 Public - State-level Cooperatives

Source: ANEEL (www.aneel.gov.br, accessed June 2020)

2.1.3. Tariff setting and financial sustainability
During the 1980s, in an effort to control hyperinflation, distribution tariffs were kept at
artificially low levels. Still, since the state-level government owned most distribution
companies, the Federal Treasury covered the deficit and financial losses of the companies. The
burden of supporting inefficiently operating companies was thus borne by the Brazilian
taxpayers (World Bank Group: Energy and Extractives, 2012).
In 1993 the regulation was revised to improve the financial health of the transmission and
distribution companies. Under the new regulatory framework, the transmission and distribution
tariffs were defined in the concession contracts and became cost-reflective.
The transmission tariff is set by the winning bid in the transmission auction, while the
distribution tariff is determined by the Brazilian Regulatory Agency considering a benchmark
methodology to identify efficient levels of operational expenditure and capital expenditure
(CAPEX). The price of the energy is passed through to end-users, according to the winning bid
in the regulated energy auction or the contractual price in the free market.
Furthermore, the contracts also stipulate periodic and extraordinary tariff review mechanisms
and the tariffs are indexed to Brazilian inflation and may be reviewed in the case that the ONS
and ANEEL request investment in reinforcement and improvement of the assets. ANEEL must
approve the value of the investment and the weighted average cost of capital (WACC)6 that
will be applied to remunerate the transmission and distribution companies’ CAPEX. The
WACC rate set in 2020 is 7.32 per cent per year.
Currently, electricity distribution is performed by 53 concessionaires, including public and
private companies. Electricity distribution concessionaires cannot develop any activity relating

6
 The WACC is the rate that a company is expected to pay on average to all its security holders to finance its assets.
It is calculated as a weighted average cost of debt and equity. In general, WACC is used in financial modelling as
the discount rate to calculate the net present value of a business/asset. Currently, the WACC applied to the
distribution and transmission sectors, respectively, is 7.32 per cent per year and 6.96 per cent per year, after tax.

 14
to power generation, transmission or energy trading. In addition, they can only acquire energy
through auctions based on the lowest price and sell energy to captive power consumers under
the tariff set by ANEEL.
The distribution tariff has two parts: Components A and B (Figure 4). Component A
encompasses the costs of transmission, the energy contracts and sectorial charges 7 and is
entirely passed through to consumers, since their costs, under the Brazilian regulation
framework, are not manageable by the distribution companies. Component B embodies the
distribution operation and maintenance costs, the remuneration and depreciation of
investments, and the regulatory rate for losses and delinquency. ANEEL determines
Component B according to a price-cap model that considers annual inflation, the expected
efficiency savings (factor X) and benchmarks for efficiency for each kind of cost.

7
 The sectoral charges are meant to subsidise RE and low-income customers and to finance public policies:
 • Energy Development Account (CDE): to (i) subsidise energy generated from wind, small hydropower,
 biomass and coal; (ii) ensure universal access to electricity; and (iii) subsidise low-income and rural
 customers.
 • Fuel Consumption Account (CCC): covers fuel costs of thermal power generation in stand-alone systems.
 • Electricity Services Inspection Fee (TFSEE): to fund the operation of ANEEL.
 • Alternative Electricity Sources Incentive Program (PROINFA): a feed-in-tariff programme that
 contracted RE sources in 2004, before the introduction of the auctions.
 • Financial Compensation for the Use of Hydro Resources (CFURH): to compensate the federal
 government, the states and the municipalities affected by water use and the loss of productive land caused
 by flooding areas required to form the reservoirs needed by hydropower plants.
 • Research and development (R&D) and energy efficiency: encourage scientific and technological research
 related to the power sector. Concessionaires and permit holders engaged in public electricity distribution
 services must allocate a percentage of their net operating revenues each year to R&D of power sector and
 energy efficiency programmes for both supply and demand.
 • Energy Reserve Charge (EER): cover the costs of contracting reserve energy.
 • System Services Charge (ESS): cover the costs incurred due to: (i) operating constraints; (ii) rendering
 ancillary services; and (iii) energy security.
In addition to the sectorial charges, the distributor also pays to cover the costs of the ONS and CCEE.

 15
Figure 4: Brazilian distribution tariff setting mechanism

Source: ANEEL (www.aneel.gov.br, accessed June 2020)

This approach ensured the financial health of the sector agents, especially the distribution
companies that, in the Brazilian model, are the main off-takers of energy. According to the
ANEEL oversight, in March 2019, 39 distribution companies (74 per cent) had good and
acceptable levels of economic and financial sustainability and 14 had negative EBITDA
(earnings before interest, taxes, depreciation and amortisation).

2.1.4. Regulatory and policy framework

2.1.4.1. Regulatory framework
The power sector regulatory framework is given by a set of laws, decrees and resolutions issued
by the National Congress, Presidency, MME and ANEEL. Over the past few years, the
Brazilian electricity sector has undergone structural changes in its regulation. The objective has
been the establishment of a model that would promote economic efficiency through the
competitive environment, especially in the generation sector, which would make investments
in the expansion of installed capacity feasible and guarantee service to the consumer market.
Figure 5 illustrates the organisations and institutions of the Brazilian power sector.

 16
Figure 5: Brazilian regulatory framework

Source: Authors’ compilation

EPE deserves special mention as one of the most important institutional innovations of the new
regulatory framework. Brazil’s government determined that it was necessary to have an
institution based on knowledge and technical excellence, with permanent high-level
professional staff, tools and a database suitable for the formulation of energy policies and
decision support. EPE is a federal body, created by Act 10.847 on March 2004, mainly
responsible for energy planning. EPE develops 10-year plans (Plano Decenal de Expansão de
Energia, or PDE), periodic bulletins, reviews, reports and specific studies based on government
guidelines. The PDE indicates government’s expectation about energy expansion according to
an integrated view for all relevant energy sources and synergies with other economic sectors.
The PDE also prioritises transmission facilities to be considered by MME to participate in
transmission auctions. The EPE also provides a range of analyses and reports on energy
statistics, energy efficiency and socio-environmental studies (including environmental
feasibility and sustainability of electricity and gas production and transmission sources, energy
resource inventory and prospection for the preliminary environment licensing process of
strategic hydropower and transmissions projects).

2.1.4.2. Policy framework
The first incentive for RE dates back to 1996 and is still in force. Act 9.427 established a 50
per cent discount in transmission and distribution system tariffs for RE. All other energy sources
and consumers offset this cross-subsidy.
The first attempt to implement public policies with explicit targets for RE was the wind power
plant programme (Programa Emergencial de Energia Eólico, or PROEOLICA). It was
designed in 2001 to hire 1 050 MW of wind power plants until December 2003 using a feed-
in-tariff approach. The PROEOLICA was, however, never implemented.

 17
In 2002 Congress approved the alternative energy programme PROINFA (Programa de
Incentivos às Fontes Alternativas de Energia Elétrica) – also a feed-in tariff policy, aimed to
acquire, in its first phase, 3 300 MW of RE (1 100 MW each from wind, biomass and small
hydropower plants) under 20-year PPAs. The first phase was implemented in May 2004 and a
total of 6 600 MW responded to the government call for projects (3 681 MW from wind, 995
MW from biomass and 1 924 MW from small hydropower plants). The projects were selected
according to the age of their environmental licences and the unmet power of biomass was
redistributed among the other sources (Costa, 2006). Table 5 illustrates the outcome of
PROINFA’s first phase.

Table 5: PROINFA’s first-phase outcome
 Source Capacity Price
 Wind 1 422.92 MW US$65.94/MWh
 Small 1 191.24 MW US$37.76/MWh
 hydro
 Biomass 685.24 MW US$30.25/MWh
 Total 3 299.40 MW
Source: Costa (2006)

PROINFA also provided for a second phase where alternative RES should serve 15 per cent of
the annual increase in electricity consumption. Over a 20-year horizon, these sources would
represent 10 per cent of the total electricity consumption. However, because of the power sector
reform, the government decided not to implement the second phase. Instead, it decided to
replace the feed-in tariff policy with regulated auctions (presented in detail in the next section).
In 2016 the Brazilian government committed to increasing the share of non-hydro renewable
sources in its power supply mix from 9 per cent in 2014 to 24 per cent in 2030. To that point,
the government had not disclosed any Nationally Determined Contribution implementation
plan for energy. However, the continuity of the auctions will allow the country to achieve the
chosen target quickly. As shown in Table 4 and Figure 2, the installed capacity of wind, solar
PV and biomass is already around 19 per cent, and the 10-year energy expansion plan indicates
that including distributed PV, they will achieve 34 per cent in 2029.

 18
3. Renewable energy auctions
The Brazilian auction programme was created by Act 10.848 with the objective to provide an
efficient, transparent and competitive instrument for the awarding of long-term PPAs for
captive consumers supplied by the distribution companies. Since 2005 all the energy contracts8
in the ACR have been secured through an auction scheme prioritising the procurement of
greenfield projects to meet demand growth.9 The auctions have been designed to provide long-
term contracts to new power plants and facilitate their financing through project finance, where
lenders provide loans based on the projected cash flows of the project rather than on the balance
sheets of its sponsors.
There are five types of energy auctions: greenfield auction, reserve auction, renewable source
auction, existing power plant auction and adjustment auction (Figure 6).

Figure 6: Brazilian auction scheme

Source: Authors’ compilation

Greenfield auction: The greenfield project auction aims to meet the increase in distributors’
power demand by contracting energy from plants that have yet to be built. This auction can be
of two types: A-6 (plants that go into commercial operation in up to 6 years’ time) and A-4 (in
4 years). The winners of the auction sign contracts with the distribution companies that are
procuring energy. Only the consumers from the regulated market pay for this energy. The

8
 The electricity commercialisation contract in the regulated market is a bilateral contract for the purchase and sale
of electric energy and its associated capacity, signed between the selling company and the distribution company
within the scope of the regulated market, as a result of auctions of electricity from existing generation plants and
greenfield plants. In other words, there are not any separate tenders to contract energy and capacity in Brazil. That
situation can be explained by the large number of hydropower plants within the power system. With the increase
of run-on-river hydropower plants and variable renewable sources, capacity is becoming an issue and the
government has started discussing the possibility of running capacity-only auctions.
9
 Originally, the auctions for new projects had a lead time of 5 or 3 years and lasted between 15 and 30 years.

 19
Brazilian government has implemented 31 rounds of greenfield project auctions, with 30 rounds
specifically for RE.10
Reserve auction: The contracting of reserve energy was originally created to increase security
in the electricity supply in the National Interconnected System, with power from greenfield or
existing plants specially contracted for this purpose. So far, reserve auctions have only
contracted greenfield plants. CCCE act as a single buyer and sign contracts with all the winners
of the auction. Reserve energy is accounted for and settled on the short-term market operated
by the CCEE. This type of ‘insurance’ in the energy supply generated the Reserve Energy
Charge intended to cover these costs – including administrative, financial and tax costs. As the
reserve auction works as an insurance for all of the power system, the energy charges apply to
all the consumers from the regulated and free market. The Brazilian government has
implemented 9 rounds of reserve auctions, the last in 2017.
Renewable energy auction: The auction of renewable sources was instituted to meet the growth
of the market in the regulated environment and increase the share of renewable sources – wind,
solar, biomass and energy from small hydroelectric plants – in the Brazilian energy system. In
the last years, the government has been using only greenfield auctions to procure new RE plants.
The Brazilian government has implemented 3 rounds of special auctions for RES, the first in
2007 and the last in 2015.
Existing power plant auction: This auction was created to contract energy generated by plants
already built and in operation, whose investments have already been partially or fully amortised
and, therefore, have a lower cost. The separation of the existing and greenfield energy auctions
allowed the average price in the regulated market (ACR) to be calculated apart from the
marginal expansion cost, thus contributing to fair electricity rates. Moreover, this offered
distribution companies the possibility of signing agreements with the existing generation
companies for shorter lead times and durations as a risk management tool designed to offset
uncertainties in demand and the loss of free consumers. Finally, this separation prevented the
existing plants from squeezing new plants out of the picture in the regulated market, thus
helping ensure energy security. In total, 21 rounds of existing power plant auctions have been
implemented, 19 with specific products for RES.
Adjustment auction: This auction aims to adjust the distributors’ energy contracting, addressing
any deviations arising from the difference between forecasts made by distributors in previous
auctions and the actual demand growth. As a result of this auction, the distribution companies
sign short-term contracts (from 3 months to 2 years) with the auction winner. Seventeen rounds
have been implemented since 2005, none with specific products for RES.
Auctions to procure greenfield power plants, reserve energy and RES usually have a lead time
to commercial operation of between 3 and 6 years. Project developers are awarded 15- to 30-
year fixed tariff contracts (Figure 7).

10
 RE includes all renewable energy sources, including large hydropower plants.

 20
Figure 7: Lead time to commercial operation of the auction projects

Source: Authors’ compilation
In short, the new regulatory framework was designed to foster vast amounts of investment in
the generation capacity expansion necessary to meet a fast-growing demand at the lowest cost
possible (Tolmasquim, 2014). Table 6 presents the key auction information.

Table 6: Key auction information
 Design Year of introduction 2005
 Frequency of 82 rounds (61 rounds with specific products
 auctions/rounds for RES)
 • 40 rounds for existing power plants, 21
 with specific products for RES*)
 • 30 rounds for greenfield projects,
 including the special rounds for the
 hydropower plants of Santo Antonio,
 Jirau and Belo Monte (28 rounds with
 specific products for RES)
 • 3 rounds for only RES power plants
 • 9 rounds for reserve energy (all with
 specific products for RES)
 Currency Brazilian Reais (indexed to local inflation)
 Implementation Policy and regulation Ministry of Energy and Mining
 guidelines
 Regulator ANEEL
 Procurer CCEE delegated by ANEEL
 Off-taker Distribution companies and the CCEE, in the
 case of reserve energy
 Outcomes New MW procured† 105.228 MW (76.862 MW from RES)
 Technology procured Oil, coal, natural gas, wind, solar, biomass,
 small hydro and large hydro
Note: * Only large and small hydropower plants. † Greenfield, RES and reserve auctions.
Source: Authors’ compilation

 21
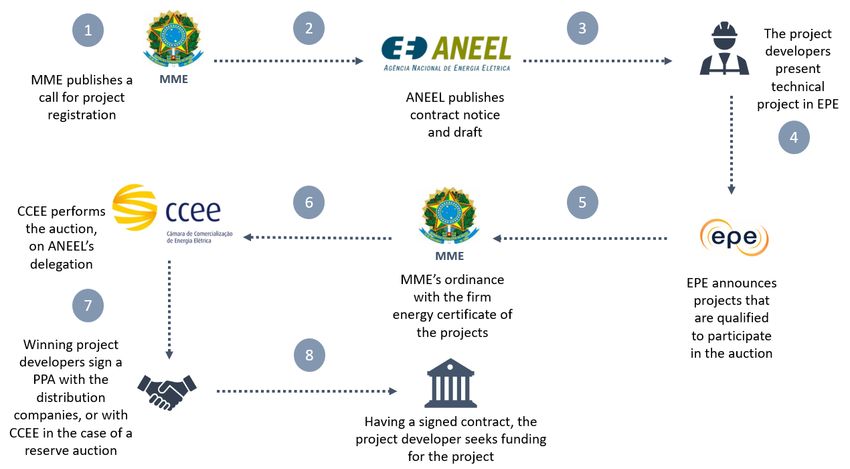
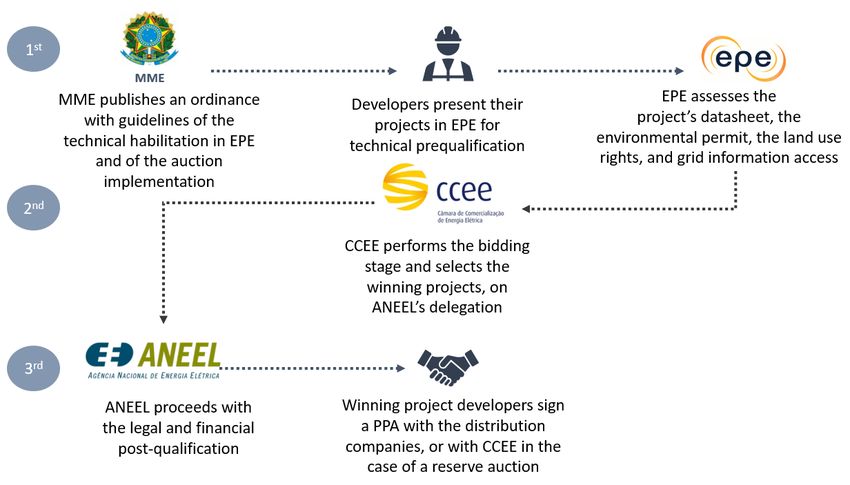
3.1. Auction design
The energy auctions in Brazil are conducted annually according to a schedule released by
MME. The auction process is led by ANEEL under the guidelines of the MME. An auction
committee undertakes the main auction tasks, which are distributed among different institutions
(EPE, CCEE, ANEEL, MME). Once an auction is concluded, the winning generator companies
sign contracts directly with distribution companies, or with the CCEE in the case of a reserve
auction (Figure 8).

Figure 8: Auction process overview

Source: Authors’ compilation
The auctions have three stages (Figure 9): the first for registration and technical
prequalification; the second for bid submission and the winners’ selection; and a final stage for
the legal and financial qualification of the preferred bidders, performed by the regulatory
agency.

 22
Figure 9: Auction stages

Source: Authors’ compilation

The first and third stages aim to reduce the risk of failure in the implementation of the project
and they do not intend to rank the projects. The assessment of the required documents in stage
1 is proactive to ensure the participation of the largest possible number of projects in the bidding
phase (second stage). However, considering the large number of projects registered in Brazil
every auction, the qualification process was split, and the legal and economic documents of
preferred bidders are evaluated in stage 3 (see section 3.1.2). The second stage encompasses
the bidding and the winner selection processes (see section 3.1.3).
Since energy auctions have been regularly performed in Brazil, investors already have a
pipeline of projects planned and there is no need for a long notice period to respond to the first-
stage request for registration. Developers thus normally have a 30-day period during which they
must respond to the call for registration. The EPE has 80 days to evaluate the projects and
documents presented and to calculate the firm energy of each project.
In parallel, ANEEL opens a public consultation process for stakeholders to analyse the rules of
the auction11 and the draft contracts. Bidders have access to complete information about the
auction, including the final version of the rules and contracts, the price cap and the certified
firm energy requirement (physical guarantee). The information about the total demand for the
auction is not disclosed in advance in order to mitigate the risk of collusion.
Winners must secure all permits and licences, reach financial closure, complete the construction
of the power plant and connect it to the grid within the A-X period stipulated in the rules (see
Figure 7). During the construction period, the investor can change some of the technical
characteristics of their project. According to the rules of Brazil’s A-612 auction of 2019, for
example, it was possible to change the installed capacity, the turbine type and quantity of
generating units, and the connection point of the power plant. Technical changes must conform

11
 Including the detailed auction process, the price rule and the winners’ selection criteria.
12
 A-6 refers to the lead time of 6 years.

 23
to environmental permits, cannot modify the energy source initially indicated, and may not
compromise the fulfilment of contractual obligations assumed in the auction, such as the
amount of energy and capacity negotiated, the date of commencement and the duration of the
contract. Bidders in the 2019 auction were also allowed to complete the power plant
construction early, and sell energy in the Brazilian wholesale market. The auction rules made
it clear that all risks and costs associated with changes in the technical characteristics and the
plant’s commercial operations date were the exclusive responsibility of the seller and could not
be passed on to the buyers.
Energy auctions and contracts have evolved over the years. In the contracts for different sources
and products, different delivery obligations are designed, such as the determination of wind or
PV energy generation on an annual and 4-year basis. Risk allocations are also distinct between
auctions. In reserve energy auctions the risk of generation insufficiency is allocated to all
consumers while in new energy auctions (greenfield, RES) the risk is allocated to generators.
Table 7 shows the Brazilian auction basic design in 2019.

Table 7: The Brazilian auction basic design
 Periodicity Annually – usually 2 rounds per year
 Project preparation Bidders must secure social and environmental permits,
 land use rights and interconnection agreements to be
 allowed to register for bidding
 Stages
 Registration and qualification Evaluation of the required permits and documents
 Verification of physical coverage
 Bidding Hybrid price rule – pay-as-bid with uniform pricing
 (highest accepted bid)
 Auction demand
 Greenfield projects Decentralised – Distribution companies
 RES Decentralised – Distribution companies
 Reserve Centralised – MME
 Energy source Technology-specific or group of technologies
 Winner selection Only price
 Lead time Between 3 and 6 years
 Risks
 Seller Construction, operation, equipment performance risks and
 exposure to the spot market (in the case of the contract for
 energy – ‘quantity contract’)
 Buyer Inflation and exposure to the spot market, in the case of
 the contract for availability
 Liabilities
 Seller Bid bonds and surety and performance bonds
 Buyer Payment financial warranties
Source: Authors’ compilation

3.1.1. Auction demand
As noted, electricity demand is usually constrained by the availability of energy (MWh) and
not installed capacity (MW). The installed capacity is more than double the peak demand (Table
4) due to the seasonality and the stochasticity of the large hydro resources that dominate the
Brazilian supply mix. Therefore, auction volumes are defined in terms of energy.
In the greenfield and RES auctions, each distribution company has to project, on an annual
basis, the total amount of energy needed to supply their captive consumers for the next 3 to 6

 24
years (Figure 10). MME prepares the auction schedule based on this information. The Brazilian
government has, on average, performed at least 2 auctions for greenfield projects per year.

Figure 7: Auction demand: Centralised procurement

Source: Authors’ compilation

The reserve energy auctions are meant to ensure the resource adequacy and energy security of
the entire market and are conducted less frequently. The MME determines the demand for the
reserve auction considering the contracting level of the distribution and free consumers, the
balance among the different energy sources and the evaluation of possible deviations between
the physical coverage granted to the power plants and the real firm energy available to the
system. The auction demand for all auctions (greenfield, existing power plants, RES and
reserve) is not disclosed to the bidders.
The auction demand is not sensitive to the price. Still, it can be reduced at the start of the auction
by the use of an endogenous rationing mechanism, according to the following equation:

 = ( ; ) (1)

 Where:
 Final demand: The demand that will be procured in the auction.
 Initial demand: The summation of the demand requested by the distribution
 companies or by the MME, in the case of the reserve auction.
 Initial offer: The summation of the amount of energy offered by the bidders.
 Adjustment parameter: An integer number equal to or higher than 1, set by the
 MME before knowing the total offer to ensure a minimum level of competition in
 the auction.
Considering that the Brazilian auctions usually procure energy contracts for a specific
technology, or group of technologies, the same methodology described above was used to adjust
the demand for each kind of contract. The methodology of endogenous rationing, as described
above, is reported to produce suboptimal results (both theoretically and in practice) if used to
artificially increase competition or reduce final price (Hanke & Tiedemann, 2020). This is not

 25
You can also read