First Majestic Silver Corp. (AG) - Kerrisdale Capital
←
→
Page content transcription
If your browser does not render page correctly, please read the page content below
September 2016

                           First Majestic Silver Corp. (AG)
                     Valuation Up in the Clouds, but No Silver Lining

First Majestic Silver Corp. is, in the words of its founder and CEO, “the purest silver company in
the world,” with six operating mines and a handful of development projects, all located in
Mexico. Like any miner, First Majestic has seen its market value fluctuate in sympathy with the
price of its key commodity; from the peak of the silver market in 2011 to its recent low point, for
instance, First Majestic declined 90%. As precious-metal prices have rebounded, however, First
Majestic has gotten a new lease on life, rising 268% year-to-date – an increase eight times
larger than that of silver itself.

This speculative frenzy – exacerbated by an ongoing, company-funded stock-promotion
campaign – has gone too far: First Majestic’s valuation is now outrageously detached from
reality. We estimate that the company trades at 5x net asset value (NAV) – an astonishing
premium to peers and a gross violation of common sense. While the market prices other
precious-metals miners at just 17% of the spot value of their measured and indicated mineral
resources – gold and silver in the ground that still need to be extracted, processed, and sold
over many years, justifying a large discount – First Majestic trades at a whopping 77% of this
value. Not only is the company ludicrously expensive relative to its peers; it’s also expensive
relative to its own history. For example, compared to the last time the price of silver was at its
current level, First Majestic’s stock price is now 17% higher – yet its silver reserves per share
are now 30% lower.

Indeed, as First Majestic has surged higher, even sell-side analysts with bullish views on the
price of silver and the prospects of the silver-mining industry have expressed bafflement over its
valuation. Among the eight firms covering the company, not a single one believes it’s trading
anywhere close to NAV. But First Majestic has benefited from less sober investors seeking the
cleanest “play” on a silver bull market and buying at any price.

Contributing to the hype is First Majestic’s CEO, a former stock promoter who describes himself
as a “high-level visionary” and for years has predicted – incorrectly – that silver would soon
trade for over $100 per ounce (up from ~$19 currently). He has also opined that “the financial
crisis of 2008-2009 was completely orchestrated and…known by the insiders” (as a way for
banks to buy cheap real estate in “probably the largest theft in human history”) and contended
that “if we actually do see negative interest rates in North America…we’re going to see riots.”
While he argues that current precious-metal prices are unsustainably low as a result of “paper
manipulation” by a conspiracy of big banks, what’s really unsustainable is First Majestic’s
anomalously high share price, which we believe has 70-80% downside.

 Disclaimer: As of the publication date of this report, Kerrisdale Capital Management, LLC and its affiliates
 (collectively, “Kerrisdale”), have short positions in and own option interests on the stock of First Majestic
 Silver Corp. (the “Company”). Other research contributors, and others with whom we have shared our
 research (collectively with Kerrisdale, the “Authors”) likewise have short positions in, and/or own option
 interests on, the stock of the Company. The Authors stand to realize gains in the event that the price of the
 stock decreases. Following publication, the Authors may transact in the securities of the Company. The
 Authors have obtained all information herein from sources they believe to be accurate and reliable.
 However, such information is presented “as is,” without warranty of any kind – whether express or implied –
 and without any representation as to the results obtained from its use. All expressions of opinion are
 subject to change without notice, and the Authors do not undertake to update this report or any information
 contained herein. Please read our full legal disclaimer at the end of this report.
Table of Contents
I. INVESTMENT HIGHLIGHTS ........................................................................................................ 3
II. COMPANY OVERVIEW ................................................................................................................... 5
III. FIRST MAJESTIC IS ABSURDLY OVERVALUED ........................................................................11
Evidence from Sell-Side NAV Estimates .....................................................................................................................12
Evidence from First Majestic’s History ........................................................................................................................14
Evidence from Reserves and Resources .......................................................................................................................15
Evidence from DCF Analysis ........................................................................................................................................17
…Based on First Majestic’s Own Accounting .................................................................................................................17
…Based on a Simple Model ............................................................................................................................................18
…Based on a Complex Model ........................................................................................................................................20
IV. FIRST MAJESTIC IS HEAVILY PROMOTED .............................................................................. 24
V. CONCLUSION ................................................................................................................................ 30
FULL LEGAL DISCLAIMER ................................................................................................................... 31
Kerrisdale Capital Management, LLC | 1212 Avenue of the Americas, 3rd Floor | New York, NY 10036 | Tel: 212.792.7999 | Fax: 212.531.6153 2I. Investment Highlights
First Majestic is absurdly overvalued. Many lines of evidence point in the same direction:
The median sell-side estimate of First Majestic’s net asset value is 58% below its stock
price.
o Other large-cap silver miners don’t trade at similar multiples; to the contrary,
based on sell-side figures, we believe the median silver miner’s price-to-NAV
multiple is 68% lower than First Majestic’s.
o This disconnect does not reflect some kind of quality premium for First Majestic;
it’s a recent anomaly, only dating back to early 2016 (around the time First
Majestic began paying stock promoters in cash and options for “digital
marketing”1).
The value of First Majestic is driven in large part by the price of silver. Relative to the last
time the price of silver was near its current level, First Majestic’s price per share is 17%
higher – yet its silver production per share is 13% lower, its reserves per share are 30%
lower, and its earnings per share are 33% lower. First Majestic was likely overvalued
before, but now it’s become ludicrous.
Other silver and gold miners typically trade for less than 20% of the gross value of their
mineral resources. First Majestic’s valuation is 5x higher – for no good reason.
First Majestic has had to write down several major mines in recent years, giving a
window into what the company itself believes its assets are worth. Extrapolating from
these values indicates that the company as a whole has 65% downside.
Using a simple, transparent DCF model that assumes that the company can mine as
much silver as it says it possesses, at the costs it says it will incur, we estimate that First
Majestic’s share price should be little more than $2 – 81% below the current price.
o Even if we make the ridiculous assumption that the company possesses infinite
silver resources, the downside is still 45%.
Even using a more complex, mine-level model with more generous assumptions, we find
that First Majestic is still worth less than $2.50 per share, 80% below the current price.
First Majestic is heavily promoted. First Majestic’s CEO often describes himself (in the
endless interviews he gives, many sponsored or funded by First Majestic) as a commodities
investment guru, yet for years he worked as a paid stock promoter and “investor relations
consultant” in the seedy world of small-cap Canadian shell companies; several such companies
on whose boards he served shot up in price, only to quickly collapse and get de-listed. First
Majestic and its sister company, First Mining Finance, also have extensive ties to a Panamanian
brokerage firm now in liquidation after the SEC charged it with being involved in several pump-
1Source: Future Money Trends email, August 21, 2016 (“FutureMoneyTrends.com is engaged in a digital
marketing consulting contract with First Majestic for eighteen thousand dollars and twenty five thousand
options set February of twenty sixteen”).
Kerrisdale Capital Management, LLC | 1212 Avenue of the Americas, 3rd Floor | New York, NY 10036 | Tel: 212.792.7999 | Fax: 212.531.6153 3and-dump scams. (This same firm is now the nexus of a Canadian investigation into offshore insider trading by executives in British Columbia.) Thus it comes as no great surprise that, after a precipitous share-price decline in 2014 and 2015, First Majestic enlisted the services of paid stock promoters to attract retail investors – an unusual practice for a multi-billion-dollar company. We document several such arrangements below. Adding fuel to the fire, the company’s CEO goes well beyond the typical level of mining- executive optimism and pounds the table about how the price of silver will quintuple (notwithstanding nefarious, concerted efforts on the part of the world’s governments to keep it down) and how owning “good quality stocks” like First Majestic is the only way to “make serious money” betting on this move. We believe these unsavory antics help to explain why First Majestic’s valuation has become so inflated. But even a veteran stock promoter can’t put off reality forever. Kerrisdale Capital Management, LLC | 1212 Avenue of the Americas, 3rd Floor | New York, NY 10036 | Tel: 212.792.7999 | Fax: 212.531.6153 4
II.      Company Overview
                         First Majestic Silver Corp.: Capitalization and Financial Results

       (in millions unless otherwise noted)
                      Capitalization                                                   Financial results
       Price per share                $ 12.02
       Diluted shares 1                     167                                               2012    2013     2014     2015
       Market cap                     $ 2,006              Revenue                       $    247 $    251 $   245 $    219
       Net debt:                                           EBITDA3                              25      72       70       63
         Debt facilities              $      50            Diluted EPS                   $    0.79 $ (0.33) $ (0.52) $ (0.84)
         Capital leases                      15
          Total debt                  $      66            Free cash flow4                     (39)       (44)        (11)        (1)
         Cash & cash equiv's              (108)            Book value per share          $    5.08 $     4.88 $      4.43 $     3.50
         Marketable investments 2           (13)
          Net debt                    $     (55)           Silver price ($/oz)5          $      31 $       24 $        19 $       16
          Total enterprise value      $ 1,951              # of producing properties             4          5           5          6
       Source: company filings, Capital IQ, Kerrisdale analysis

       1. Includes dilutive impact of 11.5 million stock options at an assumed average exercise price of C$9.76. See First
       Majestic’s “share structure” web page.
       2.. Includes shares of Sprott Physical Silver Trust and First Mining Finance Corp. marked to current market prices.
       3. Excludes impairments of non-current assets.
       4. Defined as cash generated by operating activities less expenditures on mining interests and acquisition of property,
       plant, and equipment.
       5. Average COMEX price during period.

   First Majestic is essentially a roll-up – a collection of silver mines purchased from and initially
   developed by third parties, not discovered by the company itself. The story of how founder and
   CEO Keith Neumeyer came to create First Majestic – often described as his second billion-
   dollar company2 – has been recounted during many of the dozens of interviews he frequently
   gives to outlets like SGT Report (short for “Silver, Gold, Truth” and, by its own reckoning, “The
   Corporate Propaganda Antidote”) and TF Metals Report (short for Turd Ferguson, the author’s
   nom de plume). Here’s one recent version:3

              Most mining-company executives have a background in engineering and geology. They
              work their way up the ladder. But that's not exactly true for you. Is it true that you started
              out as a stockbroker?

              Well, I wasn't actually a stockbroker. I actually worked on the floor of the Vancouver
              Stock Exchange for about six years. I started off working for the Vancouver Stock

   2 See e.g. a June, 29, 2016, post on Stock Gumshoe, quoting from Money Map (“You could have a rare
   chance to partner with an investment legend who’s already built two billion-dollar mining companies from
   the ground up”) and a November 10, 2015, post on FutureMoneyTrends (“[Neumeyer] has publicly stated
   that he intends on making First Mining Finance his 3rd billion-dollar company”).
   3 Transcribed from July 9, 2016, Sprott’s Thoughts interview.

Kerrisdale Capital Management, LLC | 1212 Avenue of the Americas, 3rd Floor | New York, NY 10036 | Tel: 212.792.7999 | Fax: 212.531.6153   5
Exchange as a board-marker, of all things.…[Later] I actually arbitraged equities
between Vancouver, Montreal, Toronto, and the Nasdaq as a pro trader.…When the
crash occurred in…’87…a lot of the people that worked in the trading side of the industry
got laid off as well as I did, and I started working for a couple publicly traded companies.
And the mining sector, of course, as many of your listeners probably know – Vancouver
is the highest concentration of mining on the planet, and me, a lover of rocks and a lover
of math and business, it’s just natural for me to go down that path, so I put together my
first company a few years later in 1992, which was First Quantum Minerals [a copper
company with assets in Africa], which obviously became quite a success.
…I left in 2000…I basically went into semi-retirement for a couple years. I didn’t really do
much between 2000 and 2002. I dabbled in the high-tech market a little bit, but really
nothing of any great degree. And when I saw the metals, particularly gold, bottom out in
2002, it was pretty obvious to me that the bottom was in and that things were going to
start to improve, so I put together – I looked at actually putting a gold company together
at first, but when I looked at the space I just felt there were too many gold companies out
there, and I’d get lost in the space. … There were very few silver companies in the
space. There was only really a handful, so I felt I could really build a good niche-type
story.…I set on a path to create the purest silver company in the world, which we’ve
done, and First Majestic today is the purest silver company in the world. And I achieved
exactly what I was trying to achieve.
But this tidy summary obscures some messy – and colorful – details. For instance, Neumeyer
first became involved with First Quantum as a stock promoter. In the words of one Canadian
research analyst in 1995 (emphasis added):
First Quantum listed on the VSE [Vancouver Stock Exchange] in Sept/85 as Xenium
Resources through an IPO packaged by a promoter who moonlighted as a belly dancer.
Xenium was a "tight" deal typical of the VSE during the eighties. By the time it
announced an RTO [reverse takeover] of a portable computer story in July/87, the stock
had already reached $5 3/4. Those were the days when the VSE permitted trading to
continue while juniors talked about fancy plans and vendors pocketed cash advances.
By Feb/88 the deal had collapsed. In Feb/89 control shifted to Jimmy Lee's Asiamerica
group, which consolidated Xenium 2:1 to form Zeal Capital in Nov/89. Asiamerica
handed the reins to Jason Woodbridge, who recruited Keith Neumeyer to promote
the stock. Zeal connected with Donald Walsh and Frank Hogg who steered Zeal into
the murky land of Russian beer distribution licenses. A shaky promotion was capped off
in late 1991 by a deal to take over the St Petersburg brewery itself. This plan evaporated
when the town council decided the brewery should be privatized by auction, not some
backroom deal. By the time the stock hit $0.10 and Keith Neumeyer realized he was
up to his ears in a major cow pie, everybody else had already vacated the stable.
Neumeyer proceeded to reorganize Zeal, starting with a 4:1 rollback in June/93 to form
First Quantum. He then waited 2 years before completing a private placement of 2
million units at $0.15 in June/95 (2M wts $0.15-0.18 2 years). One of the key placees is
Kerrisdale Capital Management, LLC | 1212 Avenue of the Americas, 3rd Floor | New York, NY 10036 | Tel: 212.792.7999 | Fax: 212.531.6153 6Clive Newall, now in charge of Kensington Resources and its diamond project in
Saskatchewan. If he has any bright overseas ideas that do not fit Kensington's mandate,
First Quantum could become the vehicle.
In other words, Neumeyer only “put together” the copper-focused version of the First Quantum
shell company after the Russian-beer-distribution version failed. Moreover, once First Quantum
acquired real copper assets, it quickly became clear that Neumeyer was not a core part of the
company:4 he stepped down from the board in 1997 to become “Manager of Corporate
Relations”5 – a euphemism for investor relations.6 (Neumeyer also handled investor relations
from 1992 to 1997 for a Canadian-listed firm called Offshore Systems International that sold
maritime computer systems; the stock has since lost essentially all of its value and been de-
listed.7)
While the official First Majestic narrative frames the company as Neumeyer’s second straight
triumph – conveniently omitting First Quantum’s prior murky history and Neumeyer’s lack of
operational involvement – this story also overlooks the outcomes of his “dabbling” in two other
public companies:
In November 1999, Neumeyer joined the three-person board of a shell company called
Cosworth Minerals;8 he was soon joined by a “master glass technician” and a lawyer
who had also served on the board of First Quantum during its shell-company days.9
Cosworth, whose shares traded for pennies, completed a reverse takeover of Palcan, a
fuel-cell venture, in 2001. Neumeyer left the board in 2003.10 From the time he joined to
the time he left, Cosworth/Palcan’s stock price went from $0.33 to a peak of $1.30 – and
then back down to $0.23. It has since been de-listed after losing almost all of its value.11
In November 2003, Neumeyer joined the board of Consolidated JABA Inc., a mineral
exploration company (holding properties “without a known body of commercial ore”12)
4 A Kaiser Research update in October 1996 noted that “First Quantum…has emerged as Andrew
Malim's African vehicle, though Clive Newall and Keith Neumeyer retain the titles of chairman and
president respectively.” A January 1997 initiation report on First Quantum describes it as “headed by
Clive Newall” (still a director of the company) but doesn’t mention Neumeyer.
5 See December 12, 1997, press release.
6 For example, Neumeyer is listed as the “investor contact” in First Quantum’s 1998 annual report and not
mentioned elsewhere. Neumeyer is also listed as one of several contacts on First Majestic earnings
releases (see e.g. 1999 Q3).
7 Source: Bloomberg (ticker: OSI CN). He may have done similar work for other firms: his biography on
First Quantum’s official web site in 1997 said, “Since 1988, he has worked with several public companies
specializing in corporate finance and investor relations.”
8 Cosworth Minerals Ltd. information circular, November 12, 1999, p. 5.
9 Cosworth Minerals Ltd. information circular, October 31, 2000, p. 5.
10 Palcan Fuel Cells Ltd. information circular, April 4, 2003 (at the annual general meeting held in May
2003, Neumeyer did not stand for re-election to the board).
11 Source: Bloomberg (ticker PC/H CN).
12 Consolidated JABA Inc. annual information form, July 3, 2003, p. 1.
Kerrisdale Capital Management, LLC | 1212 Avenue of the Americas, 3rd Floor | New York, NY 10036 | Tel: 212.792.7999 | Fax: 212.531.6153 7and early business partner of First Majestic’s. In September 2006, Neumeyer stepped
down.13 From the time he joined to the time he left, Consolidated JABA’s stock price
went from $2.52 to a peak of $3.36 – and then back down to $1.30. Today, after a
reverse takeover by Perfect Lithium Corp. and a name change to Nano One Materials,
the stock trades at C$0.54.
First Majestic itself had a similarly inauspicious start. Under its previous name, Vital Pacific
Resources Ltd., it assembled a collection of mineral claims in British Columbia; Neumeyer
apparently began to acquire shares during this period.14 In December 1998, he joined the board
alongside two other new directors (a lawyer and an “investor relations consultant”).15 In October
1999, having failed to create any value from its mineral properties, Vital Pacific undertook a
“transformation from a mineral exploration company, to a company committed to oil and gas
exploration.”16 For years, though, the company accomplished little. Eventually it pivoted from oil
and gas to gold, but, as Neumeyer later explained in an October 2001 letter to shareholders,
“due to the continued dismal market conditions the Company was unable to raise funding to
explore” several of the speculative gold properties in Manitoba it had made initial investments in,
leading to a series of write-offs and a 10:1 reverse split.17
In January 2002, Vital Pacific changed its name to First Majestic Resource Corp., with
Neumeyer officially taking the reins as president.18 Neumeyer continued to tout the “good
potential” of the company’s remaining gold properties,19 but by 2003 First Majestic had written
those off as well.20
It was only in August 2003 – more than five years after Neumeyer became involved – that First
Majestic began to bet on silver, acquiring an option on the Niko silver project in Mexico. 21 On the
back of this development, the company began to raise capital and soon acquired an option on a
second silver asset, the Platino Porphyry project in Argentina. In a breathless November 2003
shareholder letter, Neumeyer described these assets as “two exploration properties that exhibit
elephant potential” akin to some of the best mining areas in the world.22 Yet, within less than a
13 First Majestic’s August 3, 2006, information circular lists Neumeyer as “currently Director of Dundarave
Resources Inc. (a precious and base metals exploration company).” (Consolidated JABA changed its
name to Dundarave in 2004.) However, First Majestic’s November 16, 2006, information circular does not
mention Dundarave. At Dundarave’s August 3, 2006, annual general meeting, Neumeyer did not stand for
re-election.
14 See Vital Pacific Resources Ltd. exchange offering prospectus, December 9, 1997, p. 35.
15 Vital Pacific Resources Ltd. information circular, November 15, 1999, p. 3.
16 Vital Pacific Resources Ltd. annual report, 1999, p. 1.
17 Vital Pacific Resources Ltd. information circular, letter to shareholders.
18 Vital Pacific Resources Ltd. news release, January 2, 2002.
19 First Majestic Resource Corp. news release, June 6, 2002.
20 See First Majestic annual report, fiscal year 2004, p. 23.
21 First Majestic news release, August 12, 2003.
22 First Majestic letter to shareholders, November 10, 2003.
Kerrisdale Capital Management, LLC | 1212 Avenue of the Americas, 3rd Floor | New York, NY 10036 | Tel: 212.792.7999 | Fax: 212.531.6153 8year, First Majestic wrote both projects down to zero, citing “unfavourable results from the
exploration program undertaken to date.”23
Indeed, of the 14 major silver assets that First Majestic has purchased in its history, all but one
– Santa Elena, acquired just recently, at the end of 2015 – have either been fully written off or
subjected to impairment charges, as shown below. (These impairments are all the more striking
since most of First Majestic’s purchases took place more than a decade ago, at a time when
silver prices were far lower, giving the operations an economic head start that they
squandered.)
First Majestic: Status of Acquired Silver Properties
Year of
Name Status
purchase
1 Niko 2003 written off
2 Platino 2003 written off
Chalchihuites group 7 out of 9 project areas written off,
3 2004
of properties/Del Toro remainder impaired in 2014 & 2015
4 La Parilla 2004 impaired in 2015
5 Cuitaboca 2004 written off
6 Dios Padre 2004 written off
7 Candameña 2004 written off
8 San Martin 2006 impaired in 2014
9 La Candelaria 2006 written off
10 La Encantada 2006 impaired in 2015
11 La Luz 2009 impaired in 2015
12 La Guitarra 2012 impaired in 2014 & 2015
13 Plomosas 2012 impaired in 2015
14 Santa Elena 2015 unimpaired
Source: company filings, Kerrisdale analysis
To be sure, the impairment charges taken in 2015 – premised as they were on silver prices
assumed to be slightly below current levels – could partially reverse. Still, simply looking at cash
flows over time tells a similar story about First Majestic’s deplorable capital allocation. As of
March 31, 2016, the company’s cumulative free cash flow – operating cash flow less capital
expenditures, not including the upfront cost of acquiring properties – totaled negative $164
million. After 16 years, First Majestic is still, on a cash basis, in the red. In keeping with a
familiar pattern in the mining sector, when the price of silver is low, the company doesn’t earn
enough to cover its costs. But when the price of silver is high, it fritters away the gains on new
projects.
23 First Majestic interim financial statements, December 31, 2014, p. 9.
Kerrisdale Capital Management, LLC | 1212 Avenue of the Americas, 3rd Floor | New York, NY 10036 | Tel: 212.792.7999 | Fax: 212.531.6153 9First Majestic: Cumulative Free Cash Flow, 2001-2016
Source: company filings, Capital IQ, Kerrisdale analysis
Note: values through 2009 were originally reported in CAD and have been converted to USD using the
average exchange rate during the period.
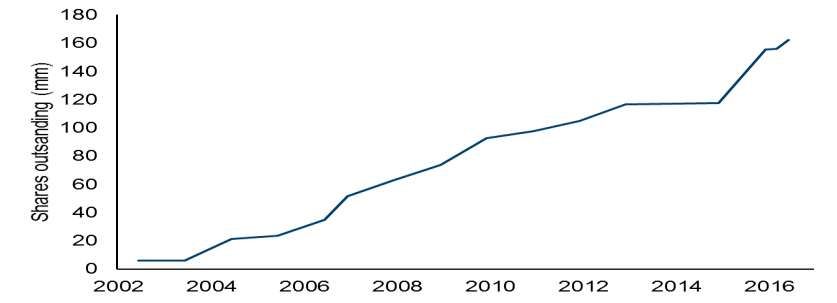
To fund these losses, First Majestic has repeatedly diluted its shareholders. Shares outstanding
have increased 28-fold since Neumeyer’s relaunch of the company in 2002.
First Majestic: Shares Outstanding, 2002-2016
Source: company filings, Kerrisdale analysis
Kerrisdale Capital Management, LLC | 1212 Avenue of the Americas, 3rd Floor | New York, NY 10036 | Tel: 212.792.7999 | Fax: 212.531.6153 10Notwithstanding this checkered history, First Majestic managed to survive the recent downturn
in precious-metal prices and has since rebounded explosively. Of course, many other miners
have also enjoyed similar moves, but not all miners are created equal. Though First Majestic’s
assets are certainly worth something, the company’s valuation has become egregiously
disconnected from its fundamentals – a conclusion supported by numerous lines of evidence.
III. First Majestic Is Absurdly Overvalued
Unlike typical firms, miners have expiration dates: there is only so much metal in the ground for
them to extract, and eventually it runs out. Of course, by investing in exploration or acquiring
additional mines, miners can and do extend their lives, but these options cost money and are
fraught with risks; historically, miners have been terrible stewards of capital. Because individual
mines steadily dwindle in value, normal valuation metrics can mislead. As a result, industry
observers mainly focus on net asset value (NAV), estimated via discounted-cash-flow models
using low discount rates (conventionally 5%). For example, when Morgan Stanley recently
initiated coverage on four large-cap gold miners, it set its price targets equal to 1x its NAV
estimates. While one could argue that miners have option-like qualities and thus deserve to
trade at some premium to an NAV calculated for a single base-case scenario,24 that premium
should usually be modest, especially when unit metal prices are already comfortably above unit
costs, as they are today. In any case, a reasonable estimate of NAV is the most logical and
most common starting point for miner valuation.
While NAV estimates differ from analyst to analyst, they generally rely on the same fundamental
sources: published technical reports known as NI 43-101s. These reports, mandated by
Canadian regulators after a major listed gold miner turned out to be a fraud,25 disclose, mine by
mine, the quantities of minerals likely to exist and to be profitably extracted. Different terms of
art denote different levels of confidence: reserves (including “proven” and “probable”) are the
most reliable, followed by “measured” and “indicated” resources. “Inferred resources” are far
more speculative; as First Majestic’s Form 40-F puts it (emphasis added):
24 An idealized miner would shut down production if the commodity price fell below its marginal cost and
re-start production when it rebounded, creating an asymmetric risk profile (limited downside given price
declines but unbounded upside given price increases). Reality is messier, however, and no miner can
stop and start production at the drop of a hat. Moreover, as metal prices rise well above costs per unit,
the “option” gets deeper and deeper in the money, making the theoretical non-linearity less practically
relevant.
25 The company was called Bre-X. As Floyd Norris of the New York Times put it in 1997, “Bre-X
represents an unfortunate tradition, that of the junior mining company, for which the Vancouver and
Alberta stock exchanges have been notorious since scandals involving phony Canadian uranium
companies erupted four decades ago. The listing rules for junior companies are lax, and there have been
many companies that traded for far more than they turned out to be worth.” First Majestic CEO Keith
Neumeyer began his career at the (now defunct) Vancouver stock exchange during this period.
Kerrisdale Capital Management, LLC | 1212 Avenue of the Americas, 3rd Floor | New York, NY 10036 | Tel: 212.792.7999 | Fax: 212.531.6153 11Inferred mineral resources have a great amount of uncertainty as to their existence,
and great uncertainty as to their economic and legal feasibility.26
Thus analysts generally attribute little value to inferred resources and focus instead on reserves
and measured and indicated resources (though some apply haircuts even within those
categories). With this background in mind, we examine First Majestic’s NAV from a range of
perspectives. No matter how we look at it, the conclusion is the same: First Majestic’s share
price dramatically exceeds any level that its fundamentals can justify.
Evidence from Sell-Side NAV Estimates
Below we tabulate the most recent estimates of First Majestic’s NAV per share from seven
different sell-side firms. Clearly, they vary over a wide range, reflecting different methodologies,
operational assumptions, silver-price forecasts, and other factors. Nonetheless, not a single one
comes close to First Majestic’s current share price. At the sell-side median, First Majestic’s NAV
is a staggering 58% lower than where the stock trades today – a discrepancy that equates to
$1.2 billion in unjustified market cap.
First Majestic: Sell-Side
Estimates of NAV per Share
Firm 1 $ 2.65
Firm 2 $ 3.08
Firm 3 $ 3.50
Firm 4 $ 4.63
Firm 5 $ 5.45
Firm 6 $ 5.61
Firm 7 $ 8.09
Firm 8 $ 9.50
Median $ 5.04
AG share price $ 12.02
Downside to
(58)%
median NAV
Source: Kerrisdale analysis 27
26First Majestic 2015 Form 40-F, p. 3.
27One firm disclosed an NAV as recently as May but has since increased its price target without reporting
a new NAV. We back into the implied NAV by assuming the target P/NAV ratio is constant.
Kerrisdale Capital Management, LLC | 1212 Avenue of the Americas, 3rd Floor | New York, NY 10036 | Tel: 212.792.7999 | Fax: 212.531.6153 12Is it normal for miners to trade at such a massive premium to estimated NAV? No. Below we
summarize one sell-side firm’s NAV estimates for several large-cap silver miners.28 Excluding
First Majestic, they trade at a median price-to-NAV multiple of 1.9x, while First Majestic trades
210% more expensively at 5.8x:
Large-Cap Silver Miners:
Price to NAV Multiples
Per share (USD)
Company NAV Price P/NAV
Coeur $ 7.88 $ 12.74 1.6x
Fresnillo $ 9.04 $ 21.07 2.3x
Hochschild $ 1.31 $ 3.16 2.4x
Pan American $ 10.34 $ 17.41 1.7x
Silver Wheaton $ 12.16 $ 25.32 2.1x
Tahoe Resources $ 13.66 $ 13.03 1.0x
Hecla Mining $ 1.58 $ 5.58 3.5x
Silver Standard $ 7.35 $ 11.72 1.6x
Median 1.9x
First Majestic $ 2.06 $ 12.02 5.8x
Downside to
(68)%
peer median
Source: BMO, Kerrisdale analysis
There is simply no rational justification for this vast discrepancy; First Majestic is nothing
special. Of course, each of its mines is different, with some more valuable than others, but those
run-of-the-mill differences already feed into analysts’ NAV estimates. If First Majestic had some
unique magic, the market would have consistently accorded it a premium valuation, especially
since the company has owned most of its current portfolio of mines for many years. In reality,
however, First Majestic has only very recently diverged from its peers. After five years of trading
in line with the sector median in the range of ~1-2x NAV, First Majestic became extremely
overvalued only in early 2016, even as its peers largely remained within their prior bounds:
28“Large cap” defined as market cap greater than USD 1 billion. Source: BMO SilverPages, August 29,
2016. NAV shown is NPV using a 5% discount rate and recent spot prices (silver $18.60/ounce, gold
$1,321/ounce). Price to NAV is calculated using the latest share prices (converted to USD).
Kerrisdale Capital Management, LLC | 1212 Avenue of the Americas, 3rd Floor | New York, NY 10036 | Tel: 212.792.7999 | Fax: 212.531.6153 13Large-Cap Silver Miners: Price to NAV Multiples, 2010-2016
Source: BMO, Kerrisdale analysis
Note: breaks in First Majestic data reflect months when BMO SilverPages did not report an updated
estimate for First Majestic’s NAV. “Large-cap” defined as firms currently trading at over USD 1B in
market cap and includes the same firms identified in the table above (Coeur, Fresnillo, Hochschild, Pan
American, Silver Wheaton, Tahoe, Hecla, and Silver Standard).
In short, among dedicated sector experts, there is little controversy: First Majestic’s stock price
has taken on a life of its own, utterly disconnected from its peers and its fundamentals. It’s so
overvalued that even analysts with bullish silver-price forecasts can’t bring themselves to
recommend it, even though it’s the “purest silver company in the world”; with such a large and
baseless premium to NAV, the risk of collapse looms too large.
Evidence from First Majestic’s History
Not only is First Majestic’s valuation extreme relative to that of other silver miners; it also looks
absurd relative to where First Majestic itself traded in mid-2014, when spot silver prices were
approximately the same as they are now. While some of First Majestic’s key metrics have
improved since then in absolute terms, many have actually deteriorated on a per-share basis –
the only basis shareholders should care about – thanks to repeated equity issuance at low
prices. As the table below highlights, while First Majestic’s share price is 17% higher than it was
in mid-2014, the price of silver is down 4%, while silver production per share is down 13%, silver
reserves per share are down 30%, and earnings per share are down 33%.
Kerrisdale Capital Management, LLC | 1212 Avenue of the Americas, 3rd Floor | New York, NY 10036 | Tel: 212.792.7999 | Fax: 212.531.6153 14First Majestic: Price and Key Performance Indicators,
2014 vs. 2016
8/31/14 8/31/16 %Δ
AG price per share $ 10.24 $ 12.02 17%
Silver price per ounce $ 19.40 $ 18.58 (4)%
AG, latest available data:
Ag-equiv. oz produced (mm) 3.9 4.7 21%
Diluted WA shares outstanding (mm) 118 164 39%
Ag-equiv. production per share (oz) 0.033 0.029 (13)%
Ag-equiv. P&P reserves (mm oz) 139 135
Reserves per share (oz) 1.18 0.83 (30)%
Diluted EPS $ 0.06 $ 0.04 (33)%
Operating cash flow per share $ 0.16 $ 0.15 (6)%
Mine operating earnings ($mm) $ 9.5 $ 9.9 5%
Mine operating earnings per share $ 0.08 $ 0.06 (25)%
Source: company filings, Capital IQ, Kerrisdale analysis
Note: metrics shown reflect 2014 Q2 and 2016 Q2 data. Reserves taken from 2013 and
2015 annual reports.
In theory, of course, it’s possible for a stock price to rise 17% simply because its starting point
was unjustifiably low. But, as our earlier analysis demonstrated, First Majestic’s 2014 valuation
was not unusually conservative; to the contrary, it was fully in line with its peers. Since per-
share fundamentals have worsened by 20-30%, First Majestic’s price should be, ceteris paribus,
at least 20-30% lower than it was in 2014, not 17% higher – implying ~40% downside from
current prices.
Evidence from Reserves and Resources
Sell-side NAV estimates, though convenient, have the disadvantage of opacity; it’s hard to be
sure exactly what assumptions they incorporate. Fortunately, because miners release their own
estimates of how much gold and silver in the ground they own, it’s possible to assess relative
valuation across miners even without using complicated models. Below we simply take miners’
last-reported “measured and indicated” (M&I) resources – a superset of the more conservative
category of proven and probable reserves – and multiply them by the current silver and gold
spot prices to estimate the gross value of their as-yet unmined minerals. If miners could simply
snap their fingers and extract all of their measured and indicated resources tomorrow at zero
cost, these figures would represent their economic value. In reality, of course, value leaks out at
many, many points along the way: only a fraction of the gold and silver contained in the deposits
can be recovered using practical methods; personnel need to be paid; equipment needs to be
purchased and replaced; mining and processing facilities have limited capacity, putting a limit on
the amount of gold and silver that can be monetized in any one period; and so on. It thus stands
Kerrisdale Capital Management, LLC | 1212 Avenue of the Americas, 3rd Floor | New York, NY 10036 | Tel: 212.792.7999 | Fax: 212.531.6153 15to reason that almost every gold and silver miner trades at only a small fraction of the gross
value of its M&I resources. By contrast, First Majestic trades as if the ludicrously unrealistic
“mine everything tomorrow at zero cost” scenario had actually come true:
Silver and Gold Miners:
Enterprise Values Relative to the Gross Value of Measured & Indicated Resources
M&I resources Gross M&I value EV to
(mm oz) ($ mm) gross M&I
Silver Gold Silver Gold Total EV ($mm) value
First Majestic 115.2 0.3 $ 2,139 $ 408 $ 2,547 $ 1,951 77%
Median silver miner 288.7 6.1 5,363 8,053 15,331 2,148 17%
Median gold miner - 95.0 - 124,742 124,742 12,091 14%
Silver miners
Alamos Gold 39.0 10.9 724 14,334 15,058 1,909 13%
Americas Silver 81.2 - 1,509 - 1,509 105 7%
Coeur 465.5 4.2 8,648 5,486 14,134 2,322 16%
Endeavour 59.5 0.5 1,105 626 1,731 500 29%
Fortuna Silver 43.2 2.4 803 3,162 3,964 1,038 26%
Fresnillo 1,075.5 15.9 19,979 20,885 40,864 15,657 38%
Hecla 336.7 6.7 6,255 8,859 15,113 2,515 17%
Hochschild 240.7 11.3 4,471 14,795 19,266 1,973 10%
McEwen 122.3 4.2 2,273 5,575 7,847 916 12%
Pan American 721.0 1.6 13,394 2,154 15,548 2,530 16%
Polymetal 224.1 20.3 4,163 26,608 30,771 7,319 24%
Silver Standard 756.6 5.5 14,055 7,248 21,303 1,186 6%
Silver Wheaton 1,448.2 11.4 26,903 15,021 41,924 11,722 28%
Tahoe 420.1 10.8 7,804 14,200 22,005 3,970 18%
Gold miners
Agnico - 34.0 - 44,625 44,625 11,973 27%
AngloGold Ashanti - 153.9 - 202,110 202,110 8,864 4%
Barrick - 171.0 - 224,461 224,461 28,560 13%
Franco-Nevada - 191.9 - 251,932 251,932 12,209 5%
Goldcorp - 78.5 - 103,084 103,084 15,648 15%
Kinross 114.1 62.5 2,120 82,095 84,216 5,967 7%
Newmont - 111.5 - 146,400 146,400 25,873 18%
Randgold - 21.0 - 27,573 27,573 8,753 32%
Source: company filings, Capital IQ, Kerrisdale analysis
If First Majestic simply traded where the median silver or gold miner does (relative to the spot
value of its measured and indicated resources), its market value would decline by 80%. Once
again, it’s clear that First Majestic’s valuation is untethered from reality.
Kerrisdale Capital Management, LLC | 1212 Avenue of the Americas, 3rd Floor | New York, NY 10036 | Tel: 212.792.7999 | Fax: 212.531.6153 16Evidence from DCF Analysis
…Based on First Majestic’s Own Accounting
First Majestic presents its financial results under International Financial Reporting Standards
(IFRS). IFRS requires the company to periodically “review[] the carrying amount of its non-
current assets to determine whether there is any indication that those assets are impaired.”29 In
2014 and 2015, First Majestic determined that many of its mines were impaired and, as a result,
wrote them down to “fair value less costs of disposal (‘FVLCD’).” It computed FVLCD as follows
(sic):30
Recoverable values are determined with internal discounted cash flow economic models
are projected using management’s best estimate of recoverable mineral reserves and
resources, future operating costs and capital expenditures, and long-term foreign
exchange rates. For mineral resources that were not valued using internal discounted
cash flow economic models, FVLCD were estimated based on in-situ value of their
resources and exploration potential derived from comparable market transactions.
In other words, the post-write-down carrying value of impaired mines equals First Majestic’s own
estimate of their intrinsic value. Of course, this estimate depends on commodity-price
assumptions, but these are disclosed, and it so happens that the long-term assumptions used to
derive both the 2014 and 2015 impairments ($21.50 and $18.50 per ounce) are similar to
current prices. We can thus use First Majestic’s balance sheet to extrapolate its economic
value.
Below we carry out this analysis. First, using the post-impairment carrying values of First
Majestic’s impaired mines in 2014 and 2015, we determine the value per silver-equivalent
ounce of measured and indicated resources; while it varied from mine to mine (depending on
factors like operating costs), it averaged $4.05 in 2014 and $4.30 in 2015. Multiplying that figure
by First Majestic’s current quantity of M&I resources, we estimate that its total value – including
un-impaired mines – amounts to just ~$650 million, implying 65% downside to its current share
price. This analytical framework – based on First Majestic’s own internal DCF models – reaches
the same conclusions as the other methods already described: First Majestic is dramatically
overvalued.
29 First Majestic 2015 annual report, p. 48.
30 First Majestic 2015 annual report, p. 62.
Kerrisdale Capital Management, LLC | 1212 Avenue of the Americas, 3rd Floor | New York, NY 10036 | Tel: 212.792.7999 | Fax: 212.531.6153 17First Majestic: Estimating Total Company Value
Based on Historical Impairment Charges
Post-
impairment M&I
carrying resources
value (Ag-eq Value per
($mm) mm oz) M&I oz ($)
2014:
La Guitarra $ 75 15 $ 4.93
San Martin 78 24 3.21
Del Toro 173 41 4.21
Subtotal $ 326 81 $ 4.05
2015:
La Encantanda $ 90 33 $ 2.70
Del Toro 146 35 4.18
La Guitarra 54 13 4.01
La Parilla 167 25 6.77
Subtotal $ 457 106 $ 4.30
M&I
Implied resources
value (Ag-eq Value per
($mm) mm oz) M&I oz ($)
AG total, current:
2014 value $ 633 156 $ 4.05
2015 value $ 672 156 $ 4.30
Average $ 653
Downside (65)%
Source: company filings, Kerrisdale analysis
…Based on a Simple Model
Though First Majestic does disclose some of the assumptions used to generate its fair-value
estimates, it doesn’t release its full models, which, given management’s incentives, one would
naturally expect to be optimistic. Further below, we summarize our own detailed model, but we
also believe that it’s easy to distill the key points into a much simpler form. Imagine that First
Majestic simply extracts all of its measured and indicated resources over time, with the pace
determined by its current production level, the costs fixed based on management’s 2016
guidance, and the price of silver fixed at its current value. Using the conventional 5% discount
rate, this simple model would value First Majestic’s equity at just $2.24 per share – 81% lower
Kerrisdale Capital Management, LLC | 1212 Avenue of the Americas, 3rd Floor | New York, NY 10036 | Tel: 212.792.7999 | Fax: 212.531.6153 18than the current price.31 It doesn’t take a geologist to see that First Majestic is absurdly
overvalued.
First Majestic: Simple DCF Model
Total 2016 H2 2017 2018 2019 2020 2021 2022 2023 2024
M&I silver contained (mm oz) 115
Silver ounces produced (mm) 86 5.4 11.3 11.3 11.3 11.3 11.3 11.3 11.3 1.9
Payable silver oz produced (mm) 84 5.2 11.0 11.0 11.0 11.0 11.0 11.0 11.0 1.8
Realized silver price ($ per oz) $ 18.58 $ 18.58 $ 18.58 $ 18.58 $ 18.58 $ 18.58 $ 18.58 $ 18.58 $ 18.58
($mm )
Gross silver revenue $ 1,560 $ 97 $ 204 $ 204 $ 204 $ 204 $ 204 $ 204 $ 204 $ 34
All-in sustaining costs 1,012 73 131 131 131 131 131 131 131 22
Cash pre-tax income $ 548 $ 24 $ 73 $ 73 $ 73 $ 73 $ 73 $ 73 $ 73 $ 12
Income taxes 164 7 22 22 22 22 22 22 22 4
Cash net income $ 384 $ 17 $ 51 $ 51 $ 51 $ 51 $ 51 $ 51 $ 51 $ 8
NPV of mines at 5% $ 319
Less: net debt (55)
Equity fair value $ 374
Diluted shares 167
Equity fair value per share $ 2.24
Downside (81)%
Source: company filings, Capital IQ, Kerrisdale analysis
Note:
1. Metallurgical recovery assumed to be ~75% (2016 H1 average).
2. % of production that is payable assumed to be ~97% (2016 H1 average).
3. Silver production based on 2016 full-year and implied H2 guidance (using the mid-point).
4. Realized silver price assumed to be current COMEX price.
5. All-in sustaining costs per payable silver ounce produced based on 2016 full-year and implied H2 guidance
(using the mid-point): $11.93 and $13.92, respectively. AISC includes what First Majestic considers to be
“sustaining” capital expenditures but does not include the cost of expansion or exploration. AISC also
incorporates the benefits of by-product credits, i.e. the value of gold and other minerals produced as a by-product
of silver production.
6. Tax rate assumed to be 30% based on the Mexican statutory corporate tax rate – likely generous given the
effects of other taxes like mining royalties.
7. We use First Majestic’s 12/31/15 M&I estimate and do not deduct silver produced in 2016 H1.
While a First Majestic bull might argue that such a model is overly conservative because the
company may not run out of silver in 2024 – whether as a result of future discoveries or
additional acquisitions – this objection only works if the company not only obtains staggering
amounts of new silver but does so at a sufficiently low cost. Is First Majestic – a company with a
long history of burning cash, diluting shareholders, and writing off development projects – really
going to generate an extra $1.6 billion of shareholder value – 81% of its market cap – through
expansionary capex and good luck? Even if it can pull off such an amazing feat, the stock is
only fairly valued – hardly a compelling investment. (In fact, even if we tweak this model to
31 Note, however, that First Majestic itself states that its weighted average cost of capital is 8.5%. See
First Majestic 2015 annual report, p. 62.
Kerrisdale Capital Management, LLC | 1212 Avenue of the Americas, 3rd Floor | New York, NY 10036 | Tel: 212.792.7999 | Fax: 212.531.6153 19assume infinite silver production at the current rate, the resulting valuation is still 45% lower than the stock price!) Of course, other First Majestic bulls might take issue with the assumption of constant silver prices. Perhaps, as many such investors believe, silver is in the early stages of a new bull market. Perhaps. But, again, First Majestic is so spectacularly overvalued on the basis of current silver prices that it would take a truly massive rally to even justify its current market cap, let alone leave room for a positive prospective return. In fact, using the simple model summarized above, it would require a silver price of $52 per ounce – 180% above the current silver price. But if silver is going to triple in value and reach a 35-year-high – a price only ever witnessed during the Hunt brothers’ infamous and disastrous attempt to corner the silver market – why not just own silver, or silver call options, or other silver-miner equities? “Pure” or not, First Majestic is likely the worst way for a silver bug to bet on a higher metal price. It’s just too expensive. …Based on a Complex Model Going deeper, we modeled each of First Majestic’s operating mines, drawing on management guidance, NI 43-101 technical reports, and other SEDAR filings. Aggregating the individual mines’ cash flows and accounting for corporate-level overhead, we find that First Majestic’s NAV is just $2.46 at current silver prices, implying 80% downside for the stock. Below we summarize our model’s major outputs and underlying assumptions. Kerrisdale Capital Management, LLC | 1212 Avenue of the Americas, 3rd Floor | New York, NY 10036 | Tel: 212.792.7999 | Fax: 212.531.6153 20
First Majestic: Major Outputs of Mine-Level DCF Model
2016 2017 2018 2019 2020 2021
Silver ounces produced (mm) 11,305 18,809 20,510 19,829 8,648 1,059
Revenues $ 302 $ 496 $ 539 $ 520 $ 237 $ 35
Cost of sales 165 277 303 287 119 18
Gross margin $ 137 $ 219 $ 236 $ 233 $ 118 $ 17
Depletion, depreciation & amortization 80 80 80 80 80 80
Mine operating earnings $ 57 $ 139 $ 156 $ 153 $ 38 $ (63)
G&A expenses 17 17 17 17 17 17
Share-based payments 5 5 5 5 5 5
Foreign exchange gain (3) - - - - -
Operating income $ 37 $ 117 $ 134 $ 131 $ 16 $ (85)
Finance costs (8) (4) (4) (4) (4) (4)
Investment & other income 5 - - - - -
Earnings before income taxes $ 35 $ 113 $ 130 $ 127 $ 12 $ (89)
Income taxes 12 40 45 45 4 (31)
Net earnings $ 22 $ 74 $ 84 $ 83 $ 8 $ (58)
EBITDA $ 117 $ 197 $ 214 $ 211 $ 96 $ (5)
Capex 89 100 107 104 52 14
EBITDA − capex $ 29 $ 98 $ 107 $ 107 $ 43 $ (19)
Free cash flow $ 34 $ 105 $ 117 $ 95 $ 42 $ (16)
NPV of positive FCF at 5% $ 356
Less: net debt (55)
Equity fair value $ 411
Diluted shares 167
Equity fair value per share $ 2.46
Downside (80)%
Source: company filings, Capital IQ, Kerrisdale analysis
Key Assumptions
Commodity prices are static at the following values:
o Silver: $18.58 per ounce.
o Gold: $1,313 per ounce.
o Lead: $0.80 per pound.
o Zinc: $1.00 per pound.
Total silver production ramps to 20 million ounces per year by 2018.
Cumulative silver output is capped at First Majestic’s measured and indicated resources
(which are inclusive of proven and probable reserves). Each year, First Majestic uses a
specific silver price to assess what portion of the silver theoretically present in its mines
Kerrisdale Capital Management, LLC | 1212 Avenue of the Americas, 3rd Floor | New York, NY 10036 | Tel: 212.792.7999 | Fax: 212.531.6153 21it can economically extract. At the end of 2015, that price was $18.50 – very close to the
current price. We thus use the 2015 figures.
o We do not give First Majestic credit for its stated “inferred” resources. To quote
the company’s Form 40-F again, “Inferred mineral resources have a great
amount of uncertainty as to their existence, and great uncertainty as to their
economic and legal feasibility.” Some industry participants assume, as a rule of
thumb, that there’s only a 10% chance that “inferred” resources are there at all,
let alone recoverable at a profit. (Indeed, even probable reserves and measured
and indicated resources are often subjected to haircuts, which we do not apply
here.)
o We also focus on First Majestic’s operating mines rather than its few exploratory
properties. Bringing any of those properties into production would require major
capital expenditures as well as government permits, and, even if it cost nothing,
would be highly unlikely to swing the valuation by much relative to the current
price. As further discussed below, the NAV per share of each of First Majestic’s
operating mines is less than $1; it would thus take many, many new mines – at
zero cost – to bridge the gap between the equity’s $2.46 fair value and ~$12
market price.
The long-term cash tax rate is 35% per company guidance. However, we give the
company credit for net-operating-loss carryforwards, which we assume reduce cash
taxes to zero until 2019.
Additional mine-specific assumptions are listed in the table below.
First Majestic: Mine-Specific Assumptions for Mine-Level DCF Model
La
Santa Elena Encantada La Parilla Del Toro San Martin La Guitarra
Grade (Ag g/t) 85 203 245 221 231 338
Recovery 88% 58% 83% 79% 83% 82%
Payable as % of produced 99.9% 99.5% 92.0% 94.7% 99.9% 94.7%
AISC ($/oz) $ 2.21 $ 12.65 $ 10.33 $ 11.83 $ 10.86 $ 19.14
Cash cost ($/oz) $ (3.57) $ 10.57 $ 6.24 $ 7.76 $ 7.62 $ 6.80
Source: company filings, Kerrisdale analysis
What about New Mines?
Can First Majestic develop enough additional mines or find enough additional value at its
existing mines to somehow justify its valuation? We find it wholly implausible. Consider that,
based on the model just summarized, and gross of corporate-level overhead, each of First
Majestic’s six active mining projects (several of which technically consist of multiple mines) is
Kerrisdale Capital Management, LLC | 1212 Avenue of the Americas, 3rd Floor | New York, NY 10036 | Tel: 212.792.7999 | Fax: 212.531.6153 22worth just ~$0.60 per share.32 And that doesn’t factor in the large capital expenditures that it took to bring those projects into production in the first place. The reality is that, relative to First Majestic’s current valuation, building and expanding mines just isn’t that profitable. The La Parrilla mine serves as a case in point. First Majestic’s 2011 technical report includes a DCF analysis arguing that expanding and running the mine had a net present value of $79 million (at a 5% discount rate). However, this analysis assumed that the price of silver would be $23.85 per ounce; currently, it’s 22% lower. Based on the disclosed sensitivity of NPV to silver price,33 that move would have reduced the prospective La Parrilla NPV by 80% – from $79 million to just ~$16 million. With First Majestic trading at an almost $2 billion premium to the fair value of its existing projects, it would take a hundred La Parrilla-like opportunities to prevent the stock from being expensive. Similarly, consider the La Joya exploratory property. A preliminary economic assessment (“PEA”) prepared in 2014 for La Joya’s previous owner, SilverCrest, accorded it at a post-tax NPV of $92 million. However, silver and copper prices are now down meaningfully from the values assumed in the PEA – by 16% and 31%, respectively. (As a modest offset, the price of gold is higher.) Based on disclosed sensitivities,34 we estimate that La Joya’s NPV at current prices is just ~$15 million – an 84% decline. Moreover, early-stage analyses like PEAs are notoriously optimistic. At current prices, even a mere 10% overrun in projects costs (including capex) would drive the La Joya NPV negative. In short, new projects are a crapshoot: even small changes in commodity prices can quickly turn a promising opportunity into a write-off. Moreover, individual speculative properties don’t create enough value to meaningfully fill the enormous void separating First Majestic’s trading price and any rational estimate of its real worth. Especially in light of First Majestic’s mediocre long-term capital-allocation track record, the glib notion that the company will just keep finding silver (in an economically beneficial fashion) is senseless. Besides, other silver and gold miners also have the potential to find or acquire more resources – yet the market values them far more conservatively. There is just no reasonable explanation for First Majestic’s stock price; it should be 70-80% lower. 32 Here we exclude the benefit of net-operating-loss carryforwards since they would not apply to hypothetical new mines. 33 Note that the disclosed sensitivity analysis uses a 10% discount rate, not a 5% discount rate; however, the proportional effect would be similar for the 5% case that we focus on. See Section 22.2 of the technical report. 34 See Section 22.5 of the PEA. Using the table given in Figure 74, we linearly interpolated the NPV impact of current spot prices for silver, copper, and gold, and summed them to arrive at the overall change. Kerrisdale Capital Management, LLC | 1212 Avenue of the Americas, 3rd Floor | New York, NY 10036 | Tel: 212.792.7999 | Fax: 212.531.6153 23
You can also read