CFA INSTITUTE RESEARCH CHALLENGE - Find a Society
←
→
Page content transcription
If your browser does not render page correctly, please read the page content below
CFA INSTITUTE RESEARCH CHALLENGE
                                       hosted by
                                CFA Society Romania
                         Babeș-Bolyai University of Cluj-Napoca

The CFA Institute Research Challenge is a global competition that tests the equity
research and valuation, investment report writing, and presentation skills of university
students. The following report was prepared in compliance with the Official Rules of the
CFA Institute Research Challenge, is submitted by a team of university students as part of
this annual educational initiative and should not be considered a professional report.

Disclosures:
Ownership and material conflicts of interest
The author(s), or a member of their household, of this report holds a financial interest in the securities of this company.
The author(s), or a member of their household, of this report does not know of the existence of any conflicts of interest
that might bias the content or publication of this report.
Receipt of compensation
Compensation of the author(s) of this report is not based on investment banking revenue.
Position as an officer or a director
The author(s), or a member of their household, does not serve as an officer, director, or advisory board member of the
subject company.
Market making
The author(s) does not act as a market maker in the subject company’s securities.
Disclaimer
The information set forth herein has been obtained or derived from sources generally available to the public and believed
by the author(s) to be reliable, but the author(s) does not make any representation or warranty, express or implied, as to
its accuracy or completeness. The information is not intended to be used as the basis of any investment decisions by any
person or entity. This information does not constitute investment advice, nor is it an offer or a solicitation of an offer to
buy or sell any security. This report should not be considered to be a recommendation by any individual affiliated with
CFA Society Romania, CFA Institute, or the CFA Institute Research Challenge with regard to this company’s stock.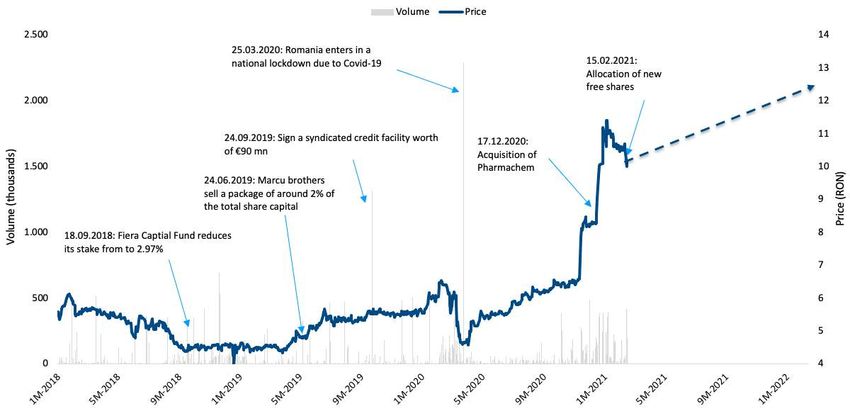
This report is published for educational purposes only by students competing in The CFA Institute Research Challenge       BABEȘ-BOLYAI University, FSEGA Research 2021

Stock exchange: BSE, Romania                                                                                                             Current price: RON 10.00
                                                                             Sector: Healthcare                                           Target price: RON 12.44
Symbol: M
                                                                        Industry: Healthcare Services                                               Upside: 24.4%
Date: Feb 15, 2021                                                                                                                        Recommendation: BUY

                                                          INVESTMENT SUMMARY
   Fig. 1: Market data                                   We issue a BUY recommendation with a 1-year target price of RON 12.44 representing a 24.4%
                                                         upside from the closing price of February 15, 2021. Our target price is driven by using a mix of a
     MARKET DATA                                         Discounted Free Cash Flow to the Firm model, together with an EV/EBITDA multiple
                                                         analysis, attributing a 70% and 30% weighting, respectively to each methodology. Our
     Closing price (Feb 15, 2021)        10 RON          recommendation is based on the following key assumptions:

     52 weeks high                     RON 12.6
                                                         Sustainable revenue growth
                                                         MedLife has been performing in a stable and sustainable manner over the last years, posting a
     52 weeks low                      RON 4.42          two-fold increase between 2015-2018 in revenues. An estimated 1.5x increase in sales between
                                                         2020-2025 will reinforce the inflow of cash, coming on the back of several factors: the increase of
     Average Daily volume (6M)            80,839         health expenditure supported by the aging population; additional health diseases due to the
                                                         pandemic and unhealthy life style habits; overburdened public health system; increasing needs
     Outstanding shares                132.87mn
                                                         for complex medical procedures; MedLife’s ambitious plans for growth strategy. The solid
                                                         revenue stream places the Company in an advantageous position compared to its peers, which
     Market cap                     RON 1,328mn
                                                         coupled with effective cost saving measures, leads to above industry profitability levels.
     P/E                                  243.19         Covid-19: black swan event — a blessing in disguise
                                                         Given the pandemic had a direct impact on the overwhelmed public healthcare system, we
   Source: BVB & Reuters
                                                         anticipate MedLife's FY20 sales to surge by 12% YoY to RON 1,087mn, amid increased demand
                                                         for care and Covid-19 testing. This atypical year is not only reflected in the top line but also
                                                         in the OPEX margin, which we expect to drop by 5bps to 90% on the back of the Covid-19-
                                                         related subsidies received during the lockdown.
   Fig. 2: Target price
                                                         High leverage to support the ambitious acquisition strategy
    BUY                                                  MedLife is mainly financing its growth strategy through long-term debt. This is backed by a
                                                         syndicated bank facility that totals 88% of LTD. The Company's 2.74x D/E ratio is explained by
    Share Price (Feb 15, 2021)        RON 10.00          the low level of interest rates, which make debt financing appealing to the Group. As the
                                                         Company continues to consolidate its market position, we expect the D/E ratio to decline in the
    Target Price                      RON 12.44          future amid lower need for additional external financing.

    Upside                                 24.4%         Market offers solid growth opportunities
                                                         Romania ranks one of the lowest among the EU countries in terms of health expenditure with
   Source: Team Analysis & BVB                           5.6% of GDP vs. the EU's average of 9.9% (Source: WorldBank, 2018). We note the recent
                                                         healthcare crisis has increased the awareness on diseases prevention among the
                                                         population, therefore industry spending is expected to grow leading to further business
                                                         opportunities.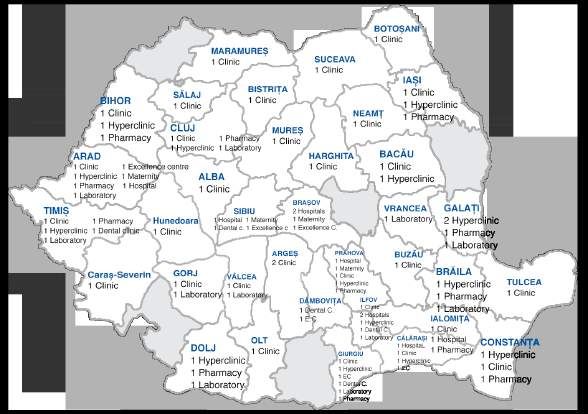
Fig. 3: MedLife medical units The Romanian public health care infrastructure is poorly developed, which gives the private
operators a competitive advantage. Although Romanians' life expectancy is among the lowest in
the EU, it has been rising in the past few years and it is expected to keep going up. This
increase opens up a door for a business opportunity, as the elder generations require more
care, treatment and assistance. We believe MedLife, as a market leader, possesses the
700,000 SUBCRIPTIONS 10 HOSPITALS 12 DENTAL CLINICS capacity, infrastructure and know-how to attract more customers from the public system and
meet the surging demand for care.
Experienced management with long tenure to bring added value
40 LABORATORIES
200 SAMPLE POINTS
20 PHARMACIES 79 CLINICS MedLife’s BoD expertise in economics, medicine and law, together with the long management
22 HYPERCLINICS
tenure, offer valuable insights and provide the right tools to lead the firm on the path towards
Source: Company Data the Group’s objectives. The Company evolved from a private office in a Bucharest apartment to a
leading player in the CEE private healthcare sector. The founding members are still at the
Company’s helm which gives credibility that the management is capable to further sustain the
Group’s long track record of growth, ultimately bringing added value to shareholders.
HIGHLIGHTS
Fig. 4: Shareholding structure
as of December 2019 Refinancing of the debt
MedLife renegotiated in 1Q 2020 a syndicated loan facility totaling circa EUR 110mn in order to
finance the extension of the M&A program, both nationally and internationally, as well as
Marcu Mihail fund the Group's R&D. This emphasizes the Company's reliance upon external funding when it
17,6 % comes to expansion and acquiring new businesses.
Other
Marcu Niculae Investors reap the benefits of owning the stock
12,2 %
51,7 % MedLife's stock price has showcased an impressive 62% growth rate between February 25th
Cristescu Mihaela 2020 (the day of the first Covid-19 case being reported in Romania as per Reuters) and February
14,0 % 15th 2021, underpinned by investors' optimism regarding the Company’s performance. This fact
IFC supports our assumption regarding MedLife's stability and sustainability following a period of
4,5 %
uncertainty.
Source: Company Data
Recent year-end acquisitions
By the end of 2020, MedLife cut the ribbon on several new acquisitions, such as: Pharmachem
(drug distribution company), CED Pharma (6 pharmacies), Veridia, and KronDent. These new
M&As are expected to generate substantial revenues in the future and to consolidate not just
the individual business lines, but also the whole Group.
Fig. 5: Business lines as % of sales
BUSINESS DESCRIPTION
Overview
22,87 % Tracing its roots back to 1996, MedLife has evolved from a private office in a Bucharest
apartment to a market leader in the private healthcare sector in Romania, reaching a sales figure
of RON 967mn in FY19. The major shareholder is represented by Marcu family, owning together
18,97 %
30,54 %
43.8% of the business (Fig. 4). On the back of its acquisition activities coupled with organic
growth (Appendix 5), MedLife now boasts with a widespread network of medical units (covering
up to 28 cities in Romania and having 3 units in Hungary) and a large client base (5mn unique
4,07 % 15,93 %
patients in Romania), representing one-fourth of the country’s population (Source: WorldBank).
1,44 % 6,18 %
All these developments led the Company to become one of the most important players in the
CEE.
Clinics Hospitals Corporate
Laboratries Stomatology Pharmacies
Other revenues Highly synergic business model
Source: Company Data The large spectrum of services offered by the Company represents an important success factor,
as it captures revenues from clients throughout all stages of medical assistance. MedLife divides
its operations into 6 business lines which cover the core activities of the private medical sector:
Corporate (18.97% of MedLife’s revenue), Clinics (30.54%), Laboratories (15.93%), Hospitals
(22.87%), Stomatology (6.18%), as well as Pharmacies (4.07%) (Appendix 4). The Clinics and
Hospitals are the main revenue drivers, having a weight of 53.41% of the Group’s revenues (Fig.
5), while the Corporate line (also with a high potential of capturing sales) has the largest client
Fig. 6: Healthy growth scenario base on the Romanian market (roughly 50% of market share, according to PMR Market Insight),
outcomes, USD trillion
is a pipeline for its other businesses.
High-income Upper-middle- Lower-middle-
Lower-income
countries income income
Strategy
5
countries countries countries
4.6 MedLife has a distinctive strategy from its peers, being focused on enlarging their market share
through a mix of acquisitions and organic growth. Based on the past M&A, MedLife carefully
3X picks out its acquisitions based on certain criterions: 1) Reaching synergies across business
2.8 lines - the wide range of services performed by the Company provides the flexibility of shifting
2X through the 6 business lines to adapt to the market conditions. For example, due to its most
recent acquisition of a drug distributor (Pharmachem), the Group is expected to further diversify
1.5 1.4 1.4 2X its services. 2) Geographical position - MedLife continues to develop its national footprint
4X
0.1 0.2 through organic growth and acquisitions. The Group is focused on bigger cities, with high
0.4
purchasing power and large population, but aims to achieve local synergies by also expanding in
Additional healthcare spending GDP
smaller cities. 3) Price-differentiated services - MedLife operates under two complementary
Source: McKinsey
brands, MedLife and Sfanta Maria, the latter being positioned as a low-cost service for the
population with lower incomes, working mainly with NHIH.
INDUSTRY OVERVIEW AND COMPETITIVE POSITIONING
          Fig. 7: Total health expenditure
          in Romania, EUR billion                                          The global healthcare market expenditures are projected to grow by 5.4% p.a.             (as of
                                                                           2018-2022) - almost a two-fold increase from 2.9% in 2013-2017 (Source: Deloitte), being driven
                                          .a.
                                  +9% p                                    by the expansion of healthcare coverage, the elderly populations’ increased need of medication
12                                                              11.54
                                                        9.7         20%
                                                                           as well as technological advancements.
  9            7.5        7.6      7.9
                                           8.5
                                                        21%

              21%         21%     22%      22%                             INDUSTRY OVERVIEW
  6
                                                                    80%
                                           78%          79%                Health - an important pillar of economic growth
  3           79%         79%     78%
                                                                           The global GDP could rise by USD 12 trillion, making an 8% increase in the next decade, due to
  0           2013        2014    2015     2016         2017        2018   expected health improvements (Source: McKinsey). McKinsey’s recent study estimated that one-
                   Public expenditure           Private expenditure        third of the economic growth could be attributed to the better health condition of the
          Source: McKinsey                                                 population, making healthcare contribute almost as much to income growth as education. Better
                                                                           healthcare systems translate into higher life expectancy and productivity improvement, a
                                                                           phenomenon expected more in low-income countries – the economic benefit could be of USD 2
                                                                           to USD 4 for each USD 1 invested (Fig. 6). Thus, healthcare providers will play an important role
          Fig. 8.1: YoY growth of healthcare
                                                                           in the next years to sustain a better lifestyle and prevent future diseases.
          expenditure, EUR /inhabitant
                                                                           Romanian health expenditure among the lowest in the EU
                       Romania            EU (27 countries)                Romanian healthcare expenditure is among the lowest in the EU (Source: Eurostat) in both per
 20                                                                        capita (EUR 584 compared to EUR 2,982 - 2018) and percent of the GDP (5.56% compared to
                                                              18.3%
                                                                           9.87% - 2018). Even though the Romanian health sector is significantly underfunded, an upward
                                           14.3%                           trend has been noticed, with a 9% p.a. growth in absolute expenditure in the last 6 years (Fig. 7)
 15                                                                        and massive growth rates compared to a steadier overall growth in the EU (Fig. 8). Romania is
                                                                           expected to outpace the CEE countries, with a 9.6% CAGR on private healthcare markets in
                                                                           2018-2023 (Fig. 9).
 10                              8%
                                                                           Aging population - an opportunity for healthcare providers
               5.2%
      5                                                                    Life expectancy in Romania has increased from 71.2 to 75.3 years (between 2000-2017), but it is
                                                                           still one of the lowest in the EU, with poor education being one of the most important reasons
                   2.8%          2.5%       3.4%               3%          for the longevity gap (Fig. 10). Yet, some positive changes might be expected in the future, as
      0                                                                    there are continuous actions that are set to improve the educational system, such as the
                   2015          2016           2017           2018
                                                                           digitalization of schools, the decentralization of the educational system by training the local
           Source: Team Analysis & Eurostat
                                                                           administration and ensuring equal access to education for all pupils. In this context, population
                                                                           aging provides an opportunity for healthcare services operators to capture additional revenues,
                                                                           as the health quality worsens with age (Appendix 6).

          Fig. 8.2: YoY growth of healthcare                               Poor lifestyle is the cause of more than half of deaths
          expenditure, % of GDP                                            Behavioral risk factors explain more than half of the deaths in Romania (62%), significantly
                                                                           higher than the EU average (44%). Poor diet poses a major risk, with three-fifths of adults not
                     Romania               EU (27 countries)
                                                                           eating at least one piece of fruit or vegetable daily, coupled with only 38% of adults reporting
                                                               8%          involvement in at least moderate physical activity. Furthermore, tobacco usage - with one-fifth of
      8
                                                                           Romanian adults smoking daily - and excessive alcohol consumption - which is the second
      6                                                                    highest in the EU - account for 31% of all deaths. This leads to poor health conditions and more
                                            3.2%                           complex and expensive medical services accessed. MedLife’s current leading market position
      4
                   1.8%                                                    and technological infrastructure offers significant leverage in treating complicated diseases.
      2                          1%
                                                                           A precarious public healthcare system represents an opportunity for private players
      0                                                                    Romania suffers from an outdated healthcare system, with high inpatient care expenditures,
                   -0.7%         0%             -0.4%          -0.2%       substantial OOP spending, and discrimination. The State is highly involved in the medical sector
  -2                                                                       (a large part of the hospitals is publicly owned), funding 79% of the health expenditures.
                   2015           2016           2017           2018
                                                                           However, the remaining 20% represents OOP spending (EU OOP average - 15.8%), mainly on
           Source: Team Analysis & Eurostat
                                                                           pharmaceuticals (Fig. 11), and creates barriers for vulnerable groups, such as minorities, people
                                                                           with no identity cards and without income. Even though a shift to outpatient care has been
                                                                           noticed, more than 42% of spending is still directed to inpatient care (EU average – 29%). Visits
                                                                           to GPs are low, resulting in the over-utilization of hospitals that are further obliged to discharge
          Fig. 9: 2018-2023 CAGR (%) for                                   patients. To all of that, the common practice of bribery in Romania adds up. The precarious
          development in private                                           public healthcare system represents a great opportunity for private providers, opportunities
          healthcare markets in CE
                                                                           strengthened by recent reforms.
10
            9.6%                                                           New horizons for the healthcare sector in Romania
7,5                   9.6%                                                 As the flawed public system fails to satisfy the needs of the population, attention turns towards
                                         6.4%                              private players to fill in the gap. Hence, in 2020, the local government decided to launch one of
 5                               5.7%
                                                    5.2% 5.5%              the most important healthcare reforms in the last 30 years, allowing private healthcare
2,5                                                                        companies to provide emergency services to patients with chronic diseases. As a consequence of
                                                                           free available treatment in private facilities, people may be tempted to choose the higher-quality
 0                                                                         services of a private operator. This measure is set to bring more patients to the private sector
              RO          PL      BG       SK           H           CZ     and generate additional revenues, with MedLife being an established brand and the private
          Source: PMR Report 2018                                          provider of choice (Appendix 11).
TRENDS
Fig. 10: Longevity gaps by education                  Shifting the paradigm from ’disease care’ to health care
                                                      Preventive healthcare is becoming a topic of global interest, as it is usually less expensive than
  Lower          Higher          Lower      Higher
 educated       educated        educated   educated   treatment and brings a higher economic return for countries in terms of higher productivity and
  women          women            men        men
                                                      financial prosperity. Nevertheless, Romania’s prevention expenditures are small, as little as EUR
                                                      18 per person in 2017 (1.7% of the total health spending, compared to 3.1% across the EU).
                                                      Moreover, the preventable mortality rate was the 4th highest in the EU (310 per 100,000
47.8 years    51.6 years     37.2 years 46.9 years    population compared with EU’s average of 161), while the rate of mortality from treatable
                                                      causes was the highest (208 per 100,000 population compared with EU’s average of 93). On a
Source: Country Health Report 2019,
European Commission
                                                      positive note, Romania started investing more in healthcare and developed programs for
                                                      promoting prevention (programs for reducing alcohol consumption, tobacco use aimed to be
                                                      reduced by banning consumption in public indoor spaces). This shift towards outpatient care
                                                      brings high benefits to the Group that has a widespread infrastructure and the ability to treat
                                                      numerous patients throughout diverse regions.

                                                      Technological breakthroughs to cut costs
Fig. 11.1: Share of OOP
                                                      The global R&D investments for the health sector today reach USD 300 billion, with more than
                                                      half coming from the private sector (Source: McKinsey). Technological developments are
                                                      expected to reduce the costs, making medical services more affordable and enhancing the profit
                                                      margins for healthcare providers. At the European level, the pandemic is expected to generate a
                                                      93% faster adoption of Telehealth and an 84% growth of online pharmacy channels (Source:
                                                      Bain&Company). Even though the digitalization of the healthcare sector is a new concept for
             79,5 %                   20,5 %          Romania (Fig. 12), it is important for companies to embrace new technologies to gain market
                                                      share. The Group is highly oriented towards innovation, being the first provider to implement
                                                      the Telehealth infrastructure even before the Covid-19 pandemic, having an online presence for
                                                      the Pharma segment and having an advanced technology, matching European standards.

                                                      The black swan that exposed the healthcare system’s vulnerabilities
                                                      The Covid-19 pandemic has proven just how important a well-functioning healthcare system is.
                                                      Facing a surge in demand, the local healthcare system’s weaknesses were once more exposed,
                                                      forcing the government to take corrective measures for alleviating the medical sector crisis. As
                                                      the lockdown measures hit the overall economy, the MedLife’s performance was also affected,
 Fig. 11.2: OOP spending by type                      yet it managed to recover the incurred losses in the following quarters. Due to the fear of
                                                      infection caused by the pandemic, a lot of MedLife’s clients postponed their usual health check-
                        Inpatient 0.2%
                                                      ups that are expected to be recovered in 2021.
                        Outpatient medical
                        care 1.8%                     COMPETITIVE POSITIONING
                                                      MedLife – the market’s leader
                     Pharmaceuticals                  MedLife Group is the leading player on the private healthcare market, being the first healthcare
                                                      provider to reach the threshold of one billion RON in revenue in 2020. The Group is competing
                                                      in a market with high entry barriers, imposed by the significant initial investment, multiple
                                                      regulations, and established competitors, such as Regina Maria and Medicover (Appendix 10).
                                                      Furthermore, due to lower costs, customers are oriented towards public providers (55.2% of the
                     Dental care 3.2%
                                                      Survey’s respondents used public services), but a compelling increase in the demand of private
                     Others 2.1%                      healthcare services is noticed, due to a better quality of the services and the drawback caused by
Source: Country Health Report
                                                      the bribery practices. Hence, having a renowned brand provides an important advantage to
2019, European Commission                             attract new clients that lean toward the private sector. MedLife and Regina Maria are the private
                                                      providers of choice, as the Survey’s results show: 29.4% used MedLife’s services and 25.8% used
                                                      Regina Maria’s services.

                                                      Competitive advantages
                                                      The rising interest in private healthcare services represents an opportunity for attracting loyal
                                                      customers that do not have a favorite provider. Companies must use their competitive
Fig. 12: Usage of telehealth
                                                      advantages to grow their client base. An important leverage of MedLife Group is based on their
in Romania
                                                      geographical coverage and the wide range of services offered that encompass the core medical
                                                      activities (Appendix 7). Over the years, MedLife positioned itself as a pioneer in the sector by
               NO            YES                      acquiring cutting-edge technology, implementing the concept of Hyperclinics in Romania, and
              22 %         14 %
                                                      developing ambitious projects, such as MedLife Park.

                                                      Regina Maria – the main challenger
                    Not familiar                      The main challenger of MedLife is Regina Maria, a privately owned company. The two companies
                    with the term                     hold 50% of the top 10 private providers market share (Source: McKinsey). However, there is a
                           64 %                       stark difference between the two companies’ financials. While Regina Maria incurred significant
                                                      losses over the last years and was subject of being sold, MedLife maintained its profitability and
Source: Team’s Survey
                                                      increased its revenues by 22% (2018-2019). MedLife and Regina Maria are also leaders in terms
                                                      of presence around the country (Appendix 9).
FINANCIAL ANALYSIS

 Fig. 13: Revenues estimation           Top Line fueled by greenfield projects and positive market trends
                                        We base our 5-year Sales projections on the Group’s solid track record and capacity to further
                                        grow organically, which imply a revenue expansion of 8.5% p.a. The Company’s expansionary
                                        policy that has been rolled out in 2014 backs our assumptions, as MedLife’s revenues increased
                                        at a 25.4% CAGR from 2015 to 2019, reaching RON 967mn. The market ultimately primes the
                                        Company for future greenfield projects, driven by: i) growing health spending due to an aging
                                        population; ii) potential health diseases caused by the Covid-19 pandemic and unhealthy trends;
                                        iii) overwhelmed public system & increasing demand for complex procedures that can be met
                                        by private operators only; iv) MedLife’s increasing market size amid market consolidation.

                                        Business Segments offer different growth perspectives
Source: Team Analysis                   We pencil in MedLife’s top line to reach RON 1,635mn by end-2025. We base our segments
                                        analysis on our in-depth KPIs projections for each individual business line (Appendix 14).
                                        Clinics: The tailwind for Group’s growth is projected to rise at a CAGR of 7.31% in the next 5
                                        years. Amid the pandemic taking a toll on people’s health, the peak in the number of patients is
                                        expected to drive the segment revenues. Increased health awareness might also play a role in
Fig. 14: Operating expenses             boosting the inflow of patients, as 28% of people are expecting to have post-pandemic vision
                                        and back pain problems, according to our Survey (Appendix 11).
                                        Hospitals: One of the main pillars of MedLife's business is seen to continue climbing by
                                        7.55% CAGR, driven by the rising no. of patients due to the build-up of postponed surgical
                                        operations in 2020. This could also be sustained by the pricing mix evolution, as average fees are
                                        expected to record a boost given more complex surgical needs.
                                        Laboratories: The complementary business line helped MedLife’s revenues remain resilient
                                        during the pandemic by offsetting the activity slowdown in Clinics and Hospitals. Going forward,
                                        the segment’s growth is seen to decelerate to 2% p.a. as we expect a phase-out in the Covid-19
                                        tests starting with 2Q21.
 Source: Team Analysis
                                        Corporate Line: An indispensable revenue stream, the corporate line has posted a constant
                                        annual growth of 13% over the last 5 years. The in-demand corporate subscriptions and fast-
                                        paced adoption rate might lead to a 3% CAGR in the periods to come. We believe the segment
                                        has reached maturity amid a strong market consolidation, which in turn will also help fuel the
                                        revenues of other business lines.
 Fig. 15: Expenses
                                        Stomatology: The premiumisation of dentistry services could bring double-digit growth of
                                        14% up to FY25. We see a solid upside potential, as recently acquired facilities and new clinics
                                        could allow for further organic expansion. The uprise in revenues could also be sustained by the
                                        necessity for this kind of services, with 8% of our respondents anticipating dental problems after
                                        the pandemic (Appendix 11).
                                        Pharmacies: Enticing new clients from nearby Clinics and Hospitals could lead to a 18%
                                        CAGR in the Pharmacies revenues from our perspective. The strong M&A momentum,
                                        supported by the acquisition of 6 pharmacies at end-2020, confirms the Group’s plans to
                                        continue focusing on expanding this segment.
                                        Pharmachem: The bridge that unifies all business lines is set to be integrated in 2Q21 and
                                        has a clear impact on the Group’s revenues. Our estimated 6% CAGR for the next 4 years is
 Source: Team Analysis & Company Data
                                        based on the past performance of the Company.

 Fig. 16: CAPEX evolution                    Contribution of each business line to FY25 top line

 Source: Team Analysis & Company Data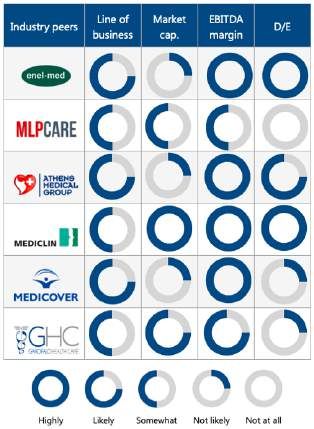
Fig. 17: Peers analysis                          Efficient control of OPEX despite high sensitivity to 4 main variables
                                                 More than 85% of the Operating Expenses are driven by Salaries, Third Party Expenses (mainly
                                                 doctor’s agreements), Consumables & Repair materials, and Depreciation (Fig. 15). MedLife’s
                                                 costs increased 1.47x between 2015-2019 due to the new shape of the business. We note the
                                                 increases in medical practitioners’ salaries by the State also put a direct pressure on the Group’s
                                                 expenses. Despite changing regulations, MedLife maintained a constant OPEX margin around
                                                 95% (Fig. 14), which is expected to drop in FY20 to approximately 90% due to the cost-efficient
                                                 measures taken. We foresee the margin to increase once again in FY21 as the newly
                                                 implemented measures will be offset by the integration of the pharmacies and distribution
                                                 company into the group.

                                                 CAPEX - necessary for development and to maintain quality standards
                                                 Capital Expenditures are expected to gradually grow as MedLife will need to invest in the newly
                                                 acquired companies to upgrade and maintain the equipment, as well as to ensure that the
                                                 quality of services is brought in line to MedLife’s standards. Medical equipment prices are steep,
                                                 thus they put a lot of pressure on the capital that needs to be invested. We estimated the CAPEX
                                                 by taking into consideration the useful life of each category of assets to get an accurate
                                                 projection about the equipment that will be replaced in the near future. We therefore pencil the
                                                 estimated investments at circa 5% of total sales, lower than previous years as a high % came
                                                 from business combinations (Fig. 16).
 Source: Team Analysis                           Debt - cheaper than other alternative sources of financing
                                                 MedLife is financing its activities through LTD, backed by a RON 420.2mn syndicated bank facility
                                                 (88% of total LTD), recently extended in 2020 until 2026. The D/E ratio of 2.74x is explained by
Fig. 18: WACC calculation
                                                 the low interest rate that helps the Group to finance its strong acquisition policy. MedLife also
                                                 uses leases for a major part of its activity, especially for vehicles and a large part of its medical
                                                 equipment. We expect MedLife to decrease its D/E ratio in the future as it reaches market
  Assumptions
                                                 consolidation and will not need external funds to further finance its activities. In terms of Net
  Risk-free rate                        2.85%    Debt/EBITDA, the Company is set to increase this ratio in comparison with 9M (2.5x) as the
                                                 EBITDA is expected to decrease once all the cost-efficient measures cannot be sustained
  Market risk premium                   6.85%    anymore in FY21.
  Beta                                    0.72
                                                 VALUATION
  Cost of equity                        7.81%
                                                 In order to reach the intrinsic value of the Company, we employed a DCF model to obtain the
  % of equity                            69 %
                                                 fair price of the share, ending up with a value of RON 12.27/share. We double-checked our DCF
  Cost of debt                          6.54%    valuation output by computing the stock price through a multiple EV/EBITDA approach, which
                                                 led us to a similar result of RON 12.83/share. Our target price for MedLife consists of a 70:30 mix
  % of debt                              31 %    between the two valuation methods, implying a final target price of RON 12.44/share. Due to the
                                                 small pool of similar peers, we assign a lower weight to the relative valuation of 30%.
  Tax-rate                               16 %
                                                 Intrinsic Valuation - FCFF model
  Cost of debt after tax                5.49%
                                                 Our intrinsic valuation is based on a 2-stage FCFF model: 2021-25E yearly forecasts and a
  WACC                                  7.08%    perpetuity growth of 3.5% for the Terminal Value. We note that the medical services are highly
                                                 correlated with the GDP of the country. Thus, we considered the expected growth rate of the
Source: Team Analysis &
Thomson Reuters & Damodaran
                                                 real GDP (3.5%) of Romania (Source: IMF), which leads us to a terminal value of RON 2,509mn. As
                                                 the terminal value and price are highly influenced by the growth rate and WACC, we
                                                 incorporated this value into the Monte Carlo analysis.
                                                 EBIT
                                                 The main drivers for EBIT are the Sales that are expected to grow at an 8.5% CAGR over the next
Fig. 19: Daily variation of EV/EBITDA multiple   5 years, along with the operational costs for which we maintain a 95% margin from the total
                                                 sales. MedLife took efficient cost-cutting measures to support the business during the pandemic,
                                                 which was further aided by state subsidies, leading to an all-time low operational margin. Our
                                                 forecast is based on the expected boost in the OPEX margin starting with FY21, which in return
                                                 will slightly decrease the EBIT and lower the FCFF. We used an effective rate of 30% to compute
                                                 the Net Operating Profit after tax.

                                                 WACC
                                                 We remained conservative and discounted the FCFF using a WACC of 7.08%, composed of a
                                                 7.81% cost of equity and a cost of debt of 6.54% – slightly higher than the effective interest rate
Source: Team Analysis                            of the Company (Fig. 18). We considered the market value of equity and the Company’s debt in
                                                 order to obtain a clear image of the Group’s value.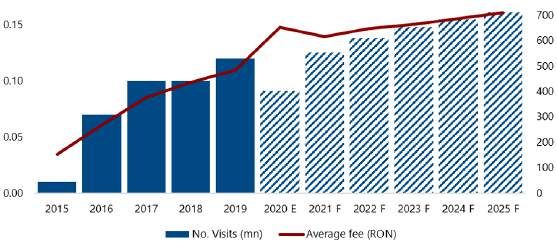
Fig. 20: MedLife and peers EV/EBITDA median          Beta: We ran a regression of the Group’s monthly prices over the past 4 years using the BET
                                                      Index as a benchmark. This led us to a beta of 0.72, which we consider appropriate for a
                                                      company operating in a non-discretionary industry.
                                                      Cost of Equity: We used the CAPM model to estimate the cost of equity. Our risk-free rate is the
                                                      10-year Romanian government bond, valued at 2.85%. The market risk premium equals 6.85%
                                                      (as per Damodaran’s figures) and is also adjusted to the country risk, as Romania is an emerging
                                                      market.
                                                      Cost of Debt: In order to approximate MedLife’s market value of debt, we computed a synthetic
                                                      bond rate (Appendix 17) that the Company would have had to pay to its bondholders if they had
                                                      issued any market debt. This gives us an estimated value of 5.49% after tax, which is also
                                                      adjusted to the country risk of 2.13% (as per Damodaran’s figures).
 Source: Team Analysis                                Relative valuation - Undervalued company with strong growth perspectives
                                                      After carefully analyzing the European healthcare industry, we identified 6 peers relevant to
                                                      MedLife’s services, market capitalization, and revenues (Fig. 17). We divided these into 2
                                                      categories: companies from Southern & Eastern Europe and Central & Western Europe. We note
                                                      MedLife predominantly traded at a discount between 2019-2020 based on the daily median of
 Fig. 21: DCF Monte Carlo simulation
                                                      the peers for the EV/EBITDA indicator, as the values were lower compared to the previous period.
                                                      At market price, MedLife currently trades at 10.6x FY20E EBITDA, implying a discount to the 3.6%
                                                      median of peers (Fig. 20). Applying the 19-20 EV/EBITDA median to the estimated EBITDA for
                                                      2020, we obtained an enterprise value of RON 2,239mn and a market capitalization of RON
                                                      1,704mn, which both lead to a target price of RON 12.83/share.

                                                      Risks to the target price
                                                      As different alterations in the assumptions of our valuation approach could significantly affect
                                                      the target price and deviate the BUY recommendation to HOLD or SELL, we performed two
  9                 11                                independent analyses for testing the effects of different changes in the main variables.
 Source: Team Analysis
                                                      Monte Carlo simulation
                                                      To understand the sensitivity of our valuation output to changes in the assumptions, we
                                                      performed a Monte Carlo simulation with 100,000 iterations for both the intrinsic and relative
                                                      valuation. For the DCF model, we took into consideration the terminal value, % of debt, the cost
                                                      of debt, and the cost of equity. After running the simulation, we reached an 83% probability for a
 Fig. 22: Peers Monte Carlo simulation                price over RON 11, supporting our BUY recommendation. Regarding the peers, we included the
                                                      EBITDA, the EV/EBITDA multiple, and the Enterprise Value. The Monte Carlo simulation results
                                                      displayed a probability of 86% for a BUY recommendation.

                                                      Sensitivity analysis
                                                      Based on the insights of our valuation model, we consider that MedLife’s price is sensitive to
                                                      changes, especially in the growth rate, WACC, sales, and operational expenditures. Therefore, we
                                                      developed a sensitivity analysis to assess the impact of these factors on our target price. It
                                                      reveals that the growth rate should decrease by 50 bps before our recommendation turns into a
        9        11        12.83                      HOLD, while the WACC should increase by 100 bps to become a SELL. A decrease of 10 bps in
 Source: Team Analysis                                sales growth rate will affect the Company’s revenues and change our recommendation to HOLD.
                                                      Similarly, if the OPEX increases by 10 bps, we reach the same verdict.

 Fig. 23: Sensitivity analysis

                                   OPEX                                                                                  Weighted Average Cost of Capital

                         -0.20% -0.10% 0.00%       0.10%   0.20%                                                               6.08%   6.58%   7.08%   7.58%   8.08%
                                                                                  BUY
                                                                                               Terminal Growth Rate

            0.20%        18.38     16.90   15.42   13.93   12.44                                                      4.00 %   23.32   18.09   14.53   12.01   10.09

            0.10%        16.80     15.32   13.84   12.35   10.86                  HOLD                                3.75%    20.64   16.34   13.32   11.11   9.41
SALES

            0.00%        15.22     13.75   12.27   10.78   9.28                                                       3.50%    18.48   14.88   12.27   10.33   8.80
                                                                                  SELL
            -0.10%       13.66     12.18   10.70   9.21    7.72                                                       3.25%    16.70   13.64   11.36   9.63    8.25

            -0.20%       12.10     10.62   9.14    7.65    6.16                                                       3.00%    15.21   12.57   10.56   9.01    7.76

Source: Team Analysis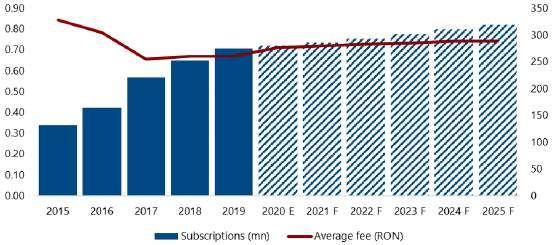
INVESTMENT RISKS
                                      STRATEGIC RISKS
                                      I.   Newly acquired companies risk lagging behind in quality standards
Fig. 24: Acquisitions revenues over
the total MedLife revenues            To boost its national footprint, MedLife has been pursuing the strategy of inorganic growth for a
                                      while now. Just to give a glimpse of the magnitude of acquisitions, sales of the acquired
                                      companies grew from RON 43mn in 2016 to RON 108mn, increasing their share in the Group’s
                                      top line figure from 8.55% to 11.16% during the same period. Given the high pace of expansion
                                      that averages to 5 newly acquired companies per year, there is a looming risk for quality
                                      discrepancy inside the Group as it might get more complicated for the newcomers to reach
                                      MedLife’s standards of quality.
                                      MedLife takes several important steps to mitigate this risk, such as: keeping the management of
                                      the acquired companies in the operational activities, so as to ensure a smooth transition and
Source: Team Analysis                 alignment with the Group’s standards, as well as offering training programs such as Life
                                      Academy to ensure the learning process of its employees.
                                      II. Price-quality trade-off exerts pressure on demand
                                      On the one hand, our survey reveals that MedLife is perceived by its customers as a high-quality
                                      service provider (4.24 out of 5 for the quality score). Yet quality comes with its costs as private
                                      healthcare operators charge a higher level of fees compared to the public system. This drawback
Fig. 25: Depreciation of RON to EUR
                                      was highlighted by our survey results as the main issue of the private sector. The ‘fee pressure’ is
                                      even worse if we frame it in the weakened macro-environment hammered by the Covid-19
                                      pandemic, with the unemployment rate estimated to surge to 5.9% YoY in 2020 and 6.2% YoY in
                                      2021, from the 2018 level of 2.9% YoY. Hence, there is an increasing risk that the Romanian
                                      population will not be able to afford MedLife´s treatments and consultations.
                                      On the other hand, these issues might be partially mitigated by the rising trend of medical
                                      tourism, as a great part of the Romanian population working abroad comes home to get
                                      treatments and solve their medical problems.

                                      FINANCIAL RISKS
Source: World Bank                    I.   Currency exchange rate
                                      As the Company operates in Romania and Hungary, its functional currencies are mainly RON and
                                      HUF. Yet, it still uses EUR to cover some of its expenses, such as: the purchase of equipment and
                                      interest payments, as over 88% of its long-term debt is denominated in EUR, implying a high
                                      exposure to the EUR/RON currency fluctuation. Although the Company doesn’t use any currency
                                      hedging instruments, we could say there is a natural hedge stemming from the Corporate
Fig. 26: Days in payables and days    business line (HPPs) where revenues are registered in EUR. Hence, it is important to mention that
in receivables ratios per year        this business line has only a 19% share in the total Group’s revenues (as of 2019). To sum up, the
                                      discrepancy between the high amount of debt denominated in EUR (EUR 487mn in 2019) and
                                      the low level of revenues obtained in the same currency poses a big threat for the financial
                                      standing of the Company.
                                      Historically, RON was on a depreciating trend against EUR (4.87 RON/EUR in 2020 vs. 4.48 RON/
                                      EUR in 2015), and according to the European Commission estimates, it is expected to hover
                                      around the same level by the end of 2021.
                                      II. Credit risk
                                      To finance its acquisitions, MedLife relies heavily on debt. In 2019, almost 80% of the Company’s
                                      funding was made through banks’ loans. On the bright side, this capital structure was supported
Source: Team Analysis
                                      by a decreasing trend in interest rates as suggested by the NBR data, with interest rates on long-
                                      term LCY loans granted to corporates decreasing from 6.44% YoY (as of December, 2014) to
                                      4.81% YoY (as of December, 2020).
                                      Although there is a risk that there will be more burdensome for the Company to honor its debt
                                      service, its interest coverage ratio increased from 2.46x in 2017 to 2.94x in 2019.
                                      In addition, the Company has a positive balance between trade payables and trade receivables
                                      and we expect it stay at this level for the upcoming period (Fig. 26).
Fig. 27: Romanian GDP growth rate
                                      MACROECONOMIC RISKS
                                      I.   Pandemic economic impact
                                      The Covid-19 pandemic took its toll on the Romanian economic activity, with the GDP growth
                                      falling to -5% YoY in 2020, according to the European Commission. Aside from the healthcare
                                      crisis, the recession environment is set to weigh on the population’s purchasing power. On a
                                      more positive note, the current crisis has increased the awareness towards the health topic, with
                                      people being more willing to set aside a bigger share of their budget for health procedures.
                                      Therefore, MedLife could leverage this opportunity by focusing on raising people’s awareness
Source: Statista                      about the importance of prevention and more regular check-ups.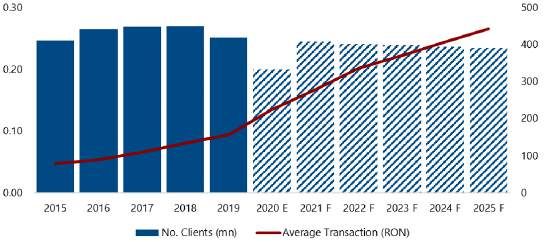
Fig. 28: Risk matrix                                OPERATIONAL RISKS
                                                    I.   Skilled workforce at risk
                                                    Malpractice is of great importance in the healthcare industry, as any mistake can cost a patient
                                                    their life. A public confrontation or scandal would affect the image of the Company and
                                                    consequently its business. Skilled workforce is a required criterion for ensuring the quality of the
                                                    services, as well as avoiding negligent medical procedures. Due to this fact, it is vital for MedLife
                                                    to have employed some of the best professionals’ in their field. The Covid-19 pandemic has
                                                    made it more difficult for currently enrolled medical students to find places for practice and
                                                    internships, an issue that might decrease the likelihood of highly trained professionals amongst
                                                    the younger workforce.
                                                    A mean to mitigate the risk is the LifeScience plan, a medical research and training center, which
                                                    allows students to interact and implement different ideas.

                                                    REGULATORY RISKS
                                                    I. Improvement of the State healthcare public medical units
Source: Team Analysis                               Romania is among the countries with the lowest expenditure on public healthcare as percentage
                                                    of the GDP (5.56% in 2018, Eurostat), which just sets a good opportunity for private healthcare
                                                    providers to bridge the gap for quality medical services. Nevertheless, this might change in the
                                                    future, as the government plans to improve the public health care facilities, with one of the
Fig. 29: Risk key issue
                                                    initiatives being the National Health Strategy 2014-2020.
                                                    Any increase in terms of quality of the public medical units may shift the patients from the
                                                    private sector to go to the public one. Even if the Government decision is still in an incipient
                                                    phase, the advantage of the public system is also the National Healthcare Insurance House,
                                                    which makes medical procedures more accessible in comparison with private operators that
                                                    don’t benefit as much from partnerships with NHIH.
                                                    II. Salary raise for public health care employees
                                                    The Company is also sensitive to legislation changes, especially ones that can affect its
                                                    operational costs. In 2018, the public system increased the medical practitioner's salaries by over
                                                    70% that encouraged doctors to move towards state hospitals. Hence, as other private
                                                    healthcare providers, MedLife was required to raise its third-party expenses to attract and retain
                                                    talented stuff. Moreover, many Romanian medicine graduates are leaving the country for more
                                                    developed economies, seeking higher salaries and better life standards, which can cause a
Source: MSCI                                        shortage in the healthcare labor force.

                                                    NATURAL RISKS
Fig. 30: Opportunity key issue                      I.   Natural disasters
                                                    The risk of an earthquake is significant in Bucharest. Unfortunately, the capital is not prepared
                                                    for such a natural disaster. In this context, MedLife clinics might not be fully capable to function,
                                                    due to the lack of electricity or the inability to access the facilities, with some of the medical
                                                    personnel also possibly being injured.
                                                    A way of mitigating the risk is to make sure the clinic buildings have low seismic risk and that the
                                                    medical personnel is well instructed about earthquakes protocols.

                                                    ENVIRONMENTAL, SOCIAL, AND GOVERNANCE

                                                    Methodology
                                                    To appraise the Company’s non-financial performance, we developed an ESG valuation model
Source: MSCI                                        by considering the MSCI ESG Rating Methodology, the CFA Principles of Corporate Governance,
                                                    and the BSE Governance Code. This valuation method rendered us a score of 7.01, which
                                                    corresponds to an A rating in the MSCI ESG Rating Methodology (Appendix 23 & 24).
Fig. 31 - Afforestation project                      After a careful analysis, we tailored the MSCI Methodology to the healthcare industry and
                                                    conducted an assessment for 6 Key Issues that were considered significant for the Environment
   Project name           Results                   and Social aspects. To figure out whether a company is adequately managing a key ESG risk or
                                                    leveraging an ESG opportunity, we evaluated both what management strategies it has employed
   Good for the           -Afforestation of 10 ha   and how exposed it is to the considered risk/opportunity. Hence, each risk and opportunity for
   environment -          -40,000 seedlings         the E and S was separately scored on a 0-10 sale. To score well on a Key Issue, management
   The Green project      planted                   needs to be proportionate to the level of exposure (Fig. 29 & 30).
   for Romania            -Over 300 employees
   (2019)                 involved
                                                    The final step of the analysis was to adjust the score by its industry, by applying the weights
                                                    (that are published by the MSCI for each subindustry) to determine each Key Issue’s
Source: Company Data                                contribution to the overall rating.
INITIATIVES TO PROTECT THE ENVIRONMENT
Taking into account that Environment factor is not as material for the healthcare industry as the
Social factor is, we assigned a 4% industry-adjusted weight to arrive at the final score. The
Fig. 32 - Quality certifications risks that we considered most appropriate for the valuation are the Toxic Emissions and
Waste, for they are directly linked to the Pharmaceuticals and Laboratories business lines.
Quality Certifications Providing for the fact that the management of clinical waste is strictly regulated in Romania, the
Company has implemented important environmental measures, such as: the collection and the
ISO 9001:2015 (Quality Assessment)
storage of waste in special containers handled by third party companies, reducing water
ISO 14001:2015 (Environmental
consumption and improving energy efficiency, as well as active implication in afforestation
Management System)
projects (Fig. 31). Given these efforts, we believe the Company scores 10 (the maximum score for
OHSAS 18001:2007 (Occupational
the KI) for the Environment factor.
health & safety management system)
Source: Company Data
SOCIAL FACTOR
Investments in workforce qualification and high-quality standards
MedLife has the largest private pool of doctors and nurses in Romania, which is set to
expand considering its ambitious acquisition strategy planned to be continued in the future.
Thus, the Company is highly exposed towards the risks of Labor Management and Product
Safety & Quality. In order to mitigate these risks, MedLife has implemented three standards of
Fig. 33 - MedLife awards quality (Fig. 32), and the numerous awards that it has received for its quality of services during
the years proves them successful (Fig. 33).
Award Year
As any company that strives to retain its personnel, MedLife seeks to provide adequate
Most trusted compensation and incentives to its employees as well as offer a variety of trainings and
2009-2015
Brand’ x6 programs for ensuring the quality of its services (Appendix 20).
Superbrands x5 including 2019 Moving on, another important social risk for MedLife is Privacy & Data Security due to its large
client database. The Company mitigates this risk by contracting international providers for its IT
Qudal x2 2016-2017 hardware infrastructure. The communication within the Group is highly secured by a virtual
private network, as well as the clients’ database.
ICERTIAS
certification for Leveraging the ‘Access to Healthcare opportunities’
2018
‘Superior Asides from risks, the Social aspect of the ESG also offers a major business opportunity –
Excellence’ x1 enriching the Access to Health Care for the Romanian community. Ranging from free online
Source: Company Data medical advice to pro-bono cases and numerous entrepreneurial programs, MedLife is well-
known for its efforts in sustaining and educating the Romanian community (Appendix 21). In
addition, during the Covid-19 pandemic, the Company has invested over EUR 500,000 in seeking
local solutions for treating the virus and helping the community to remain safe.
The overall score assigned for the Social Pillar is 4.24, calculated as individual score per KI
adjusted by the industry weights, totaling 65.1% of final score, giving its importance for the
healthcare industry.
Fig. 34 - Executive management
Name Posi,on
GOVERNANCE
Mihail Member and
Group’s Board of Directors & Executive Committee boasts strong business experience
Marcu Chairman of the BoD
& CEO since 2006 MedLife’s current BoD is composed of 7 members, each holding a 4-year mandate, including the
Nicolae Member of BoD and chairman Mr. Mihail Marcu, who is also the CEO, 4 re-elected members and 2 recently appointed
Marcu Chief Healthcare and new members (Appendix 22). It's important to notice that the BoD members have relevant
Opera,ons Officer experience to guide the business in the right direction with a strong background and experience
since December 2016 in economics, medicine and law. In terms of gender diversity, the Board is composed of 5 men
Dorin Member of BoD, and 2 women. The structure of the Executive Management can be seen in Fig. 34.
Preda Chief Finance and Business as a Family Heritage comes with its risks
Treasury since 2008 Our main concern regarding the Board’s structure falls upon the number of mandates held by
Adrian Chief Financial Officer the CEO and by other 4 re-elected members that reveal a high level of control over the Company
Lungu since 2012 by a few key members. In the same time, holding simultaneously a CEO and a chairman position
Radu Human Resources poses significant threats to the well-functioning of the business, being one of the most debated
Petrescu Director since 2017 issues in Corporate Governance Policies. Although we assume that MedLife’s governance
Geanina Retail Sales Director& structure mirrors its story, evolving from a family business to the largest private medical operator
Durigu Director of in the country and a public company since 2016, it still has the affinity with 'a family business',
Laboratories Division as depicted in the shareholder structure (Fig 4).
since 2008
Overall, MedLife’s governance practices cover a fair share of the required industry standards,
Mariana Procurement Director
reaching a score of 7.64, but there still needs to be an alignment with international standards of
Ilea- since 2016
government practices in some areas, such as disclosure of executive compensation, dividends
Brateș
Mirela Corporate Director
distribution, and distinct roles in top management.
Dogaru since 2014 Strong Vektor Indicator score
Larisa Medical Director
Looking at the ARIR’s indicator designed for the Romanian market, the Company scored 9 out of
Chiriac since 2017
10. Among the strongest points, ARIR mentions the IR management, its committees’ public
Vera Accoun,ng and Tax information, and the non-financial reporting. The weaknesses are mainly related to the
Firu Director since 2005 remuneration policy and to the inconsistencies detected between the information provided in
Source: Company Data English and Romanian languages.LIST OF ABBREVIATIONS
Abbreviation Term Abbreviation Term
BET Bucharest Exchange Trading Index HPPs Healthcare Prevention Packages
BoD Board of Directors IR Investor Relations
BSE Bucharest Stock Exchange KPI Key Performance Indicator
CAGR Compound Annual Growth Rate LTD Long Term Debt
CAPEX Capital Expenditure mn Millions
CAPM Capital Asset Pricing Model M MedLife
CEE Central and Eastern Europe M&A Mergers and Acquisitions
CEO Chief Executive Officer NHIH National Health Insurance House
DCF Discounted Cash Flow OOP Out of Pocket
D/E Debt-to-Equity Ratio OPEX Operating expenses
EBIT Earnings Before Interest and Taxes PMR Partnership for Market Readiness
Earnings Before Interest, Taxes,
EBITDA RES Risk Exposure Score
Depreciation and Amortization
EU European Union RMS Risk Management Score
EV Enterprise Value ROE Return On Equity
FCFF Free Cash Flow to the Firm R&D Research and Development
GDP Gross Domestic Product TS/KI Total Score per Key Issue
GPs General Practitioners WACC Weighted Average Cost of Capital
FINANCIAL STATEMENTS
APPENDIX 1 - INCOME STATEMENT
(RON, mn) 2017 2018 2019 2020E 2021F 2022F 2023F 2024F 2025F
Sales 623.2 794.6 967.4 1.087.4 1.312.9 1.376.9 1.467.5 1.553.6 1.634.9
Other operating revenues 7.5 9.8 7.6 7.65 7.65 7.65 7.65 7.65 7.65
Operating Income 630.7 804.4 975 1.095.1 1.320.6 1.384.6 1.475.1 1.561.2 1.642.6
Operating expenses (595.9) (766) (918.6) (982.8) (1.240.2) (1.296.4) (1.401.5) (1.481.8) (1.554.2)
D&A (43.1) (57) (93.3) (98.1) (96.3) (94.4) (103.5) (106.3) (108.4)
EBIT 34.9 38.4 56.4 112.3 80.4 88.2 73.6 79.4 88.4
EBITDA 77.9 95.4 149.7 210.4 176.7 182.6 177.1 185.7 196.8
Other financial expenses 0 3 0 0 0 0 0 0 0
(Loss)/Gain foreign exchange
(7.1) 0 (8.3) (6) (4.8) (5) (5) (5) (5)
rate impact
Finance cost (14.2) (17.6) (19.2) (25.6) (26.3) (25.7) (25.4) (25) (24.3)
Other income 0.1 0 0.1 0 0 0 0 0 0
Interest income 0.6 0 0.1 0 0 0 0 0 0
Financial result (20.6) (14.6) (27.4) (31.6) (31.1) (30.7) (30.4) (30) (29.4)
Result Before Taxes 14.3 23.8 29.1 80.7 49.3 57.5 43.2 49.3 59
Income tax expense (5.5) (7.1) (8.9) (24.3) (15) (17.4) (13.1) (15) (17.9)
Net Result 8.7 16.8 20.2 56.4 34.3 40.1 30.1 34.4 41.1
Source: Team Analysis & Company DataAPPENDIX 2 - BALANCE SHEET
(RON, mn) 2017 2018 2019 2020E 2021F 2022F 2023F 2024F 2025F
ASSETS
Goodwill 66 82.4 96 146.2 146.2 146.2 146.2 146.2 146.2
Intangible assets 34.3 39.6 43.3 42.3 42.4 42.6 42.8 42.9 42.2
Tangible fixed assets 325.8 458 491.2 534 539.2 541.7 545 550.7 560.8
Right of use assets 0 0 101.4 101.2 118.3 140.5 158.4 175.9 193.4
Financial fixed assets 6.2 10.1 79.8 19.6 19.6 19.6 19.6 19.6 19.6
Total non current assets 432.3 590.2 811.6 843.3 865.8 890.6 912 935.3 962.1
Inventories 20.3 31.1 43.4 55.5 80 90.3 97.7 108.5 117
Receivables 58.5 79 100.3 134.1 172.7 196.2 213.1 229.8 241.9
Cash at bank and at hand 79.2 34.2 38.9 98.7 123.5 139.3 143.4 147.7 156.5
Other receivables. AHS &
13 19.7 28.4 33.1 40.6 43.4 46.5 49.4 52
prepayments
Other receivables 5.5 13.1 20.8 23.3 28.2 29.6 31.5 33.4 35.1
Assets held for sale 0.4 0.4 0.4 0.4 0.4 0.4 0.4 0.4 0.4
Prepayments 7.1 6.2 7.2 9.4 12 13.5 14.6 15.7 16.5
Total current assets 171 163.9 211 321.5 416.7 469.1 500.7 535.4 567.4
Total assets 603.3 754.1 1,022.6 1,164.7 1,282.5 1,359.8 1,412.7 1,470.7 1,529.5
EQUITY
Issued capital 81.5 81.5 81.5 81.5 109.2 109.2 109.2 109.2 109.2
Treasury shares 0 (6.1) (2.7) (2.7) (2.7) (2.7) (2.7) (2.7) (2.7)
Reserves 93.2 93.9 108.7 110.6 83 83 83 83 83
Retained earnings (22.6) (10) (0.4) 55.9 90.2 130.3 160.4 194.7 235.8
Equity (owners of the
152 159.4 187.1 245.4 279.6 319.7 349.8 384.2 425.3
group)
Non (controlling interests 15.6 19.5 23.2 27 27 27 27 27 27
Total equity 167.7 178.9 210.3 272.4 306.6 346.7 376.8 411.2 452.3
LIABILITIES
Long term debt 242.8 287 346 402.6 416.7 401.7 389.2 379.2 363.8
Lease liability 10.1 26.5 99 114.8 136.9 154.3 171.5 188.7 203.1
Other long term debt 0 0 6.7 3.3 3.3 3.3 3.3 3.3 3.3
Long term liabilities 252.9 313.5 451.6 520.8 556.9 559.3 564 571.2 570.3
Trade accounts payable 103.8 141 172.8 197.7 252 284.5 304.4 323.1 341.2
Overdraft 2 30.9 29 24.6 24.6 24.6 24.6 24.6 24.6
Current portion of lease
3.2 8.9 46.7 30.7 25.8 30.6 31.3 31.5 34.6
liability
Current portion of long
36.6 23.2 24.8 30 28 25.5 23 20.5 18
term debt
Other 21.9 41.3 67.6 67.3 67.3 67.3 67.3 67.3 67.3
Current tax liabilities 1.1 0.7 0.3 5.4 5.4 5.4 5.4 5.4 5.4
Provisions 0 2.5 1.7 1.7 1.7 1.7 1.7 1.7 1.7
Other liabilities 20.2 37.6 65.1 59.7 59.7 59.7 59.7 59.7 59.7
Liabilities assets held for
0.6 0.5 0.4 0.4 0.4 0.4 0.4 0.4 0.4
sale
Total current liabilities 167.6 245.2 340.9 350.3 397.7 432.5 450.6 467 485.7
Deffered tax liability 15.2 16.4 19.8 21.3 21.3 21.3 21.3 21.3 21.3
Total liabilities 435.7 575.2 812.3 892.4 975.8 1,013.1 1,035.9 1,059.6 1,077.2
Total equity and liablities 603.3 754.1 1,022.6 1,164.7 1,282.5 1,359.8 1,412.7 1,470.7 1,529.5
Source: Team Analysis & Company DataAPPENDIX 3 - CASH FLOW STATEMENT
(RON, mn) 2017 2018 2019 2020E 2021F 2022F 2023F 2024F 2025F
Net income 8.7 16.8 20.2 56.4 34.3 40.1 30.1 34.4 41.1
D&A 43.1 57 93.3 98.1 96.3 94.4 103.5 106.3 108.4
Working capital
(12.8) 5.9 (1.8) (21) (8.7) (1.4) (4.4) (8.8) (2.5)
(increase)/decrease
Receivables (inc.)/
(15.2) (20.5) (21.4) (33.7) (38.6) (23.5) (16.9) (16.8) (12)
dec.
Inventories (inc.)/
(3) (10.7) (12.3) (12.1) (24.5) (10.3) (7.4) (10.8) (8.5)
dec.
Payables (dec.)/inc. 5.4 37.1 31.9 24.8 54.4 32.4 19.9 18.7 18.1
Other operating CF (3.2) (27.9) (1) 6.5 (7.4) (2.9) (3.1) (3) (2.6)
Operating CF 35.8 51.8 110.6 139.9 114.5 130.3 126.2 128.9 144.5
Purchase of
(1.5) (2.4) (3) (6.2) (7.5) (7.9) (8.4) (8.9) (8.4)
intangible assets
Purchase of tangible
(40.6) (49.9) (50.7) (87.8) (65.6) (65.7) (70.8) (75.1) (81.1)
assets
Business
(31.8) (17) (54.7) 0 0 0 0 0 0
combinations
Investing CF (74) (69.3) (108.4) (94.1) (73.1) (73.6) (79.2) (84) (89.6)
Free Cash Flow (38.1) (17.5) 2.2 45.9 41.3 56.6 46.9 44.9 54.9
Debt (decrease)/
43.6 (11.8) 48.6 54.1 12.1 (17.5) (15) (12.5) (17.9)
increase
Increase in loans 65.3 46.7 63.1 84.1 42.1 10.5 10.5 10.5 2.6
Payment of loans (21.7) (58.5) (14.5) (30) (30) (28) (25.5) (23) (20.5)
Dividends paid to
(0.3) (0.3) (0.2) 0 0 0 0 0 0
NCI
Share issues 67.6 0 0 0 0 0 0 0 0
IFRS 16 lease cost 0 0 (33.2) (45.9 (28.6) (23.4) (27.8) (28.2) (28.2)
Other financing CF (57.8) (3.6) (61.3) 5.7 0 0 0 0 0
Financing CF 96.6 (27.5) 2.5 14 (16.6) (40.9) (42.8) (40.7) (46.1)
Cash at Beginning
20.7 79.2 34.2 38.9 98.7 123.5 139.3 143.4 147.7
of Year
CF for the Year 58.5 (45) 4.7 59.9 24.8 15.8 4.1 4.2 8.9
Cash at End of Year 79.2 34.2 38.9 98.7 123.5 139.3 143.4 147.7 156.5
Source: Team Analysis & Company Data
BUSINESS DESCRIPTION
APPENDIX 4 - BUSINESS LINES
Clinics fuel the Top Line (30.54%)
The Clinic Business Line provides outpatient care across a wide spectrum of medical specialties and represents the
largest segment of the business (30.54%). MedLife has a nationwide network formed by 78 clinics, from which 22 are
Hyperclinics. Located in large cities with high purchasing power, the Hyperclinics offer clinical examination but also
Imaging and laboratory services. The Clinics are present in smaller urban areas and aim to facilitate the core needs of
both HPP and FFS clients.
Hospitals (22.87%)
The hospital business line (22.87%) provides inpatient and outpatient hospitalization in 10 hospitals, being the
largest private operator with a capacity of 919 beds in 2019 covering 10.14% of private beds in Romania. With 31
operating theaters, the Group has many specializations that vary from multidisciplinary (offer general care) to
monodisciplinary ones (specialized in pediatric, cardiac, and orthopedic care).
Corporate Business Line backed by a National Network (18.97%)
MedLife is part of a nationwide network called NetLife along with other 110 clinics whose main aim is to provide
qualitative services to corporate clients. The Company’s portfolio comprises 5,000 companies with more than 700,000
subscriptions which offers HPPs to corporate employees. MedLife has the highest client base and covers nearly 50%
of the market share for this segment, that is considered to be a pipe line for its other business lines.
Stomatology services focused on quality (6.18%)
MedLife owns majority stake in 12 Dental clinics which cover a large portfolio of services from general examination to
more complex procedures such as surgery, implants and orthodontic services. They provide customized services
based on age categories from children to teenagers and adults. Being the leader in a highly fragmented market, the
Group has many opportunities for further development either through brownfield or greenfield projects.You can also read