Global Leaders Quarterly Call Update June 30, 2021 - Sands Capital

Page created by Sara Fuller
 
CONTINUE READING
Global Leaders Quarterly Call Update June 30, 2021 - Sands Capital
Global
Leaders
Quarterly Call Update
June 30, 2021
Global Leaders Quarterly Call Update June 30, 2021 - Sands Capital
We are active, long-term investors in leading
innovative growth businesses, globally.

   All-IN CULTURE                                           INSIGHT-DRIVEN                                   YEAR FOUNDED
                                                                                                             1992
   We are one team dedicated to one mission and one         Businesses that can build a sustainable
   philosophy. As a fully independent and                   advantage are few and far between. To seek       OWNERSHIP
   staff-owned firm, we attract and retain strong talent,   them, we apply six criteria to separate signal
                                                                                                             Independent
   focus on long-term outcomes, and are highly aligned      from noise, identify what matters most, and
                                                                                                             100% Staff Owned
   with our clients’ interests.                             construct differentiated views on tomorrow’s
                                                            businesses, today.                               AUM
                                                                                                             $77.6B

                                                                                                             STAFF
   GLOBAL PERSPECTIVE WITH                                  HIGH CONVICTION
   LOCAL UNDERSTANDING                                      FOR HIGH IMPACT                                  162

   Innovation-driven growth knows no geographic             All our strategies concentrate investments in    HEADQUARTERS
   boundaries. Neither does our research team. We are       only our best ideas and avoid mediocrity. With   Arlington, VA, USA
   hands on, on-the-ground, deeply immersed                 the intent to own businesses for five years or
   in the ecosystems in which our businesses operate.       longer, we seek to create value for clients
                                                            through the compounding of business growth
                                                            over time.

All data is as of 6/30/2021.

SANDS CAPITAL MANAGEMENT, LLC · JUNE 2021 · D137                                                                                  2
Global Leaders Quarterly Call Update June 30, 2021 - Sands Capital
What We Do
With a singular focus on growth investing, we offer clients
strategies that actively target leading public and private
businesses across the growth spectrum.
                                                                                                                                                                                                        GLOBAL LEADERS

                                                                                                                                                                                                        30-50 public businesses
                                                                                                                                                                                                        Global opportunity set
                                                                                                                                                                                                        $3.9B AUM

                                                                                                                                                       SELECT GROWTH                                    GLOBAL GROWTH

                                                                                                                                                       25-30 public businesses                          30-50 public businesses
                                                                                                                                                       Primarily U.S.-focused                           Global opportunity set
                                                                                                                                                       $25.3B AUM                                       $30.5B AUM

                                                                                                                                                        EMERGING MARKETS                                INTERNATIONAL GROWTH

                                                                                                                                                        30-50 public businesses                         25-40 public businesses
                                                                                                                                                        Emerging and frontier markets                   International opportunity set
                                                                                                                                                        $15.2 B AUM                                     $107.6M AUM

                                                                                     PRIVATE GROWTH EQUITY                                             TECHNOLOGY INNOVATORS                             FOCUS STRATEGIES

                                                                                     Global Private Growth Fund I - Fully invested                     25-35 public businesses                           5-20 public businesses
                                                                                     Global Innovation I - Investing                                   Global opportunity set                            Global opportunity set
                                                                                     Global Innovation II - Investing                                  $1.1 B AUM                                        $1.5B AUM
                                  VENTURE CAPITAL
                                                                                     Life Sciences Pulse I - Investing
                                  Global Venture Fund I - Fully invested             Life Sciences Pulse II - Investing
                                  Global Venture Fund II - Investing
                                  Global Venture Fund III - Investing

All data is as of 6/30/2021. The above figures represent total Assets Under Management for each public investment strategy listed. The Venture Capital and Growth Equity investment strategies are managed by Sands Capital Ventures,
LLC, an affiliate of Sands Capital Management, LLC, and are only available to qualified investors. GIPS® Reports and additional disclosures for the related composites may be found at
http://sandscapital.com/media/Sands_Capital_Annual_Disclosure_Presentation.pdf or at the end of this presentation. References to “Sands Capital”, the “firm”, “we” or “our” are references to Sands Capital Management and its affiliates,
collectively, including Sands Capital Ventures, LLC (“Sands Capital Ventures”), which is a registered investment adviser that provides private market investment strategies, including its Private Growth Strategy to its clients. Sands
Capital Management seeks to adhere to the Global Investment Performance Standards (GIPS®) when reporting its investment performance results; however, Sands Capital Ventures does not.

SANDS CAPITAL MANAGEMENT, LLC · JUNE 2021 · D137                                                                                                                                                                                             3
Global Leaders Quarterly Call Update June 30, 2021 - Sands Capital
Investment Strategy & Results
Net Results (%) as of June 30, 2021
                                                                                                                                                                                      ANNUALIZED %

                                                                                              INCEPTION           STRATEGY                                                                                                  SINCE
                                                                                                DATE               ASSETS                 2Q21            1 YEAR          3 YEAR          5 YEAR         10 YEAR          INCEPTION
 Select Growth                                                                                 2/29/1992             $25.3B                10.9              47.4            29.6            29.7           20.1              14.1
 Russell 1000 Growth Index                                                                                                                 11.9              42.5             25.1            23.7          17.9              10.7

 Value Added (bps)                                                                                                                        -100               490             450             600            220               340
 Global Growth                                                                                12/31/2008             $30.5B                10.7              41.9            24.2            24.5           15.9              21.2
 MSCI All Country World Index                                                                                                               7.4              39.3            14.6             14.6           9.9              11.9

 Value Added (bps)                                                                                                                         330               260             960             990           600                930
 Emerging Markets Growth                                                                       12/31/2012             $15.2B               8.6               53.5             21.5           19.8              -              12.9
 MSCI Emerging Markets Index                                                                                                                5.0              40.9             11.3            13.0             -               5.6

 Value Added (bps)                                                                                                                         360              1,260           1,020            680               -              730
 Global Leaders                                                                                 3/31/2017             $3.9B                9.4               34.8            20.5                -             -              21.6
 MSCI All Country World Index                                                                                                               7.4              39.3            14.6                -             -              13.9

 Value Added (bps)                                                                                                                         200              -450             590                 -             -              770
 International Growth                                                                          3/31/2018            $107.6M                10.3              47.7             32.1               -             -              30.2
 MSCI All Country World Index ex US                                                                                                         5.5              35.7             9.4                -             -               7.7

 Value Added (bps)                                                                                                                         480              1,200           2,270                -             -            2,250
 Technology Innovators                                                                         12/31/2010              $1.1B               12.2              51.9             37.1           36.8          24.0               23.5
 MSCI ACWI Info Tech and Communication Services Index                                                                                       9.8              44.8            24.5            27.0           18.5              17.6

 Value Added (bps)                                                                                                                         240                710           1,260            980            550               590

The investment results shown are net of advisory fees and reflect the reinvestment of dividends and any other earnings. Investment results presented are that of the Tax-Exempt Institutional Equity Composite, Global Growth Equity
Composite, Global Leaders Equity Composite, Emerging Markets Growth Composite, International Growth Equity Composite and Technology Innovators Equity Composite. GIPS® Reports and additional disclosures for the related
composites may be found at http://sandscapital.com/media/Sands_Capital_Annual_Disclosure_Presentation.pdf or at the end of this presentation. Past performance is not indicative of future results.

SANDS CAPITAL MANAGEMENT, LLC · JUNE 2021 · D137                                                                                                                                                                                       4
Global Leaders Quarterly Call Update June 30, 2021 - Sands Capital
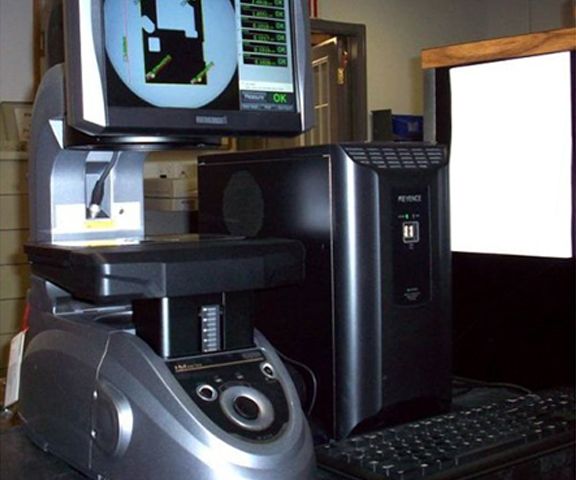
Global Research Team
 RE S E ARCH ANALYSTS                                                                                                                             PORT FOLIO MANAGE RS
                                                                                                                                                  SELECT GROWTH                                      GLOBAL GROWTH
                                                                                                                                                  Frank Sands, CFA                    2000*          Brian Christiansen, CFA              2006
                                                                                                                                                  Sr. Portfolio Manager                              Sr. Portfolio Manager
                CONSUMER                                                             LIFE S C IE NC E S
                                                                                                                                                  Wesley Johnston, CFA                2004           David Levanson, CFA                  2002*
         Christina Hang 2018                                                         Daniel Cheng 2013                                            Sr. Portfolio Manager                              Sr. Portfolio Manager
      Massi m o Marolo, CFA 2018                                                 Michael Gi nder, CFA 2011
                                                                                                                                                  Michael Sramek, CFA                 2001           Perry Williams, CFA                  2004
     Matthew Luneburg, CFA 2006                                               J enni fer Go ldsmith, CFA 2013                                     Sr. Portfolio Manager                              Sr. Portfolio Manager
        K atherine Okon 2012*
                                                T E C H NO L O GY                                                                                 Thomas Trentman, CFA                2005
                                              Kumar Gautam 2020*                                                                                  Sr. Portfolio Manager
                                                                                                                                                                                                      GLOBAL LEADERS
                                              Judy Jiao, CFA 2015
                                          Barron Marti n, Jr., CFA 2008                                                                                                                               Sunil Thakor, CFA                   2004
                                                                                                                                                  EMERGING MARKETS GROWTH                             Sr. Portfolio Manager
                                               Daniel Pi l l ing 2018
                                           Tho m as Rogers, CFA 2014                                                                              Brian Christiansen, CFA             2006            Michael Raab, CFA                   2007
                                                                                                                                                  Sr. Portfolio Manager                               Portfolio Manager
             INDUS T R IAL S                                                                                                                      Ashraf Haque                        2008
                                                                                      F INANC IAL S
               Eric Black 2013                                                                                                                    Sr. Portfolio Manager
                                                                                  Teeja Boye, CFA 2014                                                                                               INTERNATIONAL GROWTH
        Brian Keegan, CFA 2011                                                                                                                    Neil Kansari                        2008
                                                                                Jason Harden, CFA 2012                                            Sr. Portfolio Manager                              Ashraf Haque                         2004
     Dani el le Menichel la, CFA 2013
                                                                                                                                                                                                     Sr. Portfolio Manager
                                                                                                                                                                                                     Sunil Thakor, CFA                    2008
                                                                                                                                                  FOCUS STRATEGIES                                   Sr. Portfolio Manager
                                                S T E WAR DS H IP
                                                                                                                                                  Michael Sramek, CFA                  2001
                               Brian Christiansen, CFA, Director of Stewardship
                                                                                                                                                  Sr. Portfolio Manager
                                     K ari n Riechenberg, Sr. ESG Analyst                                                                                                                            GLOBAL INNOVATION
                                                                                                                                                                                                     Michael Clarke                         2011
    Depth                                                                                                                                        TECHNOLOGY INNOVATORS                               Managing Partner
    We know our businesses. With approximately 138 aggregate portfolio businesses and 47                                                         Thomas Trentman, CFA                 2005           Barron Martin, CFA                    2008
    investment professionals, our people dig deep for insights. Intimate knowledge of a small                                                    Sr. Portfolio Manager                               Managing Partner
    number of companies is more valuable than superficial knowledge of many companies.
                                                                                                                                                 Emerson Bluhm, CFA                   2010
    Focus                                                                                                                                        Portfolio Manager
    We’ve developed substantial domain knowledge in business spaces where innovation and                                                                                                             VENTURE/PRIVATE GROWTH
                                                                                                                                                 Michael Clarke                       2011
    industry transformation are rampant. Domain experience enables us to recognize patterns,                                                                                                         Ian Ratcliffe                        2016
    identify analogues, and understand business models and ecosystems.                                                                           Portfolio Manager
                                                                                                                                                                                                     Managing Partner
    Collaboration                                                                                                                                                                                    Michael Graninger                    2018
    All PM’s are analysts first. Together, they are integrally involved in every step of the research                                             LIFE SCIENCES PULSE                                Partner
    process. Our organization is intentionally designed to encourage analysts to work in sectors,                                                 Stephen Zachary, PhD                2016
    not within silos, reflecting the interconnected webs in which our businesses operate.                                                         Managing Partner
All data is as of 6/30/2021. * Denotes year that staff member had re-joined Sands Capital. The Venture/Private Growth, Life Sciences Pulse, and Global Innovation investment strategies are managed by Sands Capital Ventures, LLC, an
affiliate of Sands Capital Management, LLC, and are only available to qualified investors. References to “Sands Capital”, the “firm”, “we” or “our” are references to Sands Capital Management and its affiliates, collectively, including Sands
Capital Ventures, LLC (“Sands Capital Ventures”), which is a registered investment adviser that provides private market investment strategies, including its Private Growth Strategy to its clients.

SANDS CAPITAL MANAGEMENT, LLC · JUNE 2021 · D137                                                                                                                                                                                                   5
Global Leaders Quarterly Call Update June 30, 2021 - Sands Capital
Power of Long-term Compounding
    Global Leaders vs. MSCI All Country World Index
    Net Results for Period Ending June 30, 2021

                                                                                                 Annualized Since                       Cumulative Since
                                                                                                    Inception 1                           Inception 1
                                                                      Portfolio                           21.6                                   129.4
                                                                      Benchmark                            13.9                                   73.6
   140

   120

   100

    80

    60

    40

    20

      0
          '17                                                 '18                                                 '19                                                 '20                                                 '21

1Inception date is 3/31/2017. The investment results shown are net of advisory fees and reflect the reinvestment of dividends and any other earnings. The investment results are that of the Global Leaders Equity Composite. GIPS®

Reports and additional disclosures for the related composites may be found at http://sandscapital.com/media/Sands_Capital_Annual_Disclosure_Presentation.pdf or at the end of this presentation. Past performance is not indicative of
future results. Source: SCM, MSCI.

SANDS CAPITAL MANAGEMENT, LLC · JUNE 2021 · D137                                                                                                                                                                                         6
Global Leaders Quarterly Call Update June 30, 2021 - Sands Capital
Annualized Investment Results
Global Leaders vs. MSCI All Country World Index
Net Results (%) as of June 30, 2021

        Portfolio        Benchmark

                                                                                                                             39.3

                                                                                                               34.8

                                                                                                                                                                                                            21.6
                                                                                                                                                             20.5

                                                                                                                                                                          14.6                                           13.9
                                                                               12.3
                    9.4
                                 7.4                              7.7

                          QTD                                           YTD                                         1 Year                                       3 Years                                 Since Inception

Inception date is 3/31/2017. Periods greater than one year are annualized. The investment results shown are net of advisory fees and reflect the reinvestment of dividends and any other earnings. The investment results are that of the
Global Leaders Equity Composite. GIPS® Reports and additional disclosures for the related composites may be found at http://sandscapital.com/media/Sands_Capital_Annual_Disclosure_Presentation.pdf or at the end of this
presentation. Past performance is not indicative of future results. Source: SCM, MSCI.

SANDS CAPITAL MANAGEMENT, LLC · JUNE 2021 · D137                                                                                                                                                                                            7
Global Leaders Quarterly Call Update June 30, 2021 - Sands Capital
Yearly & Cumulative Investment Results
Global Leaders vs. MSCI All Country World Index
Net Results (%) as of June 30, 2021

                                                                                                                                                               RELATIVE VALUE                 CUMULATIVE VALUE
                                                                                              PORTFOLIO                        BENCHMARK                        ADDED (BPS)                      ADDED (BPS)

 2017                                                                                             21.3                              16.0                                530                                530
 2018                                                                                              2.0                              -9.4                               1,140                             1,880
 2019                                                                                             35.8                             26.6                                 920                             3,500
 2020                                                                                             26.8                              16.3                              1,050                             5,840
 2021                                                                                               7.7                             12.3                               -460                             5,580
                                                                               1Q                  -1.6                              4.6                               -620                             4,800
                                                                               2Q                  9.4                               7.4                                200                             5,580
 Cumulative Since Inception (3/31/17 - 6/30/21)                                                 129.4                               73.6                              5,580
 Annualized Since Inception                                                                       21.6                              13.9                                 770

Inception date is 3/31/2017. The investment results shown are net of advisory fees and reflect the reinvestment of dividends and any other earnings. The investment results are that of the Global Leaders Equity Composite. GIPS® Reports
and additional disclosures for the related composites may be found at http://sandscapital.com/media/Sands_Capital_Annual_Disclosure_Presentation.pdf or at the end of this presentation. Past performance is not indicative of future
results. Source: SCM, MSCI.

SANDS CAPITAL MANAGEMENT, LLC · JUNE 2021 · D137                                                                                                                                                                                             8
Global Leaders Quarterly Call Update June 30, 2021 - Sands Capital
Global Leaders Portfolio Profile Summary
Global Leaders vs. MSCI All Country World Index
As of June 30, 2021

COMPOSITION                                                 PORTFOLIO BENCHMARK                              REGION EXPOSURE (%)                           PORTFOLIO BENCHMARK                                ACTIVE WEIGHT
Number of Holdings                                                 36               2,975                    US/Canada                                        59.4                 61.5                    -2.1
Assets                                                           $3.4B               n/a                     Developed Asia                                   18.2                  8.9                                           9.3
Benchmark Holdings                                                83%                n/a                     W. Europe                                         12.2                16.6                -4.4
Active Share                                                      93%                n/a                     Emerging Asia                                      9.4                10.2                       -0.8
Trailing 12 mos. Turnover                                         26%                n/a                     Latin America                                        –                  1.1                      -1.1
                                                                                                             Mid-East & Africa                                    –                  1.1                      -1.1
                                                                                                             E. Europe                                            –                 0.6                       -0.6
CHARACTERISTICS                                             PORTFOLIO BENCHMARK
                                                                                                             [Cash]                                             0.9                   –                                0.9
SCM Long-Term EPS Growth Estimate                                 25%               n/a
Consensus Long-Term EPS Growth Estimate                           18%               17%
Weighted Avg. Market Cap                                        $176.9B           $343.7B
Median Market Cap                                               $53.8B             $13.1B
Consensus Forward P/E - Next 12 mos.                              29x               18x
Dividend Yield                                                   0.5%               1.7%
                                                                                                             SECTOR EXPOSURE (%)                           PORTFOLIO BENCHMARK                                ACTIVE WEIGHT
                                                                                                             Information Technology                           25.4                 21.9                                  3.5
TOP 10 HOLDINGS                                    WEIGHT (%)         DATE PURCHASED                         Industrials                                      19.9                  9.9                                        10.0
Roper Technologies                                       4.6                  Apr-19                         Health Care                                      13.9                 11.6                                 2.3
Alimentation Couche-Tard                                 4.2                  Mar-17                         Consumer Discretionary                           10.8                 12.8                       -2.0
Charter Communications                                   3.9                  Apr-20                         Financials                                       10.4                 14.1                   -3.7
Taiwan Semiconductor                                     3.7                  Mar-17                         Communication Services                           10.2                  9.4                                0.8
Keyence                                                  3.7                  Mar-17                         Consumer Staples                                  6.6                  6.9                         -0.3
Visa                                                     3.7                  Mar-17                         Real Estate                                       2.0                  2.6                        -0.6
Chegg                                                    3.7                  May-20                         Materials                                           –                  4.9                  -4.9
Intuit                                                   3.5                  Mar-17                         Energy                                              –                  3.4                   -3.4
AIA                                                      3.4                  Oct-18                         Utilities                                           –                  2.6                    -2.6
IQVIA                                                    3.3                  Aug-19                         [Cash]                                            0.9                    –                                0.9
Total                                                   37.5

All values are that of the Global Leaders Equity Composite. The companies illustrated above represent a sub-set of current holdings in the Global Leaders Equity Composite and were selected based on the performance measures
presented. Pricing obtained from IDC. Rounding may cause figures to vary from 100.0%. GIPS® Reports and additional disclosures for the related composites may be found at
http://sandscapital.com/media/Sands_Capital_Annual_Disclosure_Presentation.pdf or at the end of this presentation. Source: SCM, MSCI.

SANDS CAPITAL MANAGEMENT, LLC · JUNE 2021 · P336                                                                                                                                                                                      9
Global Leaders Quarterly Call Update June 30, 2021 - Sands Capital
Contribution Analysis: Quarter to Date
   Global Leaders vs. MSCI All Country World Index
   Period Ending June 30, 2021

BEST PERFORMERS (%)                                                                                                               TOP ABSOLUTE CONTRIBUTORS (%)

                                AVERAGE        TOTAL        ABSOLUTE         RELATIVE                                                                            AVERAGE TOTAL               ABSOLUTE RELATIVE
COMPANY                                                                                      GICS SECTOR                          COMPANY                                                                                  GICS SECTOR
                                 WEIGHT       RETURN        CONTRIB.         CONTRIB.                                                                             WEIGHT RETURN               CONTRIB. CONTRIB.

Cloudflare                        2.3          50.6            1.0             1.0           Information Technology               Cloudflare                        2.3          50.6           1.0            1.0         Information Technology

Intuit                            3.2          28.1            0.8             0.8           Information Technology               Intuit                            3.2          28.1           0.8            0.8         Information Technology

Lonza                             2.4          27.0            0.6             0.6           Health Care                          IQVIA                             3.4          25.5           0.8            0.8         Health Care

IQVIA                             3.4          25.5            0.8             0.8           Health Care                          Sea                               3.5          23.0           0.8            0.8         Communication Services

Sea                               3.5          23.0            0.8             0.8           Communication Services               Roper Technologies               4.4           16.7           0.7            0.7         Industrials

WORST PERFORMERS (%)                                                                                                              TOP ABSOLUTE DETRACTORS (%)

                                AVERAGE        TOTAL        ABSOLUTE         RELATIVE                                                                            AVERAGE TOTAL               ABSOLUTE RELATIVE
COMPANY                                                                                      GICS SECTOR                          COMPANY                                                                                  GICS SECTOR
                                 WEIGHT       RETURN        CONTRIB.         CONTRIB.                                                                             WEIGHT RETURN               CONTRIB. CONTRIB.

Bright Horizons                   1.9          -14.2          -0.3             -0.3          Consumer Discretionary               Bright Horizons                   1.9          -14.2          -0.3           -0.3        Consumer Discretionary

MonotaRO                          2.2          -12.4          -0.3             -0.3          Industrials                          MonotaRO                          2.2          -12.4          -0.3           -0.3        Industrials

Pan Pacific                       1.2          -11.6          -0.2             -0.2          Consumer Discretionary               Pan Pacific                       1.2          -11.6          -0.2           -0.2        Consumer Discretionary

HDFC Bank                         2.7          -5.6           -0.2             -0.2          Financials                           Chegg                             3.8          -3.0           -0.2           -0.2        Consumer Discretionary

Chegg                             3.8          -3.0           -0.2             -0.2          Consumer Discretionary               HDFC Bank                         2.7          -5.6           -0.2           -0.2        Financials

   Contribution and performance are calculated using end of day prices, and do not reflect actual purchase prices. This can affect the presentation of contribution and performance of IPOs and other transactions amid heightened volatility.
   Global Leaders may participate in IPOs in eligible accounts and purchase additional shares in the secondary market. All values are that of the Global Leaders Equity Composite. The companies illustrated above represent a sub-set of
   current holdings in the Global Leaders Equity Composite and were selected based on the performance measures presented. Top and Bottom absolute contribution figures were calculated by multiplying the security's average weight by
   the security's return. The investments results shown are gross of advisory fees and reflect the reinvestment of dividends and any other earnings. The client's return will be reduced by these fees and expenses in addition to any other costs
   incurred in the management of the account. Pricing obtained from IDC. To receive a complete list of and description of the calculation methodology for the attribution analysis and complete list detailing each holding’s attribution please
   contact a member of the Client Relations Team at 703-562-4000. GIPS® Reports and additional disclosures for the related composites may be found at http://sandscapital.com/media/Sands_Capital_Annual_Disclosure_Presentation.pdf or
   at the end of this presentation. Past performance is not indicative of future results. Source: SCM, MSCI.

   SANDS CAPITAL MANAGEMENT, LLC · JUNE 2021 · P336                                                                                                                                                                                          10
Attribution Analysis: Quarter to Date
Global Leaders vs. MSCI All Country World Index
Period Ending June 30, 2021
 Total Effect               Selection Effect             Allocation Effect                     Currency Effect
                                   3.0                        2.5
                                   2.5                        2.0
                                   2.0
                                                               1.5
                                    1.5
                                                               1.0
                                   1.0
      BY REGION (%)                0.5
                                                              0.5

                                   0.0                        0.0
                                  -0.5                       -0.5
                                   -1.0                       -1.0

                                            Total                          US/Canada                  W. Europe          Developed Asia           Mid-East & Africa               E. Europe          Latin America             Emerging Asia
Portfolio Weight (avg)                      100.0                             58.4                        12.1                19.0                         –                            –                   –                       9.4
Index Weight (avg)                          100.0                               60.9                     16.9                   9.3                       1.1                        0.6                       1.1                  10.2

Portfolio Return                              9.4                               12.4                      8.5                   4.9                        –                           –                        –                    2.5
Index Return                                  7.4                                8.9                      7.4                   1.3                       4.1                        13.7                  14.1                     3.8
Relative Return                               2.0                                3.5                      1.1                   3.6                      -4.1                       -13.7                 -14.1                     -1.3

                                   2.5                         1.5
                                   2.0
                                                               1.0
                                    1.5
                                                              0.5
      BY SECTOR (%)                1.0
                                                              0.0
      (GICS Sectors)               0.5

                                   0.0                       -0.5

                                  -0.5                        -1.0

                                                                                       Information   Communication   Consumer                                                                                                       Consumer
                                            Total                    Health Care                                                      Utilities     Real Estate       Materials             Energy   Financials      Industrials
                                                                                       Technology      Services       Staples                                                                                                      Discretionary
Portfolio Weight (avg)                      100.0                       13.8               24.3          10.4           6.6                –             1.9               –                    –       10.2            20.7            11.1
Index Weight (avg)                          100.0                        11.4             21.3            9.4           6.9              2.8            2.6               5.1                 3.4       14.4            10.0               12.6

Portfolio Return                              9.4                        17.5             13.9            17.3          9.8                –           18.6                –                    –        1.9             4.1               -1.2
Index Return                                  7.4                        9.4              10.5            8.0           5.7             -0.5            8.4              5.9                  9.5        6.2             4.7               5.9
Relative Return                               2.0                         8.1              3.4            9.3           4.1              0.5           10.2             -5.9                  -9.5      -4.3            -0.6               -7.1

Contribution and performance are calculated using end of day prices, and do not reflect actual purchase prices. This can affect the presentation of contribution and performance of IPOs and other transactions amid heightened volatility.
Global Leaders may participate in IPOs in eligible accounts and purchase additional shares in the secondary market. All values are that of the Global Leaders Equity Composite. The investments results shown are gross of advisory fees and
reflect the reinvestment of dividends and any other earnings. The client's return will be reduced by these fees and expenses in addition to any other costs incurred in the management of the account. The attribution analysis approximates
the gross excess returns of the portfolio and is calculated by the FactSet attribution model based on a “buy-and-hold” approach. Returns will not match actual performance because FactSet uses different exchange rate sources, the
performance does not capture intra-day trading, and the analysis removes the impact of cash flows. Pricing obtained from IDC. To receive a complete list of and description of the calculation methodology for the attribution analysis and
complete list detailing each holding’s attribution please contact a member of the Client Relations Team at 703-562-4000. GIPS® Reports and additional disclosures for the related composites may be found at
http://sandscapital.com/media/Sands_Capital_Annual_Disclosure_Presentation.pdf or at the end of this presentation. Past performance is not indicative of future results. Source: SCM, MSCI.
SANDS CAPITAL MANAGEMENT, LLC · JUNE 2021 · P336                                                                                                                                                                                         11
Contribution Analysis: Year to Date
   Global Leaders vs. MSCI All Country World Index
   Period Ending June 30, 2021

BEST PERFORMERS (%)                                                                                                               TOP ABSOLUTE CONTRIBUTORS (%)

                                AVERAGE        TOTAL        ABSOLUTE         RELATIVE                                                                            AVERAGE TOTAL               ABSOLUTE RELATIVE
COMPANY                                                                                      GICS SECTOR                          COMPANY                                                                                  GICS SECTOR
                                 WEIGHT       RETURN        CONTRIB.         CONTRIB.                                                                             WEIGHT RETURN               CONTRIB. CONTRIB.

Sea                               3.8          38.0            1.4              1.4          Communication Services               Sea                               3.8          38.0           1.4            1.4         Communication Services

Naver                             2.9          37.7            0.9             0.8           Communication Services               IQVIA                             3.2          35.3           1.1            1.0         Health Care

IQVIA                             3.2          35.3            1.1             1.0           Health Care                          Intuit                            3.2          29.4           0.9            0.8         Information Technology

Intuit                            3.2          29.4            0.9             0.8           Information Technology               Naver                             2.9          37.7           0.9            0.8         Communication Services

Bio-Techne                        0.7          23.8            0.2             0.2           Health Care                          Texas Instruments                 3.5          18.6           0.7            0.6         Information Technology

WORST PERFORMERS (%)                                                                                                              TOP ABSOLUTE DETRACTORS (%)

                                AVERAGE        TOTAL        ABSOLUTE         RELATIVE                                                                            AVERAGE TOTAL               ABSOLUTE RELATIVE
COMPANY                                                                                      GICS SECTOR                          COMPANY                                                                                  GICS SECTOR
                                 WEIGHT       RETURN        CONTRIB.         CONTRIB.                                                                             WEIGHT RETURN               CONTRIB. CONTRIB.

Zur Rose                          1.7          -31.8          -0.8             -0.8          Consumer Staples                     Zur Rose                          1.7          -31.8          -0.8           -0.8        Consumer Staples

Bright Horizons                   2.0          -15.0          -0.3             -0.3          Consumer Discretionary               Keyence                           3.9          -9.9           -0.5           -0.5        Information Technology

Adobe                             0.9          -12.6          -0.3             -0.4          Information Technology               CoStar Group                      3.4          -10.4          -0.4           -0.3        Industrials

CoStar Group                      3.4          -10.4          -0.4             -0.3          Industrials                          Bright Horizons                  2.0           -15.0          -0.3           -0.3        Consumer Discretionary

Keyence                           3.9          -9.9           -0.5             -0.5          Information Technology               Adobe                            0.9           -12.6          -0.3           -0.4        Information Technology

   Contribution and performance are calculated using end of day prices, and do not reflect actual purchase prices. This can affect the presentation of contribution and performance of IPOs and other transactions amid heightened volatility.
   Global Leaders may participate in IPOs in eligible accounts and purchase additional shares in the secondary market. All values are that of the Global Leaders Equity Composite. The companies illustrated above represent a sub-set of
   current holdings in the Global Leaders Equity Composite and were selected based on the performance measures presented. Top and Bottom absolute contribution figures were calculated by multiplying the security's average weight by
   the security's return. The investments results shown are gross of advisory fees and reflect the reinvestment of dividends and any other earnings. The client's return will be reduced by these fees and expenses in addition to any other costs
   incurred in the management of the account. Pricing obtained from IDC. To receive a complete list of and description of the calculation methodology for the attribution analysis and complete list detailing each holding’s attribution please
   contact a member of the Client Relations Team at 703-562-4000. GIPS® Reports and additional disclosures for the related composites may be found at http://sandscapital.com/media/Sands_Capital_Annual_Disclosure_Presentation.pdf or
   at the end of this presentation. Past performance is not indicative of future results. Source: SCM, MSCI.

   SANDS CAPITAL MANAGEMENT, LLC · JUNE 2021 · P336                                                                                                                                                                                           12
Attribution Analysis: Year to Date
Global Leaders vs. MSCI All Country World Index
Period Ending June 30, 2021
 Total Effect               Selection Effect             Allocation Effect                   Currency Effect
                                  -3.5                         1.5
                                  -3.6                         1.0
                                   -3.7                       0.5
                                  -3.8                        0.0
                                  -3.9                       -0.5
      BY REGION (%)               -4.0                       -1.0
                                   -4.1                       -1.5
                                  -4.2                       -2.0
                                  -4.3                       -2.5
                                  -4.4                       -3.0

                                            Total                     Emerging Asia               Latin America              E. Europe              Mid-East & Africa           Developed Asia           W. Europe                US/Canada
Portfolio Weight (avg)                      100.0                          9.8                           –                         –                         –                       19.8                    11.2                    58.2
Index Weight (avg)                          100.0                            10.6                        1.1                     0.6                        1.1                       9.6                   16.8                    60.3

Portfolio Return                              8.0                            14.8                         –                        –                         –                        5.4                    -4.7                    10.1
Index Return                                  12.3                           6.0                        7.2                     14.5                      16.9                        3.9                    11.7                    15.0
Relative Return                               -4.3                           8.8                       -7.2                     -14.5                     -16.9                       1.5                  -16.4                     -4.9

                                  -4.2                         1.5
                                  -4.2
                                                               1.0
                                  -4.2
                                  -4.2                        0.5
                                  -4.2                        0.0
                                  -4.3
      BY SECTOR (%)               -4.3
                                                             -0.5
      (GICS Sectors)              -4.3                       -1.0
                                  -4.3                        -1.5
                                  -4.3
                                  -4.4                       -2.0
                                  -4.4                       -2.5

                                                                 Communication                                                                        Consumer                         Information    Consumer
                                            Total                                   Health Care       Utilities   Real Estate           Materials                       Energy                                       Financials       Industrials
                                                                   Services                                                                            Staples                         Technology    Discretionary
Portfolio Weight (avg)                      100.0                    11.0              13.5                –          1.9                    –            5.8              –               24.5           12.0           9.8                20.6
Index Weight (avg)                          100.0                     9.4               11.5             2.8          2.6                  5.0            7.0             3.3               21.4         12.8           14.2                 9.9

Portfolio Return                              8.0                    25.4              15.9                –         13.3                    –           -10.2             –                10.7          -1.8           3.4                 1.9
Index Return                                  12.3                    15.2              9.9              0.1         14.9                 12.7            4.8            28.9               12.5          8.4           18.3                12.5
Relative Return                               -4.3                    10.2              6.0             -0.1          -1.6                -12.7          -15.0          -28.9               -1.8        -10.2          -14.9            -10.6

Contribution and performance are calculated using end of day prices, and do not reflect actual purchase prices. This can affect the presentation of contribution and performance of IPOs and other transactions amid heightened volatility.
Global Leaders may participate in IPOs in eligible accounts and purchase additional shares in the secondary market. All values are that of the Global Leaders Equity Composite. The investments results shown are gross of advisory fees and
reflect the reinvestment of dividends and any other earnings. The client's return will be reduced by these fees and expenses in addition to any other costs incurred in the management of the account. The attribution analysis approximates
the gross excess returns of the portfolio and is calculated by the FactSet attribution model based on a “buy-and-hold” approach. Returns will not match actual performance because FactSet uses different exchange rate sources, the
performance does not capture intra-day trading, and the analysis removes the impact of cash flows. Pricing obtained from IDC. To receive a complete list of and description of the calculation methodology for the attribution analysis and
complete list detailing each holding’s attribution please contact a member of the Client Relations Team at 703-562-4000. GIPS® Reports and additional disclosures for the related composites may be found at
http://sandscapital.com/media/Sands_Capital_Annual_Disclosure_Presentation.pdf or at the end of this presentation. Past performance is not indicative of future results. Source: SCM, MSCI.
SANDS CAPITAL MANAGEMENT, LLC · JUNE 2021 · P336                                                                                                                                                                                         13
Contribution Analysis: Trailing 1 Year
   Global Leaders vs. MSCI All Country World Index
   Period Ending June 30, 2021

BEST PERFORMERS (%)                                                                                                               TOP ABSOLUTE CONTRIBUTORS (%)

                                AVERAGE        TOTAL        ABSOLUTE         RELATIVE                                                                            AVERAGE TOTAL               ABSOLUTE RELATIVE
COMPANY                                                                                      GICS SECTOR                          COMPANY                                                                                  GICS SECTOR
                                 WEIGHT       RETURN        CONTRIB.         CONTRIB.                                                                             WEIGHT RETURN               CONTRIB. CONTRIB.

Sea                               3.6          156.1           4.2             4.2           Communication Services               Sea                               3.6          156.1          4.2            4.2         Communication Services

Taiwan Semiconductor              3.6          114.5           2.9             2.3           Information Technology               Taiwan Semiconductor              3.6          114.5          2.9            2.3         Information Technology

Aptiv                             2.4          101.9           2.0             2.0           Consumer Discretionary               Aptiv                             2.4          101.9          2.0            2.0         Consumer Discretionary

IQVIA                             2.9          70.8            1.8              1.7          Health Care                          Texas Instruments                 3.5          55.4           1.9            1.7         Information Technology

Intuit                            3.2          66.6            1.8              1.7          Information Technology               Intuit                            3.2          66.6           1.8            1.7         Information Technology

WORST PERFORMERS (%)                                                                                                              TOP ABSOLUTE DETRACTORS (%)

                                AVERAGE        TOTAL        ABSOLUTE         RELATIVE                                                                            AVERAGE TOTAL               ABSOLUTE RELATIVE
COMPANY                                                                                      GICS SECTOR                          COMPANY                                                                                  GICS SECTOR
                                 WEIGHT       RETURN        CONTRIB.         CONTRIB.                                                                             WEIGHT RETURN               CONTRIB. CONTRIB.

Zur Rose                          0.8          -31.8          -0.8             -0.8          Consumer Staples                     Zur Rose                         0.8           -31.8          -0.8           -0.8        Consumer Staples

Temenos                           0.8          -15.3          -0.4             -0.4          Information Technology               Temenos                          0.8           -15.3          -0.4           -0.4        Information Technology

Coupa Software                    0.3          -7.0            0.0             0.0           Information Technology               Bright Horizons                   1.4          -5.7           -0.2           -0.2        Consumer Discretionary

Bright Horizons                   1.4          -5.7           -0.2             -0.2          Consumer Discretionary               Pan Pacific                       1.4          -4.7           -0.1           -0.1        Consumer Discretionary

Pan Pacific                       1.4          -4.7           -0.1             -0.1          Consumer Discretionary               Coupa Software                   0.3           -7.0           0.0            0.0         Information Technology

   Contribution and performance are calculated using end of day prices, and do not reflect actual purchase prices. This can affect the presentation of contribution and performance of IPOs and other transactions amid heightened volatility.
   Global Leaders may participate in IPOs in eligible accounts and purchase additional shares in the secondary market. All values are that of the Global Leaders Equity Composite. The companies illustrated above represent a sub-set of
   current holdings in the Global Leaders Equity Composite and were selected based on the performance measures presented. Top and Bottom absolute contribution figures were calculated by multiplying the security's average weight by
   the security's return. The investments results shown are gross of advisory fees and reflect the reinvestment of dividends and any other earnings. The client's return will be reduced by these fees and expenses in addition to any other costs
   incurred in the management of the account. Pricing obtained from IDC. To receive a complete list of and description of the calculation methodology for the attribution analysis and complete list detailing each holding’s attribution please
   contact a member of the Client Relations Team at 703-562-4000. GIPS® Reports and additional disclosures for the related composites may be found at http://sandscapital.com/media/Sands_Capital_Annual_Disclosure_Presentation.pdf or
   at the end of this presentation. Past performance is not indicative of future results. Source: SCM, MSCI.

   SANDS CAPITAL MANAGEMENT, LLC · JUNE 2021 · P336                                                                                                                                                                                           14
Attribution Analysis: Trailing 1 Year
Global Leaders vs. MSCI All Country World Index
Period Ending June 30, 2021
 Total Effect               Selection Effect             Allocation Effect                   Currency Effect
                                   0.0                        3.0
                                  -0.5                        2.0
                                   -1.0
                                                               1.0
                                   -1.5
                                                              0.0
                                  -2.0
      BY REGION (%)                -2.5
                                                              -1.0

                                  -3.0                        -2.0
                                   -3.5                       -3.0
                                  -4.0                       -4.0

                                            Total                     Emerging Asia               Developed Asia            E. Europe              Mid-East & Africa            Latin America           W. Europe               US/Canada
Portfolio Weight (avg)                      100.0                          9.3                         20.2                       –                         –                          –                   10.6                    58.6
Index Weight (avg)                          100.0                            10.4                       9.7                    0.6                         1.0                        1.1                  16.9                     60.4

Portfolio Return                             35.7                            70.7                      40.6                      –                          –                          –                   10.9                     34.9
Index Return                                 39.3                            41.0                      27.8                   32.9                       40.3                       46.0                   35.0                     42.0
Relative Return                               -3.6                           29.7                      12.8                  -32.9                      -40.3                      -46.0                   -24.1                     -7.1

                                   0.5                        4.0
                                   0.0                         3.0
                                  -0.5                         2.0
                                   -1.0
                                                               1.0
                                   -1.5
      BY SECTOR (%)               -2.0
                                                              0.0
      (GICS Sectors)               -2.5
                                                              -1.0
                                  -3.0                       -2.0
                                   -3.5                      -3.0
                                  -4.0                       -4.0

                                                                 Communication                                                                       Consumer                                        Information     Consumer
                                            Total                                   Health Care       Utilities    Energy            Real Estate                       Materials        Financials                                   Industrials
                                                                   Services                                                                           Staples                                        Technology     Discretionary
Portfolio Weight (avg)                      100.0                     11.1             14.7                –           –                  2.1            4.7                –               10.0         24.8            11.7               19.7
Index Weight (avg)                          100.0                     9.4               11.9             3.0          3.2                2.7             7.4              4.9                13.6       21.3            12.8                 9.8

Portfolio Return                             35.7                     84.1             35.6                –           –                16.0             -1.7               –               38.9        39.9            28.2                26.3
Index Return                                 39.3                    42.0              23.5             14.6        39.4                27.0            20.7             49.0               48.9        46.0            46.4                44.5
Relative Return                               -3.6                    42.1              12.1           -14.6        -39.4               -11.0          -22.4            -49.0               -10.0        -6.1           -18.2           -18.2

Contribution and performance are calculated using end of day prices, and do not reflect actual purchase prices. This can affect the presentation of contribution and performance of IPOs and other transactions amid heightened volatility.
Global Leaders may participate in IPOs in eligible accounts and purchase additional shares in the secondary market. All values are that of the Global Leaders Equity Composite. The investments results shown are gross of advisory fees and
reflect the reinvestment of dividends and any other earnings. The client's return will be reduced by these fees and expenses in addition to any other costs incurred in the management of the account. The attribution analysis approximates
the gross excess returns of the portfolio and is calculated by the FactSet attribution model based on a “buy-and-hold” approach. Returns will not match actual performance because FactSet uses different exchange rate sources, the
performance does not capture intra-day trading, and the analysis removes the impact of cash flows. Pricing obtained from IDC. To receive a complete list of and description of the calculation methodology for the attribution analysis and
complete list detailing each holding’s attribution please contact a member of the Client Relations Team at 703-562-4000. GIPS® Reports and additional disclosures for the related composites may be found at
http://sandscapital.com/media/Sands_Capital_Annual_Disclosure_Presentation.pdf or at the end of this presentation. Past performance is not indicative of future results. Source: SCM, MSCI.
SANDS CAPITAL MANAGEMENT, LLC · JUNE 2021 · P336                                                                                                                                                                                         15
Contribution & Attribution Analysis: Trailing 3 Year
Global Leaders vs. MSCI All Country World Index
Period Ending June 30, 2021

 TOP ABSOLUTE CONTRIBUTORS (%)                                                                                                     REGION ATTRIBUTION
                                                                                                                                                                                              ACTIVE           RELATIVE            TOTAL
                                 AVERAGE TOTAL ABSOLUTE RELATIVE                                                                   REGION                                                     WEIGHT            RETURN             EFFECT
 COMPANY                                                                                    GICS SECTOR
                                  WEIGHT RETURN CONTRIB. CONTRIB.                                                                  US/Canada                                                      -0.3              21.0              14.1
                                                                                                                                   Developed Asia                                                  6.3             98.0               13.0
 Sea                                1.6         636.2           8.2            8.2          Communication Services
                                                                                                                                   Emerging Asia                                                  -0.3              37.9               2.5
 Taiwan Semiconductor              2.9          250.2           4.7            3.8          Information Technology                 W. Europe                                                      -4.9              -8.0              0.7
                                                                                                                                   Mid-East & Africa                                              -1.0             -10.2              0.4
 Zoetis                             3.3          122.7          3.8            3.7          Health Care
                                                                                                                                   Latin America                                                  -0.8             -22.2              0.3
 Intuit                            3.0          145.4           3.8            3.7          Information Technology                 E. Europe                                                      -0.7             -27.4               0.1

 TransDigm                          3.5         109.9           3.8            3.8          Industrials

                                                                                                                                   SECTOR ATTRIBUTION
 TOP ABSOLUTE DETRACTORS (%)                                                                                                                                                                  ACTIVE           RELATIVE            TOTAL
                                                                                                                                   SECTOR                                                     WEIGHT            RETURN             EFFECT
                                                                                                                                   Communication Services                                         -1.8             86.8                5.6
                                 AVERAGE TOTAL ABSOLUTE RELATIVE                                                                   Industrials                                                     8.6              28.7               5.2
 COMPANY                                                                                    GICS SECTOR
                                  WEIGHT RETURN CONTRIB. CONTRIB.                                                                  Financials                                                     -4.8             28.0                4.8
                                                                                                                                   Energy                                                         -4.8              15.1               4.3
 Fresenius Medical Care            0.3           -35.5          -1.4           -1.4         Health Care
                                                                                                                                   Information Technology                                          8.2             -14.1               3.3
 Sands China                       0.3           -20.7          -0.8           -0.8         Consumer Discretionary                 Consumer Staples                                               -3.2               1.6               2.2
                                                                                                                                   Real Estate                                                    -0.8              95.3               2.2
 Zur Rose                          0.3           -31.8          -0.8           -0.8         Consumer Staples
                                                                                                                                   Health Care                                                     1.0              13.4               1.7
 Bank Central Asia                 0.6           -5.1           -0.5           -0.5         Financials                             Utilities                                                      -3.2             -26.7               0.6
                                                                                                                                   Consumer Discretionary                                          3.9             -11.8               0.6
 EssilorLuxottica                   1.2          -18.2          -0.5           -0.5         Consumer Discretionary
                                                                                                                                   Materials                                                      -4.8             -42.0               0.5

Contribution and performance are calculated using end of day prices, and do not reflect actual purchase prices. This can affect the presentation of contribution and performance of IPOs and other transactions amid heightened volatility.
Global Leaders may participate in IPOs in eligible accounts and purchase additional shares in the secondary market. All values are that of the Global Leaders Equity Composite and were selected based on the performance measures
presented. The investments results shown are gross of advisory fees and reflect the reinvestment of dividends and any other earnings. The client's return will be reduced by these fees and expenses in addition to any other costs incurred
in the management of the account. Top and Bottom absolute contribution figures were calculated by multiplying the security's average weight by the security's return. The attribution analysis approximates the gross excess returns of the
portfolio and is calculated by the FactSet attribution model based on a “buy-and-hold” approach. Returns will not match actual performance because FactSet uses different exchange rate sources, the performance does not capture intra-
day trading, and the analysis removes the impact of cash flows. Pricing obtained from IDC. To receive a complete list of and description of the calculation methodology for the attribution analysis and complete list detailing each holding’s
attribution please contact a member of the Client Relations Team at 703-562-4000. GIPS® Reports and additional disclosures for the related composites may be found at
http://sandscapital.com/media/Sands_Capital_Annual_Disclosure_Presentation.pdf or at the end of this presentation. Past performance is not indicative of future results. Source: SCM, MSCI.

SANDS CAPITAL MANAGEMENT, LLC · JUNE 2021 · P336                                                                                                                                                                                             16
Contribution & Attribution Analysis: Since Inception
Global Leaders vs. MSCI All Country World Index
Period Ending June 30, 2021

 TOP ABSOLUTE CONTRIBUTORS (%)                                                                                                     REGION ATTRIBUTION
                                                                                                                                                                                              ACTIVE           RELATIVE            TOTAL
                                 AVERAGE TOTAL ABSOLUTE RELATIVE                                                                   REGION                                                     WEIGHT            RETURN             EFFECT
 COMPANY                                                                                    GICS SECTOR
                                  WEIGHT RETURN CONTRIB. CONTRIB.                                                                  US/Canada                                                      0.4              46.0               26.1
                                                                                                                                   Developed Asia                                                  3.6             171.4              17.8
 TransDigm                         3.8          256.8           8.5            8.5          Industrials
                                                                                                                                   Emerging Asia                                                   1.1              99.1              10.7
 Sea                                1.1         636.2           8.2            8.2          Communication Services                 W. Europe                                                      -4.7             22.9               8.9
                                                                                                                                   Latin America                                                  -0.3             -19.1               1.2
 Visa                              4.6          170.4           8.0            7.2          Information Technology
                                                                                                                                   Mid-East & Africa                                              -1.0             -18.3               1.1
 Zoetis                             3.3         258.5           7.2            7.0          Health Care                            E. Europe                                                      -0.7             -38.8              0.7

 Adobe                              3.1         235.8           7.1            6.5          Information Technology

                                                                                                                                   SECTOR ATTRIBUTION
 TOP ABSOLUTE DETRACTORS (%)                                                                                                                                                                  ACTIVE           RELATIVE            TOTAL
                                                                                                                                   SECTOR                                                     WEIGHT            RETURN             EFFECT
                                                                                                                                   Industrials                                                     7.1             101.0              14.9
                                 AVERAGE TOTAL ABSOLUTE RELATIVE                                                                   Information Technology                                          7.6              28.9              12.5
 COMPANY                                                                                    GICS SECTOR
                                  WEIGHT RETURN CONTRIB. CONTRIB.                                                                  Communication Services                                         -1.8             199.4              10.6
                                                                                                                                   Financials                                                     -6.2              75.6              10.5
 Allergan                          0.7           -35.5          -2.1           -2.0         Health Care
                                                                                                                                   Energy                                                         -5.2                –                4.6
 Celgene                           0.3           -38.7          -1.8           -1.7         Health Care                            Consumer Discretionary                                          7.8             -15.2               3.9
                                                                                                                                   Real Estate                                                    -0.5             131.8               3.5
 O'Reilly Automotive               0.2           -22.3          -0.9           -0.9         Consumer Discretionary
                                                                                                                                   Consumer Staples                                               -2.9              -5.3               3.0
 Zur Rose                          0.2           -31.8          -0.8           -0.8         Consumer Staples                       Utilities                                                      -3.2             -35.4               1.4
                                                                                                                                   Health Care                                                     0.7               7.3               1.0
 Bank Central Asia                 0.4           -5.1           -0.5           -0.5         Financials
                                                                                                                                   Materials                                                      -5.0             -65.3               0.7

Contribution and performance are calculated using end of day prices, and do not reflect actual purchase prices. This can affect the presentation of contribution and performance of IPOs and other transactions amid heightened volatility.
Global Leaders may participate in IPOs in eligible accounts and purchase additional shares in the secondary market. All values are that of the Global Leaders Equity Composite and were selected based on the performance measures
presented. The investments results shown are gross of advisory fees and reflect the reinvestment of dividends and any other earnings. The client's return will be reduced by these fees and expenses in addition to any other costs incurred
in the management of the account. Top and Bottom absolute contribution figures were calculated by multiplying the security's average weight by the security's return. The attribution analysis approximates the gross excess returns of the
portfolio and is calculated by the FactSet attribution model based on a “buy-and-hold” approach. Returns will not match actual performance because FactSet uses different exchange rate sources, the performance does not capture intra-
day trading, and the analysis removes the impact of cash flows. Pricing obtained from IDC. To receive a complete list of and description of the calculation methodology for the attribution analysis and complete list detailing each holding’s
attribution please contact a member of the Client Relations Team at 703-562-4000. GIPS® Reports and additional disclosures for the related composites may be found at
http://sandscapital.com/media/Sands_Capital_Annual_Disclosure_Presentation.pdf or at the end of this presentation. Past performance is not indicative of future results. Source: SCM, MSCI.

SANDS CAPITAL MANAGEMENT, LLC · JUNE 2021 · P336                                                                                                                                                                                             17
Trailing Attribution Effects
Global Leaders vs. MSCI All Country World Index
Period Ending June 30, 2021
 Total Effect               Selection Effect             Allocation Effect                 Currency Effect
                            70.0
                           60.0
                           50.0
                           40.0
 BY REGION (%)              30.0
                            20.0
                            10.0
                             0.0
                           -10.0
                                                 QTD                                YTD                                1 Yr.                            3 Yrs.                               ITD

Portfolio Return                                   9.4                                8.0                               35.7                               80.0                              138.9
Index Return                                       7.4                                12.3                              39.3                               50.4                               73.6
Relative Return                                    2.0                                -4.3                              -3.6                               29.6                               65.3
                            70.0
                           60.0
                           50.0
 BY SECTOR                 40.0
     (%)                    30.0
(GICS Sectors)
                            20.0
                            10.0
                             0.0
                           -10.0
                                                 QTD                                YTD                                1 Yr.                            3 Yrs.                               ITD

Contribution and performance are calculated using end of day prices, and do not reflect actual purchase prices. This can affect the presentation of contribution and performance of IPOs and other transactions amid heightened volatility.
Global Leaders may participate in IPOs in eligible accounts and purchase additional shares in the secondary market. All values are that of the Global Leaders Equity Composite. The investments results shown are gross of advisory fees and
reflect the reinvestment of dividends and any other earnings. The client's return will be reduced by these fees and expenses in addition to any other costs incurred in the management of the account. The attribution analysis approximates
the gross excess returns of the portfolio and is calculated by the FactSet attribution model based on a “buy-and-hold” approach. Returns will not match actual performance because FactSet uses different exchange rate sources, the
performance does not capture intra-day trading, and the analysis removes the impact of cash flows. Pricing obtained from IDC. To receive a complete list of and description of the calculation methodology for the attribution analysis and
complete list detailing each holding’s attribution please contact a member of the Client Relations Team at 703-562-4000. GIPS® Reports and additional disclosures for the related composites may be found at
http://sandscapital.com/media/Sands_Capital_Annual_Disclosure_Presentation.pdf or at the end of this presentation. Past performance is not indicative of future results. Source: SCM, MSCI.
SANDS CAPITAL MANAGEMENT, LLC · JUNE 2021 · P336                                                                                                                                                                                         18
Significant Transactions
Global Leaders
Period Started January 1, 2021 and Ended June 30, 2021

             PURCHASES                                                         SCM SECTOR                                      SALES                                                            SCM SECTOR

1Q21         Bio-Techne                                                       Life Sciences                                    Adobe                                                            Technology
             Cloudflare                                                       Technology                                       Boston Scientific                                                Life Sciences
             Coupa Software                                                   Technology
             Zur Rose                                                         Life Sciences

2Q21         Allfunds                                                         Financial Services                               Rightmove                                                        Financial Services

The securities identified represent new securities purchased and sold within the current and prior quarter but do not include weight changes. The list above does not include in progress purchase investment actions. Upon request, a
complete list of securities purchased and sold in the Global Leaders Equity Composite will be provided. It should not be assumed that these holdings were or will be profitable. GIPS® Reports and additional disclosures for the related
composites may be found at http://sandscapital.com/media/Sands_Capital_Annual_Disclosure_Presentation.pdf or at the end of this presentation.

SANDS CAPITAL MANAGEMENT, LLC · JUNE 2021 · P336                                                                                                                                                                                            19
Portfolio Holdings by Sector
Global Leaders vs. MSCI All Country World Index
Period Ending June 30, 2021
SECTOR/COMPANY                           BUSINESS SPACE                                                         DOMICILE                 PORTFOLIO (%)              BENCHMARK (%)                           OWNED SINCE

Communication Services                                                                                                                          10.2                        9.4
Charter Communications                   Internet Service Provider                                                   U.S.                         3.9                        0.1                                 2020
Naver                                    Internet Search and Media                                                  Korea                         3.1                        0.1                                 2020
Sea1                                     Internet Software and Services                                           Singapore                       3.3                        0.0                                 2019
Consumer Discretionary                                                                                                                          10.8                       12.7
Aptiv                                    Automotive Technology                                                       U.S.                         2.5                        0.1                                 2018
Bright Horizons                          Education Services                                                          U.S.                         1.8                          –                                 2020
Chegg                                    Education Services                                                          U.S.                         3.7                          –                                 2020
Dollar General                           Multiline Retail                                                            U.S.                         1.8                        0.1                                 2017
Pan Pacific                              Food and Specialty Retail                                                  Japan                          1.1                       0.0                                 2017
Consumer Staples                                                                                                                                6.6                         6.9
Alimentation Couche-Tard                 Convenience Stores                                                        Canada                        4.2                         0.0                                  2017
Zur Rose                                 Pharmacy Retail                                                         Switzerland                     2.4                           –                                  2021
Energy                                                                                                                                                                      3.4
Financials                                                                                                                                     10.4                        14.1
AIA                                      Insurance                                                               Hong Kong                       3.4                         0.2                                  2018
Allfunds                                 Diversified Financial Services                                          Netherlands                     2.0                           –                                  2021
HDFC Bank1                               Commercial Banks                                                           India                        2.6                           –                                  2017
Intercontinental Exchange                Futures/OTC Exchange and Interdealer Broker                                 U.S.                        2.4                         0.1                                  2017
Health Care                                                                                                                                     13.9                       11.6
Bio-Techne                               Medical Consumables and Instruments                                         U.S.                         1.1                        0.0                                  2021
CSL                                      Biotech Therapeutic Drugs                                                Australia                      2.2                         0.1                                  2018
IQVIA                                    Contract Research Organization                                              U.S.                        3.3                         0.1                                  2019
Lonza                                    Pharmaceuticals and Biotech Therapeutic Drugs                           Switzerland                     2.5                         0.1                                  2019
UnitedHealth                             Health Insurance and Healthcare Services                                    U.S.                        2.3                         0.6                                  2018
Zoetis                                   Animal Health Pharmaceuticals                                               U.S.                        2.4                         0.1                                  2017
Industrials                                                                                                                                    19.9                         9.9
CoStar Group                             Real Estate Information Services                                             U.S.                        3.1                        0.0                                 2020
MonotaRO                                 Industrial Supplies Distribution                                           Japan                        2.0                         0.0                                 2019
Recruit                                  Integrated Human Resources Services                                        Japan                        2.4                         0.1                                 2017
Rentokil Initial                         Industrial Supplies Distribution                                       United Kingdom                   2.5                         0.0                                 2019
Roper Technologies                       Industrial Conglomerate                                                      U.S.                       4.6                         0.1                                 2019
Safran                                   Aerospace Engines and Aftermarket Parts                                    France                       2.7                         0.1                                 2017
TransDigm                                Aerospace Component Designer and Manufacturer                                U.S.                       2.5                         0.1                                 2017
Information Technology                                                                                                                         25.4                        21.9
Cloudflare                               Software-as-a-Service - IT Service Management                               U.S.                         2.8                        0.0                                  2021
Coupa Software                           Software-as-a-Service—Accounting and Financials                             U.S.                         1.5                        0.0                                  2021
Intuit                                   Accounting and Tax Software                                                 U.S.                         3.5                        0.2                                  2017
Keyence                                  Industrial Sensors and Controls                                           Japan                          3.7                        0.1                                  2017
Microsoft                                Software                                                                    U.S.                         3.3                        2.9                                  2019
Taiwan Semiconductor 1                   Semiconductors and Semiconductor Equipment                                Taiwan                         3.7                        0.8                                  2017
Texas Instruments                        Semiconductors and Semiconductor Equipment                                  U.S.                         3.2                        0.3                                  2019
Visa                                     Payment Processing                                                          U.S.                         3.7                        0.6                                  2017
Materials                                                                                                                                                                   4.9
Real Estate                                                                                                                                      2.0                        2.6
Equinix                                  Real Estate Management and Development                                      U.S.                        2.0                         0.1                                  2018
Utilities                                                                                                                                                                   2.6
[Cash]                                                                                                                                          0.9

1
 ADRs. Data presented is that of the Global Leaders Equity Composite. The index represented will differ in characteristics, holdings, and sector weightings from that of the composite. Rounding may cause figures to vary from 100.0%.
GIPS® Reports and additional disclosures for the related composites may be found at http://sandscapital.com/media/Sands_Capital_Annual_Disclosure_Presentation.pdf or at the end of this presentation. Source: Factset, SCM, MSCI.

SANDS CAPITAL MANAGEMENT, LLC · JUNE 2021 · P336                                                                                                                                                                                          20
Our Portfolio
Our approach to investment research, portfolio construction, and risk management results in
a portfolio of high-quality, leading growth businesses located around the world.

                              CANADA
                                                                                    NETHERLANDS                                            SOUTH KOREA

                                                                         U.K.

                                                                           FRANCE                                                               JAPAN

                                                                          SWITZERLAND

                                                                                                                                           TAIWAN

                       U.S.

                                                                                                           INDIA                              HONG KONG

                                                                                                                   SINGAPORE

                                                                                                                               AUSTRALIA

Data shown is as of June 30, 2021. The above information is that of the Global Leaders Equity Composite.

SANDS CAPITAL MANAGEMENT, LLC · JUNE 2021 · P336                                                                                                          21
Business Results of Portfolio Companies
Period Ended June 30, 2021

                                                                 SCM Estimate         Latest Quarter Y/Y       Latest Fiscal Year Y/Y         Cash Generation and Profitability                          Capital Return

                                                                                                                                                                3 Year Average

                                                                SCM LONG-TERM                                   REVENUE         EPS           FCF                                          CAPITAL             SHARES         DIVIDEND PER
                                                  SECTOR         EPS GROWTH      REVENUE      EPS               GROWTH        GROWTH       CONVERSION      FCF MARGIN                    RETURN RATIO       OUTSTANDING           SHARE
                                                WEIGHTS (%)1     ESTIMATE (%) 2 GROWTH (%) GROWTH (%)             (%)           (%)           (%)              (%)          ROIC (%)         (%)            3 YR CAGR (%)     3 YR CAGR (%)

    Communication Services                           10                71              -2            121           12           91             119            -0.9            7               65                6.3               3.0

    Consumer Discretionary                           11                20              19            16            19            3            -216            9.4             7               45                2.3              -4.5

    Consumer Staples                                  7                15              19             1           -12           13             109            0.9             4               19                6.1              12.5

    Financials                                       10                19              17            20            31            5             126            24.0            4              60                 0.0               4.8

    Health Care                                      14                15              14            30            4             6             162            12.3            11              74                -0.7             10.4

    Industrials                                      20                23               2            -12           1            -13            138            18.2            11              38                1.2               1.2

    Information Technology                           26                21              25            23            16           20             94             26.4           17              60                 -0.2             12.6

    Real Estate                                       2                12              10            26            8            -30            n/a            n/a            n/a             n/a                4.5              10.0

    Total Portfolio                                 100                25              14            18            10            11            82             15.4            11              53                1.5               6.0

1
 Includes Cash. 2 Long-Term EPS Growth Forecasts are SCM estimates at the given slide content as of date. These figures are subject to change during a reporting period. Based on the Global Leaders Equity Composite. Forward earnings
projections are not predictors of stock price or investment performance and do not represent past performance. There is no guarantee that the forward earnings projections will accurately predict the actual earnings experience of any of
the companies involved, and no guarantee that owning securities of companies with relatively high price to earnings ratios will cause the portfolio to outperform its benchmark or index. Free Cash Flow (FCF) represents the cash that a
company is able to generate after spending the money required to maintain or expand its asset base. FCF is not applicable to companies in following industries and is represented by n/a: Banks, Insurance, and REITs. FCF Conversion
represents how efficiently a company is able to convert earnings to cash and return cash to shareholders. It is calculated as FCF divided by net income. FCF Margin is calculated as FCF divided by sales. ROIC is defined as the Return on
Average Invested Capital and is calculated as net income divided by the two fiscal period average of total invested capital. Capital Return Ratio is calculated as the dividends plus share repurchases, divided by FCF. Shares Outstanding
refer to all authorized & issued shares that are currently held by a company’s shareholders. The CAGR measures the change in shares outstanding over time. Dividend Per Share is total dividends declared divided by ordinary shares
outstanding. Outliers that fall outside five standard deviations from the mean for Consensus Long Term EPS Growth and three standard deviations from the mean for remaining figures are excluded. Outlier logic is not applied to the Sands
Capital's Long-Term EPS Growth Forecasts. Rounding may cause figures to vary from 100.0%. GIPS® Reports and additional disclosures for the related composites may be found at
http://sandscapital.com/media/Sands_Capital_Annual_Disclosure_Presentation.pdf or at the end of this presentation. Source: Factset, SCM calculations.

SANDS CAPITAL MANAGEMENT, LLC · JUNE 2021 · P336                                                                                                                                                                                        22
Business Results of Portfolio Companies
Period Ended June 30, 2021
                                                                 SCM Estimate         Latest Quarter Y/Y        Latest Fiscal Year Y/Y         Cash Generation and Profitability                          Capital Return
                                                                                                                                                                3 Year Average
                                                                  LONG-TERM                                      REVENUE         EPS           FCF                                         CAPITAL             SHARES         DIVIDEND PER
                                                   REPORT         EPS GROWTH        REVENUE      EPS             GROWTH        GROWTH       CONVERSION      FCF MARGIN                   RETURN RATIO       OUTSTANDING          SHARE
  GICS SECTORS                                      DATE         FORECAST (%)1     GROWTH (%) GROWTH (%)           (%)           (%)           (%)              (%)         ROIC (%)         (%)            3 YR CAGR (%)     3YR CAGR (%)
Communication Services
  Charter Communications                           4/30/2021           18               7            121             5          107             237             10.3            2             157                -11.0             0.0
  Naver                                            5/14/2021           19              -13           n.m.          -20           72             76              14.0           14              18                 0.2              10.0
  Sea                                              5/18/2021           181             n.m.          n.m.           50          n.m.            23             -28.0          n.m.             0                 32.4              0.0
Consumer Discretionary
  Aptiv                                            5/06/2021           31               25            56            -9           -60            68             5.8            15               61                0.3              -42.6
  Bright Horizons                                  5/06/2021           15               -23          -69           -27           -58            235            9.8            6                35                  0               0.0
  Chegg                                            5/04/2021           21                51           27           57             47           -862            15.3           -1               19                 7.8              0.0
  Dollar General                                   5/27/2021           14                -1           10           22             58            94             6.4            15               99                -2.9              11.5
  Pan Pacific                                      5/12/2021           12                2            34            27            4              57             1.9            7               29                 0.1              32.5
Consumer Staples
  Alimentation Couche-Tard                         6/30/2021           15               15             1           -23           13             103            4.6            13               31                -0.8              19.5
  Zur Rose                                         4/20/2021           n/a              25           n.m.           9           n.m.            119            -5.6           -11              -3                18.1              0.0
Financials
   AIA                                             5/14/2021           26              n.m.          30             53          -13             n/a            n/a            n/a             n/a                0.1               10.8
   Allfunds                                        6/02/2021           20              n.m.          n.m.          n.m.         n.m.            n.m.           6.7             0              42                   0               0.0
   HDFC Bank                                       4/19/2021           18               19            21            16           19             n/a            n/a            n/a             n/a                 1.8              -7.8
   Intercontinental Exchange                       4/29/2021           10               15            5             16           16             126            38.7            8              76                 -2.2              14.5
Health Care
  Bio-Techne                                       5/06/2021           19               25            29            3             1            116             22.0           10               46                 1.7              0.0
  CSL                                              6/02/2021           11                2            26            0             6             51             11.5           21               85                -0.1              14.3
  IQVIA                                            4/22/2021           16               24            45            2            0             408             9.0             1               94                -4.3              0.0
  Lonza                                            4/22/2021           17                6            0             4            10             51              7.0            7               86                 3.0              4.6
  UnitedHealth                                     4/15/2021           13                9            43            6            12            121             6.9            15               52                -0.8              18.9
  Zoetis                                           5/06/2021           14               22            33            7             6             98             23.8           18               56                -1.0              24.5
Industrials
   CoStar Group                                    4/28/2021           35               17            13            19            -3            158            28.4            8                7                 4.5              0.0
   MonotaRO                                        5/03/2021           22               25            34           20             25             78             6.7           31               41                  0               19.8
   Recruit                                         5/18/2021           25                4           -61            -5           -26            166            11.3           14              36                 -0.5              -3.1
   Rentokil Initial                                4/22/2021           22               10            17            4              7             41            12.6            5               16                0.2               11.6
   Roper Technologies                              4/27/2021           13               13            18             3            -2            128            26.6            9               13                 0.7              12.8
   Safran                                          4/30/2021           34              -38           -74           -33           -69            223             9.5            9              55                  1.8             -35.2
   TransDigm                                       5/11/2021           14              -17           -49            -2           -21            156            21.4            6              125                 1.1              0.0
Information Technology
   Cloudflare                                      5/07/2021           n/a              51           n.m.          50           n.m.            80             -30.2          -27              0                  0.1              0.0
   Coupa Software                                  6/08/2021           57               40           -65           39            48             -51             12.7          -14              0                 9.0               0.0
   Intuit                                          5/26/2021           20               39            35           13            16             139             31.8          42              40                 0.4               16.0
   Keyence                                         4/29/2021           25               15            29           -2            0               94            34.9            13             16                  0                n.m.
   Microsoft                                       4/28/2021           19               19            39           14            21             131            30.5            19             82                 -0.6               9.4
   Taiwan Semiconductor                            4/15/2021           14               23            26           35            61              64             22.4           23             93                  0                10.6
   Texas Instruments                               4/28/2021           14               29            51            1            14             108             38.9          38              113                -2.7              20.6
   Visa                                            4/28/2021           16               -2            -1           -5            -7             106             51.7           21             91                 -2.5              22.1
Real Estate
  Equinix                                          4/29/2021            12              10            26            8            -30            n/a            n/a            n/a             n/a                4.5               10.0

Results shown are based on the Global Leaders Equity Composite. 1 Long-Term EPS Growth Forecasts are SCM estimates at the given slide content as of date. These figures are subject to change during a reporting period. Forward
earnings projections are not predictors of stock price or investment performance and do not represent past performance. There is no guarantee that the forward earnings projections will accurately predict the actual earnings experience
of any of the companies involved, and no guarantee that owning securities of companies with relatively high price to earnings ratios will cause the portfolio to outperform its benchmark or index. Free Cash Flow (FCF) represents the cash
that a company is able to generate after spending the money required to maintain or expand its asset base. FCF is not applicable to companies in following industries and is represented by n/a: Banks, Insurance, and REITs. FCF Conversion
represents how efficiently a company is able to convert earnings to cash and return cash to shareholders. It is calculated as FCF divided by net income. FCF Margin is calculated as FCF divided by sales. ROIC is defined as the Return on
Average Invested Capital and is calculated as net income divided by the two fiscal period average of total invested capital. Capital Return Ratio is calculated as the dividends plus share repurchases, divided by FCF. Shares Outstanding
refer to all authorized & issued shares that are currently held by a company’s shareholders. The CAGR measures the change in shares outstanding over time. Dividend Per Share is total dividends declared divided by ordinary shares
outstanding. Outliers that fall outside five standard deviations from the mean for Consensus Long Term EPS Growth and three standard deviations from the mean for remaining figures are excluded. Outlier logic is not applied to the Sands
Capital's Long-Term EPS Growth Forecasts. GIPS® Reports and additional disclosures for the related composites may be found at http://sandscapital.com/media/Sands_Capital_Annual_Disclosure_Presentation.pdf or at the end of this
presentation. Source: Factset, SCM calculations.

SANDS CAPITAL MANAGEMENT, LLC · JUNE 2021 · P336                                                                                                                                                                                          23
Appendix
                                                                                                       1000 Wilson Boulevard
                                                                                                       Suite 3000
                                                                                                       Arlington, VA 22209, USA
                                                                                                       703.562.4000
                                                                                                       sandscapital.com

                                                                                                       The views expressed are the opinion of Sands Capital Management and are not
                                                                                                       intended as a forecast, a guarantee of future results, investment
                                                                                                       recommendations, or an offer to buy or sell any securities. The views expressed
                                                                                                       were current as of the date indicated and are subject to change. Past
                                                                                                       performance is not indicative of future results. Differences in account size, timing
                                                                                                       of transactions and market conditions prevailing at the time of investment may
                                                                                                       lead to different results, and clients may lose money. A company’s fundamentals
                                                                                                       or earnings growth is no guarantee that its share price will increase. Forward
                                                                                                       earnings projections are not predictors of stock price or investment performance,
                                                                                                       and do not represent past performance. Characteristics, sector exposure and
                                                                                                       holdings information are subject to change, and should not be considered as
                                                                                                       recommendations. The specific securities identified and described do not
                                                                                                       represent all of the securities purchased, sold, or recommended for advisory
                                                                                                       clients. There is no assurance that any securities discussed will remain in the
                                                                                                       portfolio or that securities sold have not been repurchased. You should not
                                                                                                       assume that any investment is or will be profitable.

                                                                                                       The Global Industry Classification Standard ("GICS") was developed by and is the
                                                                                                       exclusive property and a service mark of MSCI Inc. ("MSCI") and Standard &
                                                                                                       Poor's, a division of The McGraw-Hill Companies, Inc. ("S&P") and is licensed for
                                                                                                       use by Sands Capital Management, LLC. Neither MSCI, S&P nor any third party
                                                                                                       involved in making or compiling the GICS or any GICS classifications makes any
                                                                                                       express or implied warranties or representations with respect to such standard or
                                                                                                       classification (or the results to be obtained by the use thereof), and all such
                                                                                                       parties hereby expressly disclaim express or implied warranties or representations
                                                                                                       with respect to any such standard or classification. Without limiting any of the
                                                                                                       foregoing, in no event shall MSCI, S&P, any of their affiliates or any third party
                                                                                                       involved in making or compiling the GICS or any GICS classifications have any
                                                                                                       liability for any direct, indirect, special, punitive, consequential or any other
                                                                                                       damages (including lost profits) even if notified of the possibility of such
                                                                                                       damages.
                                                                                                       All company logos and website images are used for illustrative purposes only and
                                                                                                       were obtained directly from the company websites. Company logos and website
                                                                                                       images are trademarks or registered trademarks of their respective owners and
                                                                                                       use of a logo does not imply any connection between Sands Capital and the
                                                                                                       company. GIPS®-compliant presentations and additional disclosures for the
   On the Cover                                                                                        related composites may be found at
   Chiyoda, Japan is home to Global Leaders portfolio business Recruit. Recruit is a human resources   http://sandscapital.com/media/Sands_Capital_Annual_Disclosure_Presentation.pdf
   company that owns the job search engine Indeed.                                                     or at the end of this presentation.

SANDS CAPITAL MANAGEMENT, LLC · JUNE 2021 · D137                                                                                                                                         24
Sands Capital exists to add value and
                          enhance the wealth of our clients
                              with prudence over time.

SANDS CAPITAL MANAGEMENT, LLC · JUNE 2021 · D137                 25
Investment Philosophy

We believe that, over time, common stock prices will reflect the earnings power and growth of the
underlying businesses. To be successful we must:

                 • Identify the few truly exceptional businesses with sustainable above-average growth
                 • Construct a concentrated conviction-weighted portfolio
                 • Accept short-term market volatility in exchange for long-term wealth creation

                                        “As long-term investors, we buy leading growth
                                        businesses… we do not trade stocks.”
                                                                       Frank M. Sands, Sr., Founder

SANDS CAPITAL MANAGEMENT, LLC · JUNE 2021 · D137                                                         26
You can also read