Auckland Visitor Plan 2021 - May 2014 - Aucklandnz.com
←
→
Page content transcription
If your browser does not render page correctly, please read the page content below

Auckland
Visitor Plan
2021
May 2014
CONTENTS
Executive summary ..................................................................................................................................................1
Introduction .............................................................................................................................................................6
    The opportunity ...................................................................................................................................................7
    ATEED’s role.........................................................................................................................................................8
    Strategic alignment ............................................................................................................................................10
    Rationale for public sector involvement ...........................................................................................................11
Auckland in 2012 ....................................................................................................................................................12
Global trends..........................................................................................................................................................15
    International tourism ........................................................................................................................................15
    Domestic tourism ..............................................................................................................................................19
    Aviation ..............................................................................................................................................................21
    Priority markets .................................................................................................................................................25
The aspiration ........................................................................................................................................................26
    The place aspiration – Auckland in 2021 ...........................................................................................................28
    Economic aspiration ..........................................................................................................................................29
ATEED action plan ..................................................................................................................................................34
    Strategic Framework .........................................................................................................................................34
    Cross-cutting themes .........................................................................................................................................35
    Strategic goals ...................................................................................................................................................35
    ATEED actions ....................................................................................................................................................36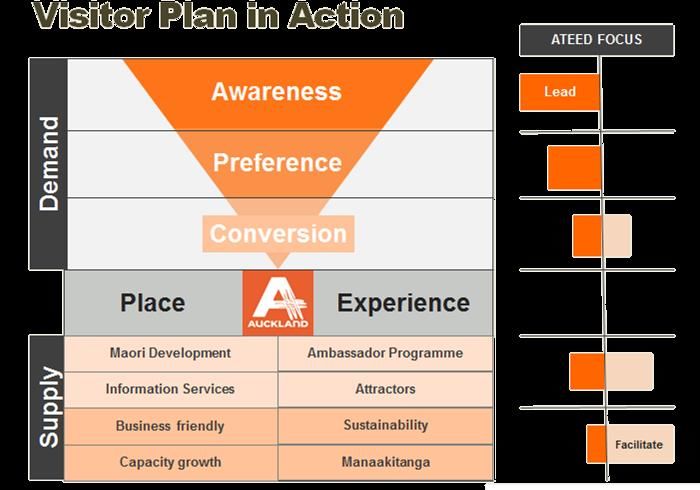
EXECUTIVE SUMMARY
Tourism has the power to transform Auckland. The direct benefits of tourism include growth in the visitor economy
(visitor expenditure), more jobs (including excellent career opportunities for youth and less skilled workers) and higher
productivity for local businesses. These benefits are compelling in their own right and are usually promoted as the main
reasons for growing tourism, because they are regularly measured and easy to understand. However, with the right
strategic approach tourism has the potential to generate a much broader range of benefits that can underwrite Auckland’s
economic and social transformation, ultimately providing its residents with greater social amenity and higher living
standards.

FIGURE 1: SCOPE OF BENEFITS DELIVERED BY THE VISITOR ECONOMY

This Visitor Plan is a direct response to the opportunity Auckland has to transform itself through tourism. It presents a
clear aspiration for the contribution of tourism to Auckland, supported by an investment road map and a tangible set of
actions to align thinking, identify opportunities, and direct public and private sector investment in tourism-related
initiatives.

ATEED’s role
Tourism cuts across a number of sectors that are strategically important to Auckland. As the owner of this Visitor Plan,
Auckland Tourism, Events and Economic Development (ATEED) will maximise these linkages by taking a whole-of-
organisation approach to enhancing the visitor economy, and it will also use tourism as a platform to promote other
aspects of Auckland.

In general, ATEED will take the lead on initiatives that are subject to market failure or require levels of coordination that
cannot be delivered by an individual business or organisation, and it will influence and/or support third party initiatives
that are likely to have a material impact on the visitor economy. ATEED is unlikely to engage in commercial activities that
could be delivered more efficiently by the private sector.

                                                                                                                           1
FIGURE 2: ATEEDS ROLE IN SUPPORTING THE AUCKLAND VISITOR ECONOMY
Auckland in 2012
In 2012, Auckland’s visitor economy was worth $4.83 billion and sustained the equivalent of 34,700 full-time jobs. The
detailed analysis in this document demonstrates the diversity of Auckland’s visitor economy, and highlights the need to
understand and respond to the differing motivations and drivers of a variety of markets (e.g. Asia vs. Australia) and
segments (e.g. leisure vs. business events).
Taking into account current global and domestic tourism trends, existing air linkages and geographic considerations
Auckland will achieve the best outcomes by focussing its resources on the domestic market, key Pacific Rim markets such
as Australia, China, the United States, Indonesia and Japan, and the emerging market of South America.
2FIGURE 3: PRIORITY MARKETS FOR AUCKLAND
China Japan
U.S.
Indonesia
South
Australia
America
THE ASPIRATION
This Visitor Plan is built around two aspirations for Auckland:
Economic aspiration: Expand the visitor economy from $4.83 billion in 2012 to $7.23 billion in 2021, representing
growth of 50% or 4.6% per annum. Achieving this would create 12,000 new jobs in Auckland, many of which would
provide long-term career opportunities for young people and less-skilled workers.
Place aspiration: Use the economic and intangible benefits delivered by tourism to transform Auckland into a place
promoting its unique identity and story that is highly attractive to residents and visitors alike: (brand Auckland - an
exciting place where big city sophistication goes hand-in-hand with an outstanding natural playground).
Strategic framework
The centre of the strategic framework that drives this Visitor Plan is the Aspiration for 2021. Wrapped around the core
aspiration are two high level outcomes that are essential to Auckland’s success as a visitor destination:
Growing demand for Auckland (demand focus – attracting more visitors to Auckland and increasing length of stay)
Enhancing the visitor experience (supply focus – providing visitors with more things to see, do and spend money on)
ATEED will play a leading role in growing demand for Auckland through proactive interventions that increase destination
awareness and intention to visit. This will include direct investment in brand management, destination marketing, major
events, business events, and specific initiatives that will lead to long-term growth in domestic and international visitation
to Auckland.
Enhancing the visitor experience encompasses a complex range of issues, many of which are beyond ATEED’s direct
control or influence. ATEED will therefore play a facilitation role by being a vocal advocate for the visitor economy and
working alongside public and private sector organisations to make Auckland a more compelling and attractive visitor
destination.
3Figure 4 Strategic framework for growing Auckland’s visitor economy
Six cross-cutting themes have been included in the framework to guide and influence Auckland’s thinking as it implements
this Visitor Plan:
Collaboration and partnership
Auckland’s brand and unique identity
Profitability and productivity
Capability and innovation
Research and planning
Sustainability
The outer layer of the framework presents the strategic goals that will guide Auckland towards its desired outcomes of
growing demand for Auckland and enhancing the visitor experience.
4Specific actions have been identified within each of these goals:
1. Target high value visitors
2. Improve marketing and distribution
3. Develop world-class attractors and experiences
4. Grow capacity and capability
5. Be visitor friendly
6. Make it easier to do business in Auckland
The specific actions in this Visitor Plan are categorised into “Driver” actions (those most likely to deliver significant
improvements to the visitor industry in their own right) and “Core Business” actions (those that ATEED will deliver as part
of its core business functions).
ATEED’s investment in tourism
The long-term investment by ATEED to successfully implement this Visitor Plan is estimated at $12.35 million per annum.
This figure relates specifically to tourism and does not include ATEED’s overheads or the confirmed investment in major
events. This Visitor Plan recommends reaching $12.35 million in 2017/18 through a series of incremental increases
starting in 2014/15. The proposed investment profile represents an overall increase in tourism funding of $5.90 million
between now and 2021.
ATEED will leverage and multiply this baseline investment by establishing joint ventures and matched-funding initiatives
with agencies such as Tourism New Zealand, Auckland Airport and the Ministry for Business Innovation and Employment,
as well as private sector travel industry partners such as airlines and travel sellers.
Additional investment in tourism
Auckland Council will be investing over $3 billion in infrastructure over the next 20 years that will have a direct impact on
Auckland’s visitor experience. Investment in these initiatives between now and 2021 is likely to be in the vicinity of $1.5
billion.
In addition, it is estimated that around $2.3 billion of private sector investment will be required between now and 2021
to service the extra demand for goods and services caused by growth in the visitor economy e.g. hotels, the New Zealand
International Convention Centre, rental fleets, restaurants, and visitor attractions.
5INTRODUCTION
Tourism has the power to transform Auckland. The direct benefits of tourism include growth in the visitor economy
(visitor expenditure), more jobs (including excellent career opportunities for youth and less skilled workers) and higher
productivity for local businesses.1 These benefits are compelling in their own right and are usually promoted as the main
reasons for growing tourism, because they are regularly measured and easy to understand. However, with the right
strategic approach tourism has the potential to generate a much broader range of benefits that can underwrite a city’s
economic and social transformation, ultimately providing its residents with greater social amenity and higher living
standards.
Every visitor to Auckland is a potential agent of change. At the most basic level the money spent by visitors increases
demand for local goods and services, sustaining businesses, jobs and investment that the resident population could not
support on its own (the $4.83 billion spent in Auckland by visitors in 2012 is equivalent to the expenditure generated by
230,000 local residents). This increase in demand has a material impact on the profitability and productivity of local
businesses.
The next layer of benefits are driven by what visitors bring to Auckland in terms of knowledge (e.g. conferences), business
networks, purchases of non-tourism good and services (e.g. marine products), investment, and talent (many immigrants
have chosen to re-locate to Auckland following a visit, increasing the diversity of Auckland’s workforce and enhancing
capability).
And finally, visitors play an important role in subsidising (and therefore sustaining) essential social and cultural
infrastructure (e.g. Auckland War Memorial Museum, Auckland Maritime Museum, Auckland Art Gallery and Auckland
Zoo), education institutions (e.g. export education), public transport (e.g. Link services) and air routes which are critical
enablers of high-value international trade.
FIGURE 5: SCOPE OF BENEFITS DELIVERED BY THE VISITOR ECONOMY
1On average visitors spend around 2.5 times as much per day as local residents, and more than 6 times as much once items that
visitors don’t purchase such as housing are excluded. These differences allow local businesses to extract more value from the
resources they employ, resulting in higher productivity and profitability over time.
6The opportunity
Visitors are often indistinguishable from residents and increasingly purchase from the same stores and share the same
spaces as locals. The convergence between the visitor experience and the resident experience is being driven by growing
demand for authentic experiences, and a desire to understand and interact with the local culture, environment and way
of life. Natural and man-made attractions still play a key role in the visitor experience, but a rich social fabric is now a
critical success factor for any destination. This has resulted in a shift away from destinations built solely around icons and
towards those in which visitors can immerse themselves in the local culture and see and do things that are not available
elsewhere.
This has three important implications for aspiring visitor destinations:
1. A great place to live is likely to be a great place to visit. Liveability is therefore one of the cornerstones of a successful
visitor economy.
2. A successful visitor destination must understand, celebrate and promote its culture and way of life. A strong city
brand can be used to capture and communicate these elements, leading to an increase in civic pride and the
projection of a consistent proposition to residents and non-residents alike.
3. The success of a destination is determined by the experience it provides. This depends on a variety of factors including
the social fabric and culture of the city, the range, quality and accessibility of things to see and do, the local
environment, and the uniqueness of the experience.
A successful visitor economy therefore requires a rich social fabric and unique, distinctive attributes that appeal to locals
and visitors alike. These elements play an important role in informing and promoting the city’s brand.
Auckland has an opportunity to rapidly transform itself into the world’s most liveable city by
maximising these place/destination synergies and using the growth in the visitor economy to
underwrite the transformation.
For example, Auckland is investing in a variety of infrastructure, transport and place making initiatives to help it achieve
its vision of becoming the world’s most liveable city. These initiatives will make Auckland a more attractive place to live,
but the benefits could be multiplied through incremental investment in new initiatives, and variations in planned
initiatives, targeted specifically at making Auckland a more attractive place to visit. These visitor-focussed initiatives
would build on the enhanced social fabric delivered by the liveability agenda, expanding the range of activities available
to residents, and allowing Auckland to realise its full potential as both a place to live and a place to visit.
If businesses have confidence in the visitor economy and its long-term prospects they will continue to invest, further
enhancing the visitor experience and initiating a virtuous cycle of improvement in Auckland’s standard of living,
international profile and economic prosperity. The anticipated growth will need to occur sustainably in order to protect
and enhance Auckland’s natural environment and secure resources for future generations.
The key catalysts of this transformation are bold visionary leadership and long-term public and private sector investment.
This Visitor Plan presents a clear aspiration for the contribution tourism makes to Auckland, supported by an investment
road map and a tangible set of actions to align thinking, identify opportunities, and direct public and private sector
investment in tourism-related initiatives over the next decade.
7FIGURE 6: VIRTUOUS CYCLE INITIATED BY AN ENHANCED VISITOR ECONOMY
World-class
destination
Increased
Liveability
visitor spend
vision
Increased Greater
private Leadership talent
investment attraction
Long-term Greater
public wealth and
investment Greater employment
productivity
and
profitability
ATEED’s role
Auckland Tourism, Events and Economic Development Ltd (ATEED) is focussed on delivering new money and new jobs for
Auckland, achieved through the implementation of various growth plans within its Growth & Competitiveness Framework.
The priorities within the framework are:
Growing the visitor economy
Building a world-class major events portfolio
Building a culture of innovation
Developing key sectors of competitive advantage
Attracting business and investment
Growing a skilled workforce
Attracting international students
Supporting businesses across Auckland
Tourism cuts across each of these priorities to varying degrees, presenting ATEED with a range of leveraging opportunities
if it adopts a whole-of-organisation approach to growing the visitor economy. For example:
The major events team can help to address seasonality in Auckland by pursuing events that attract visitors outside
peak tourism periods
The business and investment team can make it easier for tourism businesses and potential investors to develop
successful businesses in Auckland
The tourism team can work with the export education team to develop initiatives that will grow friends and family
visitation
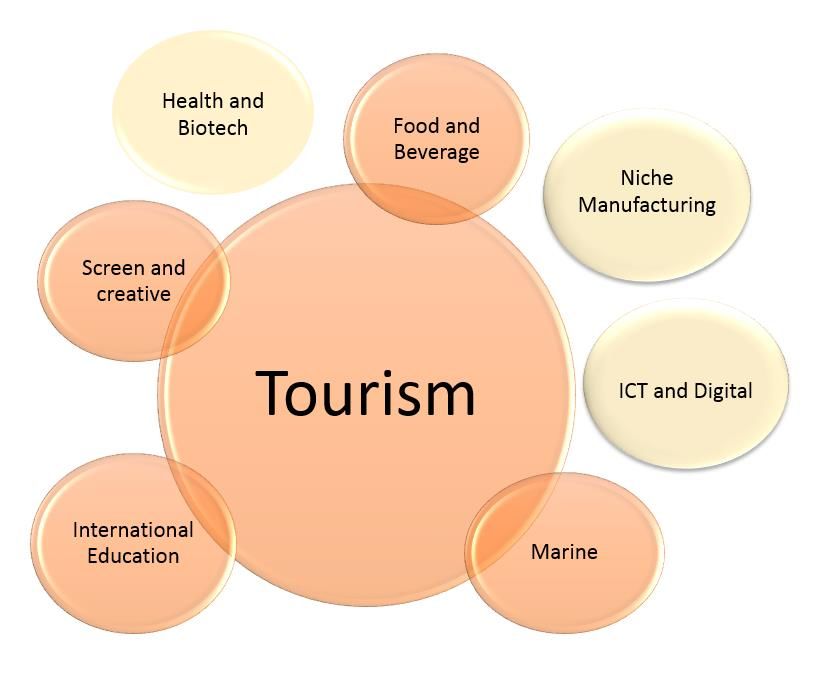
8Adopting a whole-of-organisation approach also gives ATEED the opportunity to use tourism (including events) as a
promotional platform for Auckland’s eight priority sectors:
Tourism
Food and beverage
Niche manufacturing
ICT and digital
Marine
International education
Screen and creative
Health and biotechnology
Tourism aligns directly with several of these sectors including food & beverage, screen/creative, international
education and marine. The remaining priority sectors (ICT, niche manufacturing and health/biotechnology) have
indirect linkages to tourism through the supply chain. ATEED is committed to exploiting these linkages in order to
maximise economic opportunities and outcomes for Auckland. ATEED also continues to investigate new sector
opportunities including high performance sport.
FIGURE 7: ALIGNMENT BETWEEN TOURISM AND ECONOMIC DEVELOPMENT STRATEGY PRIORITY SECTORS
Accelerating growth in Auckland’s visitor economy will require a careful balance of demand stimulation (attracting more
visitors) and continual improvement in the visitor experience (giving people more reasons to visit). ATEED will assume
primary responsibility for growing destination awareness and intention to visit Auckland through its various marketing
and distribution channels, incorporating the unique cultural stories contributing to Auckland’s brand, while providing as
much support as it can for initiatives that have the potential to enhance the visitor experience.
ATEED will take the lead on initiatives that are subject to market failure or require coordination that
cannot be delivered by an individual business or organisation, and it will influence and/or support
third party initiatives that are likely to have a material impact on the visitor economy.
9Strategic alignment
The Auckland Visitor Plan aligns with the Auckland Plan, Auckland Council’s Economic Development Strategy (EDS),
ATEED’s Growth & Competitiveness Framework, the Waterfront Plan and the City Centre Master Plan.
It has been developed in consultation with a wide range of interested and affected stakeholders within Auckland including
visitor industry operators, international visitors, Auckland Council Local Boards, the Independent Maori Statutory Board,
relevant Auckland Council divisions and other CCOs.
The Auckland Visitor Plan has been discussed with local and central government Maori representatives, aligns with their
strategic direction, and appropriate consultation with iwi will be undertaken before proceeding with any actions relating
to Maori cultural experiences.
Consideration has also been given to recent documents produced by major tourism stakeholders including Tourism 2025
(Tourism Industry Association), Tourism New Zealand’s Three Year Marketing Plan, Going Beyond (Air New Zealand) and
Ambition 2025 (Auckland International Airport).
Other ATEED Plans & Strategies
ATEED has also developed independent growth plans for business events, major events and export education. These
growth plans are directly referenced in the Auckland Visitor Plan, and also provide highly specialised stand-alone growth
plans for these high-yielding segments. ATEED will also develop a Tourism Development Plan which focuses on supply-
side issues and initiatives that influence the visitor experience.
FIGURE 8: AUCKLAND VISITOR PLAN STRATEGIC ALIGNMENT
10Rationale for public sector involvement
Market failure
It is unusual for the private sector to invest in activities that build destination awareness and intention to visit because it
is difficult for individual businesses to secure enough benefits to achieve a sufficient return on investment. As a result
government-funded agencies generally focus on growing destination awareness and intention to visit, and private
businesses invest in converting that intention into actual demand where they have a greater chance of converting their
efforts into commercial returns.
More generally, the benefits of the visitor economy are spread widely across the resident population through direct
transactions with visitors and the associated flow-on effects. This dispersion of benefits can lead to a common form of
market failure where investments that would be good for the region are not made because private investors cannot
secure enough of the benefits. In such cases, the public sector has a mandate to intervene and invest on behalf of
ratepayers.
Destination management
Successful visitor destinations are carefully managed and developed to ensure they deliver consistently high levels of
service and visitor satisfaction. As a major investor in Auckland’s visitor assets, and the only organisation with a region-
wide mandate, Auckland Council must take responsibility for monitoring the visitor experience and intervening when
issues arise.
Public goods and services
Public goods and services play a major role in creating the physical and sensory environment visitors experience e.g.
museums, art galleries, public transport, regional parks, streetscapes and public spaces. As a major investor in
Auckland’s visitor assets Auckland Council has an important role to play in creating an environment that is attractive to
visitors. This will require ongoing investment in public goods and services that enhance the vibrancy, attractiveness and
functionality of Auckland. These investments will send a strong signal of commitment to the visitor economy which is
likely to increase the flow of private sector capital into visitor-related assets in Auckland.
Expectations of private sector
100% of respondents to a survey of around 150 visitor-related businesses in 2011 felt that Auckland Council has a role to
play in supporting the growth of the visitor economy. Four key themes emerged when respondents were asked what
Auckland Council’s role should be:
Marketing and promotion with a particular focus on increasing awareness and consideration of Auckland as a
visitor destination (top of the funnel), because this is where the main market failure exists.
Better public transport
Provision of clean, attractive amenities and public spaces
Provision of supporting infrastructure and signage
Regulatory environment
Auckland Council has a key role to play in creating a business environment that enables the visitor economy to grow at
an accelerated rate. This includes developing a planning and policy environment that incentivises growth in the visitor
economy, and responding positively to the needs of businesses.
11AUCKLAND IN 2012
The Auckland visitor economy2 was worth $4.83 billion in 2012 excluding expenditure on airfares and education fees3,
comprising $2.46 billion of expenditure by international visitors and $2.37 billion by domestic visitors (Ministry of
Business, Innovation and Employment). This economic activity sustained 34,700 full-time equivalent jobs in Auckland.
Analysis of the International Visitor Survey (MBIE) allows international visitors to be divided into those who are primarily
visiting Auckland, and those who are primarily visiting other parts of New Zealand. Primary visitation requires at least
70% of all nights in New Zealand being spent in Auckland.
International visitors for whom Auckland is the primary destination can be further divided into short stay (up to 14 days)
and long stay (more than 14 days). This segmentation is important for two reasons:
1. There are material differences in the spending characteristics of these two groups
2. There are material differences in the travel motivations of these two groups, and the channels that would be used
to influence them
FIGURE 9. STRUCTURE OF AUCKLAND’S VISITOR ECONOMY IN 2012 BY SEGMENT (INCL. GST)
Inbound Visitor Economy 34,700
$4,831m FTEs
Domestic International
$2,374m $2,458m
AKL is not primary destination AKL is primary destination
$1,245m $1,213m
Leisure $881m
VFR $172m Short stay Long stay
$726m $487m
Business $70m
Other $123m Leisure $227m Leisure $58m
VFR $180m VFR $169m
Business $180m Business $47m
Business events $101m Education $151m
Events $38m Other $62m
2Auckland’s visitor economy is equivalent to the value of local goods and services purchased by visitors to the region.
3The official measures of regional tourism expenditure produced by MBIE expressly exclude these items. See
http://tinyurl.com/m4er4y4 for more information.
12FIGURE 10: STRUCTURE OF AUCKLAND’S VISITOR ECONOMY IN 2012 BY MARKET (INCL. GST)
Inbound Visitor Economy 34,700
$4,831m FTEs
Domestic International
$2,374m $2,458m
AKL is not primary destination AKL is primary destination
$1,245m $1,213m
Australia $300m
N. America $109m Short stay Long stay
$726m $487m
Asia $460m
Australia $358m Australia $47m
UK & Europe $242m
Other $134m N. America $51m N. America $23m
Asia $155m Asia $226m
UK & Europe $72m UK & Europe $90m
Other $89m Other $101m
This analysis demonstrates the diversity of the visitor economy and highlights the need for an informed approach to
growing it that takes account of the motivations and drivers of a variety of segments and markets. For example:
Primary visitation to Auckland could be grown by targeting specific segments such as Australian short-break
travellers, business events, major events, and export education.
The value of non-primary visitors could be grown by giving visitors more reasons to spend time and money in
Auckland within their wider New Zealand itinerary.
Growing the visitor economy therefore requires a sound understanding of its structure and an informed and
differentiated plan for growing each component.
13TABLE 1: TOURISM ACTIVITY IN AUCKLAND
Visitor nights Expenditure (incl. GST)
Visitor segment Visitors Total Average Total ($m) Per visitor Per night
Total n/a n/a n/a 4,831 n/a n/a
Domestic n/a n/a n/a 2,374 n/a n/a
International 1,535,043 15,442,183 10.1 2,458 1,601 159
Primary leisure short stay 169,000 727,501 4.3 227 1,342 312
Primary leisure long stay 21,239 1,063,911 50.1 58 2,722 54
Primary VFR short stay 180,763 1,201,945 6.6 180 995 150
Primary VFR long stay 93,946 4,253,937 45.3 169 1,794 40
Primary business short stay 117,685 417,852 3.6 180 1,527 430
Primary business long stay 9,724 499,129 51.3 47 4,821 94
Primary education all 26,911 2,405,814 89.4 151 5,621 63
Primary business event 59,227 246,181 4.2 101 1,707 411
Primary event all 13,927 159,180 11.4 38 2,760 241
Primary other all 17,788 1,402,571 78.8 62 3,490 44
Non-primary 824,832 3,064,163 3.7 1,245 1,510 406
14GLOBAL TRENDS
Patterns of tourism demand are constantly evolving, driven by shifts in income, aviation technology, exchange rates and
consumer preferences. This section examines global trends in international tourism, domestic tourism and aviation.
International tourism
The World Tourism Organisation (WTO) predicts that international visitor arrivals will reach almost 1.6 billion by the year
2020, up around 555 million or 60% on 2010 levels (4.5% per annum). East Asia and the Pacific, South Asia, the Middle
East and Africa are forecast to grow at over 5% per year, while the more mature regions of Europe and the Americas are
expected to show lower-than-average growth rates. Europe will maintain the highest share of world arrivals, although
this share will decline from 52% in 2010 to 46% in 2020. The WTO projections indicate that the top three receiving regions
in 2020 will be Europe (717 million tourists), East Asia/Pacific (397 million) and the Americas (282 million), followed by
Africa, the Middle East and South Asia.
TABLE 2: UNWTO PROJECTIONS OF INTERNATIONAL VISITOR ARRIVALS BY REGION
Visitor arrivals Share of global
Change 2010-2020
(millions) visitor arrivals
2010 2020 Total CAGR 2010 2020
Total 1,006 1,561 555 4.5% 100.0% 100.0%
East Asia/Pacific 195 397 202 7.4% 19.4% 25.4%
Europe 527 717 190 3.1% 52.4% 45.9%
Americas 190 282 92 4.0% 18.9% 18.1%
Middle East 36 69 33 6.7% 3.6% 4.4%
Africa 47 77 30 5.1% 4.7% 4.9%
South Asia 11 19 8 5.6% 1.1% 1.2%
Source: Tourism 2020 Vision, UNWTO
These projections suggest that the East Asia/Pacific region will experience strong growth in visitor activity over the next
decade, increasing its share of global visitor arrivals from 19.4% in 2010 to 25.4% in 2020. Much of this demand will be
generated from within the region, particularly out of China.
Changes in outbound travel volumes over the past decade
Outbound travel data for New Zealand's major and emerging inbound markets have been collated from a variety of
sources including government statistics and published tourism studies. Only ‘relevant outbound travel’ has been
considered in this analysis, represented by long-haul travel for long-haul markets, and Asia/Pacific travel for Australia.
These travel thresholds are considered to represent the travel markets most relevant to New Zealand.
Within New Zealand's major inbound markets China has experienced the largest growth in relevant outbound travel
volumes, with Chinese residents generating an additional 5.5 million outbound trips in 2012 relative to 2002 levels. The
United States was the next highest at 5.1 million, followed by Australia at 4.0 million, South Korea at 3.7 million and
Germany at 3.4 million. Japanese demand for long-haul travel has declined quite significantly over the same period, with
1.1 million less Japanese residents travelling long-haul in 2012 relative to 2002 levels.
15TABLE 3: CHANGE IN RELEVANT OUTBOUND TRAVEL FROM KEY MARKETS 2002-2012
Relevant outbound trips Growth 2002-2012
2002 2012 Total Percent
China 2,405,000 7,952,008 5,547,008 231%
United States 12,935,110 18,019,417 5,084,307 39%
Australia 2,601,400 6,577,280 3,975,880 153%
South Korea 3,815,000 7,500,000 3,685,000 97%
Germany 5,515,000 8,896,000 3,381,000 61%
India 1,520,000 4,096,000 2,576,000 169%
Brazil 802,000 2,897,000 2,095,000 261%
United Kingdom 10,135,873 11,935,160 1,799,287 18%
Indonesia 839,000 1,856,000 1,017,000 121%
Japan 5,383,465 4,309,014 -1,074,451 -20%
New Zealand’s share of outbound travel
New Zealand was only a minor beneficiary of this growth across all markets except Australia. For example, New Zealand
is currently capturing around 2.2% of the additional 5.5 million long-haul outbound trips that Chinese residents are making
each year, and receives less US residents now than it did 10 years ago despite significant growth in the number of US
residents travelling long-haul. The notable exception is Australia. New Zealand has captured around 13.2% of the total
growth in Australian outbound travel over the past decade. This has seen Australian visitor arrivals to New Zealand
increase by around 523,000 relative to 2002 levels.
TABLE 4: SHARE OF GROWTH IN RELEVANT OUTBOUND TRAVEL CAPTURED BY NEW ZEALAND
Growth in relevant Share of growth in
Growth in visitor arrivals to
outbound travel relative to relevant outbound travel
NZ relative to 2002
2002 captured by NZ
China 5,547,008 120,490 2.2%
United States 5,084,307 -27,609 -0.5%
Australia 3,975,880 523,322 13.2%
South Korea 3,685,000 -57,040 -1.5%
Germany 3,381,000 14,825 0.4%
India 2,576,000 12,586 0.5%
Brazil 2,095,000 4,537 0.2%
United Kingdom 1,799,287 -47,338 -2.6%
Indonesia 1,017,000 4,008 0.4%
Japan -1,074,451 -101,487 9.4%
In general, the growth in visitor arrivals to New Zealand has not been as rapid as the growth in relevant outbound travel
from New Zealand's major markets. This has resulted in a loss of market share to other destinations. The most notable
losses of market share are Australia (-6.7 percentage points), South Korea (-2.2 percentage points) and Japan (-1.6
percentage points).
16TABLE 5: NEW ZEALAND'S MARKET SHARE OF RELEVANT OUTBOUND TRAVEL
NZ market share in 2002 NZ market share in 2012 Market share chnage 2000-2010
China 3.2% 2.5% -0.7%
United States 1.6% 1.0% -0.6%
Australia 24.3% 17.6% -6.7%
South Korea 2.9% 0.7% -2.2%
Germany 0.9% 0.7% -0.2%
India 1.1% 0.7% -0.4%
Brazil 0.7% 0.4% -0.4%
United Kingdom 2.3% 1.6% -0.7%
Indonesia 1.0% 0.7% -0.3%
Japan 3.2% 1.7% -1.6%
Auckland’s share of outbound travel
The main growth through Auckland International Airport has been from Australia and China, with moderate growth from
Germany, India, Brazil and Indonesia. The U.S., South Korea, United Kingdom and Japan fell over the same period.
TABLE 6: SHARE OF GROWTH IN RELEVANT OUTBOUND TRAVEL CAPTURED BY AUCKLAND
Outbound travel relative to Growth to AKL relative
Share of growth captured by AKL
2002 to 2002
China 5,547,008 115,571 2.1%
United States 5,084,307 -22,702 -0.4%
Australia 3,975,880 335,119 8.4%
South Korea 3,685,000 -47,917 -1.3%
Germany 3,381,000 9,341 0.3%
India 2,576,000 9,165 0.4%
Brazil 2,095,000 3,558 0.2%
United Kingdom 1,799,287 -39,447 -2.2%
Indonesia 1,017,000 1,142 0.1%
Japan -1,074,451 -50,694 4.7%
Auckland has lost market share across all markets over the past 10 years. The most notable losses of market share are
Australia (-3.3 percentage points), South Korea (-1.8 percentage points) and Japan (-0.7 percentage points).
TABLE 7: AUCKLAND'S MARKET SHARE OF RELEVANT OUTBOUND TRAVEL
AKL market share 2002 AKL market share2012 Change market share 2002-2012
China 2.7% 2.3% -0.5%
United States 1.3% 0.8% -0.5%
Australia 13.9% 10.6% -3.3%
South Korea 2.3% 0.5% -1.8%
Germany 0.7% 0.5% -0.2%
India 0.9% 0.6% -0.3%
Brazil 0.7% 0.3% -0.4%
United Kingdom 1.8% 1.2% -0.6%
Indonesia 0.8% 0.4% -0.4%
Japan 2.0% 1.4% -0.7%
17Future growth in major and emerging inbound markets
Forecasts of relevant outbound trips from New Zealand's major markets have been developed by combining forecasts of
per capita trip rates with population projections. The results suggest that:
China will generate 19.1 million long-haul outbound trips in 2021. This represents an additional 11.1 million long-
haul trips per year relative to current levels.
The United States will remain the largest source market for long-haul travel over the forecast period, with demand
expected to increase by around 3.6 million trips per year in 2021 relative to current levels.
Long-haul outbound trips by residents of India will increase by 3.4 million in 2021 relative to current levels. This will
bring India's outbound travel volumes close to where China's were in 2012 i.e. India appears to be around a decade
behind China in terms of its development as a source market for long-haul tourism.
TABLE 8: PROJECTED GROWTH IN OUTBOUND TRAVEL
Long-haul outbound trips Growth 2012-2021
2012 2021 Total Percent
China 7,952,008 19,076,980 11,124,972 140%
United States 18,019,417 21,662,040 3,642,623 20%
Australia 6,577,280 9,008,548 2,431,268 37%
South Korea 7,500,000 10,842,974 3,342,974 45%
Germany 8,896,000 11,532,381 2,636,381 30%
India 4,096,000 7,492,236 3,396,236 83%
Brazil 2,897,000 5,050,442 2,153,442 74%
United Kingdom 11,935,160 12,540,044 604,884 5%
Indonesia 1,856,000 3,072,332 1,216,332 66%
Japan 4,309,014 4,663,129 354,115 8%
Implications for Auckland
There will be significant growth in demand for international travel over the next decade. Auckland is well placed to
capitalise on this growth if it can market itself effectively and develop the necessary air links to satisfy demand. The
highest growth rates in outbound travel are forecast for the Asia Pacific region; hence simply maintaining Auckland’s
market share of relevant outbound travel will result in significant growth in international visitor arrivals over the next
decade.
However, maintaining market share will present challenges as other regions and cities around the world compete for the
visitor dollar. Auckland will need to invest strongly and stay focused on achieving measurable results in order to be
successful. Attention will also need to be given to Auckland’s product offering and its appropriateness to the changing
market profile.
18Domestic tourism
According to the Tourism Satellite Account (Statistics New Zealand) domestic tourism currently accounts for around 59%
of New Zealand's visitor economy, or around $14.2 billion of expenditure (including GST).
The most recent data published by the Ministry of Business, Innovation and Employment shows that domestic tourism
activity in New Zealand remained relatively stable between 2004 and 2010, with visitor nights sitting at around 55 million
per annum and expenditure growing at approximately the rate of inflation.
In contrast, international outbound trips increased by 25% between 2004 and 2010, driven by the strength of the New
Zealand dollar and lower airfares on major outbound routes. This figure increases to 69% if the assessment period is
extended to 2000-2012, driven mainly by the strong growth in trans-Tasman travel in 2003/04.
The relationship between domestic and outbound travel was explored in a report published by the Ministry of Tourism in
2006. The report found that:
The amount of time New Zealanders spent away from home was relatively stable between 1999 and 2005 despite a
relatively large drop in domestic visitor nights
The fall in domestic visitor nights was offset by an increase in outbound visitor nights
There is strong evidence that the increase in outbound tourism is causing the decline in domestic tourism
The Ministry of Tourism report concluded that the main reasons for the poor performance of the domestic tourism market
in New Zealand were:
A general shift in travel preferences toward outbound travel, particularly in regions that were well served by low cost
carriers.
A narrowing price differential between domestic and international travel. The report found that the nominal price of
outbound tourism in New Zealand increased by 9% between 1990 and 2005 while the nominal price of domestic
tourism increased by 44%. With general inflation running at 35% over this period the real (inflation adjusted) cost of
international travel fell quite significantly, while the real cost of travelling domestically increased.
The report also found that the decline in domestic tourism and corresponding increase in outbound tourism was not
unique to New Zealand - the same trend was observed in other countries including Australia and the United Kingdom.
Research published by the Tourism Industry Association of New Zealand (TIANZ) and Lincoln University in 2011 confirms
the continued weakness in the domestic tourism market. According to the research, tourism operators reported key
themes of shorter booking times, a declining domestic visitor market, a shift away by their business from attracting the
domestic visitor market, and resistance by New Zealanders to pay for visitor attractions. The increase in outbound travel
was also cited as a negative influence on domestic tourism.
19Some other key findings from the research are that:
New Zealanders are very price sensitive and there is a perception that New Zealand tourism experiences are “pricey”.
Cheap overseas airfares are appealing to the domestic market, particularly at times when our dollar is strong. There
are also a number of external challenges to domestic tourism such as changes in leisure activities, more discretionary
income being spent on home entertainment, increasing fuel prices and changes in traditional holiday times. While in
many areas holiday parks are doing very well, in some areas the reduction in coastal camping grounds (as a result of
commercial rationalisation by local councils whereby the land is sold in favour of residential development) has had
an impact on domestic tourism. Although regional domestic tourism has remained strong in some parts of New
Zealand, within those regions there is considerable competition between individual destinations.
Domestic tourism is recognised by many as an important part of the tourism industry and acts as a buffer when
international markets are down. “In order to provide an international product that delivers to the economic benefit
of the country we need a vibrant domestic market to support those businesses.” This makes it more difficult for
traditional style Maori tourism experiences in particular as there is a perception by New Zealanders that those
products are not for them. Fuel incentives and reduced fees for DOC services were suggested as incentives that might
encourage domestic tourism.
Implications for Auckland
The potential to grow domestic tourism arrivals in Auckland is constrained by New Zealand’s low population growth rate
and the likelihood of continued growth in outbound travel. This does not mean that Auckland cannot materially increase
domestic visitor activity and expenditure, but recent trends suggest that Auckland will need to scale up its domestic
tourism activity and increase length of stay among non-leisure visitors if it is to accelerate growth in this important market.
ATEED is now well placed to drive change in the domestic tourism market with a revised structure that includes specific
domestic marketing resource. Specific actions to address the domestic market are outlined in Section 5. Initiatives put
in place will look to develop the domestic offering and encourage Aucklanders and others to spend more time in Auckland,
appreciating the unique culture heritage, stories and experiences, and shifting the balance of discretionary income spent
on offshore travel.
20Aviation
Aviation is a critical driver of tourism growth. Where and when airlines choose to deploy their aircraft can have a major
impact not only on visitor flows, but also on high-value trade flows. While growth in global air capacity is led by global
growth in tourism and trade, airlines choose which routes their capacity is deployed to.
A report published in 2011 entitled The New Zealand Aviation Operational Environment: A Guide for the Tourism Sector
describes the key features of the operating environment for the New Zealand aviation sector and the drivers of strategic
choices made by airlines. The key findings of this report are outlined below.
Individual routes must be examined as part of a network
Airlines operate networks of routes, and the value of any individual route depends partly on its contribution to traffic
flows throughout the network. In turn the value of a route depends on the structure of the airline’s broader network. This
means that the incentives to fly any given New Zealand route may be very different for Air New Zealand and foreign
airlines, due to their different network structures. For many routes, connecting traffic from other routes is an important
source of demand that makes the route profitable, particularly for full-service airlines. Alliances and other cooperative
arrangements between airlines are crucial for generating connecting traffic on many New Zealand international routes.
Many potential international routes to New Zealand are currently not viable
The basic economics of a route depend on the demand for travel on that route relative to operating costs, taking into
account any contribution to generating traffic and profits throughout the airline’s wider network. Demand includes traffic
connecting from other routes, but must take into account competing routes (including indirect itineraries) that may be
available to passengers. Costs depend on the size of aircraft required. Many international routes to New Zealand are long
distance, requiring relatively large aircraft. Airlines are generally unwilling to schedule flights less than three times weekly
due to fixed route operating costs. In many cases, these factors in combination mean that capacity at a reasonable
frequency would be too large relative to existing demand, making the route unprofitable. This may change over time as
demand for travel between New Zealand and particular countries increases and/or technological improvements increase
the range and efficiency of smaller aircraft.
Some New Zealand international routes are not highly competitive
The basic economics of international routes also means that there is a lack of competition on many New Zealand
international routes. Where alternative routes are not viable for travellers, this results in relatively high airfares. In many
cases greater competition is not sustainable as two competing carriers would supply too much capacity relative to
demand. Another implication is that the New Zealand tourism sector is to some extent dependent on foreign airlines to
provide international connectivity and bring tourists to New Zealand. The incentives of these airlines may be very different
to those of the New Zealand tourism sector, or Air New Zealand due to their commercial models and varying shareholders.
A few international routes provide the majority of international connectivity
A few routes connecting Auckland to Singapore, Hong Kong, Los Angeles and Dubai via Sydney and Brisbane, provide the
greatest connectivity between New Zealand and the rest of the world in terms of the combination of flight frequency and
onward connection options. The health of these routes is critical for providing good access to New Zealand for
international visitors. Cooperative arrangements between airlines such as code-sharing and alliances are crucial for
generating traffic on some key international routes.
21International visitors are only one source of demand for air international services
While outbound travel by New Zealand residents has limited benefit for the New Zealand tourism sector, this travel is an
important source of revenue that helps to maintain international air routes. The same is true for air freight. Greater
outbound travel, increased economic activity, and freer international trade indirectly benefit the New Zealand tourism
sector by helping to sustain and expand international air routes to and from New Zealand.
The mix of international visitors matters and is changing
As well as the total number of international visitors to New Zealand, the mix in terms of origins, purpose of visit, and other
characteristics is important as this affects expenditure on the ground in New Zealand and willingness to pay for airfares.
Between 2004 and 2009, most of the growth of international visitors was in the ‘visiting friends and relatives’ (VFR)
segment. While a VFR visitor on average only spends half of what a holiday visitor spends in New Zealand, VFR travel is
important for opening up and sustaining air routes that provide access for all visitor types. For example, around a quarter
of traffic between New Zealand and China is VFR, and without this source of demand, non-stop services between New
Zealand and China are unlikely to be viable, leading to reduced quality of access for Chinese holiday visitors. The mix of
visitors also depends to some extent on competition between airlines and their business model choices. Greater
competition and the introduction of low-cost carriers (LCCs) leading to lower airfares will attract relatively more budget-
conscious tourists who may be individually less valuable to the tourism sector. Similarly, VFR travellers are relatively high
yielding for airlines, but spend less when they are on the ground. Changes in flight frequency also have some effect on
length of stay, with greater frequency promoting shorter stays. The mix of travellers that airlines attract through their
pricing and marketing strategies may therefore not correspond with the optimal mix from the tourism sector’s point of
view.
Many visitors view Australia and New Zealand as complementary destinations
The relatively high number of international visitors to New Zealand that also visit Australia helps to maintain some New
Zealand air routes that also stop in Australia, such as those operated by Emirates, LAN Airlines and Aerolineas Argentinas.
This type of travel may also help to support other future routes to New Zealand via Australia from Asia. Routes are also
supported by some transit traffic between North/South America and Australia, and between South America and Asia.
New Zealand outbound travel offsets the seasonality of inbound travel, leading to relatively stable air capacity levels
throughout the year
The generally opposite seasonality of inbound and outbound travel means that the pattern of air traffic to and from New
Zealand is relatively flat throughout the year. This means that airlines do not have to adjust overall New Zealand capacities
dramatically during the year, and do not experience high costs associated with maintaining extra capacity to use only in
peak periods. Capacities on some individual routes change significantly, but seasonality across New Zealand routes offsets
to a large extent. These offsetting travel patterns benefit the tourism sector as a relatively high average level of air capacity
can be maintained throughout the year.
Technology is an enabler of airline operations and economics
Aircraft technology determines physical capabilities in terms of range and payload, and operating costs. New technology
will change the economics of some routes, potentially allowing more competition and/or new routes. However,
technological change takes place slowly and is uncertain, so increasing demand by increasing New Zealand’s attractiveness
as a destination is also important for route development.
Airlines segment the market to maximise their own revenue
Airlines use sophisticated pricing and revenue management strategies. This leads to market segmentation and pricing
designed to maximise their revenues and benefit their shareholders. The tourism sector may prefer a different mix of
visitors and/or a different structure of prices across market segments. Airlines may use pricing to drive outbound travel
22when it suits them, e.g. in particular seasons. Airlines do not generally specialise in inbound or outbound travel, rather
they seek to optimise their overall portfolio of passengers.
Long-term outlook for the global aviation fleet
Given the importance of aircraft technology in airlines' route decisions, it is useful to understand how the composition of
the global fleet is likely to change over the next 10-20 years. Boeing's annual aviation outlook provides a detailed and
highly regarded view of the future direction of aviation. Some key points have been provided below to highlight the
expected trends in aviation over the next 20 years.
Fleet size will double
Boeing forecasts that the global aircraft fleet will grow from about 20,310 planes in 2012 to more than 41,200 by 2032.
Surging demand for single-aisle aircraft
The single-aisle fleet is forecast to more than double, reaching 29,130 airplanes or 71% of the total fleet by 2030. This
largely reflects the rapid expansion of air services in Asia, the rise of intraregional air travel in emerging economies, and
the growth and geographic expansion of the low-cost-carrier model.
Modest up gauging
The average seat count of airplanes in the fleet will verge upward incrementally as fuel and operating cost pressures
encourage airlines to go to larger seat counts within all airplane size categories.
Rising traffic levels
During the next 20 years, approximately half of the world’s air traffic growth will be driven by travel to, from, or within
the Asia Pacific region. Total air traffic for the region will grow 6.5% per year during the period.
Liberalisation expands markets
The structure of the airline industry in Asia Pacific is changing as regulations are liberalised and carriers find innovative
ways to expand beyond national boundaries to serve burgeoning demand.
23Implications for Auckland
Imminent developments in aircraft technology will change the economics of flying certain routes, particularly long-haul
routes with relatively low passenger volumes like New Zealand. Aircraft like the Boeing 787 will be extremely efficient
and have lower flight costs, therefore increasing New Zealand's accessibility and attractiveness as a destination.
Most of the increase in air capacity over the past decade has been deployed to short-haul routes which has stimulated
significant growth in intra-regional travel. The rapid expansion in short-haul travel has been driven by technological
advancements in single aisle aircraft such as the A320, which has a flight range of around five hours, and the emergence
of the low cost carrier model which has led to massive reductions in airfares on some short-haul routes. This concentration
of technological and commercial innovation on short-haul routes has had an adverse effect on demand for long-haul travel
in some markets.
However, the technological focus within the aviation sector has now turned to long-haul travel. The next generation of
twin aisle (long-haul) aircraft will be much more efficient and have longer flight ranges than the current long-haul fleet.
Furthermore, the low cost carrier model has been successfully expanded to long-haul routes by carriers like Jetstar and
Air Asia X. This signals the potential for much lower long-haul airfares in the future.
The impending changes in long-haul aircraft technology and business models are positive for destinations like New
Zealand, although there will still need to be a strong business case for carriers to fly specific routes. It should also be noted
that legislative demands, for example the Emissions Trading Scheme, New Zealand’s isolation and the increasing costs of
fuel will continue to pose challenges for the sector in New Zealand. Technological advances will assist in offsetting those
impacts on travel behaviour.
24Priority markets
Taking into account current global and domestic tourism trends, existing air linkages and geographic considerations
Auckland will achieve the best outcomes by focussing its resources on the domestic market, key Pacific Rim markets such
as Australia, China, the United States, and Japan, and the emerging market of South America and Indonesia. All of these
target markets have significant growth potential, are of strategic interest to partners such as Tourism New Zealand, Air
New Zealand and Auckland International Airport, and have established direct air linkages with Auckland.
Market Priority Market ATEED role
ATEED consumer campaigns, tactical trade and marketing
Tier 1 Australia, China, NZ domestic
activity
Tier 2 U.S., Japan, South East Asia ATEED tactical trade and marketing activity only
Emerging Indonesia, South America Supporting TNZ trade and media activity
FIGURE 12. PRIORITY MARKETS FOR AUCKLAND
China Japan
U.S.
Indonesia
South
Australia
America
25You can also read