THE SUCCESS FACTORS OF THE FINNISH MOBILE GAME INDUSTRY: A STRATEGIC OVERVIEW-Cases Rovio & Supercell
←
→
Page content transcription
If your browser does not render page correctly, please read the page content below
Bachelor's thesis

International Business Degree programme

International Business Administration

2013

             Aleksanteri Härmä

             THE SUCCESS FACTORS OF
             THE FINNISH MOBILE GAME
             INDUSTRY: A STRATEGIC
             OVERVIEW
             – Cases Rovio & Supercell

                                          1
BACHELOR´S THESIS | ABSTRACT
TURKU UNIVERSITY OF APPLIED SCIENCES
International Business Degree programme
31.5.2013| 49 pages
Nicolas LeGrand
Aleksanteri Härmä
THE SUCCESS FACTORS OF THE FINNISH
MOBILE GAME INDUSTRY: A STRATEGIC
OVERVIEW – CASES ROVIO & SUPERCELL
The video game industry has been one of the most rapidly growing industries during the past
ten years. During this time the number of Finnish companies operating in this field has risen
from 20 companies to approximately 150 firms (Tekes, 2013). The Finnish game industry has
been able to develop several internationally successful game titles. According to a study made
by Neogames and Suomen Pelinkehittäjät Ry., the game industry is the most significant cultural
export product of Finland (Neogames & Suomen Pelinkehittäjät Ry. 2010).
Especially the Finnish mobile game developing companies made an outstanding contribution to
the Finnish game industry’s hypergrowth during the last few years. The long term compound
annual growth rate of the Finnish game industry was 25,70% between the years 2004 and
2012. (Tekes, 2013) The impact of digital distribution is discussed in the study, for it has given
the opportunity for every Finnish mobile game company to compete on a global level.
The thesis’ focus is on the competitive environment of the mobile game industry and how
Finnish game development companies are adapting to different competitive forces. For this
reason the literature review has its emphasis on Michael E. Porter’s publications on strategy
and competition.
A brief strengths, weaknesses, opportunities and threats –analysis based on secondary data
indicates that the main strength of the Finnish mobile game development industry lies on the
excellent technological know-how of the Finnish game development workforce, while the main
weaknesses of the industry are the highly competitive business environment and lack of
educated workforce. The competitive environment is analysed by applying Porter’s Five Forces
framework to the Finnish mobile game industry. The results indicate towards the extremely high
threat of entrants, the high bargaining power of buyers and the eradicating bargaining power of
the suppliers.
KEYWORDS:
Competitive environment, Strategic management, Games industry, Mobile game development
2OPINNÄYTETYÖ (AMK) | TIIVISTELMÄ
TURUN AMMATTIKORKEAKOULU
Kansainvälisen liiketalouden koulutusohjelma
31.5.2013| 49 sivua
Nicolas LeGrand
Aleksanteri Härmä
SUOMEN MOBIILIPELIALAN MENESTYSTEKIJÄT:
STRATEGINEN YLEISKATSAUS –
TAPAUSTUTKIMUKSET ROVIO & SUPERCELL
Videopeliteollisuus on kuulunut nopeimmiten kasvavien alojen joukkoon viimeisten kymmenen
vuoden sisällä. Kyseisenä aikana suomalaisten peliyritysten lukumäärä on kasvanut
kahdestakymmenestä noin sataanviiteenkymmeneen (Tekes, 2013). Suomen peliteollisuus on
kyennyt kehittämään useita kansainvälisesti menestyneitä nimikkeitä. Neogamesin ja Suomen
Pelinkehittäjät Ry.:n tekemän tutkimuksen mukaan peliteollisuus on merkityksekkäin
kulttuurialan vientituote Suomessa (Neogames & Suomen pelinkehittäjät Ry.,2010).
Etenkin mobiilipelienkehitykseen keskittyvillä yrityksillä oli huomattava vaikutus alan
äärimmäisen nopealle kasvulle viime vuosina. Suomen peliteollisuuden kertyvä vuotuinen
kasvuprosentti oli 25,70% vuosien 2004 ja 2012 välillä. (Tekes, 2013) Digitaalisen tiedonjakelun
vaikutusta käsitellään tutkimuksessa, sillä se on antanut jokaiselle suomalaiselle
mobiilipeliyritykselle mahdollisuun kilpailla kansainvälisellä tasolla.
Opinnäytetyön pääpaino on mobiilipelialan kilpailuympäristön tutkimisessa, sekä pelinkehittäjien
mukautumisessa erilaisiin kilpailuvoimiin. Tästä syystä kirjallisuuskatsauksen pääpaino on
Michael E. Porterin julkaisuissa strategiasta ja kilpailusta.
Kirjallisiin lähteisiin perustuva lyhyt SWOT-analyysi osoittaa että Suomen pelialan suuriimmat
voimavarat ovat sen tietotaitoiset työntekijät. Äärimmäisen kilpailullinen teollisuudenala sekä
koulutetun työvoiman puute ovat Suomalaisen peliteollisuuden suurimmat heikkoudet.
Kilpailuympäristöä analysoidaan Porterin viiden kilpailuvoiman avulla. Tulokset kertovat
äärimmäisen kovasta kilpailusta alalla, uusien tulokkaiden uhasta, ostajien vahvasta
vaikutusvallasta, sekä tavarantoimittajien merkityksettömyyden korostumisesta.
ASIASANAT:
Kilpailuympäristö, Strateginen johtaminen, Peliteollisuus, Mobiilipeliala
3CONTENT
LIST OF ABBREVIATIONS (OR) SYMBOLS 6
1 INTRODUCTION 6
1.1 Preview 6
1.2 Research Problem and Objectives 7
1.3 The Scope of the Study 7
1.4 Definitions 8
1.5 Structure of the study 9
2 OVERVIEW OF THE GAME INDUSTRY 11
2.1 Global Game Industry 11
2.2 Finnish Game Industry 11
2.2.1 History 13
2.3 Mobile Game Industry 16
3 LITERATURE REVIEW 17
3.1 Business Model 17
3.1.1 New Earning models 19
3.1.2 Blue Ocean Strategy 21
3.2 Competition: Porter’s five forces framework 22
3.2.1 The five competitive forces that shape strategy 23
3.2.2 Threat of entry 23
3.2.3 The Power of suppliers 27
3.2.4 The Power of buyers 28
3.2.5 The threath of substitutes 30
3.2.6 Rivalry among existing competitors 32
3.2.7 Critique of Porter’s five forces –framework 33
4 CASE STUDIES 35
4.1 Data and methods 35
4.2 Rovio: Angry Birds 35
4.3 Supercell 36
5 EVALUATION 41
5.1 Strategic management aspects 41
5.2 Five Forces framework applied on the Finnish mobile game development industry43
6 CONCLUSION & DISCUSSION 45
6.1 Recommendations for future research 47
47 REFERENCES 48
PICTURES
Picture 1. The share of revenue between Traditional Business Model versus Digital
Distribution model. (Neogames, 2011) 18
FIGURES
Figure 1. The amount of reported turnover in the Finnish game industry since 2007 to
2012. (Tekes, 2013) 12
Figure 2. The number of employees in the Finnish games industry since 2007.
(Neogames, 2012)(Tekes, 2013) 12
TABLES
Table 1. Business models and the shift in customer relationship building emphasis.
(ARMS project Final Report, 2012) 21
5LIST OF ABBREVIATIONS (OR) SYMBOLS
IP Intellectual Property
CAGR Compound Annual Growth Rate
CEO Chief Executive Officer
COO Chief Operations Officer
ESA The Entertainment Software Association
61 INTRODUCTION
1.1 Preview
The video game industry has been one of the most rapidly growing industries
during the past ten years. During these last 10 years the number of Finnish
companies operating in this field has risen from a puny 20 companies to
approximately 150 firms. (Tekes, 2013) The Finnish game industry has been
able to develop several internationally successful game titles. Success stories,
such as the record breaking Angry Birds by Rovio, financially successful Clash
of Clans by Supercell, Remedy’s Max Payne series, Habbo Hotel by Sulake,
and several mobile games developed by Digital Chocolate are only few
examples of Finnish game industry’s know-how. In fact, according to a study
made by Neogames and Suomen Pelinkehittäjät Ry., the games industry is the
most significant cultural export product of Finland. (Neogames & Suomen
Pelinkehittäjät Ry. 2010)
The technological know-how in the Finnish game industry is among the best in
the world. The importance of this expertise is emphasized especially as games
are developed for multiple platforms such as game consoles, different mobile
operating systems or PCs. The price-quality ratio of developing games is quite
good in Finland. Although Finland does not have cheap labor, the quality of the
work done there is excellent. The Finnish game development is very hard to
outsource to lower cost countries because of the high level of know-how and
technology required. (Neogames & Suomen Pelinkehittäjät Ry. 2010)
The game industry is also supported by a strong gaming culture in Finland,
where gaming is viewed socially acceptable. A good infrastructure in terms of
economy, society, technology and telecommunications allows game
development companies to have extensive operations in Finland. (Neogames
2011) The increasing use of mobile devices and smartphones has made
gaming available also on the move. This has created a huge market for games
6developed for these mobile devices. The Finnish game development companies
are at the frontier of this mobile revolution.
1.2 Research Problem and Objectives
The aim of my study is to answer the following research problem: What are the
driving factors behind the success of Finnish mobile game development
companies?
The objectives of the study are composed of the following:
1. To have a clear understanding on the strategic management aspects
which have to be considered in the game development industry.
2. Making an overview on the Finnish mobile game development
environment by applying Michael E. Porter’s “five competitive forces”-
framework on it.
3. Providing example case studies of the most prominent Finnish mobile
game developers Rovio and Supercell.
1.3 The Scope of the Study
I chose to study the Finnish mobile game development industry instead of the
Finnish game industry as a whole. The value chain and business model differs
quite a lot for example in mobile and console games. One of the main
objectives of this study is to point out how the digital distribution model creates
possibilities for Finnish game developing companies aiming to succeed. The
end-user is nowadays closer to the developer itself in the value chain, much
because of the emergence of digital distribution. The differences in business
models and publishing between different platforms will be addressed in the
chapter 3.1.
The domestic market for mobile games in Finland is rather small, and every
Finnish mobile game developer aims their games for the global market. The
reason for most game development companies to use Finland as the base of
their operations is the availability of different resources. The game development
7industry is supported by different subsidies from the Finnish government, and
private funding is also capitalized. The availability of skilled labor for
development is also of importance. The difference in annual growth was the
reason why I chose Finnish game industry over the global one. The compound
annual growth rate (CAGR) for the Finnish game industry counted from 2004 to
2010 was 17,45% which is significantly more than the CAGR of global game
market. (Neogames 2011) The long term CAGR between 2004 and 2012 has
been even higher. A total of 25,70%. (Tekes, 2013: p. 5)
1.4 Definitions
This chapter contains definitions of some concepts that are used often in this
thesis.
Strategy: a company’s game plan for achieving its goals.
Mobile Game: These are games that are designed for mobile devices such as
mobile phone, smartphone or tablet. At this moment the most typical platforms
for mobile games are iPhone, iPad and other tablets, Android devices and
Windows phones. (Niipola 2012: p.133)
Game industry: Companies that develop games for any virtual platform form the
game industry. The Finnish game industry consists of game development
companies located in Finland.
Mobile Game industry: A subcategory within the video game industry.
Companies that participate in the development of games designed purely for
mobile platforms belong to the mobile game industry.
Freemium as a business model: It is a business model in which the consumer
can download the game itself for free but has to pay for the additional content,
which is called the premium. Freemium = free + premium. (Niipola 2012: p.135)
Startup company: According to a definition by Steve Blank startup companies
are considerably young companies that are searching for a business model that
is scalable and repeatable (Blank, 2010). As the business model is still on a
8development phase the market may also change. While the company develops
it may grow rapidly. A startup scene refers to a certain culture that develops
around many companies in one location. One example is the Silicon Valley in
California (Niipola 2012: p.10).
(Gaming) platform: A basic concept of the game industry, which refers to a
specific device or operating system. Examples of gaming platforms are PC,
consoles, such as Sony Playstation 3 and Xbox 360, Apple’s iOS operating
system or Google’s Android operating system. Facebook is also considered a
gaming platform, even though it can be run on PC or on smartphones. (Niipola,
2012: p.64)
Casual Gaming: According to Casual Games Association casual games are
meant for the general public, they are easy to learn and play. They are easily
accessible and can be played on all platforms. (Casual Games Association,
2013)
Demoscene: A subculture phenomenon which took place during late 80’s and
early 90’s. Started from a small group that began to compete with the
development of demos and intros for games. The level of programming, art
design and music of the games was evaluated. These development events
were called “demo partys”. Demo events are still being held, with “Assembly”
being the most famous. (Niipola, 2012)
Digital Distribution: Also know as online distribution. A distribution method were
the content, often being software, is delivered through the internet to the
customer’s device. (Niipola, 2012)
1.5 Structure of the study
This study is formed from six main chapters: Introduction, Overview of the game
industry, Literature review, Case Studies, Evaluation and Conclusion &
Discussion. The first chapter introduces the thesis in general. This is followed
by an overview of the game industry, where the Finnish game development
environment and the mobile game industry is observed more closely. Important
9historical events of the Finnish mobile game industry are addressed in the
history chapter
The third chapter being the literature review includes closer inspection of the
different business models that dominate the game industry in Finland. All
information on these subjects is gathered from web articles, magazine articles,
Industry related reports and books. The part on competition is done on basis of
Michael E. Porter’s work.
In the fourth part, case studies of the two most prominent Finnish mobile game
companies, Rovio and Supercell, are covered. In these case studies some
concrete factors are pointed out, that have contributed to their success.
The fifth chapter includes a Strenghts, Weaknesses, Opportunities and Threats
analysis of the Finnish mobile game industry. Also the competitive environment
of the industry is evaluated.
In the sixth and final chapter a conclusion was made on what are the success
factors driving the Finnish mobile game industry. In the discussion part the need
for further studies and analysis of the industry is discussed.
102 OVERVIEW OF THE GAME INDUSTRY
2.1 Global Game Industry
According to a report from DFC Intelligence, an entertainment and video game
industry research firm, the entire video game market was worth 67 billion
dollars. Their estimates tell that the market will grow to be 82 billion dollars in
2017. Although sales have declined in the console game market, DFC
Intelligence analyst David Cole is confident that the console segment will regain
momentum as Microsoft, Sony and Nintendo will bring out new console systems
within the 2014 and 2015 timeframe. Cole also says that the steadiest growth
will be seen on PC and mobile game sales. (Finance.Yahoo, 2012)
2.2 Finnish Game Industry
Besides the reports done by Neogames and Tekes, information on the Finnish
games industry is quite scarce. Finnish game developing companies often
develop games for multiple platforms, although a significant part of the
companies develop games for mobile platforms. (Tekes, 2013: p.2) The
versatility of the Finnish game industry makes it difficult to approach only the
mobile game industry. For that reason, this chapter will contain information of
the Finnish game industry as a whole.
There are currently more than 150 companies operating in the Finnish games
industry of which most are small and medium sized companies. This is partly
due to the high activity of the Finnish start-up scene. 40% of the companies
working in the industry were established during the past two years. (Tekes,
2013: p.2) Although the amount of companies and turnover have been rising
steadily during the last five years, the same cannot be said about the number of
employees. The economic downturn that began in the end of 2008 impacted the
games industry severely as the number of employees decreased. The following
charts represent turnover and the number of employees working in the Finnish
games industry starting from the year 2007:
11Turnover of the Finnish game
industry
300
250 250 million €
200
165 million €
150
105 million €
100 87 million € 87 million €
78 million €
50
0
2007 2008 2009 2010 2011 2012
Figure 1. The amount of reported turnover in the Finnish game industry since 2007 to
2012. (Tekes, 2013)
The number of employees working in
Finnish Games Industry
2000
1800
1800
1600
1400
1264
1200 1147
1082 1079
1020
1000
800
600
400
200
0
2007 2008 2009 2010 2011 2012
12Figure 2. The number of employees in the Finnish games industry since 2007.
(Neogames, 2012)(Tekes, 2013)
Finnish game developers can be considered born global as the domestic
market is not large enough to reap considerable profit. Most companies aim
their products toward the Northern American market where the demand for
games is remarkably higher mainly due to larger population. Over half of the
industry’s turnover comes from Northern America (approximately 55-60%) and
one third of the turnover comes from the Western European market
(approximately 30-35%). Finnish games have not been effectively entering the
Asian markets to this day. This is mainly because of the high entry barriers that
derive from different legislation, piracy, different business culture, different
cultural background, strong competition from Asian counterparts and different
earning models. (Neogames, 2012: p.10)
2.2.1 History
This chapter contains brief history of the Finnish game industry.
When listing the driving factors behind the success of the Finnish game
industry, the impact of know-how and experience of the lead characters within
the industry is undeniably strong. From where have these designers,
programmers and electronic musicians collated their valuable experience? The
answer is the sub-culture phenomenon called “demoscene”, which ran strong in
Finland during the late 80’s and 90’s. The number of game enthusiasts in
Finland was relatively large compared to the size of population. In addition to
playing games made by others one of their main activities was designing their
own demos and introductions to games.
Petri Järvilehto, current Executive Vice President of Games for Rovio
Entertainment and one of the founding members of Remedy, states in an
interview in Jani Niipola’s book “Pelisukupolvi” that the exceptionally large
foundation of gamers in Finland has been a significant factor to the current state
of the Finnish game industry. Many of these gamers have had the desire to give
13their individual contribution to the industry. The demoscene is something that
cannot be forgotten, it is where it all started. (Niipola, 2012: p.52)
Jaakko Lehtinen, stated in an article published in Aalto University’s website
(2012):
“Computer graphics as a hobby is at a very high level in Finland. During the last
couple of decades, the so-called demoscene, where mainly self-taught
programmers, graphic designers and musicians compete in the creation of
technical and artistic impression, has laid a foundation for the active and
internationally astonishingly successful Finnish games industry.”
The mid 90’s was an important era in a different way. In 1995 an Espoo based
game developing company Remedy was established. The company would be
known for it’s storybased action games. The company’s first successful title
“Death Rally” that was made in 1996 enabled the company to start their second
project which would change the Finnish game industry forever. The game was
Max Payne, a game with an intense story about a New York based policeman.
Max Payne is considered as a model example of a success story within the
Finnish game industry. The game and it’s sequel became blockbusters with 7,5
million copies sold and they got favourable reviews from critics. (Niipola, 2012:
p.16-17)
Here is a timeline including important years for the Finnish game industry
(Niipola, 2012: p.246-250):
1992 – The first Assembly event is held in Finland.
1995 – Remedy and Housemarque are founded.
1999 – Housemarque releases Supreme Snowboarding for PC. The
game sells over 1,5 million titles.
2001 – Remedy releases Max Payne first for PC and later for
Playstation. The game sells over 5 million titles.
2003 – A small mobile game company called Relude is formed. The
company is later to be known as Rovio.
2003 – Nokia engages towards the handheld console and mobile gaming
market with its gaming mobile phone “N-Gage”. Only 3 million units are
sold and it is regarded as an failure.
14 2003 – Mobile game company Sumea is founded. Ilkka Paananen starts
at Sumea.
2003 – Remedy makes a sequel for Max Payne although it has sold the
Intellectual property (IP) of Max Payne earlier.
2003 – Trip Hawkins decides to establish Digital Chocolate. A company
that focuses on developing mobile games. One of their operations
resides in Helsinki.
2004 – Digital Chocolate purchases Sumea. Paananen stays in the
company for years to come.
2004 – Facebook begins its operation. For game developers it becomes
a platform of its own. In July 2012 Facebook has over 955 million users.
2007 – Apple publishes the iPhone. There are speculations that the iOS
(Apple’s operating system) might revolutionize the game industry.
2008 – Apple opens App Store. An application shop that is based on
digital distribution.
2008 – Google opens Android Market. Later to be known as Google
Play.
2009 – Mikael Hed starts as the Chief Executive Officer (CEO) of Rovio.
2009 – Rovio publishes its 52nd title which is Angry Birds. The game is
published for iOS. During the summer of 2012 Rovio announces Angry
Birds to have surpassed a Billion downloads.
2010 – Remedy publishes Alan Wake. The game is chosen by Time
magazine as “the game of the year” with Rovio’s Angry Birds as the
second in their ranking.
2010 – Rovio hires Peter Vesterbacka to take charge of the marketing of
Angry Birds.
2010 – The game company Supercell is founded. In 2011 Supercell
raises 12 million dollars of funding from Accel Partners amongst other
companies.
2010 – Apple launches its tablet iPad in the month of April.
2011 – Rovio announces the results of its fundraising which is 42 million
dollars in all.
15 2011 – Peter Vesterbaka, The Chief Marketing Officer of Rovio, is
chosen amongst Time 100: The most influential people in the world.
2011 – Remedy makes its debut on the mobile platform with a new
version of Death Rally. The game makes over million dollars in nine
months, with the marketing budget being just under 10.000 euros.
2012 – Rovio Announces its revenue of 2011 which is 48 million euros.
2012 – Rovio publishes Angry Birds Space. The game has been
developed in cooperation with NASA of the US government.
2012 – Supercell release Clash of Clans and Hay Day.
2012 – In November 2012 Rovio Entertainment releases its Star Wars
themed Angry Birds.
2012 – In December 2012 Supercell CEO Ilkka Paananen announces in
an interview by a New York Times reporter that their two games are
grossing over $500.000 a day. This makes $350.000 in revenue when
Apple takes it’s 30% cut. (New York Times, 2012)
2.3 Mobile Game Industry
Casual gaming has exponentially grown because of the growing popularity of
smartphones. Mobile devices are expected to overtake PCs and laptops as the
most common device in 2015 at the latest. Especially tablets are expected to be
the standard gaming device of the future. According to the Entertainment
Software Association (ESA), a game industry related association in the United
States, approximately 55% of the American video game players played with
their smartphones or other mobile platforms. Evaluates say that the global
mobile game market is going to reach a yearly revenue of 18 billion dollars by
the year 2016. A third of this revenue is expected to come from games
developed for tablets. This forecast tells of enourmous expectations as the
share of tablet games’ revenue of the whole games market revenue was only
491 million dollars in 2011. (Niipola, 2012: p.132-133)
163 LITERATURE REVIEW
3.1 Business Model
The business model within the game industry has changed radically since the
emergence of effective digital distribution channels. Within the traditional
publisher-driven business model, the publisher has the responsibility of
marketing. Nowadays, more and more game developing companies are
engaging the era of digital distribution business model. Digital distribution
enables the possibility of publishing a game without a publisher. The
responsibility of distribution is appointed to a specific channel. Examples of
such mediums are Steam, a game and software marketplace for PC, or
operating system specific stores such as iOS app store for Apple Inc. and
Google Play for Android devices. (Neogames, 2011: p.11)
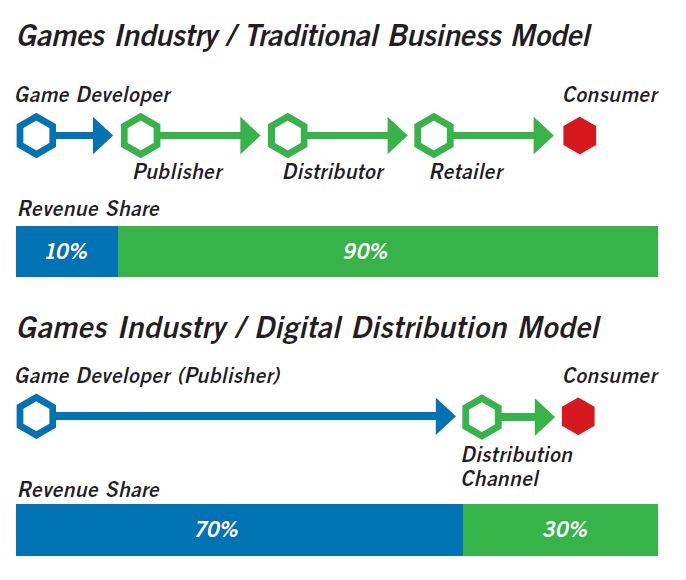
The most significant change in digital distribution business model has been the
change of the share of revenue between the developer and distribution channel.
In the traditional retail value chain model, the share of the revenue that comes
back to the developer is about 8-15% and the rest is distributed between the
publisher, distributor, and retailer. Meanwhile in the digital distribution value
chain model the revenue that a developer receives is approximately 70%, while
the intermediary/distribution channel receives 30% of the received revenue.
(Neogames, 2011: p.11)
17Picture 1. The share of revenue between Traditional Business Model versus Digital
Distribution model. (Neogames, 2011)
Within the traditional business model the publisher finances the development
and production of the product. It has been evaluated that out of 10 games, 7 will
lose money, two are remunerative, and one will make considerable profit.
Because of the high financial risk that the publisher has to take, it often
demands the rights for the intellectual property (IP) that has been created in the
developing process. By doing this, the publisher guarantees that they will have
rights for the product also in the future. (Neogames & Suomen Pelinkehittäjät
Ry. 2010: p. 7)
The console game developing industry has its foundations deep within the
traditional business model, where publishers hold a key position. The making of
a single demo for a console can cost approximately 0.5 – 1.5 million Euros,
these kind of sums often being a luxury that Finnish game developing
companies cannot afford. (Neogames & Suomen Pelinkehittäjät Ry. 2010: p.7)
18Even though the democratic marketplaces make it possible to publish your
games independently, it may prove burdensome. Turning down a publisher
means that the developing company is also turning down the financial
resources from the publisher and an effective mean of marketing. The
developing company then has the full responsibility of marketing. So using a
publisher even within the digital distribution model is not unheard of.
(Neogames. 2011: p.11) The Chief Operating Officer, Ed Rumley of a game
publishing company Chillingo, wants to remind individual developers that
despite the easiness of uploading a game on an app store, getting the wanted
result may prove harder a task. Publishing companies such as Chillingo do
more than just upload the game to an app store, they help development
companies to find substantial audience to their games and prepare these
games for the market. Chillingo has published success stories such as “Angry
Birds” and “Cut The Rope” which back their opinions. Ed Rumley states the
following in an article published in gamesindustry.biz web-article
(Gamesindustry.biz, 2012):
"Half of our role is getting a game ready for market. By that I mean making sure
the balance is there, making sure the game is fun, and making sure the
monetization is correctly implemented. If you don't get that right, you're not going
to have success acquiring consumers in the first place. The market is far more
competitive today than it was even two or three years ago. If you look at the
fragmentation in the markets, it's even greater. That's where I think Chillingo
really comes out because we help navigate that for indie developers."
3.1.1 New Earning models
Monetization is one of the most important factors when developing a mobile
game. There are a multitude of ways to earn within the mobile game sector.
According to Neogames’ report the new earning models used for games are as
follows (Neogames, 2011: p.12):
The traditional way of earning from app’s is by selling the app with a
single payment. this method is also known as pay per download. The
price often being as low as 0,79€ a game.
Freemium or the “free to play” model (often referred to informally as F2P)
is a trend which is currently overtaking the market. In this model the
19application itself is free and the earnings are gathered from in-app
purchases or advertising. (Armstrong, Kotler, Harker & Brennan, 2012: p.
481)
o In-app purchases are referred to as microtransactions. These
microtransactions come from virtual item sales within the game.
For example in Supercell’s top grossing “Clash of Clans” real
currency is used to buy in-game currency, which is then used to
speed up the player’s game progress and buy virtual goods. (New
York Times, 2012)
o In some cases, the game may at first be free, but further content
or new episodes are only available for a payment. (Niipola, 2011:
p.135)
o Monetization by advertising is done by selling advertisement
space within the game. The game itself is free and revenue
collates from advertisements. Peter Vesterbacka, the Chief
Marketing Officer (CMO) of Rovio, refers to this model as free-
with-ads (Neogames, 2011: p.12).
Peter Vesterbacka states in an interview that there are multiple business
models that work in the mobile game industry. At Rovio they always try to see
which model is most suitable for the system at stake. For example, they noticed
rather quickly at Rovio that Android users are not that willing to pay for content.
That is why the main model for Android is free-with-ads. In Rovio’s case this
worked especially well as they were able to build a massive base of installed
games which attracted companies to advertise. Vesterbacka does not believe
that there is one model that fits one game. This is why Rovio offers their games
with all of these models. (Niipola, 2011: p.142-143)
Single payment mobile games have similar characteristics as “boxed games”
that are represented in the beginning of table 1. According to a Tekes based
programme’s final report, the design emphasis on these single payment games
is on the attractiveness of the game. The first impression and attractiveness of
the game should lead to the consumer acquiring the game. After purchasing the
20game the consumer then has access to all or most of the game’s content.
(ARMS project Final Report, 2012: p. 15)
In mobile games “game as continuous service” isn’t used as often as the “free-
to-play” game type. Virality and word of mouth often cause free-to-play and
social games to spread quickly between consumers. Incentivising game
mechanics and steadily rewarding the player within the game improves
retention rates. (ARMS project Final Report, 2012) (Flurry analytics, 2013)
Table 1. Business models and the shift in customer relationship building
emphasis. (ARMS project Final Report, 2012)
One of the main issues that mobile game developers face after the launch of a
title is user retention. Based on the reports done by Flurry analytics retention
and the time spent using an application correlate to higher revenues. The more
usage a game has the more opportunities to sell microtransactions and
advertise present itself. (Flurry analytics, 2013)
3.1.2 Blue Ocean Strategy
Instead of outperforming rivals, a company can target market space that is
untainted by competition. Blue Oceans represent industries or parts of an
industry that do not yet exist. Within the blue oceans demand is created rather
than fought over as in the existing red ocean industries. When a blue ocean
21strategy is implemented succesfully it opens up an opportunity to growth that is
both quick and profitable. (Kim & Mauborgne, 2008: p.2)
Blue oceans can be created in two ways. The first one is by coming up with an
entirely new industry or a business idea. This is what eBay did when it started
the online auction business. The second one is by finding new dimensions in an
existing red ocean industry. W. Chan Kim and Renée Mauborgne call this as
”altering the boundaries of an existing industry”. (Kim & Mauborgne, 2008: p.2)
Kotler et. al. introduce an example from the game console industry. Nintendo
entered the console market in late 2006 with an alternative console called
Nintendo Wii. Wii offered a different console experince than Sony’s PS3 or
Microsoft’s Xbox360 were offering at the time. Rather than competing with
hardware performance as Sony and Microsoft were doing, Nintendo decided to
focus on a new way of gaming. Wii introduced a wireless controller that worked
with motion. With a diverse selection of games where one’s body was used as
the controller Wii appealed to a vast audience ranging from small children to
over 40-year-old women. (Kotler, Keller, Brady, Goodman & Hansen, 2009:
p.307). Nintendo Wii has sold over 97 million (as of September 30. 2012) units
since it’s release in 2006 (Nintendo, 2012). I has outsold both Sony’s PS3 and
Microsoft’s Xbox360 by approximately 30 million units (Sony Computer
Entertainment Inc., 2012)(Microsoft, 2012).
3.2 Competition: Porter’s five forces framework
In order to truly understand the success of Finnish game developing companies
during the last few years, we have to make a brief industry analysis of the game
development industry. The analysis is done in terms of the five forces
framework introduced by Michael E. Porter (1979). Often only the established
industry rivals are considered as the main competitor for profits and market
share. In reality there are four other competitive forces as well: Customers,
suppliers, potential entrants and substitute products. After going through these
factors, one can better understand the competition and profitability within the
mobile game development industry.
22The value chain of the game developing industry has undergone a major
change during the last decade powered by the emergence of digital distribution.
The gaming industry is human capital intense, which makes this an ideal
situation for Finland. The gaming companies here are technology oriented, and
the know-how of the workforce is of high quality. The largest problem that the
game developing companies in Finland have to face is the lack of educated
personnel. With the rate the finnish game industry is growing, the output of
domestic graduated workforce is not enough.
An overview of competition and strategy is given in a literature review done on
the basis Michael E. Porter’s work. In 2001, Porter introduced a revised version
of the five forces framework that takes into account the impact of internet on the
competitive forces. Framework of five competitive forces is applied to the
Finnish mobile game developing industry In chapter 5.2.
3.2.1 The five competitive forces that shape strategy
Understanding the competitive forces, and their underlying causes, will prove as
a strategic asset and help predict future competition and profitability. According
to Porter, a company should defend against the competitive forces and shape
them into their favor.
“The strongest competitive force or forces determine the profitability of an
industry and become the most important to strategy formulation. The most salient
force, however, is not always obvious” (Porter, 2008: p.26)
3.2.2 Threat of entry
“New entrants to an industry bring new capacity and a desire to gain market
share that puts pressure on prices, costs, and the rate of investment necessary
to compete. Particularly when new entrants are diversifying from other markets,
they can leverage existing capabilities and cash flows to shake up competition.”
(Porter, 2008: p.26)
The incumbents must react to this threat of new competitors entering the market
by holding down their prices or boosting investments in order to deter them.
23This means that the threat of entry puts a cap on the profit potential of an
industry. Potential entrants are held back by entry barriers. The heights of these
barriers to entry are determined by the willingness and preparedness of the
incumbents to react to newcomers (Porter 2008: p. 26).
“If entry barriers are low and newcomers expect little retaliation from the
entrenched competitors, the threat of entry is high and industry profitability is
moderated. It is the threat of entry, not whether entry actually occurs, that holds
down profitability.” (Porter, 2008: p.26)
There are seven major sources for entry barriers.
1. Supply side economies of scale – “These economies arise when
firms that produce at larger volumes enjoy lower costs per unit
because they can spread fixed costs over more units, employ
more efficient technology, or command better terms from
suppliers.” (Porter, 2008: p.26) These supply side economies of
scale put the entrant in a position where they have to whether
come into the industry with a large scale in order to stagger the
entrenched competitors or enter into a price war. But as the
incumbents already have a foothold in the market, the
newcomers would most probably have to accept a cost
disadvantage.
2. Demand side benefits of scale – “These benefits also known as
network effects, arise in industries where a buyer’s willingness
to pay for a company’s product increases with the number of
other buyers who also patronize the company.” (Porter, 2008:
p.27). Some customers may value being part of a greater
network of consumers. This network effect is emphasized if the
product or service relies on the large number of buyers or users.
“For instance online auction participants are attracted to eBay
because it offers the most potential trading partners.” (Porter,
2008: p.27)
3. Customer switching costs – “Switching costs are fixed cost that
the buyers face when they change suppliers. Such costs may
24arise because a buyer who switches vendors must, for example,
alter product specifications, retrain employees to use a new
product, or modify processes or information systems. ” (Porter,
2008: p.27)
4. Capital Requirements – This occurs if companies need to invest
large financial resources in order to compete. Capital
requirements work as a barrier rather well if the capital is
needed for unrecoverable and therefore harder to finance,
expenditures. Up-front advertisement or research and
development are few examples of this kind of expenditures.
Porter emphasizes the importance of capital requirements as a
deterrent of entry. He states that if the industry returns are
profitable and are expected to remain so, and if capital markets
are efficient, investors are going to provide entrants with the
funds they need. So financing is found in even the most
expensive industries if the value for money is good or if the
resale value for the bought products is high. (Porter 2008: p. 27)
5. Incumbency advantages independent of size – Incumbents may
have cost or quality advantages that are unavailable for new
entrants. “These advantages can stem from such sources as
proprietary technology, preferential access to the best raw
material sources, pre-emption of the most favorable geographic
locations, established brand identities, or cumulative experience
that has allowed incumbents to learn how to produce more
efficiently.” (Porter, 2008: p.27)
6. Unequal access to distribution channels – In order to have its
product or service sold the new entrant has to secure a
distribution channel for it. Finding a suitable channel isn’t always
easy as it may require displacing the products of incumbents.
Displacing entrenched competitors may need price breaks,
promotions, intense selling efforts, or some other means.
Entering an industry where distribution channels are scarce, or
25they are already tied up by competitors will prove quite tough.
Sometimes the unequal access to distribution channels proves
so hard for companies that they decide to bypass old
distribution channels and create one of their own. (Porter 2008:
p. 28)
7. Restrictive government policy – “Government policy can hinder
or aid new entry directly, as well as amplify (or nullify) the other
entry barriers. Government directly limits or even forecloses
entry into industry through, for instance, licensing requirements
and restrictions on foreign investment.” (Porter, 2008: p.28)
Government can also lower entry barriers directly by giving
subsidies to specific companies or indirectly by funding research
for all companies within an industry.
Companies that already have a foothold in the industry must be aware of all the
ways of the newcomers to circumvent these apparent barriers. Strategists have
to be prepared to counter start-ups, foreign firms, or companies from other
industries. The potential entrants may reconsider their entry to an industry if the
retaliation of the incumbents is expected to be vigorous. The profit potential of
the industry falls considerably if the companies are willing to a protracted
reaction to newcomers. Public statements are often used by incumbents to
show how committed they are in defending their market share against the
potential newcomers. (Porter 2008: p. 29)
There are few ways to predict retaliation in an industry. All of these work as a
deterrent for the potential entrants:
• If the incumbents have a history of vigorously responding
to new entrants, they are likely to do it again.
• The incumbents might have substantial resources to fight
off new competitors trying to win market share. These
resources may be either monetary, available productive
capacity, or clout with distribution channels and
customers.
26• Incumbents that are ready to defend their market share
at all costs are likely to cut prices, if a new company
enters the market. The industry also might have high
fixed costs, which create a strong motivation to drop
prices to fill excess capacity.
• If industry growth is slow, the only way of getting market
share is by taking it from the incumbents. (Porter 2008: p.
29)
3.2.3 The Power of suppliers
The influence of suppliers to profitability in an industry is undeniable. The more
powerful these suppliers are the more they can capture value for themselves.
They can do this either by charging higher prices, limiting quality or services, or
shifting costs to industry participants. The bargaining power of the suppliers is
especially high if there are only few suppliers and many buyers. This means
that the suppliers are more concentrated than the industry their selling to. The
lack of substitute products or services can lead to supplier power becoming
rather high. This works both ways though. If there are multiple options for the
buyer to choose from, the bargaining power of the suppliers is decreased.
(Porter 2008: p. 29)
The suppliers take advantage of the knowledge of the buyer. If the knowledge
of the buyer is low in the market the suppliers are able to sell their products
even if there would be a better substitute for their product. Suppliers will
definitely try to squeeze out maximum profits from an industry, especially if they
are serving multiple industries. In this case they are not fully dependant on the
concerning industry and are willing to take more risks for maximum profits. But if
the supplier is highly dependant on the revenue of a certain industry they will try
to protect it by reasonable pricing and even help the industry thrive by
supporting it in activities such as R&D and lobbying. (Porter 2008: p. 29-30)
Industry participants will face switching costs when changing suppliers.
Switching costs are higher when the industry participants are more committed
27to the product, or either there is a difficult learning process to use the suppliers
product. In some cases the companies have their production lines adjacent to
their suppliers manufacturing facilities, in which case changing the supplier
would be very costly or even impossible. The supplier can also be irreplaceable
in terms of what it supplies to the industry participant. For these reasons some
unions have considerable power over some companies, as there is no
substitute for qualified workforce at some industries. For example the power of
pilots’ unions over airline companies is undeniable. (Porter 2008: p. 30)
If the profitability of the industry participants is relatively much higher than of the
suppliers, there is a strong possibility for the suppliers to engage and enter the
industry theirselves. (Porter 2008: p. 30 )
3.2.4 The Power of buyers
Companies have to withstand heavy pressure from both ends of the supply
chain. Just as powerful suppliers, powerful buyers have their means of
capturing more value in the market. By demanding better quality from products
or services, they drive up the costs. Price sensitive customers force down
prices, and so diminish the profitability of an industry. Just as suppliers the
buyers can be divided into distinctive groups which differ in bargaining power.
(Porter 2008: p. 30)
If the buyer group is either concentrated or buys in high volume they are
powerful in sense of bargaining leverage. The power of these large volume
buyers are emphasized in industries where fixed costs are high. Industries such
as airlines, auto manufacturering and drilling operations have high fixed costs.
Companies working in industries characterized by high fixed cost tend to have
pressure to keep capacity filled at all times. (Porter 1998: p. 29)
The consumer will play industry participants against one another if the products
being purchased are standard or undifferentiated. In these kind of industries the
customer can always be sure it can find alternative products from different
suppliers. (Porter 1998: p. 29-30)
28Customers are less likely to be price sensitive if the product represents only a
fraction of their costs, whereas if the product is expensive and part of a bigger
component the customer will be most likely to purchase selectively and seek for
favourable prices. Low earning consumers tend to lower their purchasing costs,
and high earning customers are less price sensitive, if the purchase does not
account for a large fraction of their overall costs. (Porter 1998: p. 30)
Buyers are more price sensitive if the industry’s product does not play an
important part of the buyer’s final product or service. In industries where the
quality of the buyers product or service is immensely affected by the seller’s
product the buyers are less likely to be price sensitive. Malfuctions or defects in
low quality parts may lead to large financial losses in industries where the whole
output of the company is affected by one change in the production line. (Porter
2008: p. 30)
Quality over low price is often considered when the bought product is expected
to pay itself over and make profit by improving performance, or by lowering
other costs. In situations where the product is not expected to save the
consumer more money, they are more likely to be focused on the price.
Services such as tax accounting and investment banking are often chosen by
quality, as errors in their field may prove costly and embarrassing for the
company. In large industry businesses, like logging of oil wells, accuracy and
good preparation can save a fine amount of money for the company. (Porter
1998: p. 30)
The customers can pose a threat of integrating backward to the industry and
manufacture the product or service theirselves, if the vendors prove to be too
profitable. Companies in beverage and food industry have long used their buyer
leverage against packaging companies, by threathening to enter the packaging
business by manufacturing their own bottles or packages. Some companies
have also implemented this by adding packaging to their manufacturing
responsibilities. (Porter 2008: p. 30)
29Most of these different sources of buyer power can be applied to both industrial
and commercial customers. Consumers buying preferences are affected highly
if the products are undifferentiated, expensive relative to their income, or when
the focus is not on the quality of the product. In these cases consumers tend to
be more price sensitive. The main difference between consumers and business-
to-business customers is that the customers’ needs are more intangible and
harder to quantify. (Porter 2008: p. 30-31)
Intermediate customers, meaning retailers, can use the influence they have on
consumers’ purchasing decisions as a significant bargaining power over
manufacturers. The retailing of some goods are characterized by this strong
influence on end users. This can be especially seen as the heavy use of
associative advertisement in the retail of jewelry, appliances, sporting goods,
consumer audio components, and of other goods. (Porter 1998: p. 31)
3.2.5 The threath of substitutes
Substitutes limit industry’s profitability and potential of an industry as they place
a ceiling for prices. A way of defending against substitutes is upgrading the
quality of the product or differentiating it somehow (Porter 1998: p. 32). By
having a similar or even the same function substitutes try to replace the
industry’s product. Plastic is a substitute for aluminium. Tea is a substitute for
coffee. The threat of substitutes exists sometimes as downstream or indirect.
Indirect competitors’ product may replace the buyer industry’s product. Software
that has been exclusively sold to travel agents is threatened as airline and travel
websites substitute for travel agents. (Porter 2008: p. 31)
Often substitutes are overlooked as they prove to be nothing like the industry’s
product. This is often determined by the purpose the product is bought for. For
example when buying a gift for father’s day necktie can work as a substitute for
power tools. Deciding not to buy any product, buying the product as used, or
making the product in-house is a substitute for the industry’s product. (Porter
2008: p. 31)
30The cap put on a industry’s profit potential by substitutes isn’t there only at
normal times. When an industry is booming substitutes reduce the potential
amount of profit an industry’s product can reap from a market. For example
mobile phones have replaced traditional wired telephones lines in many
households. This has capped the profit potential of wired telephone line service
providers. (Porter 2008: p. 31)
There are some main factors that determine whether the threat of substitutes is
high in an industry. If there is a product on a market that serves the same
purpose with a better price to performance ratio the customer is likely to go for
that product. This means that the relative value of the substitute is good, and so
it limits the profitability of the industry. (Porter 2008: p. 31) For example the
improved internet broadband everywhere has enabled the efficient streaming of
music, movies and series, which then has decreased the profit potential of
stores selling electronic entertainment, and video rental outlets. This can be
seen as the emergence of on-demand Internet streaming media such as Spotify
and Netflix.
The lower the switching cost is for the buyer, the easier it is for him/her to switch
to a substitute product. Medicinal product industry is full of proprietary and
branded products that are expensive relative to generic ones. Once the patent
for a drug has expired, generic drugs often enter the market. The switch
towards these generic drugs contains usually minimal costs for the buyer so a
shift to cheap generic drugs is usually fast. (Porter 2008: p. 31)
Strategists should always be alert for potential substitutes, that may emerge
when industrial changes happen. Some products may prove to be worthy
substitutes after improvement. As different plastic materials improve they begin
to threaten steel as a production material in industries such as automobile
component manufacturing. This way changes in businesses that may seem
unrelated might have severe consequences in industry profitability. The threat
of substitution may also shift in favour of an industry, improving it’s profit and
growth potential. (Porter 2008: p. 31-32)
313.2.6 Rivalry among existing competitors
There are different tactics in positioning one’s company against existing
competitors. A company can jockey for position by price discounting,
introducing new products, advertising campaigns, and improving the overall
service level. If there are many companies fighting for market share, the level of
rivalry is high and therefore industry profitability is limited. But the degree to
which industry profitability potential is limited to, is determined by the intensity
and basis of the rivalry. (Porter 2008: p. 32)
The intensity of rivalry is high in situations when there are a lot of competitors
on the market, or the competitors are equal in size and power. The rate of
industrial growth affects intensity as well. Industries with slow growth rate are
often characterized by intense fighting for market share. When product or
services lack of differentiation or switching costs lead to the company being
more prone to raids done by competitors to acquire one’s customers. (Porter
2008: p. 32)
Exit barriers are a influencing factor to the intensity of rivalry. If the management
of a company is highly devoted to a particular business or if very specialized
assets are used in doing business, companies may keep competing even
though they may receive low or even negative returns on investment. By
clinging on the market these unhealthy competitors hinder the profitability of the
healthy ones. Government intervention and help is possible if an entire industry
is suffering from overcapacity. (Porter 1998: p. 33)
When the product is either perishable or when fixed costs are high companies
are often tempted to cut prices. This is common in industries dealing with basic
materials. Businesses want to keep capacity filled even when demand slackens.
(Porter 1998: p. 33)
Companies enter a zero-sum game if they all compete each other within the
same dimensions of rivalry. Competing on the same dimensions means trying
to serve customers and consumers by aiming to meet the same needs and
using same attributes as their competition. This can be avoided if companies
32segment and target their low-price offerings to different customers. (Porter
2008: p. 33)
3.2.7 Critique of Porter’s five forces –framework
Porter’s ideas on strategic management and competition have received criticism
because of the business context they were developed in. Porter’s theories were
introduced in the eighties and thus base on the economic situation that
prevailed at the time. The market structure at the time was considered to be
relatively stable and cyclical growth characterized the global economy. The
economic conditions have changed from that time and nowadays the internet
influences strongly to almost every industry. The five forces framework does not
completely take into account the new business models and the market
dynamics that have emerged through the rise of the internet. (Recklies, 2001)
Larry Downes states in his article “Beyond Porter” (1998), that Porter’s five
forces framework was adequate during the period it was released and it does
not work in the modern marketplace without the introduction of new forces.
Downes then introduced three new forces that are Digitalization, Globalization
and Deregulation. According to Downes the five forces framework as itself is too
static to analyse todays dynamic marketplace.
Digitalization: As the power of information technology grows every
industry participant and consumer has access to more information than
they used to have. Technological development leads to new business
models being introduced. The easily accessed information results in
vastly changed markets. Competitors may come from outside industry
borders and are often unfamiliar and unpredictable. As an example
Downes gives electronic shopping malls that are operated by credit card
organizations or telecom companies. (Downes, 1998)
Globalization: The improvement in communication and internet access
has made the modern marketplace global in a sense that nearly all
companies operate in a global level. For the same reason consumers are
able to shop around and compare prices globally. It is not anymore
33You can also read