Qualcomm Incorporated - Archetypal Graham/ Buffett Value Check for QCOM - Rutgers Business School
←
→
Page content transcription
If your browser does not render page correctly, please read the page content below
Qualcomm Incorporated
    Qualcomm           QCOM) U.S. Technology Communication
          Equipment Price: $52.78 Recommendation:
    1/14/18 Target: $76.03 Discount [Price +

Archetypal Graham/ Buffett Value Check for QCOM
QCOM is the largest communication equipment company in the world with 3,000+
patents and a pioneer of 3G/4G/5G technologies. The company’s stock pays a dividend
(4.31% yield) and is currently selling at an astonishingly cheap multiple of 10.8X (one
year forward P/E). Street’s overreaction over multiple lawsuits filed by its biggest
customer Apple and over some antitrust litigation has led to the recent decline in the
price of QCOM shares. However, QCOM’s brand, product pipeline, market position and
recent acquisition of NXP semiconductors equate to an unparalleled moat for the
company. The firm’s balance sheet, with every information already sync’d in, is still very
strong even in the midst of all the controversies over its Pandora’s box full of lawsuit’s.
QCOM’s share value not only will see the light of the day but also will go only up from
here with an anticipated explosive growth rate in smartphones and Internet-of-things
(IoT) of CAGR 20% and 13.2% respectively.
Growth Catalysts to “POWER-Up” Shares in 2017
♦    “Hyper-trending” & “glaring” Valuation prospects: QCOM is cheaper than it has
     ever been on a Forward P/E basis of 10.8X Vs 10YR Average of 31X. It is cheaper
     than all of its major rivals. The stock’s forward P/E is also well below the industry
     average (26.9x for Semiconductor). It is currently selling at a discount of 9.4% per
     the DCF valuation and It is not possible to find a value like this in the technology
     sector that will also afford investors this much growth potential yet providing it
     with the margin of safety.
♦    Competitive Advantage - “Only Game in town”: QCOM benefits from their high
     revenue (relative to competitors), allowing them to out-spend every peer on R&D
     and once QCOM develops a new technology, they take action to develop multiple
     variances of this technology and provide additional functionality which allows their
     chipsets to be integrated with multiple types of technology. QCOM has 65-75% of
     market share in the smartphone chipset industry. They are protected by high
     switching costs, as developers creating newer models prefer to work with system
     architectures with which they are familiar and as discussed above, its technology
     integrates with many additional communications components; technologies which
     would have to be developed on a product-by-product basis depending on which
     components are used.
♦    Margin of Safety - “Murphy’s Law turned-up”: QCOM is a legend and a pioneer in                          10YR QCOM
     the technology space of semiconductor-communication equipment space with                                Stock
     $77.7B+ in market cap. It pays a dividend and also has an enormous amount of cash                       Performance
     ($6B) and cash equivalents ($23B) on its balance sheet. The company’s
     fundamentals are superb (excellent track record, competent management, and the
     firm were debt free up until its decision to acquire NXP. QCOM is known for its
     dividend increment plan and for beating the street’s estimates on a regular basis.
     These attributes provide investors with plenty of safety, while also affording management the latitude necessary to maximize shareholder
     value.
♦    Recommendation - Field Research Confirms “BUY”: QCOM is rated as a strong buy by over 80% of Analysts covering for QCOM. Though
     the firm’s growth rate will take a hit in short term because of pending litigations and because of margins decline due to new players coming
     to take market share from QCOM, such as Intel. However, for Value Investors who buy the stock now will be awarded a premium on future
     prospects of the company deriving from QCOM’s vision for IoT and automotive space. A fair multiple on the stock based on a blended
     relative value, comparative value, PEG and DCF valuation is 18.95x one-year forward earnings, which equates to a dollar price of $76.03.
     Expected return on QCOM based on this forecast is 48.31% (including dividend yield).

                     BUSINESS DESCRIPTION: “Qualcomm’s Business Overview,” Thinking Forward”
     QUALCOMM incorporated on August 15, 1991, is engaged in the development and commercialization of a digital communication technology
     called code division multiple access (CDMA). The Company is engaged in the development and commercialization of the orthogonal
     frequency division multiple access (OFDMA) family of technologies, including long-term evolution (LTE), which is an Orthogonal Frequency
     Division Multiplexing (OFDM)-based standard that uses OFDMA and single-carrier Frequency Division Multiple Access (FDMA), for cellular
     wireless communication applications. The Company's segments include QCT (Qualcomm CDMA Technologies), QTL (Qualcomm Technology
     Licensing) and QSI (Qualcomm Strategic Initiatives). The Company also develops and commercializes a range of other technologies used in
     handsets and tablets that contribute to end user demand, such as certain audio and video codecs, the wireless local area networks (WLAN)
     802.11 functionality and volatile and non-volatile memory controllers. Other technologies used by wireless devices that it has developed
     include operating systems, user interfaces, graphics and camera processing functionality, integrated circuit packaging techniques, sensors
     and sensor fusion algorithms and application processor architectures.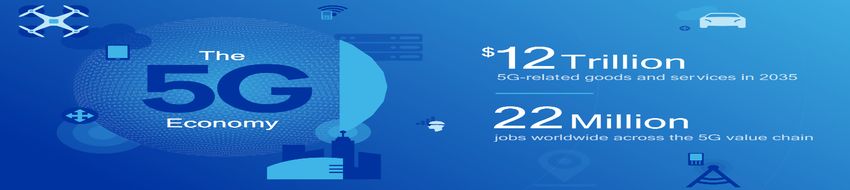
2

                               DISSECTING QUALCOMM’s BUSINESS: “Valuation potential”
    The Company's products principally consist of integrated circuits (chips or chipsets) and system software used in mobile devices and in
    wireless networks. The Company also sells other products and services, which include integrated circuits for use in wired devices, broadband
    gateway equipment, desktop computers and streaming media players; software products and content and push-to-talk enablement
    services for wireless operators, and products designed for the implementation of small cells. Please see the Appendix for a list of references.

    Negative Headlines in the Past (Loss of iPhone 7, NDRC Anti-Monopoly Ruling, Apple Dispute, Blackberry ruling) Present a Strong Buying
    Opportunity with share price close to its 52- week Low.

    ♦    As Figure 1 demonstrates, QCOM has dropped 27.3% in the past 3-year period to its current price of $52.78, while the S&P 500 has
         returned 13.60% in the same time span.

    ♦    QCOM rallied in July 2016 after the market reacted positively to its acquisition decision of NXP, but a number of headline risks have
         pushed the stock to such a low level that it presents a strong buying opportunity.

    ♦    In Q2 2015, the China National Development Reform Commission (NDRC) fined QCOM $975mm for violating China’s Anti-Monopoly
         Law and stipulated that QCOM charge running royalty rates of 5% for 3G CDMA1 or WCDMA devices and 3.5% for 4G devices which
         led to market concerns about royalty rates moving forward, but QTL segment actually beat expectations in Q1 2016 due to strong
         3G/4G device volumes and strong ASPs

    ♦    In Q1 2016, QCOM deferred $100mm in revenue because Korean smartphone maker LG took QCOM to arbitration over previous
         royalty overpayments and future royalty rates. While QCOM President Derek Aberle said on a conference call, “I believe LG’s claims
         are without merit,” QCOM’s stock dropped 8.3% the day after the news broke. I think that this was an overreaction – however, I
         assume that QCOM never recovers the lost $100mm from LG, still substantial upside potential exists.

    ♦    Apple’s launch of the iPhone 7 in Fall 2016 has seen Intel take share from Qualcomm. If Qualcomm loses 40% share, JP Morgan predicts
         $1.7bn in lost revenue in 2017. I model in this $1.7bn loss in Core Mobile revenues in 2017, but EPS in 2017 still grows yoy due to lower
         restructuring charges for the Strategic Realignment Plan in addition to $815mm loss to blackberry that pushed down EPS. I believe
         share loss to Intel could actually be a net positive in the long-run as it pushes QCOM to diversify away from Core Mobile and take
         opportunities in Automotive and IoT space, which is evidenced from its recent Acquisition of NXP.

    ♦    In Q1 2017, QCOM reported quarterly revenue and profit that beat analysts' estimates, however there was much uncertainties over
         apple litigation of close to $1billion with respect to QCOM’s ties with its biggest customer, Apple.

                                  Long Equity Report- Applied Portfolio Management | Analyst: Kashif Anwer
3
      ♦    In Q2 2017, QCOM reported quarterly revenue and profit that beat analysts' estimates back to back for 2 quarters, helping ease
           concerns surrounding the company's dispute with Apple Inc. In addition , the most important information that QCOM presented during
           its fiscal 2017 Q2 earnings conference call that the acquisition of NXP Semiconductors had passed the HSR review process.

    Business Segments performance:
    Qualcomm operate principally through two segments that contribute towards its revenue stream as displayed below.

    Licensing i.e. Qualcomm Technology Licensing (QTL): QCOM’s licensing arm, which licenses their intellectual property to nearly every
    smartphone manufacturer. QTL’s patent portfolio includes many “mission critical” solutions which are required for smartphones to meet
    international 3G / 4G / LTE standards, so they earn licensing revenue from effectively every smartphone that is sold.

    QCOM receives approximately 3% of each device’s sales price. These licensing revenues are a function of both total smartphones sold and
    the device price; smartphone purchases are expected to increase at over 20% per annum through 2018, however, much of this growth will
    come from emerging markets, which have lower device prices. QCOM’s management believes they will continue net gains in licensing
    revenue, as the increase in global device sales will continue to outweigh decreases in price. Qualcomm’s replacement value is less than 50%
    of their earnings power value, implying they have a substantial competitive advantage too.

    QTL is the “crown jewel” which drives the significant value for the firm up until now. Licensing revenue is stable and growing. An 18.5% CAGR
    over the prior 15 years. Grown every year, with the exception of 2009. During the worst economic recession in modern history, revenue
    declined by under 0.5% Over the prior 15 years, EBT margins have remained remarkably consistent at an average of 88%. Even during the
    great recession, profit margins for this segment dropped by only 1.5%, rebounding to average levels within two years

    Equipment and services i.e. Qualcomm CDMA Technologies (QCL): A ‘true’ semiconductor firm, largely comparable to other large fabless
    semiconductor manufacturers. They manufacture integrated circuits and chipsets with principal applications in smartphones, in which they
    have an implied market share of ~70%. QCOM receives approximately $20 per chip that they sell.

    The often regarded “Ugly Sister” which provides some value to the firm, but principally exists to drive licensing revenue: Much like “Best Buy”,
    whose retail sales drive their true profit engine (warranties), QCT’s R&D activities create the opportunity for QLT to exist. However, as a
    standalone entity, QCT’s profile is less than ideal. Prior to FY16, QCT had grown nearly every year, at a 21.4% CAGR However, margins for this
    segment have steadily declined over that period. Overall, EBT has grown, as the rate of growth exceeded the decline in margins. However,
    due to the loss of major customer share (Apple since iPhone 7) and mid-term headwinds in the Chipset business (OEMs pushing back release
    of new products), management has reduced guidance for this segment. They are now projecting a 6% YoY revenue decline and a decline in
    EBT margins to 15.5% - The First YoY decline since 2009, and the lowest EBT margin of all time.

                                                                 Revenue by Segments( in millions)
     20000

     10000

           0
            9/1/06      9/1/07       9/1/08       9/1/09        9/1/10     9/1/11       9/1/12         9/1/13    9/1/14       9/1/15       9/1/16

                                                           Equipment and services          Licensing

    Synergies across QCT and QLT Segments:

      ♦    Development: QCT, which develops new technology through R&D activities, concurrently patenting this intellectual property, which
            QLT then licenses out to customers.
      ♦    Integration: QCOM owns nearly the entire smartphone chipset platform, allowing them to integrate innovations into multiple
            variants across market segments.
      ♦    Integration (again): QCOM owns (and has created) the foundational technology for CDMA and 3G / 4G technology. This first- mover
           advantage has blossomed into a broad competitive advantage, and their technology is generally superior, but also significantly more
           versatile – for example, custom (or in-house) chipsets are generally produced with the intention of integrating with specific
           technologies or components – QCOM’s technologies are consistently refreshed to integrate with multiple types of related technology,
           making them more competitive and preferable to customers – with the added benefit of creating additional IP to license.

                                    Long Equity Report- Applied Portfolio Management | Analyst: Kashif Anwer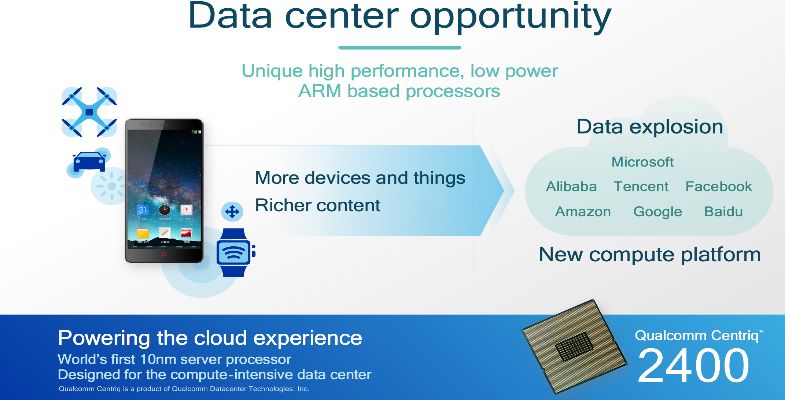
4

      ♦       Collection: Qualcomm’s status as both a chipset and IP vendor provides them with unparalleled leverage to collect licensing fees at a
              lower cost, simply by denying physical delivery of the chipsets until all fees are paid. This allows their licensing segment to operate at
              much higher margins than companies which solely license IP or which provide products un-related to their IP.

                              CORPORATE GOVERNANCE: “Unmatched management performance”
    QCOM's share ownership guidelines for executives during their tenure help to align shareholder and management interest by requiring the
    executives to hold a number of shares while active at the firm. The Company’s stock ownership guidelines for its executive officers are
    determined as a multiple of the executive’s base salary, with the size of the multiple based on the individual’s position. The guideline for the
    Company’s Chief Executive Officer is set at six times annual base salary. The guideline for the Company’s President is set at three times annual
    base salary. The guideline for the other persons who are designated as executive officers for purposes of Section 16 of the Securities Exchange
    Act is set at two times annual base salary. Shareholder interest is further aligned with management through long-term incentives utilizing
    restricted stock, as well as performance grants derived from QCOM's total return vs peers and return on invested capital (ROIC). I found 2016
    ROIC of 12.3%, exceeding QCOM's combined financing costs. The mean of QCOM's ROIC for the past 3 years is 13.1%. I believe QCOM's
    management is acting in the best interest of shareholders through its capital allocation and dividend distribution methods, which has a history
    of ever increasing for shareholders. I believe an important measure of capital allocation for management is the impact of retained earnings
    on QCOM's total market capitalization. Since inception, QCOM has returned cumulative of $55.3 Billion to Stockholders till Dec 25,2016 almost
    two-third of its market cap already. This dividend payout test shows that QCOM's management rationally deploys capital. “I am bullish on
    QCOM, mostly because of its sound management team, which has shown and continues to prove its ability to outperform domestic
    competitors and best position itself for growth within the dynamic and value-added semiconductor industry. Also with QCOM's acquisition
    of NXP at 15x EV/EBITDA implied by the QCOM offer is looking mighty stingy considering Intel is willing to pay over 100x EBITDA for another
    automotive ADAS leader – Mobileye, which shows the effectiveness of the QCOM’s solid management. I was pleased to see the board’s goal
    extended beyond shareholders but also to “employees, customers and the communities in which Qualcomm operates.”

              INDUSTRY OVERVIEW & COMPETITIVE POSITIONING: “Where the Industry derives its Value”

    Porter 5-Forces
             This is an analysis of the attractiveness of the semiconductor industry for QCOM based on Porter’s model of five forces of
    competition. The analysis is mainly based on the U.S. market.

          ♦ Suppliers’ bargaining power: between low and medium
    In terms of large semiconductor companies, QCOM has inherent advantages when choosing suppliers from thousands of them. Diversified
    companies such as QCOM usually use enough number of suppliers to minimize the power of each. However, in the specialized semiconductor
    industry, in which the "fabless manufacturing" model is used by most of the companies. As a result, fabless companies play an important role
    in this specialized sector. Besides, not every sub-contractor has the capability to satisfy the needs of the specialized companies, so suppliers
    are much powerful than those in the large generic semiconductor sector. There are several supplier groups present to the semiconductor
    industry. A few of those groups are; capital equipment makers, suppliers of silicon, chemicals, gases, water, energy, metals and other materials
    are used in manufacturing semiconductor products.

           ♦ Customers’ bargaining power: medium-high
    The buyers of the semiconductor industry are endless. There is a buyer at literally every corner. The switching costs of the buyers in the
    commodity semiconductor market is small as they can purchase from any semiconductor industry player who is representing the lowest cost
    available as long as the technology is compatible. The strong role of the industry giants like Intel and QCOM limits the bargaining power of
    buyers. Computers, smartphones and electric vehicles are definitely the largest piece of demand presented by the buyers in 2016, although
    it is declining due to the rising sales of smart phones and media tablets. Buyers in the semiconductor tend to be very price sensitive as the
    industry is constantly producing products at a lower cost to push the demand of their product.
    Within the buyers, there are several buyer groups that should be mentioned. The computer industry takes of the bulk of buyer demand,
    mobile devices and tabloids, and the medical industry to mention a few. These buyers make purchases from the semiconductor industry to
    continue in daily operations as they are a large part of ongoing business.

          ♦     Threat of substitutes: Low
    The industry has the ability to change in a very short time. This takes away opportunities from substitutes to enter the market segment. It
    would not take the semiconductor industry very long to respond to a successful substitute as they would find a way to produce the product
    themselves. The problem that would be present is the money constraint. It can be done but at a cost. The industry players can find themselves
    spending a lot of money to research and develop new products just to find that their competition beat them to it by a few months. This keeps
    the business environment volatile and competitive.
    .
          ♦     Threat of new entrants: between low and medium
    Traditionally, because of the huge capital expenditures for startup, it is very difficult for those new entries to be successfully invading the
    semiconductor industry. Obviously, it is great news for those large companies who can control the market in their favor by using their
    economies of scale. Besides, the pointed end research and development are other two indispensable barriers for new entries.

                                       Long Equity Report- Applied Portfolio Management | Analyst: Kashif Anwer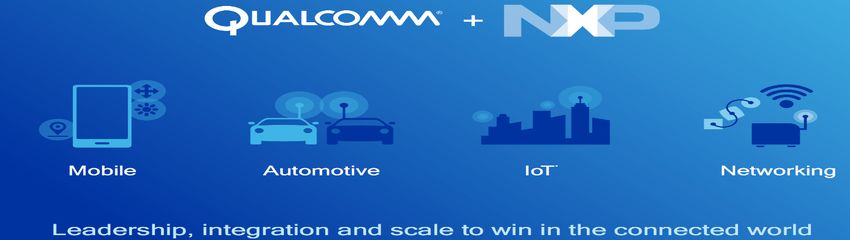
5

    However, recently, with the evolvement of the industry, smaller players could move their attention from manufacturing to research and
    development. Benefit from the subcontracting of manufacturing, smaller companies has more resources and capital to invest into research
    of new technologies. The cooperation of subcontracting eased the financial burden of the smaller players and reduced the barrier of

    semiconductor industry to them. This is extremely significant for those smaller entrepreneurial corporations even for the whole structure of
    the semiconductor industry. Moreover, except the high technology requirement for new entry, another significant barrier to entry the
    semiconductor market is the software compatibility. As a powerful semiconductor player, they are required to not only create physical
    technology, but also need to design convenient and compatible software which could collaborate with their processors well so customers
    could enjoy their product.

    Another formidable barrier to entry is the huge initial investment required to enter the car markets in general. Large amounts of capital are
    required to set up manufacturing facilities and invest in R&D, among other large expenses. This also generates large sunk costs and makes it
    hard to achieve economies of scale for a new entrant. A positive factor for new entrants is that the switching costs of customers are not
    prohibitively high.

         ♦    Competition between established firms: high

    The semiconductor industry is very highly competitive. The firms within this industry compete on a daily basis to produce or manufacture a
    product that is smaller, faster and cheaper. The industry changes rapidly as technology changes rapidly. This keeps it competitive as each
    competitor can seek and opportunity to create something great before the others do. Within this competitive industry there is a constant
    pressure to come up with better products.

    The products of this industry are much undifferentiated as the products they are trying to create are essentially improvements to similar
    products that already exist. The accomplishments of the products change very little. The methods of production is where can see
    differentiation. The players are trying to come up with innovative ways to do the same things only in a smaller, faster, and cheaper manner
    (Investopedia, 2010).. For example, ARM has gained very much competitive advantage with is mobile chip technology, similarly Intel has been
    the number one in the laptop microprocessors because of superior product performance

    The result of an industry that is this competitive is emerging technology that is cutting-edge. The technology is constantly changing into
    something better so for competition it makes it hard to remain at the top. What tends to happen in this type of an industry is that there are
    several industry players with similar size rise as the larger players. This is because no one player can keep excelling with the newest, fastest,
    and cheapest product available.

    The four main products of the semiconductor industry are memory chips, microprocessors, commodity integrated circuit, and complex SOC
    (system on a chip) which is a combination of a system of semiconductors compacted into one small product. The following are the top ten
    ranked semiconductor industry leaders as of 2010: Intel, Samsung Electronics, Toshiba Semiconductors, Texas Instruments, Renesas
    Electronics, Hynix, STMicroelectronics, Micron Technology, Qualcomm, and Elpida Memory (Ford, 2010). The graph below shows how these
    competitors are doing against each other in terms of revenue. It gives a basic understanding how they sit against each other and who are the
    major players.

    Overall, the industry is not very attractive for new entrant to come in this space. On similar note QCOM is expected to benefit from having
    greatest market cap in its industry of communication equipment while having relatively less likelihood of being challenged by the new players.

    SWOT Analysis

         ♦    Strength

    First mover advantage enables the company to sustain market position
    Qualcomm having pioneered the CDMA wireless communications technology has a first mover advantage and is a leading player in the market.
    The company started promoting CDMA technology for wireless communication applications in 1989. The company is a major developer and
    supplier of CDMA-based integrated circuits (ICs) and system software for wireless voice and data communications, multimedia functions and
    global positioning system (GPS) products. Qualcomm's IC products and system software are used in wireless devices, particularly mobile
    phones, laptops, data modules, handheld wireless computers, data cards, and infrastructure equipment. Qualcomm leads the development
    and commercialization of all versions of CDMA technology, and as a result, owns a significant intellectual property, including patents, patent
    applications, and trade secrets, portions of which it licenses to other companies besides implementing them in its own products. In the
    wireless communications industry, a company generally seeking to develop, manufacture and sell products that use CDMA technology would
    require a patent license from Qualcomm. CDMA platform is one of the main technologies for digital wireless communications networks. First
    mover advantage in one of the most prominent wireless technologies enables the company to sustain the market position.

    Strong focus on research and development (R&D)
    Qualcomm has robust R&D capabilities. The company has R&D centers in various locations throughout the world. In addition, Qualcomm has
    significant engineering resources, including engineers with substantial expertise in CDMA, OFDMA and a broad range of other technologies.

                                     Long Equity Report- Applied Portfolio Management | Analyst: Kashif Anwer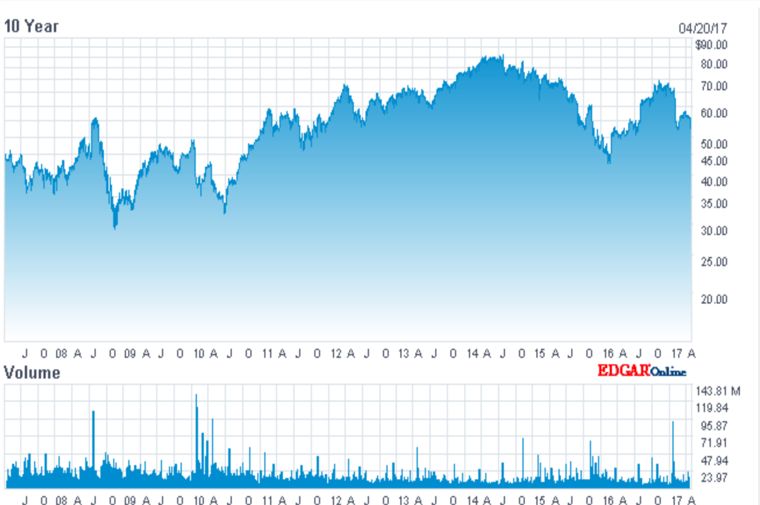
6
    The company's R&D focuses on innovation in voice and data communication technologies and application processor technology, among
    others. The company incurred R&D expenditures of $5.5 billion, $5.5 billion and $5 billion, in FY2015, FY2014 and FY2013, respectively. The
    company's R&D is primarily focused on extending the demand for its products and services, including developing new versions of CDMA,
    OFDMA, and other technologies, and developing alternative technologies for certain specialized applications. Further, the company continues
    to develop, commercialize and actively support third generation (3G) CDMA-based technologies, including CDMA2000 1X, 1xEV-DO, EV-DO
    Revision A, EV- DO Revision B, 1x Advanced, wideband CDMA (WCDMA), high-speed downlink packet access (HSDPA), high-speed uplink
    packet access (HSUPA) and evolved high-speed packet access (HSPA+), as well as OFDMA-based long term evolution (LTE) technologies,
    products and network operations. Moreover, the company has been investing significantly to enter new markets, including display
    technologies and technologies to address the growth of mobile data traffic including products and software designed for the implementation
    of small cells, which can be used by carriers to extend the capacity of licensed and unlicensed wireless spectrum; increasing demand for data;
    the connected home and the Internet of Everything (IoE); data centers; automotive; very high speed connectivity; mobile health; wireless
    charging; and machine learning, including robotics.

    The company's strong R&D has enabled it to win a number of patents. According to the company, it has the most widely and extensively
    licensed portfolio in the industry with over 285 licensees of all commercially deployed forms of CDMA and their derivatives require the use
    of Qualcomm patents. The company has an extensive portfolio of the US and foreign patents. The Majority of these patent and patent
    applications are related to digital wireless communications technologies, including patents essential for the commercial implementation of
    CDMA2000, WCDMA (UMTS), TD-SCDMA, TD-CDMA (Time Division CDMA) and OFDMA products. In addition, Qualcomm has patent portfolio
    related to key technologies used in communications and other devices and/or related services, including H.264 video codec technology, the
    next generation video codec technology (H.265 or high-efficiency video codec), advanced WLAN (802.11ac), volatile (LP-DDR2, 3, 4) and non-
    volatile (eMMC) memory controllers, operating systems, user interfaces, graphics and camera processing, packaging techniques, sensor and
    sensor fusion algorithms and application processor architectures.

    The company's robust R&D capabilities that enabled it to develop a strong patents portfolio offer technological leadership to Qualcomm over
    its peers. It will enable it to introduce new products in a timely manner and enhance its existing products. This would enhance the appeal of
    its products thus enabling it to effectively retain and gain new customers.

    Strong market position
    The company holds strong share in a number of markets in which it serves. Qualcomm is one of the leading providers of smartphone chipsets.
    According to industry estimates, the company leads the smartphone applications processor market with a 42% market share and is the
    dominant player in the cellular baseband chip market with a market share of 59%. The company's Snapdragon 800 series quad-core chipset
    is extensively used in premium-tier smartphones and tablets with its superior processing and graphics performance and multimedia
    experience. In addition, Qualcomm's other Snapdragon models, including 200, 400 and 600 are widely used in mid-range smartphones. The
    strong market position of the company provides it a competitive edge over its peers. It also provides strong brand recognition enabling
    Qualcomm to add new clients from existing and new geographies.

         ♦    Weakness

    Concentrated customer base
    Qualcomm derives a significant portion of its total revenues from a limited number of customers and geographies. Revenues from few
    customers have historically constituted a significant portion of the company's total revenues. Qualcomm CDMA Technologies (QCT) and
    Qualcomm Technology Licensing (QTL) segment revenues related to the products of Samsung Electronics and Hon Hai Precision
    Industry/Foxconn, its affiliates and other suppliers to Apple comprised 45%, 49% and 43% in FY2015, FY2014 and FY2013, respectively. The
    loss of any one of its significant customers or the delay, even if only temporary, or cancellation of significant orders from any of these
    customers impacts the company's revenues in the period of the deferral or cancellation and will harm its ability to achieve or sustain expected
    levels of operating results. Further, concentration of device share among a few companies, and the corresponding purchasing power of these
    companies, may result in lower prices for the company's products which, if not accompanied by a sufficient increase in the volume of
    purchases of the company's products, could have an adverse effect on Qualcomm's revenues and margins.

    High dependence on third party suppliers
    The company depends on a limited number of third-party suppliers for the procurement, manufacture, and testing of its products. The
    company's QCT segment purchases wafers, die and fully-assembled and tested ICs from third-party semiconductor manufacturing foundries.
    Qualcomm also contracts with third- party suppliers for assembly, test and other services related to the manufacture of its products. A
    reduction, interruption, delay or limitation in product supply source, a failure by its suppliers to procure raw materials or to provide or allocate
    adequate manufacturing or test capacity for its products could have an adverse effect on the company's ability to meet customer demands
    affecting business and profitability. Moreover, the company relies on the sole or limited-source suppliers for some products, subjecting it to
    significant risks, including possible shortages of raw materials or manufacturing capacity; poor product performance; and reduced control
    over delivery schedules.

    Although Qualcomm has long-term contracts with its suppliers, many of these contracts do not provide for long-term capacity commitments.
    Qualcomm's suppliers may allocate and in the past have allocated capacity to the production and testing of products for their other customers
    while reducing or limiting capacity to manufacture or test the company's products. Additionally, one or more of its suppliers or potential
    alternate suppliers may manufacture CDMA- or OFDMA-based ICs that compete with Qualcomm products. If the company fails to execute
    supply strategies that provide supply assurance, technology, leadership, and low cost, then its operating results and business may be harmed.

                                     Long Equity Report- Applied Portfolio Management | Analyst: Kashif Anwer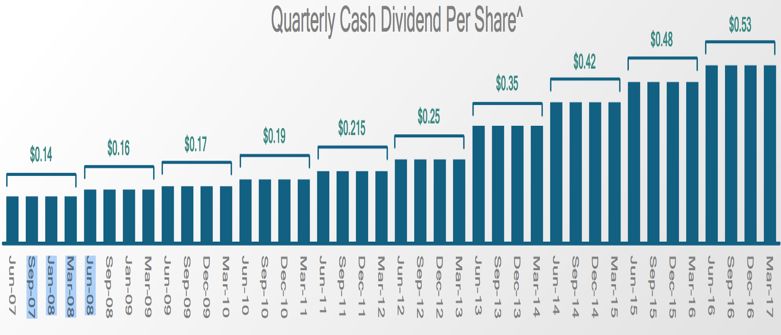
7
      ♦    Opportunities

    Strong growth in smartphones market
    The worldwide smartphone market is forecasted to record robust growth in the coming years due to strong consumer demand and increased
    commercial buying. According to industry estimates, global smartphone shipments are expected to grow from 1.5 billion unit shipments in
    2015 to almost 2.1 billion unit shipments in 2020, growing at a CAGR of 6% during 2016-20 periods.

    Qualcomm is well positioned to drive growth from the increasing demand for smartphones. The company's Snapdragon processors are
    employed in many of the smart devices, including Apple, HTC, LG, Samsung, Blackberry, and Sony, among others. Further, in 2015, QTI
    introduced four new Qualcomm Snapdragon processors, including Snapdragon 620, and Snapdragon 618, the 600 tier processors and
    Snapdragon 425 and Snapdragon 415, 400 tier processors for high-performance and high-volume mobile devices. The increasing usage of
    smartphones and the changing technology would drive the demand for the company's products and enable strong growth in sales. This would
    enable Qualcomm to drive strong revenue growth in the coming periods.

    Poised to benefit from the growing IoT market
    With increasing adoption of cloud services and the big data services, the Internet of Things (IoT) market is growing rapidly. According to
    industry estimates, the IoT market is expected to reach $662 billion in 2021 from $157 billion in 2016, growing at a CAGR of over 33% during
    2016-21 periods. Further, it is estimated that over 20.8 million devices will be connected by 2020, compared to 6.4 billion devices in 2016.
    According to the company, embedded market, which includes IoT, provides a market opportunity of $30 billion by 2020.

    The company is well positioned to benefit from the robust outlook of the end market. The company offers a portfolio of intelligence-based
    products for the IoT market. Qualcomm’s MDM9207-1, a flexible and scalable chipset with Cat 1 LTE technology is was primarily designed for
    the IoT. Its key features include support for Cat 1 with power save mode (PSM) and up to 10 years of battery life; integrated ARM Cortex A7
    AP and GNSS for location services; support for Linux OS-based platforms; 3G/4G LTE multimode/multiband support; and flexibility to add voice.
    The company’s 2net platform is a cloud-based system that securely gathers health information from various medical devices and health
    applications into one easily accessible spot. The Qualcomm AllPlay smart media platform makes it possible for music devices of different
    brands to work together for a high-quality, whole-home audio experience.

    In addition, the company’s IoT Development Platform offers hardware and software for designing and building IoT/machine-to-machine
    (M2M) devices with built-in cellular connectivity. The platform runs Java Embedded ME SDK and includes components used to build, test and
    prove cellular-enabled IoT/M2M applications. With onboard sensors, indicators, and relays, the IoT Development Platform is extensively used
    by developers to test a range of applications including automotive, transportation and logistics; smart energy and security; industrial
    automation and enterprise; consumer and other M2M; and the digital home.

    The company's growing presence in the IoT market will enable it to drive strong revenues and enhance its market share in the future.

    Growing LTE adoption
    The outlook for the LTE adoption is robust primarily due to the increased demand for faster data rates and better spectral efficiency in the
    wake of heavy data usage, increased penetration of smart devices and the demand for quality services on the move. The growth in the market
    is further enhanced by the planned large-scale adoption of LTE by operators in the Asia Pacific regions, primarily China. According to industry
    estimates, the worldwide LTE subscriber base reached nearly 1 billion in the last quarter of 2015. Furthermore, the global market is expected
    to reach 3.8 billion by 2020. Moreover, LTE is expected to account for more than 45% of the global mobile subscription market by 2020.

    Qualcomm offers a range of components for the 4G devices, including RF transceivers, baseband processors and power management chips.
    The company's robust LTE portfolio coupled with strong growth in the end market would provide incremental growth opportunities to enhance
    its revenues and market share in the coming years.

      ♦    Threats

    Intense competition
    The company faces intense competition in the communications industry. The company faces competition across all its business segments.
    The company's QCT segment competes worldwide with a number of the US and international designers and manufacturers of
    semiconductors. It also competes in both single- and dual-mode environments against alternative communications technologies including
    but not limited to, global system for mobile communications (GSM)/general packet radio service (GPRS)/ enhanced data rates for GSM
    evolution (EDGE), time division multiple access (TDMA), time division synchronous code division multiple access (TDSCDMA) and worldwide
    interoperability for microwave access (WiMAX). The company competes on the basis of performance, the level of integration, quality,
    compliance with industry standards, price, time-to-market, system cost, design and engineering capabilities, new product innovation and
    customer support. QCT primarily competes with major companies including Broadcom, Ericsson, HiSilicon Technologies (a subsidiary of
    Huawei Technologies), Intel,

    Lantiq, Marvell Technology, Maxim Integrated Products, MediaTek, Nvidia, Realtek Semiconductor, Samsung Electronics and Spreadtrum
    Communications. QCT also faces competition from internally developed products by its customers and from some early-stage companies.

                                     Long Equity Report- Applied Portfolio Management | Analyst: Kashif Anwer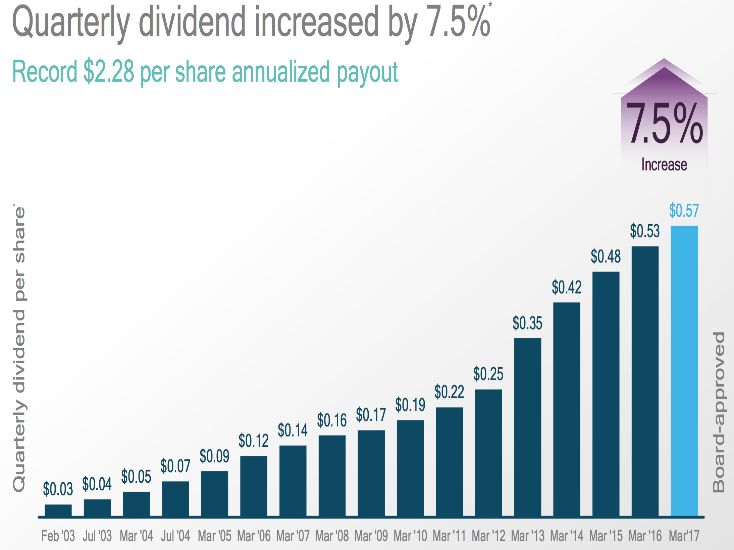
8
    The QTL division faces competition in the development of intellectual property for future generations of digital wireless communications
    technology and services. This segment competes primarily with the GSM/GPRS/EDGE digital wireless communications technologies on a
    global basis.

    Intense competition across the company's segments may result in declining average selling prices for its products which may affect its top
    line growth and margins.

    Rapid technological changes
    Qualcomm operates in the telecommunications industry which is characterized by rapid technological changes. These changes will broaden
    the range and reduce costs of telecom products and services. Future changes in network technology will create a need for the company to
    upgrade its products and technologies. These up-gradation will also require the company to dedicate significant resources. New products or
    services that use new or evolving technologies may reduce demand for the company's existing offerings or cause prices for those services to
    decline. In addition, the company needs to upgrade its technology innovations to compete better with the emerging technologies. There can
    be no assurance that Qualcomm will succeed in developing, implementing and marketing new technologies, products, services or
    enhancements in a reasonable time, or that they will gain market acceptance. Inability to upgrade to the new technologies may affect the
    company's competitiveness and the results of operations. The company may employ a number of strategies to reduce technological risk, but
    the rapid rate at which new technologies are emerging, exposes the company to inventory obsolescence risks.

    Investigation related to alleged anti-monopoly practices
    The company is subject to the investigation related to alleged anti-monopoly practices. In 2015, Qualcomm agreed to pay a fine of $975
    million as part of a 14-month government investigation into anti-competitive practices. As per the deal, the company may also lower its
    royalty rates by around a third on patents used in China. The National Development and Reform Commission (NDRC) probe disrupted the
    company's business in China and fostered disputes with existing licensees and caused other firms to delay signing new licenses. Similarly, in
    2015, Genitop, which develops Chinese character information processing software and semiconductor chips, sued Qualcomm for infringing
    its China-registered trademarks. The company is seeking a penalty of $100 billion in administrative penalty and $16 million for using Genitop's
    trademark.

    The company's involvement in monopoly offenses and other lawsuits would negatively impact the company's business and its growth
    prospects in China. It would also have an adverse effect on the brand image of Qualcomm.

                     Margin of safety: “Where is the value/Moat”- “Devil is in the details”
    The pendulum always swings from irrational exuberance to unjustifiable pessimism and right now Mr. market is unjustifiably pessimistic about
    the QCOM’s price. Graham suggests” The Intelligent Investor dreads a bull market and welcomes a bear market” and hence in my opinion
    QCOM is at the right purchasing price of $52.78 since Mr. Market’s wild pricing inconsistencies has wildly undervalued QCOM stock.
    Also since Graham shuns upon using only past performance as a major decision-making tool for the Investor, I tried to look at the prospective
    ability of QCOM to whether past this storms before choosing it for value investments. Furthermore, Graham in his example of Emhart Corp.
    and ELTRA’s talks about its attractively priced stocks relative to P/E and book value and because of both having stable earnings brings similarity
    to what QCOM is offering to its potential investors today. His take of buying relatively large companies that are currently unpopular to make
    large returns or by buying bargain issues to make outsized returns fits well with QCOM current scenario. Hence in my humble opinion, QCOM
    is definitely an investment buy at this point that is it presents upside through Quantitative analysis and promises safety of principal with an
    adequate return. Also as a value Investor Investing on the basis of projection is often considered as a fool’s errand; Investing on the basis of
    protection is the best solution” and that brings to my next thesis i.e. QCOM’s future prospects and its effectiveness.

    5G Economy: “A yet new diaspora for the communication equipment’s technologies”

    The recent focus for Qualcomm has been in 5G technologies which give it enough advantage over any player in the market that are still lacking
    the technical skills to outperform QCOM in even 3G and $G space. It is estimated that %G economy will growth to $12 trillion by 2035 and
    with QCOM having the first mover advantage with grab the biggest pie from this technology.

                                                                                   Source: 2017 Annual Shareholder Meeting Presentation

                                     Long Equity Report- Applied Portfolio Management | Analyst: Kashif Anwer
9
Acquisition: “A marriage made in heaven”
Per the recent update in Q2 2017 earning call, it is almost confirmed that the acquisition will take place as it has passed the HSR approval
Process. With this, the anticipated synergies between the two come in to play (of the order of 835mllion) in addition to the extra revenue
growth potential from the NXP business in automotive and IoT space.
Source: 2017 Annual Shareholder Meeting Presentation
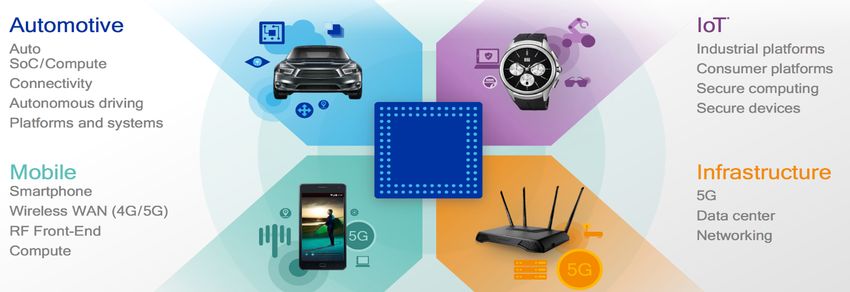
Snapdragon & Qualcomm Centriq 2400: “Future is bright”
Qualcomm unveiled a new 835 Snapdragon processor, the first ever under 10-nanometers, earlier this year. The Snapdragon 820 and 821 are
found in high-end Android smartphones like the Google Pixel, Samsung Galaxy S7 Edge, LGV20, HTC 10, and BlackBerry's Android device.
Executives told analysts that demand for 10 nanometer chips is exceeding supply.
Source: 2017 Annual Shareholder Meeting Presentation
QCOM- “what’s the management vision”
With the clear direction from the management as to where the company is headed in the years to come confirms the management expertise
and vision for the future.
Source: 2017 Annual Shareholder Meeting Presentation
Long Equity Report- Applied Portfolio Management | Analyst: Kashif Anwer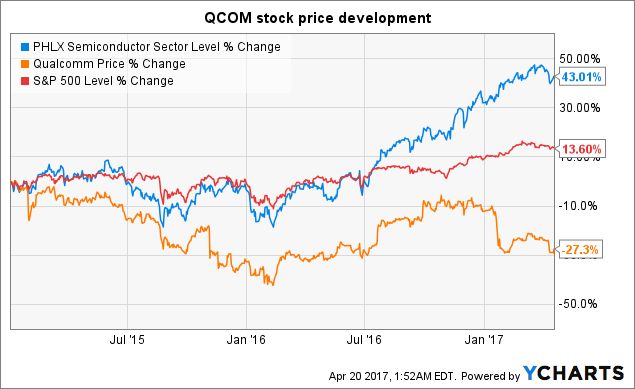
10

                                                                       Investment Summary
 Forecast Assumptions

 I estimate going forward and for F2017 revenue will grow at 11% each year (by being very conservation on the side of caution). This increase
 in revenue is justified by QCOM’s chipset and licensing business, where quality assurance is the theme of the day and QCOM having had
 enough clout and innovation going in favor of its products lends solid reasoning to its increased revenue growth. For dividends, I assumed
 growth at 8%, which is a key management goal for QCOM and usually confers with the trend. I am also expecting, QCOM to achieve its goal
 of spending an average of $2.5-3.5 billion a year on growth CapEx and $ 5.2 – 8 Billion on R&D.

                          Dividened Payout Ratio
      80%
                       72% 74% 69%                         74%
      70%                                            68%           70% 67%
                                             64%
      60%
      50%                                                                           47%
                                                                                  45%
      40%
      30%                              31%
      20%
      10%
       0%

 Valuation using Comparable

 My P/E Comparable model resulted in a target price of $99.02 per share. For this estimate, we used an estimated industry average P/E
 multiple of 26 x and Earnings of $5,705 for QCOM for diluted shares outstanding of 1.98 billion, which returned QCOM’s projected price. The
 peer group has been taken from Morningstar and those that have been cited by management as useful in performance comparisons since
 each company in the group operates in a technology sector we selected the P/E for the semiconductor industry. I conducted a P/E sensitivity
 analysis which shows discount at even the current level.

                                                                             Analysis at Various Prices - Trading Comps - Earning
     P/E                    16.00x      18.00x        20.00x        22.00x           24.00x         26.00x          28.00x          30.00x     32.00x     34.00x     36.00x
     QCOM LTM earnings        $5,705      $5,705        $5,705        $5,705            $5,705         $5,705          $5,705         $5,705     $5,705     $5,705     $5,705
     Equity Value            $91,280    $102,690      $114,100      $125,510         $136,920       $148,330        $159,740        $171,150   $182,560   $193,970   $205,380
     FD Shs Out                1,498         1,498         1,498       1,498             1,498           1,498          1,498          1,498      1,498      1,498      1,498
     Value per share          $60.93      $68.55        $76.17        $83.79            $91.40         $99.02        $106.64         $114.25    $121.87    $129.49    $137.10

 PEG Valuation
 My evaluation of QCOM on a PEG basis reveals an implied discount of 33%. This equates to a potential share price of $69.93 and a multiple
 of 10.8X one year forward earnings.

             QCOM PEG Ratio                                                             1.53
             10 Year Average Growth Rate
             (Model)                                                              16.00%
             1 Year Forward P/E (04/14/17)                                              10.8
             PEG Calculation:                                                         0.675
             Implied Discount=                                                         33%
             Current Share Price (04/14/17)                                         $52.78
             PEG Implied Price                                                      $69.93

                                           Long Equity Report- Applied Portfolio Management | Analyst: Kashif Anwer
11
Unlevered Free Cash Flow (UFCF) Model
The Unlevered Free Cash Flow (UFCF) Model resulted in a target Price of $58.34, which suggests that QCOM is selling at a discount of 9.4%
with respect to its current price $52.78. The analysis is done by considering the perpetual growth of 1% per the Aswath Damodaran site while
the rate of debt at 3%, calculated as sum product of all the available debts and rate of equity calculated using a market premium of 3.74%
and a beta of 1.5.
Δ in Other non-current liabilities 445 409 454 504 559
Unlevered FCFs $6,156 $3,503 $3,813 $4,172 $4,583
Terminal Value
Growth rate 1.00%
Discount rate (WACC) 6.05%
Terminal Value $91,654 Timing
Today Year End Diff Year Factor
Discounting model 4/14/17 9/25/17 164 365.25 0.449
Mid-year convention YES
Year count 0.225 1.225 2.225 3.225 4.225
Discount denominator 0.987 0.931 0.878 0.827 0.780
PV of Free Cash Flow $6,076 $3,260 $3,346 $3,452 $3,576
PV of FCFs $19,708
PV of Terminal Value 71,512
TEV (Total Enterprise Value) $91,221
Short-term debt $1,749
Long-term debt 9,935
Total debt $11,684
Required Cash $7,849
Excess Cash 0
Total Cash $7,849
Convertible / Preferred 0
Minority Interests (10)
Equity Value $87,396
Diluted Shares Outstanding 1,498
Value per share $58.34
Current Price (3/15/17) $52.78
Premium / (Discount) to Intrinsic Value (9.5%)
Rating BUY
CapEx & Research and development
CapEx and research & development has become a greater expense for QCOM since its inception and continues to increase at a high rate.
However, with an increase in revenue at a much faster rate the capital intensity is still reduced as a net result. From 2006–16, CapEx intensity
is reduced significantly because of better operational efficiencies as well as with low investment in required for operational business. On the
other hand, research & development spending increased at a rough rate of 10% p.a and is expected to increase even further with
management’s vision to pivot its business to better position itself in IoT and Automotive space. Through 2018, QCOM plans to spend on its
latest 5G technology advancement and hence, as a result, I have assumed CapEx to increase on an average of 9% on going forward basis.
R&D growth capex growth
12.00% 15.00%
10.00% 10.00%
8.00% 5.00%
6.00%
0.00%
4.00%
2.00% -5.00%
0.00% -10.00%
-15.00%
-20.00%
Free Cash Flow Analysis
QCOM possessed positive FCFF almost all the years since inception excluding the years 2008 and 2009 and I expect the same in 2017;
However, the FCFF per the modelling will decline in the years to come due to its recent debt financing for its NXP acquisition and since the
operating working capital almost unchanged for the next five years and business generating enough cash to manage its debt load and available
anticipated synergies in the NXP deal. The valuation stands better than it is right now. Over the last decade this is how their EV/FCF multiples
have looked at the end of the financial year:
Long Equity Report- Applied Portfolio Management | Analyst: Kashif Anwer12
EV/FCF ratio
35.0x
30.0x
25.0x
20.0x
15.0x 32.1x
22.2x 21.6x
10.0x 19.3x 17.9x 18.7x
13.9x 15.1x 15.6x
5.0x 11.3x
0.0x
9/25/07 9/25/08 9/27/09 9/26/10 9/25/11 9/25/12 9/25/13 9/25/14 9/25/15 9/25/16
The basic average sits at 18.8. However, again adjusting for outliers out for 2008 and 2009 leaves us with an adjusted average of 18 exactly.
Using the financial model, I emerge with FCF estimates of $6.95 billion and $6.15 billion for this year and the next. Averaging these (giving
$6.55 billion), feeding this back into the EV/FCF calculation. The FCF fair value results in the share price of $79.1. At the current share price of
$52.78, QCOM could advance about 70% or more before even hitting its FCF fair value.
Interest Expense, Taxes and Investment Income: Recent Leverage, Deferred Tax Assets, and Investment Performance
QCOM’s emphasis on its strong balance sheet and commitment to an investment grade rating make it unlikely that the company will issue
further debt in the next six years. Furthermore, the company raised $10bn in debt in 2015 and $11bn 2016 and has stated goals of preserving
strategic flexibility and a commitment to return a minimum of 75% of FCF to stockholders, making any early debt retirements unlikely. I
applied the weighted average interest rate of 3% to QCOM’s remaining long-term debt balance based on its debt schedule to project interest
expense through 2021.
QCOM had 17% tax rate in 2016 on its 10-k annual report /earnings call, and given the historical reliability of its projections, I projected a 17%
tax rate for 2016, close to its five-year historical average rate of 17%.
QCOM has federal net operating loss carry forwards of $366mm as of September 27, 2015, expiring from 2021-2033, unused state net
operating loss carry forwards of $696mm expiring from 2016-2035, and unused foreign net operating loss carry forwards of $413mm expiring
from 2019-2024.In the company’s 10-K, it states that it “does not expect its federal net operating loss carry forwards to expire unused, “which
I interpret as the company is only expecting to utilize its federal NOL carry forwards in the foreseeable future. Therefore, I assume that the
federal NOLs will be utilized evenly in every year from 2017-2033, when they expire, amounting to $21.5mm annually in tax savings. I assumed
that tax provisions from 2017-2021 will equal 17% * EBT.I projected investment income equal to 3% of revenues from 2016-2021, slightly
below the five-year historical average of 4.17%, as the company expects to generate lower interest and dividend income as well as lowered
realized gains in 2017 due to rebalancing, a trend I conservatively estimate will persist. I project depreciation and amortization will remain at
a historical average as a percentage of PPE and Intangibles respectively because I do not foresee the capital intensity of the business shifting
dramatically over the next five years.
Projected Investment Income
Projected Income Tax(in millions)
(in million)
2500
2000
1200
1500 1000
800
1000 1816 2046 600
1601 964 1070
1204 1399 400 705 782 868
500
200
0 0
9/25/17 9/25/18 9/25/19 9/25/20 9/25/21 9/25/17 9/25/18 9/25/19 9/25/20 9/25/21
Long Equity Report- Applied Portfolio Management | Analyst: Kashif Anwer13
Projected debt component (in Projected Deffered Tax assets( in
million) million)
9,406
10,000 8,019 7,528 7,069 1000
6,619
5,000 500
500 555 616 684
450
0 0
9/25/17 9/25/18 9/25/19 9/25/20 9/25/21 9/25/17 9/25/18 9/25/19 9/25/20 9/25/21
Blended Weighted Valuation
QCOM’s growth profile is unique and warranted a blended approach to implied P/E and forecasted price. Weightings were assigned to each
valuation methodology in order to average out the abnormalities in the implied result. Equal weights were assigned to PEG, FCF valuation,
and Comparative P/E approaches. A lesser weight was assigned to the DCF valuation as the model tends to underestimate estimate
companies with negative recent growth. Based on this analysis, I believe a fair multiple for QCOM is 18.95x one year forward earnings. This
multiple would result in a market price of $76.03, which is a 44% increase from the current share price of $52.78. At current levels, the
stock is so attractive; Buffet and Graham, if he was alive, would break from their stance on investing in the technology sector and delve into
it for this incredible buying opportunity.
Valuation approach Implied Multiple Price Forecast Weighings Component
DCF 13 58.34 15% 8.75
FCFF 18 79.1 21% 16.81
P/E Relative 26 99.02 21% 21.04
P/E Comparative 18 68.55 21% 14.57
PEG 18 69.93 21% 14.86
Total 18.95x $76.03
DuPont ROE Assessment
ROE is an extended portion of the ROA ratio. The only addition to this ratio is the leverage (debt). Leverage can magnify both gains and losses.
Too much leverage in poor economic environments can prove to be lethal. Similarly, it is important to note the medium of debt for the actual
analysis of management’s take on the future of the company. If there is too much of short-term debt wrt to long-term debt it again sends the
wrong signal about the future sustainability of the firm. The Leverage Ratio of QCOM is very consistent up until 2014 and has recently taken
debt in my opinion to leverage the already conducive environment of low-interest rate. One could suggest that QCOM’s management knows
its own business cycle and as such has taken out debt so that it can magnify the current economic upward trend into its profitability and also
invest in the future direction of IoT and Automotive space, which is evident from its acquisition of NXP.
Payout Ratio
QCOM’s payout ratio decreased between 2014 and 2016, due to an increase in EPS, while the dividend grew at a secure rate. In Q2 2017,
QCOM’s payout ratio of 47% was one of the highest among its peers. Over the next twelve months, I forecast that QCOM will possess a payout
ratio of roughly 50-55% as approved by the Board.
Key Ratios
In assessing profitability, QCOM has performed very well and is first in its peer group for gross margin, profit margin, EBIT margin, and
ROE. Within our forecasts, I still expect QCOM to hold this lead among its competitors. Since QCOM’s revenues have suffered from
negative growth in the last two years, these measures imply that QCOM has above-average proficiency in cost-control. For long-term
solvency, QCOM stands solidly with close to $30 billion in cash, cash equivalents, and marketable securities. QCOM has begun to take
debt to finance its NXP acquisition but even then only stands at 12% of total capital which is slightly higher for the technology industry on
an average and its peer group in general. I am optimistic management will use QCOM to strategize its business from smartphones to
additional segments such as automotive and IoT and pivot its vision to greater profitability.
Long Equity Report- Applied Portfolio Management | Analyst: Kashif Anwer14
Key Ratios Performance ratios
160.00% 100%
90%
140.00%
10.8% 11.8% 80% 10.8% 12.3% 12.6% 13.8%
10.2% 10.1% 10.3% 10.4% 10.5% 16.1% 14.6% 15.1% 15.5%
120.00% 11.4%
28.5% 27.6% 26.1% 27.2% 27.9% 28.3% 28.6% 70%
100.00% 22.8% 60%
80.00% 32.8% 50%
27.6% 33.6% 31.4% 31.4% 31.4% 31.4% 31.4%
40% 11.7%
60.00% 11.5%14.2% 12.8% 11.6%
10.6% 10.6% 9.8%
30%
40.00%
62.2% 61.7% 62.0% 62.0% 62.0% 62.0% 62.0% 62.0% 20%
20.00% 10% 5.9% 5.7% 5.3% 4.9% 5.1% 5.3% 5.5% 5.6%
0.00% 0%
Gross margin EBITDA margin EBIT margin Profit margin ROA ROE ROIC
KEY INVESTMENT RISKS
Firm-Specific Risks
QCOM is heavily invested and currently committing itself into future technologies (5G, (IoT), connected cars). In a sense, it’s positive as it
diversifies the product landscape for QCOM however if it doesn’t bear fruit it will be a downhill road for QCOM. In addition, the competition
is getting more intense in QCT space with Intel and NVIDIA vying for more market share everyday and upgrading their product quality to
match QCOM’s. In a recent test of processor performance of QCOM and Intel based Iphone7 reveals QCOM processor is still far better than
the intel’s.
Legal Risks:
QCOM faces numerous lawsuits, multiple lawsuits filed by Apple and antitrust litigation. BBRY announced it won an arbitration over an existing
cap clause on royalties. As BBRY does no longer sell smartphones, it was in their interest to pursue the argument. The amount awarded to
BBRY is USD 815mln. Although the headlines look scary, this is actually a very immaterial event for QCOM. The USD 815mln is actually less
than 1% of its EV and really is a one-off event revolving around a single issue in a specific contract for subscriber units between 2010 and
2015. QCOM restated that each license agreement is unique. This brings us to the AAPL lawsuits, the real danger of the lawsuits is their
possible disruption of the royalty model for essential patents based upon the value of the entire device rather than a royalty based upon the
incremental value of the use of the patents that is brought to the device.
It is my opinion that QCOM will defend this model at all costs and rather agree on a formula that lowers the rate of the royalty. This is what
QCOM did when the Chinese regulators challenged them. In a way, this adds to the price pressure and competitive dynamics of the
fragmented and high-tech smartphone and smartphone components market and hence QCOM is doing the one thing that really helps them,
i.e. diversifying towards other end markets (automotive) and positioning for future technologies (5G, (IoT), connected cars).
Long Equity Report- Applied Portfolio Management | Analyst: Kashif AnwerYou can also read