CHEMICAL PLANT PFS DEMONSTRATES EXCEPTIONAL ECONOMICS AND OPTIONALITY OF USA LOCATION
←
→
Page content transcription
If your browser does not render page correctly, please read the page content below
ASX RELEASE | May 26, 2020 | ASX:PLL; NASDAQ:PLL

          CHEMICAL PLANT PFS DEMONSTRATES EXCEPTIONAL
           ECONOMICS AND OPTIONALITY OF USA LOCATION
    Piedmont Lithium Limited (“Piedmont” or “Company”) is pleased to report the results of the Company’s pre-
    feasibility study (“PFS”) for its proposed lithium hydroxide chemical plant (“Chemical Plant”) in Kings Mountain,
    North Carolina, USA. The PFS assumes a stand-alone merchant Chemical Plant that would convert spodumene
    concentrate purchased on the global market to battery-grade lithium hydroxide (“Merchant Project”).

    Concurrently, Piedmont has updated the scoping study (“Scoping Study”) for its integrated mine-to-hydroxide
    project (“Integrated Project”) to reflect the updated Chemical Plant PFS. Both studies confirm that Piedmont will be
    a strategic and low-cost producer of battery-grade lithium hydroxide. Piedmont benefits from access to the
    exceptional infrastructure, low operating costs and low corporate taxes enjoyed by American industrial companies.

    Piedmont’s Chemical Plant would create an alternative to the numerous merchant spodumene converters currently
    operating in China and dominating the world lithium hydroxide market, thus providing US and European automotive
    companies a secure and independent American source of the lithium hydroxide required for their supply chains.

     Cautionary Statements
     The Scoping Study referred to in this announcement has been undertaken to determine the potential viability of
     the Integrated Project comprising a Mine/Concentrator and Chemical Plant constructed in North Carolina, USA
     and to reach a decision to proceed with more definitive studies. The Scoping Study for the Integrated Project
     has been prepared to an intended accuracy level of ±25%. The results should not be considered a profit forecast
     or production forecast.
     The Scoping Study is a preliminary technical and economic study of the potential viability of the Integrated
     Project. In accordance with the ASX Listing Rules, the Company advises it is based on low-level technical and
     economic assessments that are not sufficient to support the estimation of Ore Reserves. Further evaluation work
     including infill drilling and appropriate studies are required before Piedmont will be able to estimate any Ore
     Reserves or to provide any assurance of an economic development case.
     Approximately 53% of the total production targets are in the Indicated Mineral Resource category with 47% in
     the Inferred Mineral Resource category. 100% of the production target in years 1-3 is in the Indicated Mineral
     Resource category. The Company has concluded that it has reasonable grounds for disclosing a production
     target which includes an amount of Inferred Mineral Resource. However, there is a low level of geological
     confidence associated with Inferred Mineral Resources and there is no certainty that further exploration work
     (including infill drilling) on the Piedmont deposit will result in the determination of additional Indicated Mineral
     Resources or that the production target itself will be realized.
     The Scoping Study is based on the material assumptions outlined elsewhere in this announcement. These
     include assumptions about the availability of funding. While Piedmont considers all the material assumptions to
     be based on reasonable grounds, there is no certainty that they will prove to be correct or that the range of
     outcomes indicated by the Scoping Study will be achieved.
     To achieve the range outcomes indicated in the Scoping Study, additional funding will likely be required.
     Investors should note that there is no certainty that Piedmont will be able to raise funding when needed. It is
     also possible that such funding may only be available on terms that dilute or otherwise affect the value of the
     Piedmont’s existing shares. It is also possible that Piedmont could pursue other ‘value realization’ strategies such
     as sale, partial sale, or joint venture of the Integrated Project. If it does, this could materially reduce Piedmont’s
     proportionate ownership of the Integrated Project.
     The Company has concluded it has a reasonable basis for providing the forward-looking statements included in
     this announcement and believes that it has a reasonable basis to expect it will be able to fund the development
     of the Integrated Project. Given the uncertainties involved, investors should not make any investment decisions
     based solely on the results of the Scoping Study.

PIEDMONT LITHIUM LIMITED              +61 8 9322 6322                   North Carolina Office       Registered Office

   50 002 664 4953                    +61 8 9322 6558                   32N Main Street Suite 100   Level 9, 28 The Esplanade

   www.piedmontlithium.com            info@piedmontlithium.com          BELMONT, NC 28012           PERTH WA 6000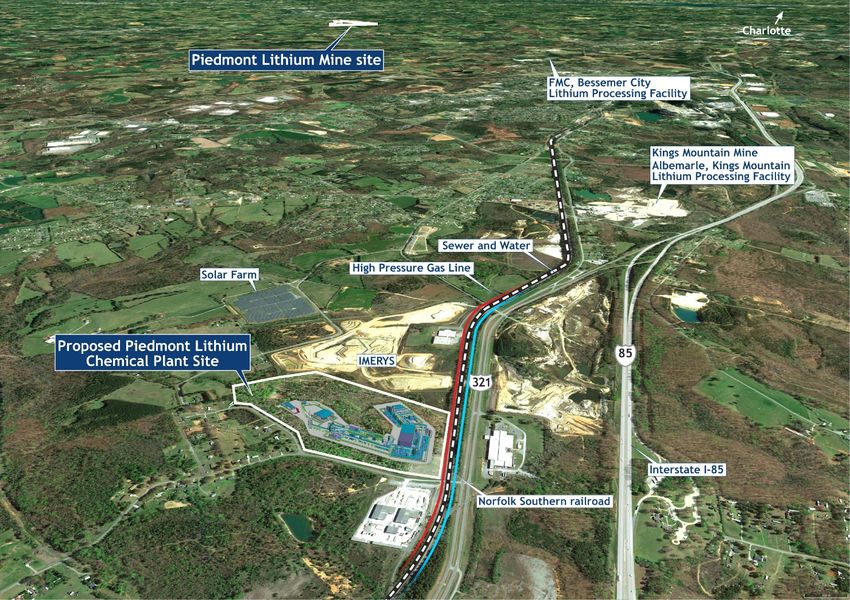
HIGHLIGHTS
LITHIUM HYDROXIDE FOR THE ELECTRIC VEHICLE MARKET
Electric Vehicle (“EV”) demand to grow 12x by 2030 driven by falling battery costs
Lithium Hydroxide (“LiOH”) required in the high-nickel batteries used in longer range EVs
LiOH demand forecast to grow 31% per year through 2030
22,720 tonnes per year (“t/y”) of LiOH production under either development scenario
PREMIER USA LOCATION
An American source of lithium hydroxide to serve the important vehicle and stationary storage
markets in the USA and Europe
Advantageous North Carolina location with well-developed infrastructure, deep experienced
lithium industry talent pool, inexpensive power and reagents, stable regulatory environment,
and favorable taxes
Piedmont will provide an alternative supply source for Western auto makers as currently 80%
of the world’s LiOH is produced in China
POSITIVE ESG PROFILE
LiOH will power the electrification of the vehicle business, dramatically reducing emissions vs.
traditional internal combustion vehicles
Automotive companies prefer spodumene-sourced hydroxide for sustainability reasons
Chemical Plant to be powered entirely by low carbon sources in North Carolina
USA labor, environmental and safety standards
EXCEPTIONAL FINANCIAL RESULTS DRIVEN BY LOW OPERATING COSTS
Merchant Project post-tax NPV8 of US$714 million and post-tax IRR of 26%
Integrated Project post-tax NPV8 of US$1.1 billion and post-tax IRR of 26%
Both projects at the low end of their respective cost curves
o Average Merchant Project LiOH cash costs of US$6,689/t
o Average Integrated Project LiOH cash costs of US$3,716/t
LEVERAGE TO RISING LITHIUM PRICES
Lithium prices are currently at 3-year lows and the pricing forecasts utilized herein reflect
prices that are ~$4,000/t lower than those used in previous studies
For every $1,000/t increase in LiOH prices Piedmont would see an annual EBITDA boost of
over US$20 million and an increase to NPV8 of ~US$150 million
EXECUTIVE SUMMARY
Piedmont has a strategically significant lithium footprint in the United States which positions the Company to
become a low-cost producer of high-quality lithium hydroxide for the automotive industry. This announcement
presents the results of two studies:

1.     The Chemical Plant PFS supports a potential Merchant Project that assumes a stand-alone Chemical Plant
       converting spodumene concentrate purchased on the global market to battery-grade lithium hydroxide.

2.     The Scoping Study covers the Integrated Project comprising a Mine/Concentrator that will produce spodumene
       concentrate which will be transported to a Chemical Plant and converted into battery-grade lithium hydroxide.

Both studies deliver excellent economics and robust internal rates of return over 25-year project lives. The Company
will continue to progress both studies and assess the staging of development activities to maximize returns to
shareholders.

 Table 1: Summary outcomes of Merchant Project PFS and Integrated Project Scoping Study
                                                                                                                    Merchant             Integrated
                                         Outcomes                                                   Unit
                                                                                                                     Project               Project
 Project Life                                                                                       years               25                   25
 Annual average lithium hydroxide production (steady-state)                                          t/y             22,720               22,720
 Annual average spodumene concentrate production (steady-state)                                      t/y               N/A               160,000
 Average cash cost of lithium hydroxide production (steady-state)                                  US$/t             $6,689                $3,712
 Average cost of spodumene concentrate (steady-state)                                              US$/t               $651                 $201
 Mine/Concentrator – initial capital cost (including contingency)                                  US$M                N/A                  $168
 Chemical Plant - initial capital cost (including contingency)                                     US$M               $377                  $377
 Annual average EBITDA (steady-state)                                                             US$M/y               $149                 $218
 After tax Net Present Value (“NPV”) @ 8% discount rate                                            US$M                $714                $1,071
 After tax Internal Rate of Return (“IRR”)                                                            %                26%                  26%
 Payback from start of operations                                                                     y                3.34                 3.23
 Assumed long term LiOH price (real) 1                                                             US$/t             $12,910              $12,910
1.     Based on Benchmark Mineral Intelligence’s revised Q1 2020 lithium pricing forecast.

Compelling Operating Costs for Two Development Cases
A cost-curve comparing Piedmont’s position relative to the 2028 operating and highly-probable projects according
to Roskill demonstrates the 1st quartile position of Piedmont’s Integrated Project and the competitive position of
Piedmont’s Merchant Project vs. other (Chinese) merchant spodumene or lithium carbonate-to-hydroxide
converters. (See Figure 1). The competitive cost position allows Piedmont to provide an alternative source of supply
to US and European automotive customers.

                                  Figure 1 – Lithium Hydroxide 2028 AISC Cost Curve (Real Basis) (Roskill)
     AISC includes all direct and indirect operating costs including feedstock costs (internal AISC or external supply), refining, on-site G&A costs and
                                      selling expenses. It does not include costs associated with corporate-level G&A.

                                                                                                                                                           3
MERCHANT PROJECT
The Chemical Plant PFS features a lithium hydroxide conversion plant to be supplied by spodumene concentrate
purchased on the global market, rather than by Piedmont’s own Mine/Concentrator. The Merchant Project will
compete against the numerous merchant spodumene converters currently operating in China, providing US and
European automotive companies a secure and independent American source of the lithium hydroxide required for
their supply chains.
The Merchant Project will provide the growing number of spodumene concentrate producers in Australia, North
America, South America, Europe and Africa an alternative non-Chinese processing route for their material for the
first time. Piedmont is actively engaged with several such parties and is progressing the securing of feed material
for the plant.
Figure 2 – Isometric Depiction of Piedmont’s 22,720 t/y Lithium Hydroxide Chemical Plant
The design basis of the Chemical Plant is identical in the merchant and integrated scenarios and features:
Nameplate production capacity of 22,720 tonnes per year (“t/y”) of LiOH
Process equipment selection based on conventional, proven technologies
An estimated ramp-up to nameplate capacity within 24 months of plant commissioning
The Merchant Project operating cost estimate assumes an average life-of-project spodumene concentrate cost of
US$651/t delivered to the Chemical Plant in Kings Mountain, North Carolina. Based on this long-term incentive
spodumene concentrate price projection, Benchmark Minerals Intelligence (“Benchmark”) estimates that adequate
spodumene concentrate would be available in the market, including from sources within the Atlantic Basin, to
provide feedstock for the merchant conversion business contemplated by Piedmont.
Table 2 highlights the key economic outcomes of the Merchant Project.
Table 2: Piedmont Merchant Project Key Economic Outcomes Unit Estimated Value
Initial capital cost US$M $377
Life of Project lithium hydroxide cash costs US$/t $6,689
Life of Project revenue (real) US$M $7,336
Life of Project EBITDA US$M $3,627
Net operating cash flow after tax US$M $2,911
Free cash flow after capital costs US$M $2,380
Average annual steady state EBITDA US$M/y $149
Average annual steady state free cash flow US$M/y $114
After tax Net Present Value (NPV) @ 8% discount rate US$M $714
After tax Internal Rate of Return (IRR) % 26%
Payback from start of operations y 3.34
4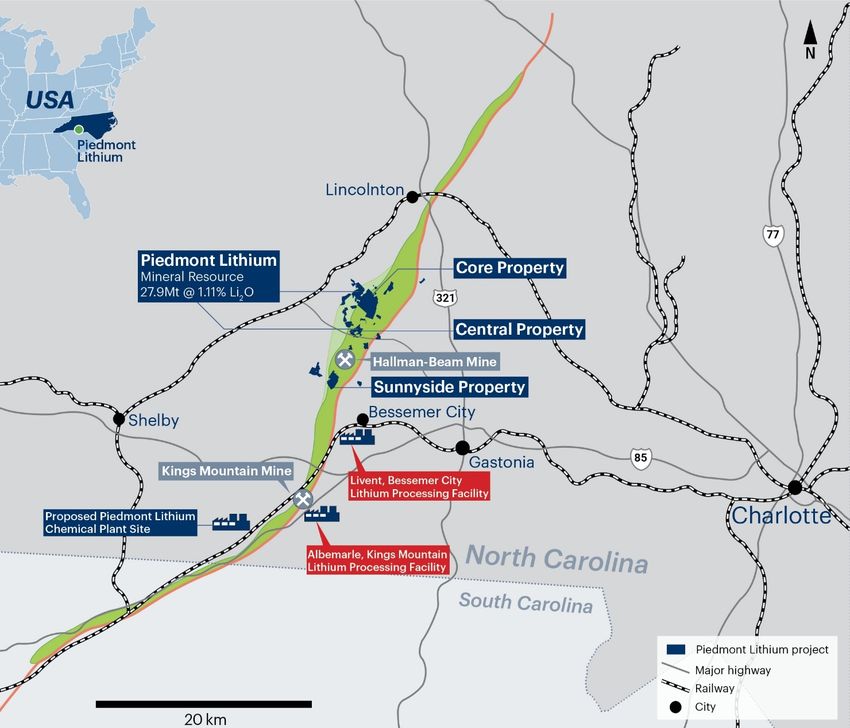
INTEGRATED PROJECT
Piedmont has also updated the Integrated Project Scoping Study for its spodumene-to-hydroxide business located in North
Carolina, USA. Piedmont holds a 100% interest in the Integrated Project located within the Carolina Tin-Spodumene Belt
(“TSB”) and along trend to the Hallman Beam and Kings Mountain mines, which historically provided most of the world’s
lithium between the 1950s and the 1980s. The TSB has been described as one of the largest lithium regions in the world
and is located approximately 25 miles west of Charlotte, North Carolina.
The Integrated Project Scoping Study includes a steady-state 22,720 t/y lithium hydroxide Chemical Plant supported by a
Mine/Concentrator producing 160,000 t/y of 6% Li2O spodumene concentrate (“Concentrate” or “SC6.0”). By-products
quartz, feldspar, and mica will provide credits to the cost of lithium production. The Integrated Project Scoping Study
features:
25-year project life with Mine/Concentrator and Chemical Plant constructed in a single phase
1st quartile operating costs
− Lithium hydroxide cash costs of US$3,712/t (AISC of US$4,209/t)
− Spodumene concentrate cash costs of US$201/t (AISC of US$240/t)
Exceptional project economics
− NPV8 of US$1.1B
− After-tax IRR of 26%
− Steady-state annual average EBITDA of US$218M
Mine/Concentrator and Chemical Plant engineering completed to PFS-level
Piedmont’s Integrated Project is projected to have cash operating costs of $3,712/t LiOH and an average life of project all-
in sustaining cost (“AISC”) of approximately $4,209/t, including royalties and net of by-product credits, positioning
Piedmont as the industry’s lowest-cost producer as reflected in Roskill’s 2028 lithium hydroxide cost curve (see Figure 1).
In comparison to the prior scoping study published in August 2019, the Integrated Project Scoping Study results have been
negatively impacted by the use of more conservative lithium pricing, with the current Scoping Study utilizing long-term
pricing forecasts that are $3,979/t lower than were used in the prior study. Operating costs have remained in the first
quartile, while capital expenditures have increased modestly after more detailed study. The shift to a single-phase
integrated approach as well as a more conventional production ramp-up schedule have partially offset these factors. Figure
3 shows the impact of key project changes to Integrated Project NPV.
Figure 3 – Impact to NPV8 of Integrated Project Due to Various Economic Model Changes
* Impacts associated under the category CAPEX are inclusive of total initial capital cost, changes to sustaining capital, and a
more conservative view of timing of construction cash flow.
5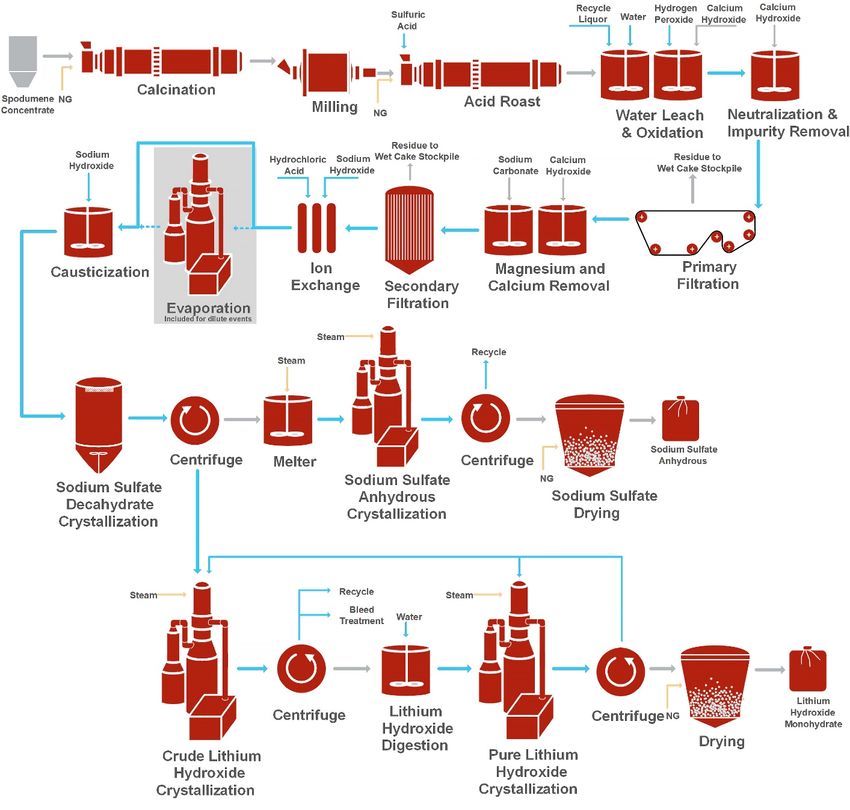
“The Chemical Plant PFS demonstrates the economic benefit of
developing a lithium chemical business in North Carolina, USA, with
its exceptional infrastructure, low operating costs and competitive
tax regime.

80% of the world’s lithium hydroxide is produced in China, largely
by non-integrated ‘merchant’ producers sourcing spodumene
concentrate    from Western Australia. As global automotive
companies electrify their fleets, we expect them to increasingly seek
ex-China sources of lithium supply, and North Carolina is ideally-
positioned to benefit given its proximity to major auto markets in the
US and Europe, and the deep lithium talent pool resident in the
region.

Piedmont will now advance the Chemical Plant through the
permitting and definitive feasibility processes, providing us the
option to move aggressively on either a merchant or integrated
basis toward first lithium production in 2023 as the transition to
electric vehicles begins to seriously take hold”.

Keith D. Phillips, President and Chief Executive Officer

For further information, contact:

Keith D. Phillips                   Tim McKenna
President & CEO                     Investor & Government Relations
T: +1 973 809 0505                  T: +1 732 331 6457
E: kphillips@piedmontlithium.com    E: tmckenna@piedmontlithium.com

                                                                         6
CHEMICAL
PLANT
PRE-FEASIBILITY
STUDY
1.0     CHEMICAL PLANT PFS
The Chemical Plant PFS features a lithium processing plant that includes spodumene concentrate receiving/short
term storage facilities, reagent receiving and storage facilities, process facilities, and site infrastructure. The PFS
excludes a Mine/Concentrator and residue storage facilities. The Merchant Project contemplates a 25-year project
life. The ramp-up period for Chemical Plant operations is assumed to achieve nameplate capacity including both
overall production and battery quality production after a 24-month ramp-up period. Table 3 provides a summary of
production and cost figures for the Merchant Project.

Table 3: Life of Merchant Project                                                       Unit        Estimated Value
Physical – Chemical Plant – Merchant Project
Steady-state annual lithium hydroxide production                                         t/y                 22,720
Steady-state annual battery quality lithium hydroxide production                         t/y                 22,493
Steady-stage annual technical quality lithium hydroxide production                       t/y                    227
Lithium hydroxide production – life-of-project                                            t                554,600
Battery quality LiOH production – life-of-project                                         t                535,900
Technical quality LiOH production – life of project                                       T                  18,700
Spodumene concentrate consumed – life of project                                          T              3,663,000
Chemical Plant life                                                                    Years                     25
Operating and Capital Costs – Chemical Plant – Merchant Project
Average LiOH production cash costs using purchased concentrate                         US$/t                $6,689
Chemical Plant - Direct costs                                                          US$M                  $226.5
Chemical Plant – Indirect costs                                                        US$M                   $65.8
Chemical Plant – Owner’s costs                                                         US$M                    $11.3
Chemical Plant – Contingency                                                           US$M                   $73.1
Chemical Plant – Sustaining and deferred capital                                       US$M                  $108.7
Financial Performance – Merchant Project – Life of Project
Life of Project revenue (real)                                                         US$M                  $7,336
Life of Project EBITDA                                                                 US$M                  $3,627
Net operating cash flow after tax                                                      US$M                  $2,911
Free cash flow after capital costs                                                     US$M                 $2,380
Average annual steady state EBITDA                                                    US$M/y                   $149
Average annual steady state free cash flow                                            US$M/y                   $114
After tax Net Present Value (NPV) @ 8% discount rate                                   US$M                    $714
After tax Internal Rate of Return (IRR)                                                  %                      26%
Payback from start of operations                                                          y                    3.34

                                                                                                                       8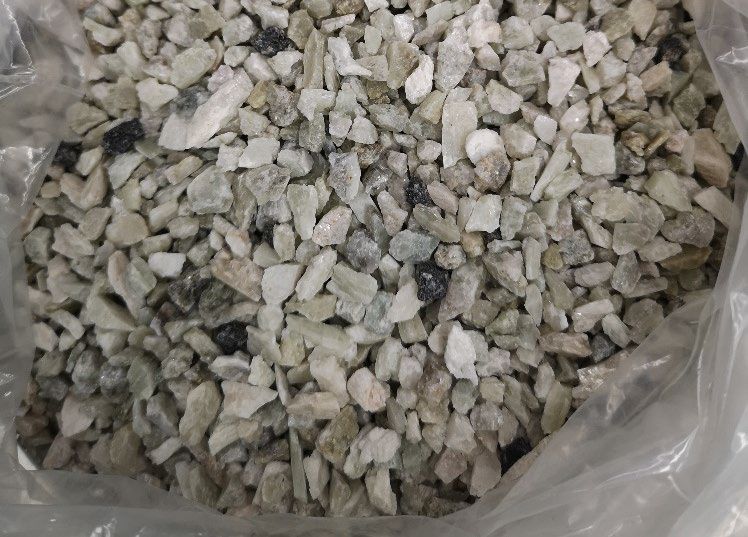
1.1 Chemical Plant Overview
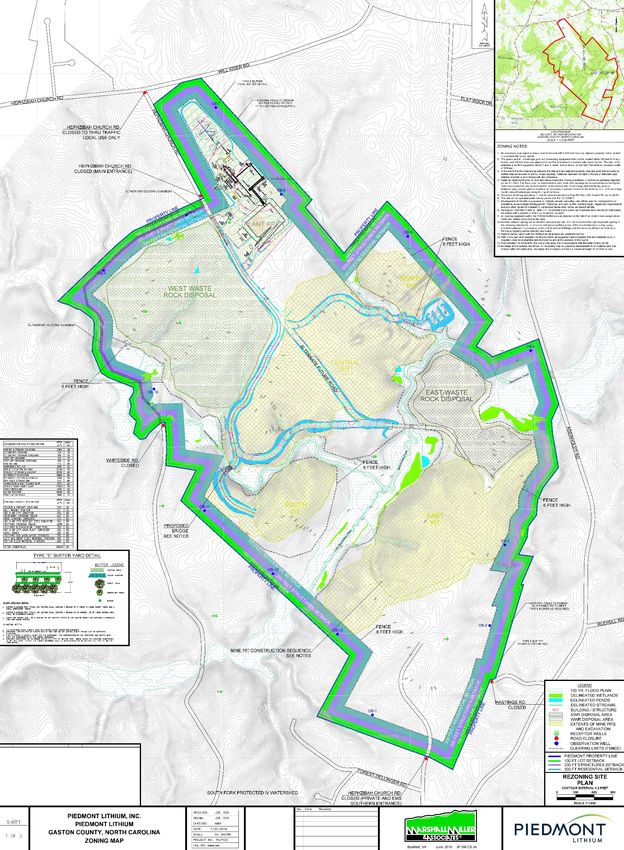
The Company owns approximately 61 acres of freehold property in Kings Mountain, North Carolina for the site of the
Company’s planned Chemical Plant. The site is in proximity to existing lithium operations owned by Albemarle and
Livent and about 20 miles from the Company’s Mineral Resources located in Gaston County, North Carolina.
Figure 4 – Piedmont Chemical Plant Site Located South of Kings Mountain, NC
1.2 PFS Consultants
The PFS uses information and assumptions provided by a range of independent consultants, including the following
consultants who have contributed key components of the study.
Table 4: PFS Consultants
Consultant Scope of Work
Hatch Chemical Plant engineering, initial capital cost and operating cost estimates
SGS Lakefield Metallurgical testwork
HDR Engineering, Inc. Permitting, environment, and social studies
Benchmark Mineral Intelligence Lithium market research
Roskill Lithium market research
1.3 Environmental, Sustainability, and Governance
The Company maintains a strong commitment to responsible project development.
Potential electricity supply from the City of Kings Mountain is sourced from low-carbon sources including from the
nearby 475 Kings Mountain energy center, a newly constructed advanced natural gas generating station, and from
non-carbon nuclear and solar sources in the region. The Company is committed to excluding coal-fired power
generation from its energy mix.
9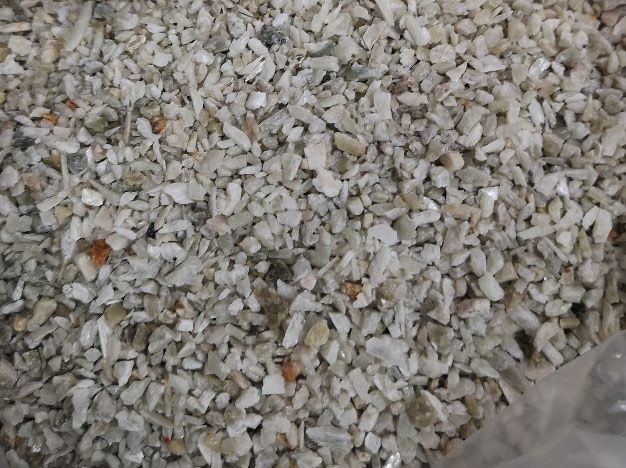
Piedmont will consider environmental impacts and carbon emissions as part of decision making with respect to
spodumene concentrate supply, noting that a number of the projects in the Atlantic Basin, including in Brazil and
Quebec, are reliant on zero-emission hydroelectric power for electricity supply.
The Company is committed to a policy of Environmental Justice (“EJ”) to ensure the fair treatment of all people with
respect to the Merchant Project regardless of race, color, national origin, or income level.
Permitting
HDR Engineering has been retained by Piedmont to support permitting activities on the Chemical Plant. Permitting
work for the Chemical Plant is advanced with key permit applications to be submitted shortly after PFS completion.
The following environmental, field investigation, and social studies are underway on the Chemical Plant:
Streams and wetlands delineation are complete and jurisdictional determination (“JD”) concluded with the US
Army Corps of Engineers. Based on the JD a Section 404 Standard Individual or Nationwide Permit will not be
required for the Chemical Plant.
Air emissions data has been estimated for the Chemical Plant. Emissions modeling has commenced. Based on
the outcomes of the PFS the Company will pursue a synthetic minor air permit under the EPA Title V program.
The City of Kings Mountain for water supply and wastewater discharge criteria.
Characterization tests on aluminosilicate byproduct is underway at SGS. These tests are intended to confirm
the non-hazardous of these inert tails which will allow this material to be used for reclamation.
An environmental justice snapshot study has been undertaken by HDR.
Heavy industrial zoning of the Kings Mountain property is complete; a Conditional Use Permit application will
be prepared following completion of the PFS.
A list of key permits required prior to final investment decision has been identified in Table 5.
Table 5: Chemical Plant – Permits Required Before Construction
Permit Regulatory Authority
Clean Air Act Title V Permit North Carolina DEQ – Division of Air Quality
Construction Stormwater Permit (“NCG01”) North Carolina DEQ
Conditional Use Permit (“CUP”) Cleveland County Zoning
Driveway Permit North Carolina Department of Transportation
MS4 Stormwater Permit Cleveland County
Utility connections (water/wastewater) City of Kings Mountain
The Company expects permits required prior to construction decision to be approved by the end of 2020.
1.4 Chemical Plant Process Design
The Chemical Plant flowsheet incorporates as far as practical ‘conventional’ or proven in operation, equipment, and
process stages, in order to minimize process, technology and equipment risk. The Chemical Plant is designed to
produce 22,720 t/y of lithium hydroxide monohydrate (20,000 t/y of lithium carbonate equivalent). Sodium sulfate
and alumina silicate are produced as by-products.
Process Flow Diagram
A simplified graphic flowsheet is presented in Figure 5 below. Two stages of lithium hydroxide crystallization have
been included in the design based on current battery grade lithium hydroxide specifications. An evaporation step is
included between ion exchange and causticization but only operates during start-up, plant upset conditions, or
when additional primary filtration washing is required.
10Figure 5 - Piedmont Chemical Plant Simplified Overall Flowsheet
Commissioning and Ramp-Up
Piedmont has selected a standard route for lithium hydroxide production with selection of standard in-use process
equipment where possible to limit the use of novel equipment. A key objective is to take advantage of the ‘lessons
learned’ by the first wave of lithium chemical plants to ensure Piedmont is able to achieve its production ramp-up
targets. Piedmont intends to work with equipment suppliers with experience on operating lithium chemical plants
in order to realize this objective.
The proposed ramp-up profile follows a McNulty series 2 curve for 12 months and then move on to a McNulty series
1-2 profile to achieve 100% capacity. The ramp-up profile is shown in Table 6 in terms of product throughput and
percentage of product at battery-grade quality. The ramp-up profile does not take into consideration purchasers
product qualification periods.
Table 6: Proposed Chemical Plant Ramp-Up Profile
Months from Plant Start Up
Parameter
6 months 12 months 18 months 24 months
Feed ore rate as % of nameplate capacity 45% 80% 90% 100%
Battery grade product as % of total product made 10% 40% 70% 99%
111.5 Site Plan
A preliminary site plan and 3D model of the Chemical Plant was prepared using site topographic information. The
model supports the capital cost estimate and will provide the basis for subsequent stages of engineering. The layout
includes preliminary site grading and stormwater management features.
Figure 6 – Isometric View of Piedmont’s Chemical Plant (looking West)
1.6 Capital Cost Estimate
The initial capital cost estimate was prepared in accordance with guidelines established by the Association for the
Advancement of Cost Engineering (“AACE”) for a Class 4 (Equipment Factored or Parametric Modelled) estimate.
The anticipated level of accuracy is -25% to +25%. A project contingency allowance of 25% has been applied to all
estimated project direct and indirect costs. Piedmont estimated the Owner’s Costs as US$ 11.3 million. All costs are
presented in 2020 US dollars. No allowance is made for escalation. Costs as presented exclude sunk costs prior to
final investment decision. A summary of the total initial capital costs is presented in Table 7.
Table 7: Chemical Plant Level 1 CAPEX Summary
WBS Description Estimated Cost (US$)
Direct Costs
3100 Site Infrastructure and Utilities $62,332,000
3200 Calcination and Acid Roast $49,256,000
3300 Leach, Neutralization, and Filtration $12,846,000
3400 Impurity Removal $11,341,000
3500 Causticization and Sodium Removal $34,989,000
3600 Lithium Production $42,216,000
3700 Bleed and Effluent Treatment $6,303,000
3800 Reagent Storage and Distribution $7,256,000
Subtotal Direct Costs $226,539,000
7000 Indirect Costs $65,771,000
8000 Contingency $73,077,000
Subtotal Installed Costs Before Owner’s Costs $365,386,000
9000 Owner’s Costs $11,327,000
Total Initial Capital Costs (Excluding Working Capital) $376,713,000
121.7 Operating Costs
Merchant Chemical Plant Operating Cost Estimate
The operating cost estimate was prepared based on producing 22,720 t/y of lithium hydroxide monohydrate
(20,000 t/y LCE). Table 8 summarizes the estimated operating costs at steady-state, including the long term
spodumene concentrate price according to Benchmark Mineral Intelligence. Costs are presented on an FOB
Chemical Plant basis. Sodium sulfate and aluminosilicate byproducts are assumed to have zero credit value.
Table 8: Chemical Plant Cash Operating Cost Summary – Merchant Chemical Plant Basis
Operating Cost Component Total Annual Cost (US$M/y) Cost US$/t LiOH
Chemical Conversion Costs
Salaries $10.26 $452
Reagents $28.04 $1,234
Consumables $1.93 $85
Utilities $5.94 $261
Maintenance $3.64 $160
G&A $1.79 $79
Waste removal 1
$2.26 $100
Subtotal Chemical Conversion Costs $53.86 $2,371
Spodumene Concentrate Purchases $84.64 $3,725
Spodumene Concentrate Freight $11.26 $496
Total Cash Operating Costs $149.76 $6,592
1. Waste removal costs in the merchant Chemical Plant scenario include costs for hauling and disposal of aluminosilicate
residue to a clean fill disposal location near the Chemical Plant site.
The operating cost estimate is based on 2020 US dollars with no escalation provision. The target accuracy of the
operating cost estimate is ± 25%. Operating costs are based on steady-state production with long term spodumene
concentrate prices. The operating costs are not reflective of the construction, commissioning, or ramp-up phases
of the Chemical Plant.
Concentrate Supply Strategy and Cost Forecast
To support a Merchant Project Piedmont would purchase spodumene concentrate from the open market and have
it delivered to Kings Mountain, North Carolina via the Port of Charleston. Piedmont has engaged in preliminary
discussions with several current spodumene concentrate producers in Australia, as well as engaged with projects
under development in South America and Europe who could be potential suppliers to the Merchant Project.
Benchmark Mineral Intelligence forecasts spodumene concentrate supply to increase from 195,300 tonnes (LCE
basis) in 2020 to up to 517,500 tonnes (LCE basis) in 2025. Of this increase, 52% (167,700 t LCE) is expected to
come from existing operators.
Additionally, according to Benchmark, global spodumene supplies could reach up to 690,000 t/y LCE by 2030.
Based on Benchmark’s latest supply, demand and cost analysis, a long-run incentive price of $564/tonne (adjusted
for freight to US east-coast) would be adequate to support the introduction of further volumes beyond this point.
Benchmark states that the diversification of cathode supply outside Asia is expected to necessitate more regional
lithium conversion facilities capable of refining various lithium feedstocks. The emergence of new non-integrated
lithium feedstock suppliers provides a foundation for these facilities.
Benchmark forecasts modest price recovery for spodumene concentrate beginning in 2023 before settling to a
long-term price of $564/t (Real). Piedmont has assumed Benchmark prices plus an average of US$75/t for delivery
of spodumene concentrate to Kings Mountain, NC.
13Figure 7 –Spodumene Concentrate Price Forecast 2011-2040 (FOB Australia) (Benchmark)
1.8 Project Schedule
A preliminary schedule was prepared as part of a PFS level execution plan. At the PFS level of project detail schedule
development is limited to high level activities including feasibility study, detailed engineering, procurement of long
lead items, critical contract formation and award, construction, and pre-operational testing activities. Key milestones
from the PFS level schedule are presented in Table 9.
Table 9: Chemical Plant Milestone Project Schedule
Milestone Description Milestone Date
Start Chemical Plant Permitting March 2020
Start Chemical Plant DFS July 2020
Air Permit Approval November 2020
Other Construction Permit Approval November 2020
Complete Chemical Plant DFS April 2021
Financial Investment Decision (“FID”) June 2021
Start Detailed Design Engineering June 2021
Award Long Lead Equipment September 2021
Start Construction March 2022
Engineering Completion April 2022
Pre-Operational Testing Start December 2022
Mechanical Completion April 2023
Pre-Operational Testing Completion May 2023
Commissioning Start May 2023
1.9 Marketing
Lithium Market Outlook
Benchmark Mineral Intelligence (“Benchmark”) reports that an excess lithium chemical and spodumene concentrate
supply to continue into 2020. Nevertheless, oversupply will reduce on 2019 levels due to more conservative
production and expansion strategies from existing producers.
No new lithium chemical supply is expected in 2020, with modest increases (14,000 t) expected in 2021. Benchmark
expects supply surplus to reduce through to 2022, with the market set to move into structural deficit from 2023
onwards. The outbreak of COVID-19 has had a major impact across all market segments, with global macroeconomic
pressures expected to hinder growth levels into 2021. The global EV penetration rate for 2020 has been revised
down from 3.2% to 2.7%. However, the Benchmark base case forecasts growth in lithium demand at a 20%
compound annual growth rate (“CAGR”) rate over the next 10 years.
Benchmark additionally forecasts the base case for EV demand growth at a CAGR of 28.9% over the coming 10 years,
accounting for COVID-19 impacts.
14Figure 8 – Growth in EV Demand 2015-2040 (Benchmark Mineral Intelligence)
Benchmark forecasts a structural deficit in lithium supply beyond 2023. Existing supply plus probable and possible
new capacity does not meet demand forecasts from 2028 onwards.
Figure 9 –Lithium Market Balance (tonnes LCE) Showing Structural Deficits from 2023 Onwards (Benchmark)
Figure 10 –Lithium Hydroxide Market Balance 2018-2030 (Benchmark)
Importantly for Piedmont, supply deficits for lithium hydroxide are expected to exceed (430,000 t/y) by 2030.
15Pricing Forecasts
Benchmark forecasts lithium hydroxide prices to recover starting in 2023 before settling to a long-term incentive
price of US$12,910/t (Real).
Figure 11 –Battery Grade Lithium Chemical Price Forecast 2011-2040 (Benchmark)
Piedmont has carried the Benchmark lithium hydroxide price forecasts in the PFS economic model. Importantly, it
is noteworthy that prices for lithium hydroxide imports into South Korea from China remain above US$14,000/t, well
above prevailing price forecasts, with increasing volumes. These values currently represent greater than 80% of the
lithium imports to South Korea.
Figure 12 –International Trade Statistics for South Korean Lithium Imports (courtesy Infinity Lithium)
Market Strategy
Piedmont is focused on establishing strategic partnerships with customers for battery grade lithium hydroxide with
emphasis on a customer base which is focused on EV demand growth in North America and Europe. Piedmont will
concentrate this effort on these growing EV supply chains, particularly in light of the growing commitments to US
battery manufacturing by groups such as Tesla, SK Innovation, LG, Volkswagen and others.
16Piedmont’s target customers are automakers and battery manufacturers with operating, under construction, or
planned battery manufacturing and electric vehicle assembly capacity in the United States and Europe. Piedmont
has engaged in extensive confidential discussions with Japanese and Korean battery makers with announced
expansion plans into the US market. Offtake discussions continue with these battery companies and their cathode
suppliers. Additional conversations with global car manufacturers with US based electric vehicle assembly
capability have also been initiated.
Initial samples from the Company’s lithium hydroxide bench-scale testwork program will be delivered to prospective
customers upon completion at SGS labs, and the Company will enhance its sales and marketing capability through
recruitment of marketing leadership positions in the coming months.
Product Specifications
The flowsheet developed in the PFS targets the product specification shown in Table 10 for high purity battery quality
lithium hydroxide monohydrate. This table also compares the proposed product specification against published
example battery quality specifications from Livent and Ganfeng Lithium. In addition, the typical product quality
values for Ganfeng are reported. The difference between higher and lower quality product relates to the tolerable
impurity levels. The flowsheet development has considered impurity removal and product purification stages to
achieve these targets.
Piedmont expects to negotiate the required specification when setting off-take agreements with customers.
Table 10: Battery Grade Lithium Hydroxide Target and Example Specifications
Piedmont Livent
Ganfeng Lithium
Target Example
Parameter Units
Reported as
Battery Grade Battery Grade Battery Grade
Typical
LiOH wt% min 56.5 56.5 56.5 56.5
LiOH.H2O wt% min 99.0 99.0 - -
CO2 wt% max. 0.35 0.35 0.5 0.3
Cl wt% max. 0.002 0.002 0.002 0.0012
SO4 2-
wt% max. 0.01 0.01 0.01 0.002
Ca ppm max. 15 15 15 10
Fe ppm max. 5 5 5 3
Na ppm max. 20 20 20 15
Al ppm max. 10 10 10 2
Cr ppm max. 5 5 - -
Cu ppm max. 5 5 5 2
K ppm max. 10 10 10 5
Mg ppm max. - - 10 2
Mn ppm max. - - 5 3
Ni ppm max. 10 10 10 3
Pb ppm max. - - 5 2
Si ppm max. 30 30 30 15
Zn ppm max. 10 10 10 2
CO3 2-
wt% max. - - - -
Insoluble in H2O wt% max. - - - -
Heavy metals as Pb ppm max. 10 10 - -
Acid insolubles wt% max. 0.01 0.01 0.01 0.005
171.10 PFS Economics
Modeling Assumptions
A detailed project economical model was completed by the Company as part of the PFS. The Merchant Project
economics include the following key assumptions.
Capital and operating costs are in accordance with technical study outcomes
Ramp-up is based on a 24-month time frame to nameplate production
Financial modeling has been completed on a monthly basis, including estimated cash flow for construction
activities and project ramp-up.
Pricing information for lithium hydroxide sales and spodumene concentrate supply are based on long term
forecasts provided by Benchmark with an effective date of end of Q1 2020.
North Carolina state corporate taxes are 2.5%
Federal tax rate of 21% is applied and state corporate taxes are deductible from this rate
Effective base tax rate of 22.975%
No credit is taken for byproduct sodium sulfate or aluminosilicate sales in the PFS
Depreciation in the chemical plant is based on Asset Class 28.0 – Mfg. of Chemical and Allied Products in Table
B-1 using GDS of 5 years with the double declining balance method.
Bonus depreciation of 80% has been applied based on the bonus depreciation allowance in the Tax Cuts and
Jobs Act assuming a place in service date of the Mine/Concentrator and chemical plant by December 31, 2023.
Sensitivity Analysis
The Chemical Plant has been designed to a PFS level of detail with a capital and operating accuracy of ± 25%. Key
inputs into the PFS have been tested by capital cost, operating cost, and price sensitivities (Figure 13 and Figure 14).
Although spodumene concentrate is an input cost to lithium hydroxide, for the purpose of the sensitivity analysis
the cost of spodumene is flexed with the price of lithium hydroxide. This is based on the assumption that concentrate
and hydroxide prices will trend together.
Figure 13– Net Present Value Sensitivity Analysis for Piedmont’s Merchant Project
18Figure 14 – Internal Rate of Return Sensitivity Analysis for Piedmont’s Merchant Project
19INTEGRATED
SCOPING
STUDY
UPDATE
202.0 INTEGRATED SCOPING STUDY
The Integrated Project Scoping Study is based on the Company’s Mineral Resource Estimate reported in June 2019,
of 27.9 Mt at a grade of 1.11% Li2O and the By-Product Mineral Resource Estimates comprising 7.4 Mt of quartz, 11.1
Mt of feldspar and 1.1 Mt of mica reported in July 2019.
The Integrated Project Scoping Study contemplates a 25-year project life, with the downstream lithium hydroxide
chemical plant commencing concurrently with mining operations. The ramp-up period for Chemical Plant
operations is assumed to achieve nameplate capacity after a 24-month ramp-up period. The mining production
target is approximately 25.6 Mt at an average run of mine grade of 1.11% Li2O (undiluted) over the 25-year project
life. Table 11 provides a summary of production and cost figures for the Integrated Project.
Table 11: Integrated Project – Life of Mine (“LOM”) Unit Estimated Value
Physical – Mine/Concentrator
Mine life years 25
Steady-state annual spodumene concentrate production t/y 160,000
LOM spodumene concentrate production t 3,805,000
LOM quartz by-product production t 1,920,000
LOM feldspar by-product production t 2,795,000
LOM mica by-product production t 275,000
LOM feed grade (excluding dilution) % 1.11
LOM average concentrate grade % 6.0
LOM average process recovery % 85
LOM average strip ratio waste:ore 10.4:1
Physical – Lithium Chemical Plant
Steady-state annual lithium hydroxide production t/y 22,720
LOM lithium hydroxide production t 554,600
LOM concentrate supplied from Piedmont mining operations t 3,655,000
Chemical Plant life years 25
Operating and Capital Costs – Integrated Project
Average LiOH production cash costs using self-supplied concentrate US$/t $3,712
Mine/Concentrator – Direct development capital US$M $106.2
Mine/Concentrator – Owner’s costs US$M $11.3
Mine/Concentrator – Land acquisition costs US$M $28.3
Mine/Concentrator – Contingency US$M $22.1
Mine/Concentrator – Sustaining and deferred capital US$M $147.9
Mine/Concentrator – Working Capital US$M $20.0
Chemical Plant - Direct and indirect development capital US$M $292.3
Chemical Plant – Owner’s costs US$M $11.3
Chemical Plant – Contingency US$M $73.1
Chemical Plant – Working Capital US$M $27.5
Chemical Plant – Sustaining and deferred capital US$M $108.7
Financial Performance – Integrated Project – Life of Project
Average annual steady state EBITDA US$M/y $218
Average annual steady state after-tax cash flow US$M/y $179
Net operating cash flow after tax US$M $4,429
Free cash flow after capital costs US$M $3,563
After tax Net Present Value (NPV) @ 8% discount rate US$M $1,071
After tax Internal Rate of Return (IRR) % 26
Payback from Start of Operations years 3.2
21Notable changes in this Scoping Study update have been made compared with the prior scoping study published
in August 2019. Importantly, it is noted that most of the impact to project NPV is attributable to more conservative
product price assumptions compared with prior studies, whereas changes to capital and operating costs contribute
lesser impacts. Changes include:
Total LiOH production has increased life-of-project by over 66,000 tons due to:
o Revision in the ramp-up assumption to nameplate capacity from 4 years to 2 years; and,
o Construction of the Integrated Project in a single phase which brings forward first hydroxide
production by 24 months.
Models now consider production of some technical grade lithium hydroxide.
Total spodumene concentrate consumed in conversion has increased by over 564,000 tonnes life-of-mine.
Capital and operating costs for the Chemical Plant have been updated using PFS outcomes.
Product pricing assumptions have been updated using current market forecasts from Benchmark Minerals
Intelligence (“Benchmark”).
Figure 15 – Impact to NPV8 of Integrated Project Due to Various Economic Model Changes
* Impacts associated under the category CAPEX are inclusive of total initial capital cost, changes to sustaining capital,
and a more conservative view of timing of construction cash flow.
2.1 Scoping Study Overview
Piedmont holds a 100% interest in the Integrated Project located within the TSB and along trend to the Hallman
Beam and Kings Mountain mines, which historically provided most of the western world’s lithium between the 1950s
and the 1980s. The TSB has been described as one of the largest lithium regions in the world and is located
approximately 25 miles west of Charlotte, North Carolina.
Portions of the property controlled by Piedmont were originally explored by Lithium Corporation of America which
was eventually acquired by FMC Corporation (now Livent Corporation). A Canadian exploration company, North
Arrow Minerals, completed a 19-drill hole, 2,544 meter exploration drill program on the property in 2009-2010.
The Company has reported Mineral Resource Estimates for the Company’s Core and Central properties. Piedmont
has completed 351 drill holes and these properties totaling 55,110 meters to date spanning four drill campaigns.
As at March 31, 2020, Piedmont controlled approximately 2,131 acres, of which Piedmont owns approximately 391
acres of land and associated mineral rights in fee simple and has entered into exclusive option agreements with
local landowners, which upon exercise, allow Piedmont to purchase (or in some cases long-term lease)
22approximately 1,740 acres of surface property and the associated mineral rights from the private landowners. In
addition, the Company also owns a property in Kings Mountain, North Carolina, comprising approximately 61 acres
for the site of the Company’s planned Chemical Plant.
Figure 16 - Piedmont’s location within the TSB
2.2 Scoping Study Consultants
The Integrated Project Scoping Study combines the information from the Chemical Plant PFS with
Mine/Concentrator information and assumptions provided by a range of independent consultants, including the
following consultants who have contributed to key components of the Mine/Concentrator.
Table 12: Scoping Study Consultants
Consultant Scope of Work
Primero Group Limited Concentrator process engineering and infrastructure
SGS Lakefield Metallurgical testwork
Marshall Miller and Associates Mine design and scheduling
CSA Global Pty Ltd Resource estimation
HDR Engineering, Inc. Permitting, environment, and social studies
Johnston, Allison, and Hord Land title and legal
Benchmark Mineral Intelligence Lithium Products Marketability
CSA Global Pty Ltd By-Products Marketability
232.3 Mineral Resource Estimates
On June 25, 2019 the Company announced an updated Mineral Resource Estimate (“MRE”) prepared by independent
consultants CSA Global Pty Ltd (“CSA Global”) in accordance with JORC Code (2012 Edition). The total Mineral
Resources for reported by Piedmont for its Core and Central properties located within the TSB are 27.9 Mt grading
at 1.11% Li2O.
Table 13: Piedmont Mineral Resource Estimate (0.4% cut-off)
Core property Central property Total
Resource
Category Tonnes Grade Tonnes Grade Tonnes Grade Li2O LCE
(Mt) (Li2O%) (Mt) (Li2O%) (Mt) (Li2O%) (t) (t)
Indicated 12.5 1.13 1.41 1.38 13.9 1.16 161,000 398,000
Inferred 12.6 1.04 1.39 1.29 14.0 1.06 148,000 366,000
Total 25.1 1.09 2.80 1.34 27.9 1.11 309,000 764,000
An important feature of the Core property MRE, is that 74% or 18.6 Mt is located within 100 meters of surface. Table
14 shows the details of the MRE with regards to depth from surface.
Table 14: Depth from Surface for the Core Mineral Resource Estimate (25.1 Mt @ 1.09% Li2O)
Depth Percentage of Cumulative Tonnes Cumulative % of
Tonnes (Mt)
(from surface) (m) Resource (%) (Mt) Resource
0 - 50 8.7 35 8.7 35
50 - 100 9.9 39 18.6 74
100 - 150 5.7 23 24.3 97
150 + 0.8 3 25.1 100
On July 31, 2019 the Company announced updated MRE’s for by-products quartz, feldspar and mica. The results are
shown in Table 15. The by-product MRE’s have been prepared by independent consultants, CSA Global and are
reported in accordance with the JORC Code (2012 Edition). The economic extraction of by-product minerals is
contingent on Piedmont’s economic extraction of lithium mineral resources. Accordingly, the by-product Mineral
Resource Estimates are reported at a 0.4% Li2O cut-off grade, consistent with the reported lithium MRE.
Table 15: Mineral Resource Estimates – Piedmont Core Property
Li2O Quartz Feldspar Mica
Tonnes
Category Grade Tonnes Grade Tonnes Grade Tonnes Grade Tonnes
(Mt)
(%) (t) (%) (Mt) (%) (Mt) (%) (Mt)
Indicated 12.5 1.13 141,000 30.0 3.75 44.4 5.55 4.5 0.56
Inferred 12.6 1.04 131,000 28.7 3.61 44.4 5.58 4.4 0.56
Total 25.1 1.09 272,000 29.3 7.36 44.4 11.13 4.5 1.12
Figure 17 shows the relative position of the Core and Central resources, resource constraining shells, and exploration
targets.
24Figure 17 - Plan View of Core Property Showing Drill Hole Locations, Resource, and Resource Shell
2.4 Production Target
Pit optimizations were completed by Marshall Miller to produce a production schedule on an annual basis, resulting
in a total production target of approximately 3.8 Mt of spodumene concentrate, averaging approximately
160,000 t/y of spodumene concentrate over the 25-year mine life. This equates to an average of 1.15 Mt/y of ore
processed, totaling approximately 25.6 Mt of run-of-mine (“ROM”) ore at an average ROM grade of 1.11% Li2O
(undiluted) over the 25-year mine life.
The Integrated Project Scoping Study assumes a lithium Chemical Plant production life of 25 years, commencing in
year 1 of the Integrated Project. It is assumed that Mine/Concentrator operations will commence about 90 days in
advance of Chemical Plant operations to build initial spodumene concentrate inventory. Some third party
spodumene concentrate sales have been allowed for during the ramp-up phase of the Chemical Plant operations.
Of the total production target of 3.8 Mt of concentrate, approximately 0.14 Mt will be sold to third parties during
25chemical plant ramp-up and approximately 3.65 Mt will be supplied to Piedmont’s Chemical Plant for conversion
into lithium hydroxide, resulting in a total production target of approximately 554,600 t of lithium hydroxide,
averaging approximately 22,120 t/y of lithium hydroxide over the 25-year production life.
Of the 554,600 t production target 535,900 t are expected to be sold as battery quality lithium hydroxide with
18,700 t sold as technical quality based on the estimated ramp-up of the lithium chemical plant.
The Integrated Project Scoping Study assumes that approximately one-third of the by-product potential will be
converted to product based on processing spodumene flotation tailings with approximately two-thirds of potential
by-products reporting to waste via dense medium separation tailings. This results in production targets of 1.9 Mt of
quartz concentrate, 2.7 Mt of feldspar concentrate, and 0.3 Mt of mica concentrate over the life of mine. If market
conditions support additional sales potential then Piedmont will evaluate reprocessing of dense medium separation
tailings to produce additional byproduct concentrates.
There remains significant opportunity to increase the mine life beyond 25 years or to increase annual capacity of the
Integrated Project by discovery of additional resources within the TSB within a reasonable trucking or conveying
distance to the proposed concentrator.
2.5 Mining
Independent consultants Marshall Miller and Associates used SimSched™ software to generate a series of economic
pit shells using the updated Mineral Resource block model and input parameters as agreed by Piedmont. Overall
slope angles in rock were estimated following a preliminary geotechnical analysis that utilized fracture orientation
data from oriented core and downhole geophysics (Acoustic Televiewer), as well as laboratory analysis of intact rock
strength. The preliminary geotechnical assessment involved both kinematic and overall slope analyses utilizing
Rocscience™ modeling software.
Overall slope angles of 45 degrees were assumed for overburden and oxide material. Overall slope angles of 53
degrees were estimated for fresh material which includes a ramp width of 30 meters. Production schedules were
prepared for the Integrated Project based on the following parameters:
A targeted run-of-mine production of 1.15 Mt/y targeting a process plant output of about 160,000 t/y of 6.0%
Li2O spodumene concentrate from the Core property
The Central property production target was based on a process plant throughput of about 900,000 t/y to
produce about 160,000 t/y of 6.0% Li2O spodumene concentrate
By-product output of 86 kt of quartz, 125 kt of feldspar, and 13 kt of mica concentrate annually
About 75% of average annual production realized in the first year of operations accounting for commissioning
and ramp-up
Mining dilution of 5%
Mine recovery of 95%
Concentrator processing recovery of 85%
A mining sequence targeting maximized utilization of Indicated Mineral Resources at the front end of the
schedule
The results reported are based upon a scenario which maximizes extraction of Indicated Resources in the early years
of production. Indicated resources represent 100% of the tonnes processed in years 1-3 of operations. The results
shown assume that the Core property is mined from year 1-20 with Central property operations commencing in year
21. Table 16 shows the production target.
Table 16: Total Production Target for Piedmont Properties
ROM Tonnes Waste Tonnes Stripping ROM Li2O Tonnes of
Production
Property Processed Mined Ratio Diluted Grade Concentrate
Years
(kt) (kt) (W:O t:t) (% ) (kt)
Core 22,616 227,200 10.0 1.03 1-20 3,284
Central 2,951 38,790 13.1 1.25 21-25 521
Total 25,567 265,990 10.40 1.05 1-25 3,805
26The mine design is based on an open pit concept assuming the following wall design configuration for oxide and
overburden material in this Scoping Study:
Batter face angle of 45 degrees
Batter height of 10 vertical meters
Berm width of 0 meters
Overall slope angle of 45 degrees
The following wall design configuration was used for fresh material in this Scoping Study:
Batter face angle of 75 degrees
Batter height of 24 vertical meters (80 ft.) for final wall
Berm width of 9.5 meters (30 ft.) for final wall
Overall slope angle of 53 degrees for final wall, which includes a ramp width of 30 meters (98 ft.)
Figure 18 – Representation of the pit wall design based on wall design configuration estimates
The pit wall design parameters indicated above are based on the results of a preliminary geotechnical assessment
that utilized available fracture orientation measurements from exploration drilling and downhole geophysical
logging, along with laboratory results for intact rock strength. The preliminary geotechnical analysis focused on
assessment of fresh rock material. The pit wall dimensions indicated above are based on a final wall configuration.
Working benches during mining are expected to be on the order of 12 meters high and 8 meters wide, with a batter
angle of 75-degrees. The current mine plan takes into consideration the nature of the Mineral Resource and allows
for smaller internal bench dimensions. The current pit wall dimensions are considered representative of average
conditions. More detailed pit wall geotechnical assessment in specific areas is to be completed during a future DFS.
2.6 Concentrate Metallurgy
2019 Composite Testwork Program
Piedmont engaged SGS laboratories in Lakefield, Ontario to undertake testwork on variability and composite
samples. Dense Medium Separation (“DMS”) and flotation Locked-Cycle Tests (“LCT”) produced high quality
spodumene concentrate with a grade above 6.0% Li2O, iron oxide below 1.0%, and low impurities from composite
samples. Table 17 shows the results of composite tests on the preferred flowsheet which were previously announced
on July 17, 2019. The feed grade of the composite sample was 1.11% Li2O.
27Table 17: 2019 Dense Medium Separation and Locked Cycle Flotation Test Results (Composite Sample 1)
Concentrate CaO+
Fe2O3 Na2O K 2O P 2O 5
Sample Grade Li2O MgO +
(%) (%) (%) (%)
(%) MnO (%)
Dense Medium Separation 6.42 0.97 0.56 0.45 0.51 0.12
Locked-Cycle Flotation 6.31 0.90 0.68 0.52 1.25 0.46
Combined Concentrate 6.35 0.93 0.63 0.49 0.96 0.32
The composite samples were prepared to approximate the average lithium grade of Piedmont’s Mineral Resources.
Overall lithium recovery during testwork for the preferred flowsheet was 77% at a grade of 6.35% Li2O. Simulations
based on the testwork results support an overall plant design recovery of 85% when targeting a 6.0% Li2O
spodumene concentrate. Further optimization will be undertaken in a future feasibility-level pilot testwork program.
Figure 19 shows photographs of the coarse and fine DMS concentrates produced.
Figure 19 - Coarse and fine DMS concentrates produced from Piedmont composite samples
Bench-Scale Lithium Hydroxide Testwork Sample Preparation
To support lithium conversion testwork, Piedmont composited approximately 1.75 tonnes of pegmatite from drill
core. This composite was collected from early, middle and late years of the deposit and resulted in a head grade of
1.25% Li2O and 0.38% Fe2O3.
Overall, the testwork program produced 122 kg of spodumene concentrate including 105 kg of DMS product and
17 kg of flotation product. This concentrate is now being progressed through a lithium hydroxide testwork program
at SGS labs with results expected in Q2 2020. Table 18 presents the testwork results previously announced on May
13, 2020.
Table 18: Combined DMS and Locked Cycle Flotation Testwork Results (Composite Sample)
Wt. Assay (%) Distribution (%)
Product
(%) Li2O Fe2O3 Li2O Fe2O3
DMS Concentrate 7.5 6.30 0.93 38.9 13.8
Flotation Concentrate 8.6 6.13 0.83 43.5 14.2
Combined Concentrate 16.1 6.21 0.87 82.4 28.0
2.7 By-Product Metallurgy
The production of bulk quartz and feldspar concentrates as byproducts from the spodumene locked-cycle flotation
tailings was investigated. Six (6) individual batch tests were conducted with the quartz and feldspar concentrates
being composited. The results of these tests that were previously announced on May 13, 2020 are provided in Table
19. Quartz samples were provided to a potential solar glass manufacturer and met customer specifications. Follow
up samples are planned.
28Table 19: Average Results of Locked Cycle Byproduct Tests (from Spodumene Concentrate Tailings)
Li2O SiO2 Al2O3 K 2O Na2O CaO MgO MnO P 2O 5 Fe2O3
Quartz Concentrate 0.02 99.0 0.32 0.04 0.11 0.01 0.01 0.01 0.01 0.01
Feldspar Concentrate 0.12 68.0 19.35 2.45 9.30 0.17 0.04 0.01 0.15 0.05
Mica Results (2018 MRL Program)
Piedmont engaged North Carolina State University’s Minerals Research Laboratory (“MRL”) in 2018 to conduct a
bench-scale testwork on samples obtained from the Company’s MRE within the Core Property for byproducts quartz,
feldspar, and mica. The objective of the testwork program was to develop optimized conditions for spodumene
flotation and magnetic separation for both grade and recovery which would then be applied to future testwork.
Summary mica concentrate data are shown in Table 20. Complete mica data were previously announced on
September 4, 2018. Further mica product optimization will be undertaken at SGS in future testwork phases.
Table 20: Bench Scale Mica Physical Properties Results
Parameter Unit Optimized Value
Particle Size Medium to Very Fine 40 – 325 Mesh
Bulk Density g/cm 3
0.681-0.682
Grit % 0.70-0.79
Photovoltmeter Green Reflectance 11.2-11.6
Hunter Value ± a [Redness(+) Greenness(-)] 0.27-1.25
Hunter Value ± b [Yellowness(+) Blueness(-)] 44.77-46.07
Mica quality is measured by its physical properties including bulk density, grit, color/brightness, and particle size.
The bulk density of mica by-product generated from Piedmont composite samples was in the range of 0.680-
0.682 g/cm3.
The National Gypsum Grit test is used mostly for minus 100-mesh mica which issued as joint cement compound and
textured mica paint. The specification for total grit for mica is 1.0%. Piedmont sample grit results were in the range
of 0.70-0.79. Color/brightness is usually determined on minus 100-mesh material. Several instruments are used for
this determination including the Hunter meter, Technedyne and the Photovoltmeter. The green reflectance is often
reported for micas and talcs. Piedmont Green Reflectance results were in the range of 11.2-11.6.
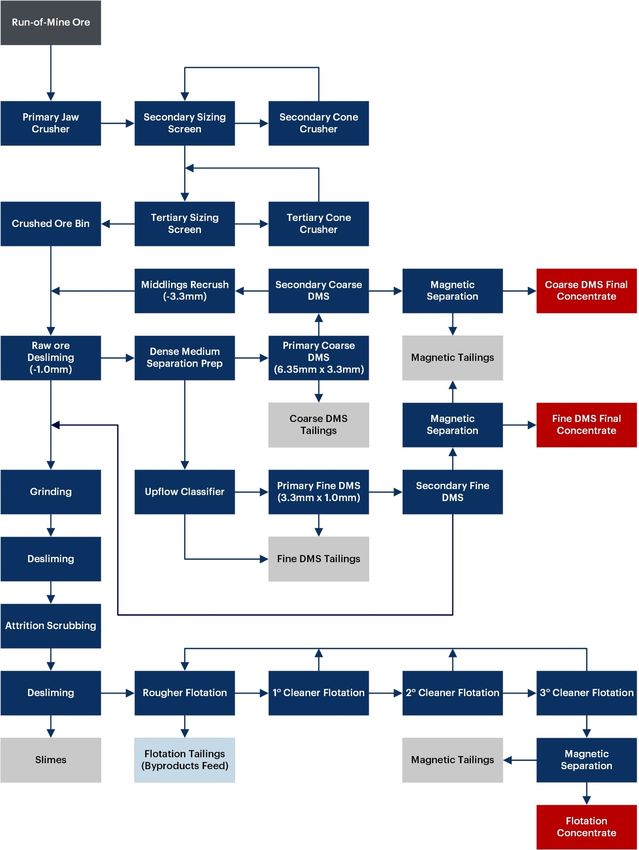
2.8 Concentrator Process Design
The concentrator process design is based on SGS composite testwork. The flowsheet will be optimized during future
DFS level pilot testwork. The basic process flow is shown schematically in Figure 20. Notably, DMS tailings and
flotation tailings will be processed separately with the DMS and flotation process water circulated separately within
the concentrator.
Final design trade-off studies to be undertaken during feasibility study include optimization of iron removal via a
combination of both ore sorting and magnetic separation as well as mica pre-flotation as a method of improving
overall spodumene recovery and product quality.
29You can also read