Emmanuel HACHE, Gondia Sokhna SECK, Marine SIMOËN - CRITICAL RAW MATERIALS AND TRANSPORTATION SECTOR ELECTRIFICATION: Iris
←
→
Page content transcription
If your browser does not render page correctly, please read the page content below
Working Paper 2019-3

CRITICAL RAW MATERIALS AND TRANSPORTATION
           SECTOR ELECTRIFICATION:
   A detailed bottom-up analysis in world transport

            BY Clément BONNET, Samuel CARCANAGUE,
       Emmanuel HACHE, Gondia Sokhna SECK, Marine SIMOËN
CRITICAL RAW MATERIALS AND TRANSPORTATION SECTOR ELECTRIFICATION / February 2019
This article received the financial support of the French National Research Agency (ANR) and is part of the
GENERATE (Renewable Energies Geopolitics and Future Studies on Energy Transition) Project. It also
receives funding from the French Environment & Energy Management Agency (ADEME) as part of a
project dedicated to lithium.
Authors
Dr Clément Bonnet, IFP Energies nouvelles: clement.bonnet@ifpen.fr
Samuel Carcanague, IRIS: carcanague@iris-france.org
Dr Emmanuel Hache, IFP Energies nouvelles (Project Leader): emmanuel.hache@ifpen.fr
Dr Gondia Sokhna Seck, IFP Energies nouvelles : gondia-sokhna.seck@ifpen.fr
Marine Simoën, IFP Énergies nouvelles : marine.simoen@ifpen.fr
The authors are very grateful to Amit Kanudia who has contributed to the TIAM-IFPEN model on behalf of his
company KANoRS through providing assistance. We are also very grateful to François Kalaydjian and Jerome
Sabathier for insightful comments and suggestions. The views expressed herein are strictly those of the
authors and are not to be construed as representing those of IFP Énergies Nouvelles and IRIS.
2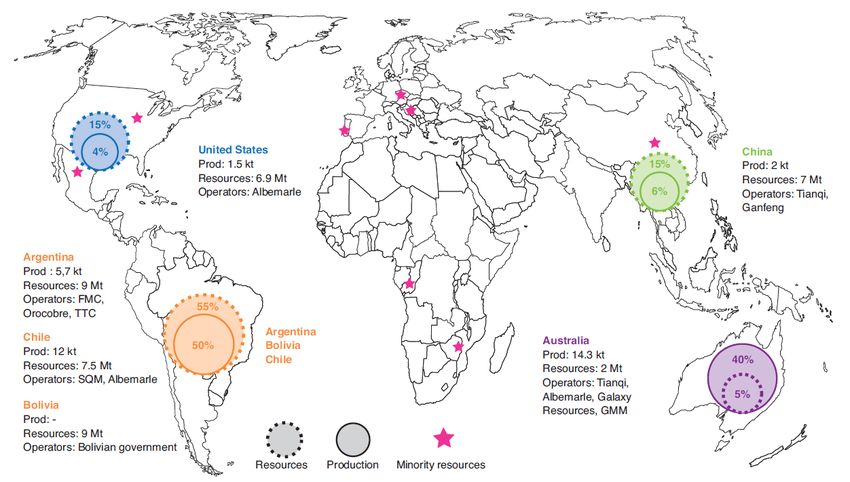
CRITICAL RAW MATERIALS AND TRANSPORTATION SECTOR ELECTRIFICATION / February 2019

ABSTRACT

The aim of this article is to study the impact of a massive diffusion of electric vehicles in the world
transportation sector on the lithium market. Lithium, like other strategic materials, has found new markets
in the context of the energy transition. Hence, the capacity of those strategic materials to supply these new
markets can be questioned. To achieve this goal, we have developed the first detailed global bottom-up
energy model, TIAM-IFPEN (Times Integrated Assessment Model-IFPEN) with an endogenous disaggregated
life-cycle inventories. It would clearly assess the dynamic criticality of strategic materials according to the
optimal technology paths with environmental and/or energy solicitations through different approaches:
geological, geopolitical, and economic towards a sustainable development. Four scenarios have been run
taking into account two climate scenarios (4°C and 2°C) with two shapes of mobility each: a high mobility
where we assume the impact of urban dispersal with a huge car dependence/usage, and a low mobility
where the idea of a sustainability in mobility is assumed. The penetration of electric vehicle (EV) at the global
level would push the demand of cumulated lithium but the results show us an absence of geological
criticality. Nevertheless, they have clearly highlighted other different forms of vulnerabilities, whether
economic, industrial, geopolitical or environmental. A discussion about the future risk factors applied to the
lithium market has been also done at a regional scale to analyse more in-depth the impact of the future
global fleet development on lithium market. Our study of this particular strategic material shows that the
model could be a useful decision-making tool for assessing future raw material market stresses along with
energy transition and could be extended to other critical raw materials for more efficient regional and
sectorial screening.

Keywords: World transportation; Electrification; Critical raw materials; Lithium; Bottom-up modelling

JEL Classification: Q42, R40, C61

                                                                                                             3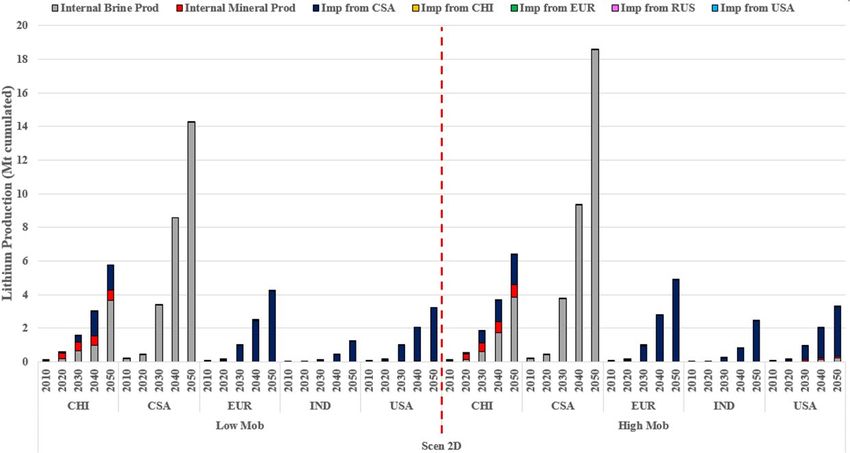
CRITICAL RAW MATERIALS AND TRANSPORTATION SECTOR ELECTRIFICATION / February 2019

I.        INTRODUCTION

Technology is often highlighted in energy transition dynamics at the international level,
but large uncertainties remain about the widespread diffusion of low-carbon
innovations [1-4]. The cost, the speed of adoption and the acceptance of technologies by
different stakeholders are thus fundamental parameters for drawing decarbonisation
trajectories. What is given as a certainty with all decarbonisation innovations is the
growing need for ores and refined metals [5-6]. A massive diffusion of renewables into
the world's energy mix could lead to new and unexpected interdependencies including
dependencies on critical materials, a new geopolitics of patents and the implementation
of a renewable diplomacy [7-8]. Despite the continuing policy focus on energy system
development and the many reports and books written on the topic, the extension of the
scope beyond purely energy-oriented issues to the dynamic impact of raw materials
related to the energy transition has been seldom targeted in energy modelling analyses.

          1.1 Critical assessment methods for raw materials

As an heterogeneous field of research, raw materials supply risk and criticality have
been widely discussed since the past decade [9-16]. An extensive part of the first
literature was devoted to rare-earth elements criticality [17-25] although for few years
increasingly number of metals are in the spotlight, even including non-ferrous-metals
[6]. Resource criticality is difficult to define as it depends on the scale of the analysis:
micro-level (industrial sector or company), macro-level (country) or global level.
Regarding transition technologies, Moss et al. [13] have showed for example the
potential limiting role of metals in the specific deployment of the European Union's
Strategic Energy Technology Plan (SET-Plan, 2013) when Roelich et al. [26] have tried to
assess the material criticality of infrastructure in a global low-carbon electricity scenario
focusing on neodymium. At the country level, Viebahn et al. [27] assessed the need of
critical minerals to shift the German energy system towards a high share of renewable
sources. Logically, according to the scope and purpose of the work, conclusions may
differ.

                                                                                           4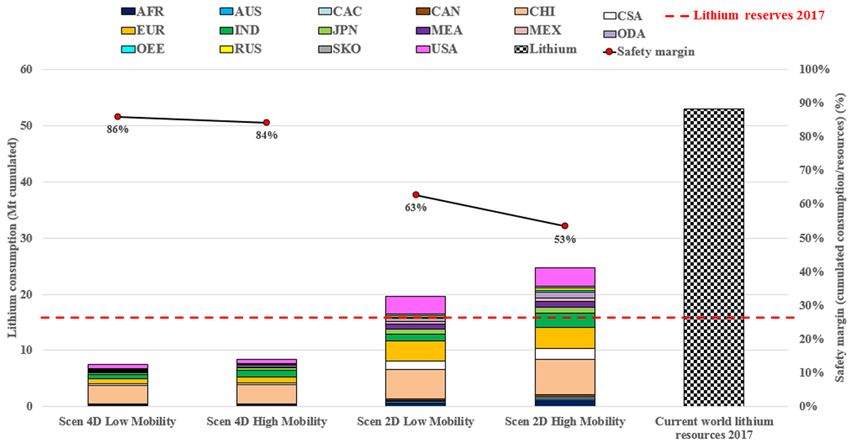
CRITICAL RAW MATERIALS AND TRANSPORTATION SECTOR ELECTRIFICATION / February 2019

One of the major challenges is then the development of criticality assessment methods.
The dimensions of interest considered in criticality assessments [28] are usually
vulnerability and supply risk relying on economic, geological or technical concerns [10-
11,29] sometimes extended to cope with environmental impacts [30] or social
implications     [31-32].     The    European       Commission       (EC)    criticality    assessment
methodology [33], based on the economic value of the resource and its supply risk for
the EU, is an illustration of such type of assessment methodology. These assessment
methods, which have been applied to a wide range of raw materials, are mostly snapshot
analysis in time with determined and relevant indicators [34-38]. A time evolution of
these indicators should be one of the main future research focus [30]. Other methods
relied on past supply disruption events [39] and possible future growth with constant
past trends [40] or without including detailed studies of the development of emerging
technologies, GDP forecasts, evolution and interactions between all sectors of the
economy globally with stringent environmental scenarios [41-42]. Few methods have
been also developed in order to assess the dynamic material criticality over time with
Life Cycle Assessment (LCA) approaches combined with other models such as a hybrid
LCA-IO (Life Cycle Assessment combined with the results from a global Input-Output
model) [43], or a hybrid LCI-TIAM ((Life Cycle Inventories combined with the results
from the bottom-up model TIAM 1) [44] or a mathematical algorithm [26]. Various
studies have been already conducted with the TIAM model to analyse different climate
change mitigation policies by the international modelling community – such as in power
supply with the role of nuclear energy in long-term climate scenarios [45-46] or the
evolution of energy supply investment in a specific region [47-50], effort sharing among
countries for global climate change mitigation [51-55], transportation [56-58].

In this paper, unlike the abovementioned articles, an endogenous integration of raw
materials content into our detailed bottom-up model, TIAM-IFPEN, has been
implemented in order to allow them to interact endogenously with the different
scenarios which could be considered. So, we have developed the first detailed global

1 TIMES Integrated Assessment Model, a technology rich bottom-up cost optimization belonging to the MARKAL
family model

                                                                                                        5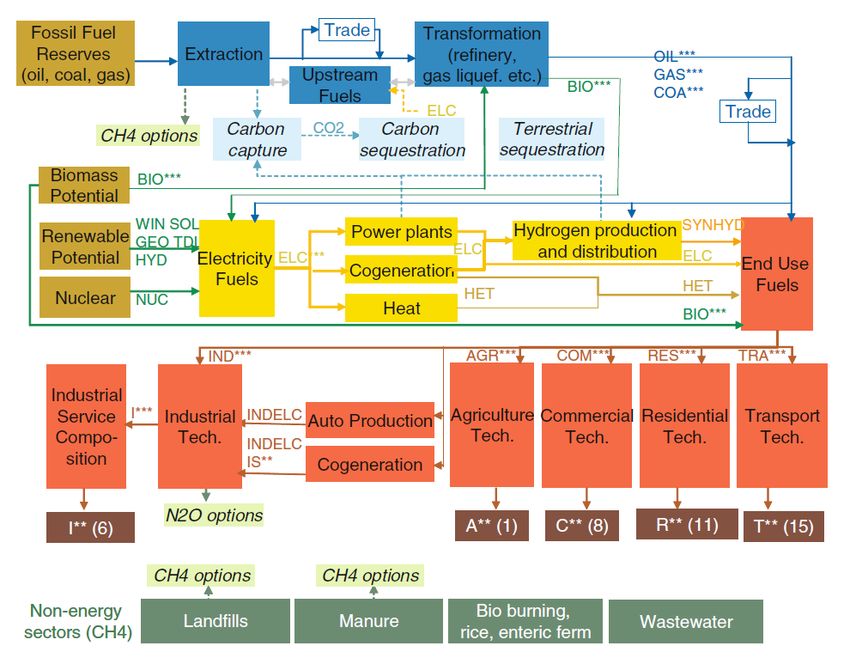
CRITICAL RAW MATERIALS AND TRANSPORTATION SECTOR ELECTRIFICATION / February 2019

bottom-up energy model with an endogenous disaggregated life-cycle inventories. This
model should be able to evaluate the dynamic criticality of strategic materials according
to the optimal technology paths while accounting for environmental and/or energy
solicitations through different approaches: geological, geopolitical, economic, all being
developed for ensuring a sustainable development. There is, therefore, a dual advantage:

    -    The capacity to endogenously account for the impact of raw material resource
         constraints (resource availability, extraction cost), technical constraints (physical
         balances, availability factors, etc.) and non-technical constraints (market
         penetration limits, policy scenarios, environmental specifications, etc.) on the
         demand satisfaction or the roll-out of emerging low carbon technologies
    -    Dynamic assessment of raw materials criticality

This bottom-up energy model, TIAM-IFPEN, would be useful as a good decision-making
tool for analysing the dynamics of the raw materials demand taking into account the
future developments of the transport and power sectors through stringent
environmental scenarios.

         1.2 Future structural change of the transport sector: Study case
         of the lithium criticality

With more than 3 million electric vehicles (EV) 2 in circulation in the world in 2017
according to the Global EV 2018 [59] survey, 2017 continued the trend towards
electrification that has existed since 2010. The market of electric passenger light-duty
vehicles has increased 10-fold between 2011 and 2016 [59], resulting in a significant
increase of the lithium demand for the battery sector (+20% between 2012 and 2017
considering USGS database). In addition, more and more significant policies have been
implemented at national scale, especially in China, the European Union and India to
accelerate the deployment of electric cars on a global scale. Thus, the structure of the

2 Electric vehicles include battery electric vehicles (BEVs), plug-in hybrid electric vehicles (PHEVs) and fuel-cell
electric vehicles (FCEVs). In this article, our transport module covers passenger light duty vehicles (PLDVs), Light,
Medium and Heavy Commercial Vehicles (LCVs, MCVs and HCVs), Buses, Minibuses and two- and three-wheelers.

                                                                                                                   6
CRITICAL RAW MATERIALS AND TRANSPORTATION SECTOR ELECTRIFICATION / February 2019

transportation sector is evolving and changing rapidly since few years. This structural
evolution will have a strong impact on the lithium market.

Previous works have already been conducted on lithium criticality, mainly focused on
estimating the future lithium demand [60-63] with a large variety of time horizons from
short-term [64] to mid-long term, until 2100 in Yaksic and Tilton (2009) [61]. Future
lithium volumes are mainly depending on the EV scale deployment. The evolution of the
EV stock is mostly based on author’s assumptions or scenarios borrowed from the
literature. For example, Speirs et al. [60] based their estimation on the IEA Blue Map
scenarios and used different material intensity to estimate the lithium demand. Most of
these works underlined the potential absence of deep lithium depletion in the future in
regards to its current resources or reserves. Yaksic and Tilton [61] had for example
previously addressed the threat of lithium depletion and concluded that there was
possibly no issue on lithium supply till the end of the century, even in a 100% electric
scenarios by using the cumulative availability curve 3. Other research papers have laid
emphasis on lithium criticality with larger discussions than resources or reserves
constraints [65-67] insisting for example on the impact of recycling [68-69] or batteries
technologies [70], including more and more economic concerns such as economies of
scale [71]. Market organization and lithium pricing was studied by Maxwell P. [72]
which linked the past lithium pricing transparency and competitiveness in regard to the
industry status and the number of major players. Geopolitical dimension was also
discussed through global material flow analysis (MFA) [73-74] focused exclusively on
China [75-76]. South America, and in particular Bolivia, which are the largest resources
owner, were also widely spotlighted by literature as lithium critical important factors
[77-78], just as China, the first lithium consumer [79]. Nonetheless lithium is also
strategic regarding regions with potential future large demand and no important
resources, such as Europe, where recycling and substitution impacts were also analysed
by Miedema and Moll [80].

3The cumulative availability curve shows the quantities of a mineral commodity that can be recovered under current
conditions from existing resources at various prices.

                                                                                                                7
CRITICAL RAW MATERIALS AND TRANSPORTATION SECTOR ELECTRIFICATION / February 2019

Finally, none of these works have considered a global three-dimensional approach
taking into account geological (availability and affordability of the resources),
geopolitical (supply risks) and economic (different regionalized growth) criteria with
the transport evolution and global environmental constraints. The methodology
developed in this paper and applied to the case of lithium will allow filling the gap in the
scientific research in raw material criticality. Moreover, when comparing the lithium
market to the definition of strategic metals given by Graedel et al. [30] and completed by
Helbig et al. [11]: (i) The metal is used in many industrial sectors; (ii) It is difficult to find
in the short term a suitable substitute for this metal for one or more industrial
applications; (iii) The number of industrial applications using this metal is broad and
increases over time; (iv) The metal is used in dispersing applications with limited
recycling potential; (v) The metal has a great economic value; (vi) The metal production
and reserves are geographically concentrated; (vii) The metal production could damage
human health and/or ecosystem; Lithium meets 5 out of the 7 above-mentioned criteria.
As a strategic metal for battery production, it is quite representative of the new
challenges related to the energy transition due to the potential for electrification of
vehicles worldwide, the concentration of reserves in a limited number of countries, the
limited recycling potential and the oligopolistic industrial structure of its market [81]. It
explains why this paper is focusing on the impact of a future increasing electrification of
the transport sector on a regionalized lithium demand.

With a high regional breakdown of the world, our TIAM-IFPEN model is particularly well
suited to develop foresight exercises by 2050 using an integrated approach. Such an
approach allows to understand and discuss the economic, technological, environmental
and geopolitical factors that can influence developments in the global transport sector,
on which the lithium market may depend heavily. The rest of the paper is organized as
follows : Section 2 describes the methodology, the overall structure of the TIAM-IFPEN
bottom-up model, and the specific features and assumptions engaged for a detailed raw
lithium criticality analysis; Finally, Section 3 presents our main results and related
comments on the lithium market in response to climate constraints at global and
regional level, to lithium resource availabilities and the implications of future
mainstream in road passenger transport mobility, while Section 4 summarizes our

                                                                                                8
CRITICAL RAW MATERIALS AND TRANSPORTATION SECTOR ELECTRIFICATION / February 2019

findings and provides policy recommendations regarding risks assessment of the lithium
market.

II.      METHODOLOGY

TIAM-IFPEN (TIMES 4 Integrated Assessment Model) model [82-84] is a technology rich
bottom-up cost optimization belonging to the MARKAL 5 family model [85-89]. Energy
supply, demand and market dynamics are modelled in order to represent energy
dynamics over a long-term, multi-period time horizon at a local, national, multi-regional,
or global level. A detailed description of the model with its main features (technical,
economic and policy parameters, scenarios...) is provided in the following subsections.

         2.1 TIAM-IFPEN structure

TIAM-IFPEN is a linear optimization programming inherited from the ETSAP 6-TIAM
model which is the global multiregional model simulating the dynamics of the global
energy system from resource extraction to energy end-use over a long-term period of
over 100 years. It is a version of the TIAM model, developed in 1997 by one of the IEA
implementing agreements IEA-ETSAP, which is the global incarnation of the TIMES
model, the successor of the former generators MARKAL and EFOM 7 [90], but
implemented with new features for enlarging its field of application and providing
greater flexibility [91].

4 The Integrated MARKAL-EFOM System
5 MARKet Allocation model
6 Energy Technology Systems Analysis Program.

Created in 1976, it is one of the longest running Technology Collaboration Programme of the International Energy
Agency (IEA). https://iea-etsap.org/
7 Energy Flow Optimization Model

                                                                                                              9
CRITICAL RAW MATERIALS AND TRANSPORTATION SECTOR ELECTRIFICATION / February 2019

                 Fig. 1: TIAM model’s Reference Energy System [91]

As seen above, all main sectors of the economy are represented in the TIAM-IFPEN:
industry, residential, agriculture, commercial, transport and electricity generation. It
computes a partial equilibrium which means that the suppliers of energy produce the
quantity to meet the exogenous demand services considered. This equilibrium feature is
present at every stage of the energy system. While computing the equilibrium, a TIAM
run configures the energy system over a certain time horizon, in such a way as to
minimize the objective function of the system, while satisfying a number of constraints.
This objective function represents the total discounted cost of the system over the
selected planning horizon. All components of the system cost are specified yearly in the
study horizon in contrary to the constraints and variables which are related to period for
a better representation of the payment flows. The main cost components included in the
objective function are the investment costs, fixed and variable operation and

                                                                                       10
CRITICAL RAW MATERIALS AND TRANSPORTATION SECTOR ELECTRIFICATION / February 2019
maintenance (O&M) costs. Other cost components such as costs incurred for exogenous
imports, revenues from exogenous exports, taxes and subsidies associated with
commodity flows and process activities or investments are also included. All costs are
discounting to the base year 2005 which is the reference year at which our TIAM-IFPEN
is calibrated. A complete description of the TIMES equations appears in ETSAP
documentation [83].
As a technology explicit model, TIAM is based on a Reference Energy System which is a
network of processes linked by their inputs and outputs, going from the energy supply
sector to the energy consumption sector, through energy trade, transformation and
conversion (Fig. 1). The existing and future technologies in the sectors over a given time
horizon are considered with techno-economic parameters (capacity, energy intensity,
conversion efficiencies, availability factor, investment costs, fixed and variable costs,
future cost changes, maximum penetration rates, economic and technical life, etc.) and
their related strategic orientation parameters (taxes, subsidies, etc.).
As reminded in all ETSAP documentation, solving the model means finding for each time
period the optimum Reference Energy System by selecting the set of technologies and
feedstock that provides the optimal energy-technology pathways. Thus, the model
determines the optimal mix of technologies (capacity and activity) and feedstock at each
period, the associated emissions, the mining and trading activities, the quantity and
prices of all commodities, the equilibrium level of the demand for energy services, all in
times series from the base year 2005 to the time horizon 2050 of the model.
2.2 Regional assumptions
TIAM is data driven, its parametrization refers to technology characteristics, resource
data, projections of energy service demands, policy measures etc. It means that the
model varies according to the data inputs while providing results such as the shape of
investments, technology pathways or the evolution of trade flows for policy
recommendations.
11CRITICAL RAW MATERIALS AND TRANSPORTATION SECTOR ELECTRIFICATION / February 2019
Table 1 : Regions of the TIAM-IFPEN
TIAM name Region
AFR Africa
AUS Australia, New Zealand and Oceania
CAN Canada
CHI China
CSA Central and South America
IND India
JAP Japan
MEA Middle-east
MEX Mexico
ODA Other Developing Asia
SKO South Korea
USA United States of America
EUR Europe 28+
RUS Russia
Central Asia and Caucase (Armenia, Azerbaijan, Georgia, Kazakhstan,
CAC
Kyrgyzstan, Tajikistan, Turkmenistan, Uzbekistan)
Other East Europe (Albania, Belarus, Bosnia-Herzegovina, Macedonia,
OEE
Montenegro, Serbia, Ukraine, Moldova)
12CRITICAL RAW MATERIALS AND TRANSPORTATION SECTOR ELECTRIFICATION / February 2019
The model is disaggregated into 16 regions (Table 1). Each region has its own energy
system with its main demand sectors. Each region can trade fossil resources, biomass,
materials or emission permits with other regions or in a centralized market. Thus, the
model fully describes within each region all existing and future technologies from supply
(primary resources) through the different conversion steps up to end-use demands.
The following power generation technologies have been covered by the model:
renewable energy technologies (RETs) (solar PV and CSP, wind onshore and offshore,
hydro, biomass), fossil-based technologies (coal, natural gas, oil) and nuclear. Most
techno-economic parameters (capacity, energy intensity, efficiency, availability factor,
investment costs, fixed and variable costs, economic and technical life, etc.) and the
inventories of the existing and future generation technologies were taken from the
World Energy Outlook 2016 [92], IRENA [93] and the European Commission database.
An evolution of regional investment costs of the main technologies has been displayed in
Fig. 2 and Fig. 3. The investment cost of a technology in Europe region in 2010 is
considered as the reference index for regional comparison. We assumed a continuing
decrease of the RETs costs over the studied period till 2050 in line with IRENA and IEA.
Fig. 2 : Average renewable energy technology (RET) investment costs at regional level
between 2010-2050 (Index CostEUR2010=1, red line)
13CRITICAL RAW MATERIALS AND TRANSPORTATION SECTOR ELECTRIFICATION / February 2019
On the contrary, the regionalized fossil-based power plants costs remain constant over
the same period. As with any model, the results of TIAM-IFPEN scenario runs are
sensitive to the input parameters values.
Fig. 3 : Average technology investment costs at regional level between 2010-2050 (Index
CostEUR2010=1, red line)
14CRITICAL RAW MATERIALS AND TRANSPORTATION SECTOR ELECTRIFICATION / February 2019
CCGT: Combined Cycle Gas Turbine, GT: Gas Turbine
As perfectly reminded by Schimpf et al., it is important to understand that a scenario is
neither a mere forecast - in the sense of an unsurprising projection of the present – nor
is it expressing a vision, i.e. a desired future [94]. Therefore our results should not be
considered as forecasts but rather as projections of the possible pathways of a future
energy system development. All energy demand projections have been done considering
macro-economic drivers such as the GDP, the population growth, etc. (Statistics/outlook
of the IMF 8, results from GEMINI-E3 or GEM-E3 macro-economic models). All
assumptions related to regional fossil fuel reserves and trade capacities have also been
implemented along with the regional renewable energy potentials ([95], World Energy
Council, BP Statistics, US Geological Survey, specialized literature and experts involved
in the projects). For the power generation, the general sources of data are the National
Renewable Energy Laboratory (NREL), PLATTS database, IRENA, WEO IEA and
specialized literature.
8 International Monetary Fund
15CRITICAL RAW MATERIALS AND TRANSPORTATION SECTOR ELECTRIFICATION / February 2019
2.3 The lithium chain structure
The lithium supply chain has been built from ore deposits to its end-use via various
transformation processes and trade flows (Fig. 4). Two types of trade are included in the
model: the first one is about lithium ore from the mineral deposits to the refining sites.
As of today, the main flow is from Australia to China. The second type concerns the main
lithium-based chemicals (LiOH and Li2CO3). Both products are aggregated in the same
trade flows as they are not differentiated according to their specific end-use. Taking into
account the trade capabilities will allow analysing future international lithium
exchanges according to the each regional needs and growth.
Fig. 4 : Detailed description of lithium in each TIAM region
16CRITICAL RAW MATERIALS AND TRANSPORTATION SECTOR ELECTRIFICATION / February 2019
Fig. 5 : Distribution of resources (dotted line) and primary production (solid line)
worldwide, with the main companies operating at current production sites and ongoing
projects (Data 2017)
Source: USGS (2017), producer announcements
Table 2 : Regional disaggregation of the lithium resources (in Mt) by type of deposits
AFR AUS CAC CAN CHI CSA EUR IND JPN MEA MEX ODA OEE RUS SKO USA
Brine 5.25 25.5 2.07
Mineral 1.2 2 2 1.75 0.2 0.01 1.5 1 4.14
Clay 1.033 0.845 1.033 0.69
Source: USGS 2017
17CRITICAL RAW MATERIALS AND TRANSPORTATION SECTOR ELECTRIFICATION / February 2019
Fig. 6 : The various lithium deposits
Source: USGS 2017
Three different deposits have been considered (Table 2) in the model: two conventional
deposits (brine from salars and minerals 9) and an unconventional lithium one (Fig. 6)10
according to their regional reserves and resources. The associated technology is then
described and differentiated by region in terms of investment, operations and
maintenance costs, capacity of production and efficiency. Note that at present, less than
1% of lithium is recycled. Various studies address this concern for lithium-ion batteries,
from technological [96-98], geopolitical (Zeng et al. for China [69] ; Miedema and Moll
for EU27 [80]) or economic [99] point of views. If lithium recovery from Li-ion batteries
is technically feasible with high recovery rate (about 80% at the laboratory scale) it
seems that lithium recycling would be far from widespread. Considering the low
percentage by mass (about 3%) and the current lithium price, strong political incentives
are needed for widely deploying this sector. For instance, based on the 2006/66/EC
European directive, where the minimum recycling efficiency of NMC batteries is 50 % by
average weight, there is little incentive to recover lithium compared with cobalt for
9lithium-bearing rock (specifically spodumene).
10 Several unconventional lithium deposits have been identified including hectorite (clay), jadarite, geothermal brine,
oilfield brine, and even ocean brine.
18CRITICAL RAW MATERIALS AND TRANSPORTATION SECTOR ELECTRIFICATION / February 2019
example. The latter is much more profitable because lithium recycling requires the use
of highly-complex processes, which are not currently economically viable [100]. Even
though batteries are partly recycled to recover higher-value metals such as cobalt, there
is currently no specific recycling system for lithium. In the future, lithium recycling
would certainly rely more on supply security strategies than on a competitive economic
model. Therefore, we did not take into account the recycling parameter in the model.
Fig. 7 : Share of lithium consumption by various end-use sectors in 2017
Source: USGS 2018
In the transport sector, Li-ion based technology is considered for all the lifetime period.
The Li content is based on the NMC technology with an energy intensity per kWh
increasing over the period. The battery sector is now the primary outlet, with one-third
of this lithium use applied to EV (Fig. 7).
A positive growth has been observed in recent years for all end-use sectors (except for
the lubricants), especially batteries, where lithium consumption is increasing by about
20% per year. Therefore, when considering future demand in lithium, all end-uses might
be considered in the modelling exercise. Based on literature and producers’ data [61,64],
estimated growth rates have been considered from nowadays up to 2030 and beyond for
19CRITICAL RAW MATERIALS AND TRANSPORTATION SECTOR ELECTRIFICATION / February 2019
all end-use sectors except for transport (Table 2). Under these assumptions, the model
is then able to account for the structural effect into the lithium demand evolution.
Table 2: Lithium consumption growth annual rates according to the existing end-
uses
End-sector use Annual growth rates
Now to 2030-
2030 2050
Batteries (excluding transport) 8% 2,5 %
Glass and ceramics 5% 2%
Lubricating greases 3% 2%
Iron and steel 5% 1%
Polymers 3% 0%
Air treatment 2% 2%
Other (pharmaceutical, electronics, aluminium,
5% 4%
etc.)
Sources : [64], Dakota Minerals, USGS, auteurs (2017)
2.4 Scenarios assumptions
Our scenarios have been defined to observe the evolution of the transportation sector in
response to environmental constraints at global level, lithium resource availabilities and
the implications of future mainstream in road passenger transport mobility. The demand
for travel and motorization has increased dramatically over the past few decades along
with economic development and population growth [101]. In recent years, a change of
20CRITICAL RAW MATERIALS AND TRANSPORTATION SECTOR ELECTRIFICATION / February 2019
individual travel behaviour in road passenger transport has been observed due to the
promotion of the use of alternative forms of transport (walking, cycling, shared mobility
and public transport). As acknowledged by the UN-Habitat, while the global trends of the
implications of the unfolding events of rapid urbanization, hyper-mobility and the health
and climate hazards associated with car-dependencies pose uncertainties and risks,
there are also unprecedented opportunities for advancing sustainable urban mobility
[102]. Many governments around the world have been constantly adjusting its transport
policies overtime through an integrated approach to land use and transport planning,
transport pricing (congestion pricing schemes, road tolls), parking restrictions to
challenge car attractiveness while providing alternative modes of transport 11 [103-104].
Therefore, for the purpose of the present study, we run four scenarios where we have
considered two climate scenarios 12 with two different type of mobility each in order to
assess the impact on the lithium market along with the transportation electrification:
- Scen 4D which is consistent with limiting the expected global average
temperature increase to 4°C above pre-industrial levels by 2100.
- Scen 2D which is a more ambitious scenario, which translates the climate
objectives of limiting global warming to 2°C by 2100.
In each climate scenario, different future shapes of mobility have been assumed and
taken from the IEA Mobility Model (MoMo Model). The MoMo model is a technical-
economic database spreadsheet and simulation model that enables detailed
projections of transport activity according to user-defined policy scenarios to 2060.
The model covers 29 countries and regions including a urban/non-urban split, and
the potential for municipal-level policies to reduce transport energy use. As
explained by the IEA, “the MoMo model includes key elasticities, based upon
representative "consensus" literature values, are used to model vehicle activity and
fuel consumption responses to changes in fuel prices – which are themselves driven
by projections and policy scenarios (i.e. GHG or fuel taxes). Elasticities also enable
11 Cycle lanes, pedestrian areas and public transport coverage have been expanded while new mobility options such as
bike- and car-sharing schemes have been introduced, underpinned by the development of the ICT (information and
communication technology).
12 The climate module per se is directly inspired by Nordhaus-Noyer model.
21CRITICAL RAW MATERIALS AND TRANSPORTATION SECTOR ELECTRIFICATION / February 2019
vehicle ownership to vary according to fuel prices and income, as proxied by GDP per
capita”. Thus, they derived two future shape of mobility which would take into
account the evolution of the ownership rates (number of vehicles per inhabitants),
evolution of city density (density of cities with potential access public transport)
according to their size. The research strategy of the MoMo project is detailed on the
Fig. 8
Fig. 8 : The network of spreadsheets of the IEA Mobility Model (MoMo model)
(Source IEA MoMo team)
In this paper, we incorporate the outputs of the MoMo model as inputs of transport
mobility in our TIAM-IFPEN, there are two mobility scenarios for each climate scenario
(Fig. 9):
22CRITICAL RAW MATERIALS AND TRANSPORTATION SECTOR ELECTRIFICATION / February 2019
- A High mobility shape equivalent to a continuing increase of the ownership rate,
more private transit mode share and lower city densities. It is assumed an impact
of urban dispersal, a worldwide phenomenon, on mobility and travel as well as
the influence of urban land coverage on travel where we keep on having a huge
car dependency and usage. As acknowledged by the UN, urban dispersal has an
unmistakable and profound influence on travel because of the fact that spread-
out growth increases the use of private motorized vehicles. Nowadays, this
“urban sprawl” 13 is increasingly widespread in developing countries and should
be considered in transport modelling.
- Hypothesis of a Low mobility shape where the idea of a sustainability in mobility
is assumed. This assumption implies more compact cities, underpins an
integrated approach to urban land-use and transport planning and investment,
and gives priority to sustainable modes of mobility such as public and non-
motorized transport as seen in Fig. 9 with the bus and minibus travel demands.
13 The term “urban sprawl” describes low-density, dispersed, single-use, car-dependent built
environments and settlement patterns that, critics charge, waste energy, land and other resources and
divide people by race, ethnicity and income/wealth [84].
23CRITICAL RAW MATERIALS AND TRANSPORTATION SECTOR ELECTRIFICATION / February 2019
Fig. 9 : Evolution of the two different shape of mobility (high and low) according to
the travel mode (short and long distance)
24CRITICAL RAW MATERIALS AND TRANSPORTATION SECTOR ELECTRIFICATION / February 2019
Source: IEA MoMo Model
As seen in Fig. 9, the travel demand has been also disaggregated into two types of vehicle
usages: short distance (urban) and long distance (extra-urban) for all vehicles except for
the heavy commercial vehicle (HCV) and the 2/3-wheelers. This paper aim to contribute
to the transport policy literature by modeling the implications of different shape of
mobility along with climate constraints, firstly on cars fleet evolution and secondly on
the regional lithium needs in regards to the resource availability in the future.
III. RESULTS AND DISCUSSIONS
3.1 Model structure
Fig. 10 presents the changes in the global vehicle stock (including 2/3-wheelers) by
power-train for the 4 scenarios we defined above. With a sustainable mobility, the
worldwide fleet achieves 2.3 and 2.1 billion vehicles respectively in the 4°C and the 2°C
scenarios by 2050. Meanwhile, it is more than 3.3 billion and around 3 billion
25CRITICAL RAW MATERIALS AND TRANSPORTATION SECTOR ELECTRIFICATION / February 2019
respectively in 4°C and 2°C scenarios with a hyper-mobility due to dispersal metropolis
and therefore car usage to satisfy higher travel demand. A reduction in the global fleet is
also observed when the climate constraints are more stringent.
There is a preponderance of internal combustion engine (ICE) vehicles (more than half
of the global fleet) in the scenario 4°C both in high and low mobility with gradual
penetration of EV. Meanwhile, in the 2°C scenario, they decrease to around 20% and
15% of the global fleet respectively under an hypothesis of low mobility and high
mobility. Electric vehicles will increase steeply over the time horizon in both climate
scenarios by 2050: between 30% and 22% of the global fleet in the 4°C scenario
respectively in low and high mobility, while around 75% in the 2°C scenario in both
mobility hypothesis.
Fig. 10 : Evolution of the global vehicle stock between 2005-2050
ICE: Internal combustion engine; HEV: Full hybrid vehicle; PHEV: Plug-in hybrid vehicle; BEV:
Battery-powered electric vehicle; FCEV: Fuel cell electric vehicle
It should be highlighted that the EV fleet is mostly located in Asian countries (China,
India and other developing countries in Asia) due to the large presence of two and three-
wheelers that stand for more than half of the global EV fleet.
26CRITICAL RAW MATERIALS AND TRANSPORTATION SECTOR ELECTRIFICATION / February 2019
Fig. 11 : Evolution of the global EV stock (two and three-wheelers excluded) between
2005-2050. (a) 4°C scenario (b) 2°C scenario
(a)
(b)
PLDV: Passenger Light-duty vehicle; CV: Commercial vehicle
According to Fig. 11 (a) and (b) (solid lines), the global fleet of EV (two and three-
wheelers excluded) should reach between 250 and 360 million units by 2050 in the 4°C
27CRITICAL RAW MATERIALS AND TRANSPORTATION SECTOR ELECTRIFICATION / February 2019
scenarios, while it could be as high as 760-1200 million units in the 2° scenarios. When
considering passenger light-duty vehicles (PLDVs: small, medium and large cars) alone,
they should reach 205 and 310 million units in circulation by 2050 in the 4°C scenarios
respectively with the low and high mobility hypotheses (Fig. 11 (a) dotted lines). On the
other hand in Fig. 11 (b) (dotted lines), it would be around 590 and 970 million units
respectively in the low mobility and high mobility assumptions of the 2°C scenario.
Analysing these graphs, we could acknowledge that our forecasts in the 4°C scenario
with no change of individual travel behaviour in road passenger transport (high
mobility), 115 million units by 2030, are similar in scope to the IEA’s forecasts in the
Global EV Outlook 2018 [59], which estimates the number of EV at between 130 and 230
million by 2030, depending on the scenario.
Fig. 12 : Evolution of the global EV stock by vehicle’s category between 2005-2050 in the
2°C scenario
(a)
28CRITICAL RAW MATERIALS AND TRANSPORTATION SECTOR ELECTRIFICATION / February 2019
(b)
Our TIAM-IFPEN model could allow us representing in details the evolution of the EV
stock by powertrain and by category. We have the example of the 2°C scenario with low
mobility in Fig. 12 (a) and with high mobility in Fig. 12 (b).
It could be deduced that more than 25% of EV in circulation by 2050 are small cars (of
which around 85% of battery-powered EV) while 40% and 15% are respectively
medium and large cars. An uptake of the fuel cell electric vehicles (FCEV) has been
observed in large cars, heavy CV, Minibuses and buses.
From the outcomes of the model, Fig. 13 displays another representation for a perfect
visualisation of the evolution of some power-train uptake (Full hybrid HEV, Plug-in
hybrid PHEV, Battery-powered electric vehicle BEV and Fuel cell electric vehicle FCEV)
in each category over the time horizon in the 2°C scenario. Considering for example the
battery-powered EV in the low mobility hypothesis, 95% of them were small cars
category and 5% in medium size in 2010. However, from 2030, the penetration of EV in
medium, large cars, light and medium commercial vehicles is observed. It could be
explained by their higher usage and travel demand than small cars (Fig. 9). Therefore,
these categories will need more low-emitter vehicles such as electric-powered vehicles
with stringent climate scenarios.
29CRITICAL RAW MATERIALS AND TRANSPORTATION SECTOR ELECTRIFICATION / February 2019
Fig. 13 :Evolution of the vehicle’s share by category in different power-trains (HEV, PHEV,
BEV and FCEV)
3.2 Results and discussion of the impacts on lithium market
3.2.1 Impact of the global EV evolution on the lithium demand
Cumulative demand for lithium from 2005-2050 is estimated at 7.5 and 8.5 Mt
respectively in the low and high mobility of the 4°C scenario, while it reaches 19.7 and
24.7 Mt in the case of the 2°C scenario (Fig. 14). Demand is driven globally by China,
Europe, India and USA in both climate scenarios. They have respective shares estimated
as high as at approximately 45%, 13.5%, 12%, 9% of total cumulated consumption in the
4°C scenario. High consumption by China is due to the big proportion of two and three-
wheelers in addition to PLDVs. In the 2°C scenario, the share of China decreases due to
more transport electrification in other regions of the world. It is observed that the share
of China, Europe, India and USA reach respectively 26%, 16.5%, 8.5% and 15%.
A comparison of cumulative lithium consumption between 2005 and 2050 with current
reserves (16 Mt in 2017) provides information about the level of criticality of lithium.
Fig. 14 shows that only 2°C scenarios will certainly have a cumulative lithium
30CRITICAL RAW MATERIALS AND TRANSPORTATION SECTOR ELECTRIFICATION / February 2019
consumption higher than the current level of lithium reserves (red dotted line). On the
contrary, in the 4°C for any shape of mobility, the cumulated lithium demand is far under
the current dotted lines representing the lithium reserves 2017.
Fig. 14: Comparison between the cumulated lithium consumption (2005-2050) and the
world lithium resources in 2017
The safety margin (ratio of the cumulative consumption to the current resources) is
decreasing in both climate scenarios as the lithium consumption follow the same trend
as the penetration of EV. It fluctuates from 86% to 84% in the 4°C scenario according to
the shape of mobility while it is falling from 63% to 53% in the most stringent climate
scenario (2°C scenario).
3.2.2 Geological and technological implications
Fig. 15 shows the evolution of lithium demand according to each scenario described (4D
scenario High Mobility, 4D scenario Low Mobility, 2D scenario Low Mobility, and 2D
scenario Low Mobility).
31CRITICAL RAW MATERIALS AND TRANSPORTATION SECTOR ELECTRIFICATION / February 2019
Fig. 15: Evolution of lithium demand from 1990 to 2050 (historical data until 2016)
Unsurprisingly the lithium demand is higher in the most constrained climate scenarios
where EV stock is higher in order to limit GES emissions, and therefore the global
warming to 2°C. In the 2°C scenario with high mobility, the annual lithium production
reaches around 1200 kt by 2050 while it is lesser in the case of a lower mobility at
around 890 kt. Thus, the annual production by 2017 which is around 45 kt (Fig. 16), has
been multiplied by 27 and 20 respectively. In the case of the 4°C scenarios, the expected
annual production is obviously lesser than in the 2°C, regardless of the shape of mobility
considered. Indeed, it increases as high as 300 kt by 2050 in the lower mobility while it
is at around 360 kt with a high mobility assumption.
32CRITICAL RAW MATERIALS AND TRANSPORTATION SECTOR ELECTRIFICATION / February 2019
Fig. 16 : World lithium production per year and per country (kt, left axis) and global world
reserve (right axis)
Source: USGS, 2018
With regard to resources, new exploration missions could lead to new deposits
discovery and increasing resource volumes, especially for non-conventional resources
(geothermal brines, clay, mica, etc.) which represent only about 10% of resources today
(USGS, BRGM). Along with these unconventional land-resources, oceans also constitute a
natural lithium resource. The lithium concentration is 0.18 mg/l which would represent
an estimated resource between 230 and 260 billion tons of lithium [105-106]. Early
projects were initiated in the 1970s (USGS) concluding on the technical feasibility but at
a much higher cost than lithium current prices. Indeed, it is necessary to handle very
important volumes of water which requires a considerable energy. The cost of
recovering lithium via the oceans has been estimated between $15 and $22 per kilo of
carbonate lithium [61], which is tenfold the cost of production of the Atacama’s salar
(Chile).
A significant share of the current and new resources could become profitable in the
future, and therefore be taken into account as reserves, according to technological
advances and new processes as well as higher prices on the market. Regarding brines,
33CRITICAL RAW MATERIALS AND TRANSPORTATION SECTOR ELECTRIFICATION / February 2019
process optimizations focus on the evaporation step which is expensive and weather
constrained in addition to long recovery times (up to 18 months, low yields (40/50%)
and huge negative landscape impact). New processes would extract directly lithium from
the brines (see projects conducted by ERAMET or POSCO, etc.). Geothermal brines
resources in the United States for instance could be explored in more depth when direct
recovery of lithium technologies will be commercialized suggesting new deposits
exploitable. Recent research at Stanford has also shown that lake sediments could host
large lithium-rich clay deposits14.
3.2.3 Uncertainty about supply despite adequate resources
Increasing lithium prices can make some resources affordable. Between 2014 and 2017,
lithium carbonate prices more than double from 4.90$/kg to 10.60$/kg in average (IHS
Market 2018) stimulating the mining sector and promoting new feasibility studies. In
the same period the reserves have increased by more than 50% (Fig. 16).
The analysis of the evolution of the Reserves-to-Production ratio could be also
interesting retrieving the annual production, an outcome of the model, over the time
horizon (Fig. 17). In this graph, we have represented the annual lithium production (P)
and thus different Reserves-to-Production ratios according to growth rate of the
reserves’ level:
- R2017/P is the ratio where it is assumed that the reserves if kept at its level of
2017 and constant onwards (16 Mt). It means that it is the most pessimistic case
where the level of reserves would no longer increase from 2017 to 2050.
- R/P (with past growth R): an assumption of an annual growth rate of the reserves
between 2017-2050 is assumed equal to the historic growth rate between 1995-
2017, which is 8.9%/yr. It could be considered as the “Business-As-Usual”.
- R/P (with high growth R) and R/P (with low growth R): in these two scenarios, it
is assumed two annual growth rate of the reserves defined by taking the growth
14 https://news.stanford.edu/2017/08/16/supervolcanoes-key-americas-electric-future/
34CRITICAL RAW MATERIALS AND TRANSPORTATION SECTOR ELECTRIFICATION / February 2019
rate of the R/P (with past growth R) as median. The high growth rate is
considered at 12%/yr and the low growth rate at 6%/yr between 2017-2050
Fig. 17: The evolution of the ratio R/P (reserves/Production) according to four
assumptions: (a) 4°C scenarios (b) 2°C scenarios.
(a)
(b)
35CRITICAL RAW MATERIALS AND TRANSPORTATION SECTOR ELECTRIFICATION / February 2019
These ratios provide thus the remaining amount of lithium, expressed in time (year). For
example in Fig. 17 (b), in the case of a 2°C scenario, it is observed that only 18 years
remains by 2050 with a low mobility in the pessimistic scenario (R2017/P) while it
could increase as high as 760 years in the highest annual growth rate of reserves (R/P
high growth R). On the contrary, it is decreasing to 555 years when considering a high
mobility and a Reserves-to-Production ratio with a fast growth of the reserves over the
time horizon. This analysis is pinpointing the importance of the future exploration and
production lead times.
The studied scenarios tend to show that no significant geological risk exists in the
lithium market since, as with reserves, resources are substantial (around 52 Mt) and it is
likely that they will be technologically accessible by 2050, at least in part. In the short
term, it is important to have time to react between supply and demand, which could may
be led to supply risks.
If some lithium mines can be extended and increase their production rate in the near
future, new ones have to be implemented to meet the long term demand. When looking
to the traditional schedule and steps prior to the production of a lithium mining deposit
the entire process could take up to 10 years. Resource identification, exploration and
then feasibility analysis could take few years as exploration companies have to raise
capital for each steps. Negotiations are then initiated with the government and the
population to determine the administrative terms and ensure the acceptability of a
future mining project. In addition, a mine can be reached its ramp-up and be fully
operated within 1 or 2 years. The investment cost for such projects is high and there are
a lot of uncertainties over such long project durations. It is not uncommon for companies
to go bankrupt before they have even completed feasibility studies.
As of today, taking into account announcements by mining companies, a dozen new
deposits were expected to be mined in 2018 [81]. In the short terms, there is significant
uncertainty surrounding production lead times, which are typically delayed for several
years following producers’ announcements. According to the figures announced by the
new companies (based on 2016 annual reports), it would be between 65 and 85 kt of
additional lithium which would be likely to arrive on the market between 2017 and
36CRITICAL RAW MATERIALS AND TRANSPORTATION SECTOR ELECTRIFICATION / February 2019
2020. Given the production published by the USGS in the year 2017 (45 kt of lithium) it
could then already represent a threefold increase of production by the end of the decade.
From the actors' point of view, most of the credible projects announced exceed 15 kt
LCE 15/year and are partly supported by juniors such as Lithium Americas, Orocobre or
Galaxy Resources. Having a look to the past production planned and comparing it with
effective current volume production leads to large error margins. Moreover, beyond the
optimism of companies seeking financing, the volumes thus announced often concern
capacity and not production volumes, which tends to overestimate future production.
In addition, in the short term what could be observed is a surplus of lithium ores and
concentrates on the market due to a refining bottleneck thereafter if plants are already
working at full capacity. Therefore, a reaction time between supply and demand would
be required to achieve such a production leap.
3.2.4 Geopolitical consequences
55% of global resources and nearly 50% of production are currently coming from the
lithium triangle, composed of Argentina, Bolivia and Chile (USGS, 2017).
In Fig. 18, according to the results displayed, it can be observed that this region (Central
and South America) will still be the largest exporter of lithium by 2050. However,
national strategies currently vary significantly from one country to another in this
region.
In Chile, deposit concession holders are subject to exploitation quotas and short-term
leasing contracts. In Argentina, President Mauricio Macri’s current economic policy in
favour of foreign direct investment (FDI) raises questions about the sustainability of
projects, in a country where foreign economic involvement is a national concern that
shifts with political change.
15 LCE: lithium carbonate equivalent. 15 kt LCE equivalent to approximately 3 kt Li
37CRITICAL RAW MATERIALS AND TRANSPORTATION SECTOR ELECTRIFICATION / February 2019
Fig. 18 : Lithium consumption by region, internal production and imports in four major
regions: China (CHI), Central and South America (CSA), India (IND), Europe (EUR).
Bolivia is a unique case in the commodities market: it has the world’s largest lithium
resources, located in the Uyuni salt flats, but is not currently producing lithium. Even
though there is no real convergence among these three major countries, their national
policies are key to understanding the lithium market in the coming years.
38CRITICAL RAW MATERIALS AND TRANSPORTATION SECTOR ELECTRIFICATION / February 2019
Fig. 19 : Profile of regionalized lithium imports from the Central and South America (CSA)
region
By 2050, Europe, United States, India and China, the other regions in a lesser extent,
would become predominantly dependent on imports from the lithium triangle (Fig. 18 &
Fig. 19). However, China’s resources are fairly substantial (around 15% of global
resources), even though their production costs are higher than in the salt flats. China has
also completed multiple acquisitions and acquired interests in deposits, both in Australia
and in the lithium triangle. China is a net importer of lithium and a net exporter of
lithium-based chemicals and processed lithium products (such as lithium cathodes).
China imports resources, and refines it within its borders (including 75% of spodumene
from Australia and 25% of brine from South America). A major player in the lithium
sector with two significant companies, Tianqi Lithium and Ganfeng Lithium Co., Beijing
has become the largest consumer of lithium and the largest producer of processed
lithium. In this context, changes in Chinese trade policy must be analysed with respect to
past transformations observed on other raw material markets (such as rare earths, etc.).
Despite the presence of new players in the exploration sector, the lithium market
remains dominated by a few companies, including Chinese companies [107]. Given that
instruments used to manage price volatility are not yet available on the commodities
39CRITICAL RAW MATERIALS AND TRANSPORTATION SECTOR ELECTRIFICATION / February 2019
markets (LME) 16, this concentration of players results in major uncertainty about future
lithium prices. Price volatility may also weaken newcomers to the market and lead to
further consolidation (mergers and acquisitions) among the players. Consolidations may
also take place among companies further downstream in the value chain, such as the
case of Toyota Tshucho Corp., which invested in the Argentinian company Orocobre Ltd.
The lithium market remains small compared with the non-ferrous metal markets 17. It is
characterized by a lack of identified buffer stocksin the markets, which can lead to far
more volatile price movements and reduced cyclicality. Shifting demand may therefore
lead to sudden reactions by players and high intrinsic volatility on the markets.
However, it is important to note the relative role of the price of the commodity lithium in
the overall cost of automobile battery manufacturing. Bloomberg 18 calculated that if the
price of lithium tripled, it would only lead to a 2% increase in battery prices, while the
increase would reach nearly 13% in the case of cobalt.
IV. CONCLUSION
The number of EV (two and three-wheelers excluded) on the road reaches between 250
and 360 million units by 2050 in the 4°C scenarios, while it is between 760 and 1200
million units in the 2°C scenarios according to the type of mobility assumed. In addition,
the EV fleet is mostly located in Asian countries (China, India and other developing
countries in Asia) due to the large presence of two and three-wheelers that stand for
more than half of the global EV fleet. Should the policy ambitions continue to rise to
meet climate goals and other sustainability targets, as in the 2°C scenario with a high
mobility assumption, then the number of electric passenger light-duty vehicles on the
road could be as high as 970 million units by 2050 while it would not be more than 310
million units in circulation by 2050 in the 4°C scenarios.
16 The LME plans to propose new futures contracts including lithium, graphite and manganese.
(all three used in automobile batteries), starting in January 2019.
17 Production in the non-ferrous metals market (copper, aluminum, nickel, etc.) totals several Mt.
18 Bloomberg 2017.
40You can also read