Deriving and using future weather data for building design from UK climate change projections - an overview of the COPSE Project
←
→
Page content transcription
If your browser does not render page correctly, please read the page content below

COPSE: Coincident probabilistic
climate change weather data
for a sustainable built environment

                                      Deriving and using future weather data
                                      for building design from UK climate change
                                      projections – an overview of the
                                      COPSE Project
COPSE: Coincident probabilistic       COPSE Project:
climate change weather data
                                      Manchester University
for a sustainable built environment
                                      Prof Geoff Levermore, Dr Richard Watkins (now at the University of Kent), Dr Henry Cheung,
                                      Dr John Parkinson, Prof Patrick Laycock, Prof Roger Courtney;

                                      University of Bath
                                      Dr Sukumar Natarajan, Prof Marialena Nikolopoulou (now at the University of Kent),
                                      Dr Charles McGilligan;

                                      Napier University
                                      Prof Tariq Muneer, Dr Yieng Wei Tham;

                                      Northumbria University
                                      Prof Chris Underwood, Dr Jerry Edge, Dr Hu Du;

                                      Sheffield University
                                      Prof Steve Sharples (now at the University of Liverpool), Prof Jian Kang, Dr Michael Barclay;

                                      Met Office
                                      Dr Michael Sanderson.

                                      July 2012

                                      This report should be referenced as:

                                      Levermore, G.J., Courtney, R., Watkins, R., Cheung, H., Parkinson, J.B., Laycock, P., Natarajan,
                                      S., Nikolopoulou, M., McGilligan, C., Muneer, T., Tham, Y., Underwood, C.P., Edge, J.S., Du, H.,
                                      Sharples, S., Kang, J., Barclay, M. and Sanderson, M. 2012. Deriving and using future weather
                                      data for building design from UK climate change projections – an overview of the COPSE
                                      Project. Manchester University, UK.
COPSE: Coincident probabilistic
climate change weather data
                                      Contents
for a sustainable built environment
                                      Foreword                                                                                   2

                                      Executive summary                                                                          3

                                      1 Introduction                                                                             7

                                      2 Projecting future weather                                                                9

                                      3 Building performance in future climates                                                 20

                                      4 Thermal comfort standards and implications for energy use for cooling                   32

                                      5 Urban heat islands and canyons                                                          36

                                      6 Implications of climate change for energy consumption                                   40
                                        in the national building stock

                                      7 Concluding observations                                                                 43

                                      Outputs from COPSE                                                                        44

                                      Datasets and other outputs
                                      Matlab scripts forming the weather data generators developed at Northumbria University
                                      are available for Matlab users. Contact Professor Chris Underwood: chris.underwood@
                                      northumbria.ac.uk.

                                      Test Reference Years and other building design weather data for future climates derived
                                      from UKCP09 data may be provided by the University of Manchester. Contact: Professor
                                      Geoff Levermore: geoff.levermore@manchester.ac.uk.
Foreword
          Climate change has increasing implications for the economic and social life of the UK, as
          the reports of the UKCIP1 and the UK Climate Change Risk Assessment 20122 make clear.
          In particular, it will impact on the performance of our built environment – our buildings
          and the civil infrastructure that supports our urban communities and our communications
          networks. Recognising this, the Engineering and Physical Sciences Research Council
          has funded successive programmes of research aimed at improving understanding of
          the impact of climate change on the built environment and into means of improving its
          adaptability and resilience. A recent phase of this research brought together a number of
          research projects, including COPSE, under the umbrella of the Adaptation and Resilience to
          Climate Change (ARCC) Co-ordination Network (CN)3.

           The ARCC CN has sought to develop close links between those directly involved in the
          research, who are principally in universities, and prospective users of the outputs, such as
          policy-makers, architects and engineering consultants. To that end, it has held conferences
          and technical events, published summaries of the research programmes and issued regular
          newsletters, with the aim of promoting the outputs of the research and facilitating their
          application. This publication further contributes to that overall aim.

          Academic research is, rightly, first published in peer-reviewed journals where it can
          be subject to the scrutiny of other researchers, and the findings compared with those
          of similar studies. Journal publications are often, though, not easily accessible for
          practitioners who will be principally concerned with the findings and their implications
          rather than the methods through which they were obtained. By contrast, short
          non-technical summaries do not provide a suitable basis for application of the findings.
          This publication seeks to fill that gap, in that it offers an overview of the COPSE project
          which, while summarising the research undertaken, gives most attention to the outputs
          and their relevance for practitioners. By also providing full details of the publications from
          COPSE research, it facilitates further investigation by those who wish to take advantage of
          latest research findings.

          I hope that this booklet will be both useful and relevant to all those engaged in ensuring
          that our buildings meet their occupants’ comfort requirements without excessive energy
          use, both now and in the future.

          Roger Street

          Technical Director for Adaptation Science, UKCIP

arcc cn   ARCC CN – Enhancing resilience across the urban environment

          The Adaptation and Resilience to a Changing Climate Coordination Network brings
          together a range of research projects funded by the Engineering and Physical Sciences
          Research Council. These look at the impacts of climate change and possible adaptation
          options in the built environment and its infrastructure including water resources, transport
          systems, telecommunications, energy and waste.

          1 www.ukcip.org.uk
          2 www.defra.gov.uk/publications/2012/01/26/pb13698-climatechange-riskassessment/
          3 www.arcc-cn.org.uk
COPSE: Coincident probabilistic
climate change weather data
                                      Executive summary
for a sustainable built environment
                                      The COPSE (COincident Probabilistic climate change weather data for a Sustainable
                                      built Environment) research project was undertaken between 2008 and 2011. Led
                                      by Manchester University, with eventually six academic research partners and the
                                      Meteorological Office contributing to the overall programme, the core aim of the project,
                                      addressed by the Manchester research team, was to develop robust methodologies for
                                      producing weather data files for assessing building designs in future climates, considering
                                      the period up to 2080, with particular reference to comfort and energy use. But the scope
                                      of the project was much wider; topics studied (and the universities involved) included:

                                      • a critical analysis of future projections of solar radiation and its characteristics (Napier)

                                      • the impact of future climates on the internal temperatures experienced in typical
                                        buildings, particularly examining the proportion of time for which these would exceed
                                        conventional comfort temperatures and the additional energy required for mechanical
                                        cooling systems (Northumbria);

                                      • the interaction between internal temperatures and the external noise environment,
                                        now and in the future, since the noise environment influences the ability of building
                                        occupants to achieve comfort conditions by opening windows and increasing
                                        ventilation rates (Sheffield/Liverpool);

                                      • the implications for future energy use of the adoption of ‘adaptive comfort’ criteria
                                        in the design of buildings, since this approach would reduce demand for mechanical
                                        cooling (Bath/Kent);

                                      • the Urban Heat Island in the Greater Manchester conurbation, with new modelling tools
                                        being developed (Manchester);

                                      • the potential change in national demand for energy for space heating and cooling in
                                        the building stock (Bath).

                                      Chapter 1 provides an introduction to the project, outlining its background and some
                                      principal findings.

                                      Chapter 2 describes the research related to the production of future weather files for use
                                      in modelling building performance. Conventionally, two sets of weather data are used in
                                      building design. The first is a Test Reference Year (TRY); this consists of hourly values of key
                                      weather variables (dry-bulb temperature, solar irradiance and relative humidity) which,
                                      as judged by a defined statistical process, best represent average conditions for the year.
                                      This set is used for assessing annual energy use. The second is a Design Summer Year,
                                      produced by a different process, which presents hourly data for the same variables that are
                                      representative of more extreme summer conditions. These data are used when modelling
                                      the performance of the building during periods of hot weather to assess the likelihood of
                                      over-heating.

                                      The Weather Generator associated with the UKCP09 Climate Projections produces 3000
                                      years of synthetic hourly data for any UK location and future time period up to 2080, under
                                      three different climate change scenarios: Low, Medium and High emissions. However,
                                      some variables that are important for building design (e.g. wind speed) are not included.
                                      These were deduced from the other data and from the augmented data set 21 TRYs were
                                      produced for each of three locations: London, Manchester and Edinburgh. These TRYs
                                      related to seven future dates (2020 to 2080) and three emissions scenarios. One finding
                                      was that while average winter temperatures are projected to increase, average summer
                                      temperatures will increase faster.

3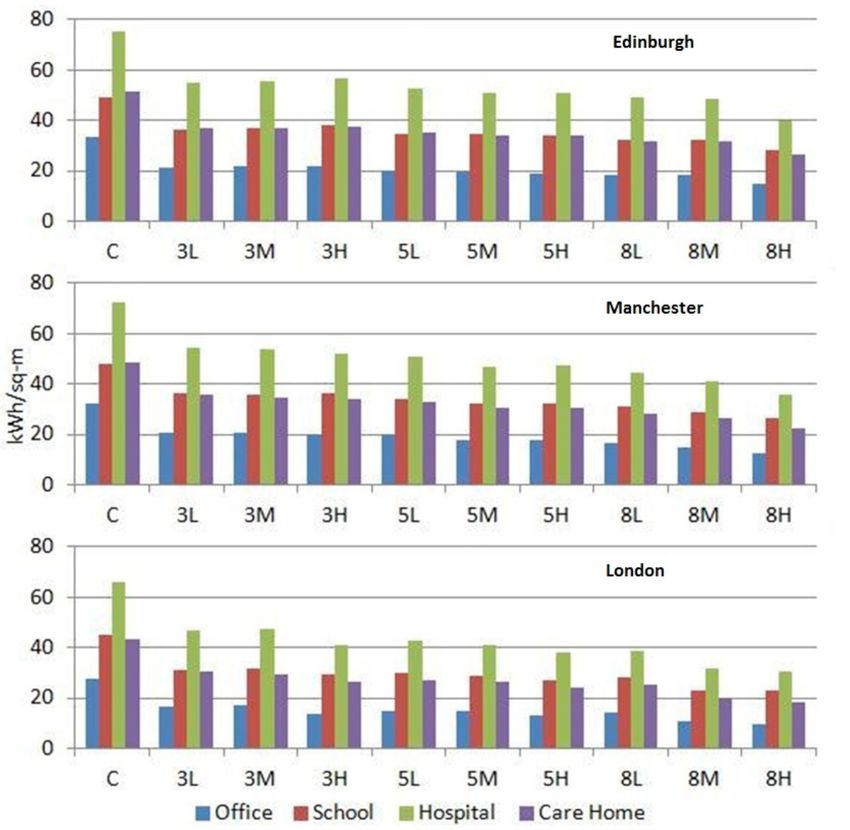
COPSE: Coincident probabilistic       The standard process for deriving the Design Summer Year is known to produce anomalous
climate change weather data           results for some locations. Hence an improved method for deriving data sets representative
for a sustainable built environment   of more extreme conditions was developed, the resulting data files being termed the
                                      Design Reference Year (DRY). The internal environmental conditions in a building are
                                      determined not by a single weather variable but by the combination of the three key
                                      weather variables (hence the reference to ‘coincident’ in the title of COPSE). For an
                                      individual building, the relative importance of each varies with the building characteristics,
                                      its orientation and across seasons. Thus, for example, a building with extensive west-facing
                                      glazing may be less likely to overheat during summer months than during spring and
                                      autumn, because of the higher solar angle during the summer. A key feature of the new
                                      method for providing data representative of more extreme conditions is that DRYs may be
                                      derived using different weightings of the weather variables, thus enabling designers to test
                                      the building performance with a DRY that is suited to the characteristics of the individual
                                      building.

                                      As with TRYs, a DRY may be produced from the synthetic weather data for any location,
                                      future time period and emissions scenario. In addition, designers have the option of
                                      specifying the probability associated with the DRY; thus modelling performance using a
                                      DRY that is representative of conditions that on average occur only once in 100 years is a
                                      more demanding assessment than if the DRY represents conditions that occur on average
                                      every 20 years.

                                      The derivation of future TRYs and DRYs fulfilled the aim of providing robust methodologies
                                      for deriving future weather data files for building design which reflected both the
                                      probabilistic nature of weather data and the need to test designs with data representative
                                      of more extreme combinations of the key weather variables.

                                      As part of the process of preparing the synthetic weather data from which the TRYs and
                                      DRYs were derived, the solar variables produced by the UKCP09 Weather Generator were
                                      subject to close analysis. This showed that both the hours of sunshine and the proportion
                                      of direct to diffuse radiation were projected to increase in the future, although the
                                      physical basis for these changes was not evident. Subsequent interactions with the team
                                      responsible for the Weather Generator resulted in a revised generator being published in
                                      2011.

                                      Chapter 3 covers the work undertaken, using the future weather data files, to explore
                                      how buildings would perform in future climates. Four contrasting buildings – an office
                                      building, a primary school, a hospital and a residential care home – were modelled in
                                      different locations, using not only the future weather files from COPSE research but also
                                      those available from other sources (although the conclusions from each were broadly
                                      similar). These studies showed a steady rise in the proportion of time for which the internal
                                      temperatures exceeded the conventional upper limit for comfort of 28°C; for the office
                                      building in Manchester, for example, this rose by 2050 to more than 15% of occupied
                                      hours. The rate of increase varied – thus for example the hospital showed a relatively slow
                                      increase because of the high proportion of deep-plan spaces which are not as influenced
                                      by future increases in solar radiation. Clearly, though, the need to minimise over-heating
                                      will become an increasing factor in design, and the ability of an existing building to
                                      maintain acceptable internal temperatures will be a factor in decisions on whether to
                                      demolish or refurbish.

4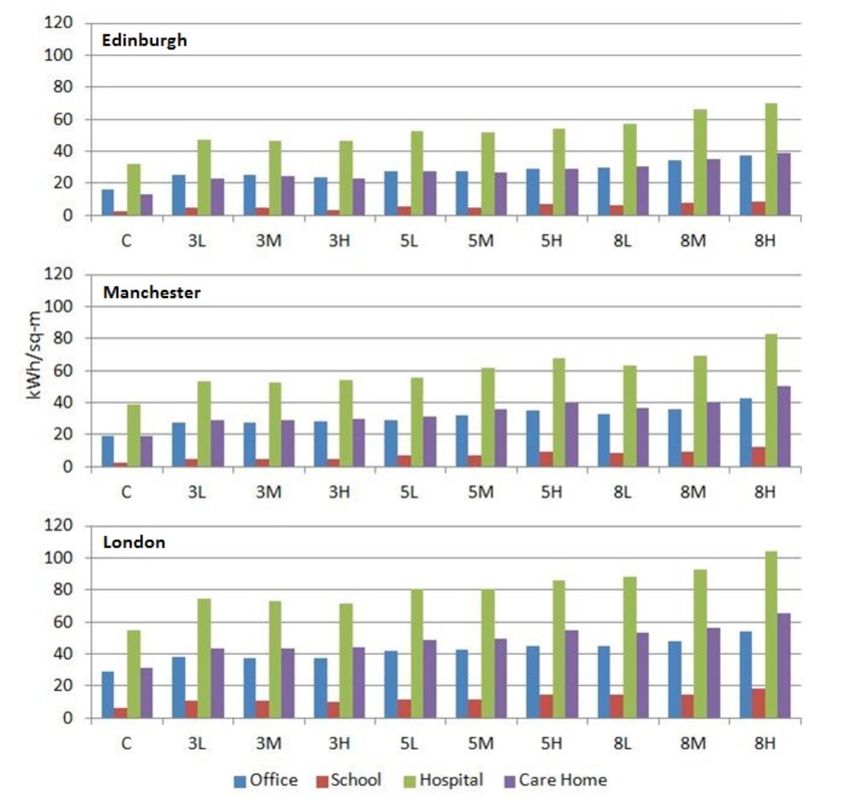
COPSE: Coincident probabilistic       The modelling studies also produced estimates of the cooling capacity and associated
climate change weather data           energy consumption required in these buildings. Again, a steady increase was observed,
for a sustainable built environment   with a doubling of cooling energy consumption by 2050 under some emission scenarios.
                                      Because of its warmer climate, demand in London is significantly higher than in the
                                      other cities. However, the increase in cooling energy use has to be set against a projected
                                      decline in energy use for heating in winter. This was also estimated through the modelling
                                      studies, with the conclusion that the reduction in winter energy demand would exceed
                                      the increase in the summer. Because future winters would continue to have periods of low
                                      temperatures, though, there would be little impact on the capacity required in heating
                                      plant.

                                      A separate study examined the relationship between the external noise environment
                                      and the ability of occupants to increase ventilation rates through opening windows. As
                                      ambient temperatures rise, occupants have greater need to open windows, but this may
                                      mean that they are exposed to external noise for an unacceptable length of time. By
                                      combining ‘noise mapping’, through which the external noise level on different parts of a
                                      building could be calculated, and thermal modelling, the impact of rising temperatures
                                      on comfort and cooling energy requirements could be studied. This research showed that,
                                      unless noise levels could be reduced, cooling energy requirements would rise significantly.
                                      Hence avoiding the need to install mechanical cooling in buildings that currently rely
                                      on natural ventilation may require a combination of measures, not only to improve the
                                      thermal performance of the building but also to reduce external noise levels.

                                      The studies outlined above were based on the conventional design approach of taking
                                      28°C to be the upper limit of the comfort band for most building occupants. However,
                                      previous research has shown that people adapt to warmer periods, for example by
                                      changing their clothing, and can be comfortable at higher temperatures. This observation
                                      underpins the theory of Adaptive Comfort, which predicts the upper comfort temperature
                                      from of the external temperatures experienced in the immediately preceding few days.
                                      Chapter 4 summarises research carried out to determine the extent to which adoption of
                                      that approach to comfort could reduce the need for mechanical cooling of buildings and
                                      the associated energy use. The research demonstrated that the maximum cooling energy
                                      saving in a building over the summer could be related to a novel metric, the number of
                                      Adaptive Comfort Degree Days, and this in turn could be derived simply from the weather
                                      data for the location of the building.

                                      Further, there are two methodologies for predicting the maximum comfort temperature
                                      using Adaptive Comfort principles, one set out in a European standard and the other in
                                      a US standard. The research modelled the performance of a building in future climates
                                      and showed that if the comfort temperature were calculated using the US standard, the
                                      building would require mechanical cooling much earlier than if the European standard
                                      were used. Hence the latter maximised the potential energy savings.

                                      Temperatures in urban areas are generally higher than those in surrounding rural areas,
                                      the effect being known as the Urban Heat Island (UHI). The UHI, which can be up to 8°C
                                      in Manchester, needs to be taken into account when assessing a building’s propensity to
                                      over-heat. Studies of the UHI in Manchester, outlined in Chapter 5, particularly focussed on
                                      the way that ‘street canyons’ influence the temperature, by reducing the rate at which heat
                                      may be lost through radiated to the atmosphere. This research resulted in a new model for
                                      estimating the UHI at an urban location which takes into account the ‘Sky View Factor’, i.e.
                                      the proportion of the sky that can be seen from street level.

5
COPSE: Coincident probabilistic       Complementing the studies of future energy consumption in individuals buildings,
climate change weather data           described in Chapter 3, a top-down assessment of the impact of climate change on energy
for a sustainable built environment   use in the national building stock was undertaken and is summarised in
                                      Chapter 6. The study was based on data on gas consumption published by the National
                                      Grid. The relationship between gas consumption and the average daily temperature was
                                      determined for 13 regions. The effect of warmer winters could then be explored, using the
                                      future weather data files. The research showed that, depending on the emissions scenario
                                      chosen, energy use for space heating (currently, about one sixth of national energy use)
                                      would fall by 16–18% by the 2030s and by around twice that proportion by the 2080s. Thus
                                      climate change will itself bring about a significant reduction in national energy demand
                                      (and there will be additional reductions because of changes in the stock, with newer
                                      buildings being thermally more efficient than those in the present stock).

                                      The findings from this broad range of research illuminate different aspects of future
                                      building performance, while the weather data files will be available to support future
                                      research and design studies. The report includes full details of the publications resulting
                                      from COPSE, and contacts through whom the future weather data files may be accessed.
                                      The current revision of a key document for the design of building services, Guide A of the
                                      Chartered Institution of Building Services Engineers, is drawing on COPSE outputs. Further
                                      studies will build upon the work reported here.

6
COPSE: Coincident probabilistic
climate change weather data
                                      1 Introduction
for a sustainable built environment
                                      This report summarises the research undertaken and the findings of the COPSE (Coincident
                                      Probabilistic climate change weather data for a Sustainable built Environment) project,
                                      funded by the Engineering and Physical Sciences Research Council between 2008 and
                                      2011. The project was led by Manchester University, the other academic research partners
                                      being Bath University (and after a staff move, the University of Kent), Napier University,
                                      Northumbria University and Sheffield University (with, following another staff move,
                                      Liverpool University). The Meteorological Office was also research partner. The research
                                      was informed by a Stakeholder Group on which were representatives of key potential users
                                      of COPSE findings – building owners, architects, engineering consultants, suppliers of
                                      design software etc. This Group met on five occasions during the course of the project.

                                      COPSE developed and applied tools for examining the performance of buildings in
                                      climates which the UK may experience in the course of this century. Buildings have long
                                      operational lives; most are expected to be in use for 50–100 years and some for even
                                      longer. In previous eras, designers could assume an unchanging climate, and buildings
                                      which provided acceptable internal conditions when first occupied could reasonably be
                                      expected to do so until the end of their useful lives. This assumption is no longer valid;
                                      the global climate is changing, as evidenced by the reports of the International Panel on
                                      Climate Change4. Hence designers need to be able to model the performance of buildings
                                      under future climatic conditions in order to give prospective investors and occupiers
                                      assurance that they will continue to provide acceptable conditions, perhaps with some
                                      modifications during their service life. Reflecting the general trend towards a warmer
                                      climate, a particular need is to be able to assess a building’s propensity to over-heat during
                                      a prolonged period of hot weather.

                                      The core aim of the COPSE project was to develop robust methodologies for producing
                                      weather data files for assessing building designs in future climates, with particular
                                      reference to comfort and energy use. These data files were based on the probabilistic
                                      outputs of the Weather Generator associated with the UKCP09 Climate Projections5,
                                      published in 2009. At the same time, however, the opportunity was taken to improve upon
                                      standard procedures for producing weather data for assessing over-heating, in particularly
                                      by enabling designers to select data by reference to a combination of key variables:
                                      external temperature, solar irradiance and relative humidity. This new methodology
                                      therefore incorporated the characteristics of coincidence and probability that featured in
                                      the project’s title.

                                      However, the research undertaken within the COPSE project covered a much larger range
                                      of topics. In addition to taking lead responsibility for the development of the new weather
                                      data files, Manchester University recorded hourly temperatures at 59 locations throughout
                                      Greater Manchester in order to characterise the Urban Heat Island in the conurbation. From
                                      these data, new models were developed to assist designers to estimate more accurately
                                      the actual external temperature to which buildings in urban areas will be exposed, thus
                                      improving the prediction of internal temperatures in those buildings.

                                      4 Intergovernmental Panel on Climate Change (IPCC) Fourth Assessment Report of the IPCC. (2007)
                                        Cambridge: Cambridge University Press. Available at www.ipcc.ch
                                      5 Available at http://ukclimateprojections.defra.gov.uk

7
COPSE: Coincident probabilistic       Napier University undertook a critical analysis of future projections of solar weather data,
climate change weather data           notably projections of hours of sunshine and the relationship between direct and diffuse
for a sustainable built environment   radiation, as part of the process of developing new weather data files. This analysis showed
                                      up anomalies in the output from the original UKCP09 Weather Generator and led to the
                                      publication of an amended generator.

                                      The impact of future weather patterns on both the thermal performance and the energy
                                      consumption of typical buildings was studied by Northumbria University. Using future
                                      weather files developed by COPSE and other projects, this research showed the extent
                                      to which internal temperatures would exceed the conventional comfort criterion of
                                      28°C, under different climate scenarios. It also enabled the cooling energy required to
                                      maintain comfort conditions to be estimated. Winter performance was also studied,
                                      with the conclusion that the reduction in space-heating energy demand consequent on
                                      warmer winters would more than compensate for the increase in summer cooling energy
                                      requirement. However, there would be little impact on the plant capacity required.

                                      Complementing this work on individual buildings, the University of Bath examined
                                      the impact of possible future climates on energy consumption for space heating in the
                                      national building stock, drawing on gas consumption data published by National Grid. This
                                      showed that energy use was likely to decline by around 17% by the 2030s, with further
                                      reductions in later decades.

                                      The team at Bath also explored the way in which adopting ‘adaptive comfort’ principles
                                      in building design could affect assessments of over-heating. This term relates to the
                                      ability of people to adapt to warmer external conditions, which means that they can feel
                                      comfortable when the internal temperature in a building is higher than the conventional
                                      upper limit for comfort. As a consequence, there is reduced need for mechanical cooling
                                      and with its associated energy demand. Bath developed a novel metric, the Adaptive
                                      Comfort Degree Day (ACDD), for exploring this effect.

                                      Finally, Sheffield University examined the relationship between internal temperatures
                                      in naturally ventilated buildings (i.e. those which rely on opening windows to produce
                                      comfortable internal temperatures in warm conditions) and the external noise
                                      environment, under present and future climates. Clearly, the ability of occupants to open
                                      windows is influenced by the external noise level and as external temperatures increase,
                                      it becomes more likely that the building will need to be equipped with some form of
                                      mechanical cooling. The level of external noise could be a factor in determining whether
                                      an existing building can continue to be used.

                                      Hence the COPSE research programme illuminated a number of aspects of the impact
                                      of climate change on buildings in the UK and provided tools relevant to the assessment
                                      of both existing and future buildings. The following chapters present in more detail the
                                      research undertaken and the findings, and draw out the implications for building design
                                      and performance assessment. A full list of COPSE published outputs is also provided.

8
COPSE: Coincident probabilistic
climate change weather data
2 Projecting future weather
for a sustainable built environment
2a Test Reference Years and Design Reference Years
Building designers model the thermal performance of proposed designs: first to
estimate annual energy consumption and secondly to provide information on internal
environmental conditions (temperature, air change rates etc) during periods of hot
weather. The latter process leads either to an assessment of the adequacy of natural
ventilation for maintaining acceptable internal conditions or to an estimate of the cooling
capacity that will need to be provided by mechanical plant to maintain environmental
conditions appropriate for the activities within the building.
For these assessments, designers turn increasingly to computer-based modelling
techniques, although manual methods may also be used. Whichever approach is used,
there is a need for sets of weather data for the proposed location which suitably represent
the conditions to be assessed. In the case of annual energy estimates, the data will be
representative of an average or typical year. For assessments of performance in hot
weather, data representative of more extreme conditions will be used.
These data are derived from weather observations stretching back over a period of 20–30
years. There are different methods for converting observational data to weather files for
building design but those most widely used in the UK are set out in ISO and European
Standards6 and the resulting data appear in CIBSE Guide A7. The final data for annual
assessment of performance are assembled into a Test Reference Year (TRY) while the data
for summer-time assessment are presented as a Design Summer Year (DSY). Each takes the
form of files of hourly data relating to weather parameters such as external temperature,
solar irradiance and relative humidity. In principle, different DSYs may be derived, each
based on a particular interpretation of extreme conditions; the data in the standard DSY
represent conditions that have a 12.5% probability of being exceeded.
A core element within the COPSE project concerned the development of such weather
data files based not on historic data but on future weather patterns as generated by the
Weather Generator associated with the UKCP09 climate projections. These files provide
designers with the ability to model the performance of designs under defined future
conditions, thus providing greater assurance that buildings designed now will continue to
provide acceptable environmental conditions in future decades.
But COPSE went further, by developing a different way of assembling data for summer-
time assessments, the Design Reference Year (DRY). The DRY addresses some well-known
shortcomings of the Design Summer Year and gives designers an alternative approach
to modelling designs in future climates. The advantages of the DRY over the DSY are
discussed more fully later.
6 BS EN ISO 15927-4: 2005 Hydrothermal performance of buildings – calculation and presentation of
climatic data, Part 4: Hourly data for assessing the annual use for heating and cooling.
7 Chartered Institution of Building Services Engineers. Guide A: Environmental Design (2006).
9COPSE: Coincident probabilistic UKCP09 Weather Generator Output
climate change weather data
The Weather Generator8 associated with the UKCP09 Climate Projections produces files
for a sustainable built environment
of simulated hourly weather data based on the climate projections that result from the
application of Low, Medium and High Emission scenarios to the UK Climate Model. The
projections relate to 10 year intervals starting at 2020 and finishing at 2080. For each future
date, e.g. 2050, the Generator provides 3000 years of simulated weather data, each year
being based on a random starting point. Hence 3000 years of simulated weather data are
available for 21 combinations of emission scenario and future date. Furthermore, the data
can be obtained relating to any defined location, since the underlying UK climate model is
based on a grid of the UK and takes into account factors such as elevation, exposure to the
sea, degree of urbanisation etc.
However, the output from the Weather Generator does not include all the weather
variables required for assessments of building performance. In particular, wind speed and
direction and cloud cover are not included. Hence before any derivation of weather files
could commence, methods for filling these gaps had to be devised (see Box 1).
Box 1 Additions and corrections to UKCP09 data
Wind speed
Building simulation models require wind speed data for modelling natural ventilation
performance. These data are produced in the course of generating the UKCP09
datasets and are used, in conjunction with temperature and humidity data, to
calculate the rate of Potential Evapotranspiration (PET) which is important for
some (e.g. agricultural) applications of the dataset. However, they are not reported
separately owing to the values having low statistical confidence levels. Fortunately,
it is a relatively simple task to compute the wind speed from the PET values provided
in UKCP09, the other weather parameters also provided and the particular algorithm
used to calculate the PET. The calculated wind speeds were compared with output
from a similar weather generator and found to agree very well. Current climate
models cannot model wind speed with sufficient accuracy to be able to give
meaningful predictions of future wind speeds. Hence the distribution of wind speeds
derived from the UKCP09 data essentially matches the current distribution of wind
speeds.
Wind direction
The procedure adopted provided typical data taken from historical weather files.
For a given location, a frequency analysis of hourly wind direction data (0–360° in
10° steps) was carried out for each calendar month over the 10 years 1996–2005,
as well as for each month taking all years together. 12 months were then chosen
whose hourly data were closest to the average pattern for that month in the 10-year
frequency distribution. These 12 selected months provided the wind direction data
required. While these data represented typical wind direction time series data for
a site, there was no linkage with the other weather parameters derived from the
CP09 datasets, e.g. wind speed, temperature or solar radiation. Moreover, these data
inherently assumed that historical patterns of wind direction would continue into the
future, there being no basis for assuming otherwise.
8 Jones, P.D., Kilsby, C.G., Harpham, C., Glenis, V. and Burton, A. (2009). UK Climate Projections science
report: Projections of future daily climate for the UK from the Weather Generator. University of
Newcastle, UK. University of Newcastle, UK http://ukclimateprojections.defra.gov.uk/22588
10COPSE: Coincident probabilistic
climate change weather data Cloud cover
for a sustainable built environment
The radiation balance for a building depends partly on whether the sky is clear or
cloudy. Cloud cover was derived from the UKCP09 data by taking the data on the
proportion of each hour for which there was sunshine (S), and calculating oktas from
the formula 8(1-S). (An okta is a unit of cloud cover, 8 oktas being total cover.) No
cloud cover data could be directly derived at night time and so this was estimated by
linear interpolation between the values at dawn and dusk.
Box 1 Additions and corrections to UKCP09 data (continued)
Solar radiation
UKCP09 data provide values for diffuse and direct solar irradiation on the horizontal
plane. It was found that at low sun angles these gave rise to unrealistically high
values of direct normal beam irradiation. These low angle errors in the UKCP09 data
were corrected by setting the direct radiation to zero for the first and last two hours
each day, the diffuse radiation being left unchanged. (For a further account of the
solar correction, see page 19).
Barometric pressure
UKCP09 data do not include an air pressure variable and therefore a standard, fixed
value of 101 350 Pa was assumed. This was a less significant approximation than the
others because barometric air pressure, in contrast to wind pressure, has a very small
impact on building performance.
Test Reference Year
A Test Reference Year (TRY) takes the form of an hourly data file for a single year whose
weather patterns are close to the average weather pattern over a 20-30 year period. The
TRY used in the CIBSE Guide consists of 12 months of observed hourly data. Each month
is selected separately and is the month with cumulative distribution profile for daily
data (average daily dry-bulb temperature, humidity and solar radiation) closest to the
cumulative profile for that month for the whole 20–30 year period. ‘Closeness’ is defined by
the Finkelstein–Schaffer (FS) statistic for the distribution9; this provides a measure of the
difference between two cumulative distributions of data – for example, the distribution
of daily average temperatures for a particular month (e.g. August) with the distribution of
daily temperatures over the complete set of Augusts. The lower the FS-statistic, the closer is
a particular August’s distribution of temperature to the overall distribution for August.
This process was applied to the augmented and corrected UKCP09 data, using the 3000
years of generated weather data available for any defined location, climate scenario
and future period. The FS statistic was calculated for each month by comparing the
distribution of average daily values for that month with the distribution over the whole set
of 3000 months. This was repeated for each of the three weather variables of dry-bulb air
temperature, humidity and solar radiation, producing 9000 FS statistics. For each month, a
combined FS statistic was then calculated by taking the means of the FS-statistics for the
three parameters (dry-bulb air temperature, humidity and solar radiation).
9 Finkelstein JM and Schafer RE (1971) Improved Goodness-of-Fit Tests. Biometrika 58(3), 641-645.
11COPSE: Coincident probabilistic The January with the lowest combined FS statistic was then selected as the January for
climate change weather data inclusion in the TRY, and so on for the 12 months. Hourly data for these months were
for a sustainable built environment then extracted and concatenated to form a complete TRY of 8760 hourly sets of data. The
inconsistencies in the data at the beginning and end of each month were left unsmoothed
as there are already large discontinuities in the generated hourly data at the daily joins (at
each midnight).
The final form of the TRY was an Excel file of weather data whose monthly distributions of
daily averages for air temperature, relative humidity and solar irradiation are closest to the
average distribution of these variables over the whole set of data for the 3000 synthetic
years. Data in this form are suitable for testing the future energy performance of a building
using building simulation software. The file could be read by, for example, IES building
simulation programs, or through a conversion macro, by Designbuilder. (The latter requires
the weather file first to be converted to CIBSE TRY format – which is automatic within
the COPSE software – and then processed by the program CCweathergen to produce an
Energy Plus Weather file for Designbuilder to read.)
In principle, it is possible to produce a range of TRYs, each based on a different
combination of the three weather variables; however, it was thought that designers would
prefer to operate with a single TRY which is a common, practical future weather year for
assessing the average performance of proposed designs. In COPSE, this TRY was derived,
for any location, for each of the 21 combinations of emissions (high, medium and low) and
time period (one of seven up to 2080–2099) for which covered by the UKCP09 projections.
Figure 2.1 illustrates the projected impact of climate change. It shows, for Heathrow, the
average daily temperature for each month of the current TRY and also for TRYs derived
for future years under the UKCP09 High emissions scenario. Under this scenario, the
mean January temperature in the 2080s is projected to be some 4°C higher than in the
1970s while the projected increase in the mean July temperature is around 6.5°C. Thus
summers are expected to become warmer at a faster rate than in winters. This increase in
summertime temperatures will increase the risk of overheating in buildings.
Figure 2.1: Monthly mean temperatures for the TRYs for Heathrow under the high emission
scenario.
12COPSE: Coincident probabilistic Design Reference Year
climate change weather data
As noted above, the performance of a proposed building design during a period of hot
for a sustainable built environment
weather is currently assessed using a file of weather data known as a Design Summer Year.
This is an actual year of hourly weather data, although in practice only the data in the
period April-September are used in the assessment. The selected year is the third warmest
over that six-month period out of a total period of 20 years (i.e. the 87.5 percentile), as
determined from daily average dry-bulb temperatures. Thus since the selection is based on
the six-month average, there is no guarantee that the resulting DSY will contain a period
when temperatures tend towards the extreme.
Moreover, the internal environmental conditions within a building during a period of
hot weather depend not only on the external temperature, but also on solar radiation,
humidity and wind speed. The selection process for the DSY does not take these other
factors into account and it can, therefore, result in a year of actual data which does not
incorporate the most testing conditions for the building. In some locations, the DSY as
constructed by this procedure has a summer period which is cloudier than the typical
conditions of the TRY.
Indeed, for some buildings, the most testing conditions occur when external temperatures
are unlikely to be at a maximum. The perimeter zones of buildings with a high proportion
of glazing will be particularly responsive to solar radiation at lower angles, and so the most
testing conditions may occur during a warm period in April or May, rather than during
a period of higher temperatures in June or July. Recognising this, the CIBSE method for
manual assessment of building thermal performance (In Guide A, referenced previously)
provides separate tables of weather data, one incorporating near-extreme solar radiation
and the other near-extreme dry-bulb temperatures These rarely coincide, as shown in
Figure 2.2. To create this figure, the average daily temperature for the same day in the
year – 1st June, 2nd June etc. – was calculated for each year of a 30-year period centred
on 2050, using weather data generated from the UKCP09 projections, and the 10 highest
averages selected. The same process was carried out using data on solar irradiance. The
result is an ‘L’ with only a small overlap in the two plots where periods of high average
temperature coincide with periods of high irradiance. One explanation is that periods of
high irradiance have low cloud cover, and with the clear skies the night-time temperature
drops significantly, thus reducing the daily average.
Figure 2.2: Coincidence of warm and sunny days in June. DRY data for Turnhouse, Edinburgh
(2050, High emissions scenario).
13COPSE: Coincident probabilistic To overcome the shortcomings of the DSY, COPSE developed an alternative method of
climate change weather data selecting data for summer-time testing, and brought these together in a Design Reference
for a sustainable built environment Year (DRY). As with the DSY, the data are selected using a percentile, but for the DRY each
month is selected separately, and on the basis of more than one weather parameter – not
just temperature. The process also differs from that of the DSY by having two stages, the
first of which selects a band of candidate months on the basis of one parameter, and the
second then selects from those months using all three parameters.
The procedure for constructing the DRY based on external temperatures, using weather
data generated from the UKCP09 projections, is described in Box 2. It is designed to
produce weather data representative of the more extreme end of the weather spectrum,
and with a realistic coincidence between high values of the different weather variables.
However, it should not result in weather conditions that would rarely be experienced in
practice.
One important difference between the DRY and the DSY is that the first stage of section
for a DRY can alternatively be based on humidity or irradiance data, so giving emphasis to
aspects of the weather that may be more significant for a particular building. Hence, for
any particular choice of initial risk factor – 87.5% in the example in Box 2 – and for each
combination of emissions scenario and future date, three DRYs may be constructed: based
respectively on daily mean temperature (DRY-1), on relative humidity (DRY-2) and on total
solar irradiance (DRY-3).
Box 2 Construction of the Design Reference Year
Each DRY relates to a specified emissions scenario and a specified future date and
for a selected combination of emissions and future date, 3000 years of simulated
hourly weather data are available. The mean monthly air temperature was computed
for each calendar month and, for each January, February etc, the 3000 mean
monthly temperatures were sorted into ascending order. The point on the monthly
distribution corresponding to a chosen percentile, e.g. 87.5%, was then selected. The
years corresponding to the band of 20 points centred on that point were identified
and the data from that month from those 20 years were extracted from the 3000
years in the original weather file. Thus 20 Januaries, Februaries etc were selected.
From the set of Januaries, a specific January was selected for the DRY using the same
statistical process as was used for the TRY with the added refinement that the three
years with the lowest combined rank sum (taking into account dry-bulb temperature,
humidity and irradiance) were selected and the year within this group which had the
closest mean monthly wind speed to the mean of all 20 years was chosen. The 12
months of the DRY were thus selected.
Once all twelve months had been chosen, the relevant data were extracted from
the UKCP09 weather file, the months were concatenated and the month boundaries
smoothed (linearly interpolated between the last eight hours of one month and the
first eight hours of the next month). The end of December was also smoothed to join
smoothly to the January month. These final data form a DRY based on the original
selection of the 87.5% level of monthly external air temperature. As with the TRY,
the data are held in an Excel file which is readable by proprietary software used for
modelling building thermal performance.
14COPSE: Coincident probabilistic Figure 2.3 compares an example of DRY-3 with the corresponding DSY, for the three
climate change weather data principal weather parameters used in the selection process. Each plot shows mean
for a sustainable built environment monthly values calculated from UKCP09 data for a 5km square at Manchester’s Ringway
Airport using the High Emissions scenario for the year 2080. For the comparison, only
the months of April to September are relevant since the DSY is not intended to be used
outside this period (by contrast, all 12 months of the DRY are potentially useable – see
below). The figure shows that when the near-extreme data are selected primarily on solar
irradiance, the DRY has a higher level of irradiance than the DSY, by up to 60 W/m², or about
25%, in June, July and August. By contrast, air temperatures for DRY-3 are lower in the main
summer months (by 5–7°C) than for the DSY. Relative humidity over the summer is similar
on average but with up to a 15% difference in individual monthly means. This DRY may,
therefore, be more relevant for testing buildings or parts of buildings sensitive to the level
of solar irradiance.
Figure 2.3: DRY-3, selected primarily on solar irradiance. Comparison of key parameters with the
DSY (2080 High emissions) monthly averages for Manchester Ringway.
15COPSE: Coincident probabilistic Use of the DRY
climate change weather data
The ability to derive a DRY based on different weather parameters gives designers more
for a sustainable built environment
scope for identifying the critical conditions for over-heating in a proposed building. The
building is first modelled using the complete DRY as the weather file; from this, the month
with the highest risk of overheating is identified. The effect of varying the design is then
explored using that month’s data. Only one month is selected since the concatenation of
extreme months that forms the DRY produces a weather year that is extremely unlikely
to ever occur in its entirety. However, in a multi-zone building, it may be advisable to
investigate the performance in each zone separately, and the critical month may vary
between zones. This may have implications for the total cooling plant capacity required.
As noted above, different buildings will be more or less sensitive to solar gain. Deep
plan, heavily over-shadowed, or windowless buildings will have least sensitivity, and so
DRY-1 and DRY-2 would be more appropriate for testing their performance. Conversely, in
shallow-plan, highly glazed buildings, solar gain will be very important, and performance
would need to be tested using DRY-1 and DRY-3.
The initial choice of risk factor will change the severity of the test applied to the building
design. This can be changed by the designer, but if the DRY were to become a formally
endorsed weather data concept, it would be helpful for CIBSE to give guidance on the
percentile to be used in different circumstances.
Finally, although all the previous discussion has been in the context of performance
testing for periods of hot weather in the summer, the DRY can also be used to examine
building performance during the winter; by choosing, for example, the 12.5 percentile, the
performance may be assessed in cooler, drier and cloudier periods.
Summing up
COPSE has provided a new way of assembling weather data for the purposes of assessing
the performance of a proposed building during the summer10. By comparison with the
present DSY, the DRY provides much greater consistency between months, and much
greater assurance that the weather data file will contain periods where the coincident
values for temperature, solar radiation and humidity are representative of testing external
conditions that need to be taken into account in the design, but are not at the extreme end
of the spectrum of variability.
The DRY for a given location, timeframe and scenario is not a single dataset since it will
vary according to how extreme a user wishes the weather to be in the design assessment;
this will influence the choice of percentile in the distribution. Moreover, the critical month
will vary according to the particular building or zone, orientation, function, etc. Hence the
DRY is, rather, a methodology that provides a consistent way of selecting weather data for
assessing building performance according to the parameters of interest: solar irradiance,
air temperature or humidity.
10 Watkins R, Levermore GJ, Parkinson JB, The Design Reference Year – a new approach to testing a
building in more extreme weather using UKCP09 projections, Building Services Engineering Research and
Technology – on line March 2012 at: http://bse.sagepub.com/content/early/2012/03/26/014362441143
1170.abstract
16COPSE: Coincident probabilistic At present, use of the DRY would be a decision for an individual designer. However, should
climate change weather data it become accepted as the way of assembling weather data for assessing summer-time
for a sustainable built environment performance, there would be a need for an organisation – presumably CIBSE – to provide
guidelines for its use and the way that data from UKCP09 were used, so that designers were
all working under the same “rules” and, in particular, were using the same weather data –
whether based on observations or simulation – for a given location.
2b: Solar data
Examination of the characteristics of future solar radiation data produced by the Weather
Generator that accompanied the UKCP09 projections showed that the generated data
differed markedly in some respects from current solar data. It was not clear that these
differences could be accounted for by physical changes in the atmosphere. The results
pointed to a need for some modification of the weather generator and COPSE research
informed subsequent changes in the procedure for modelling future solar radiation.
These were incorporated in a revised Weather Generator issued in January 2011, when
the contribution of COPSE researchers at Napier University to these changes was
acknowledged11.
Figure 2.4: Comparisons of sunshine duration hours corresponding to the 89.5th percentile of
daily total radiation for Heathrow. Note: old ss= UKCP09 data set, new ss= new UKCP09 data set.
11 UKCIP. About the Weather Generator version 2.0. UK Climate Impacts Programme (2011) Available from:
http://ukclimateprojections.defra.gov.uk/22580
17COPSE: Coincident probabilistic The changes principally related to the hours of sunshine and the diffuse radiation
climate change weather data component of the total solar radiation. The first is illustrated by Figure 2.4 which shows the
for a sustainable built environment hours of sunshine through the day at Heathrow at 89.5% probability level in January and
June. The effect of the changes is overall to reduce model-generated hours of sunshine,
particularly at the beginning and end of the day, which produces a closer match with
observations.
The second change is illustrated by Figure 2.5 which shows the proportion of diffuse
radiation in the total radiation for two sites – Bracknell and Edinburgh – under different
climate scenarios, and compares this with observational data. In all cases, the data refer
to the 89.5% level of probability and to 13.00 hours in June. It can be seen that the earlier
version of the Weather Generator projected a much lower proportion of diffuse radiation in
future, i.e. on average much clearer skies, and that the revised version produces projections
that correspond more closely to observed data.
Both original and revised Weather Generators project an overall increase in Global Solar
Radiation by comparison with current levels. Figure 2.6 illustrates this for Bracknell during
June, using generated data for a recent period (Control) and for 2030 Low Emission and
2080 High Emission scenarios. A note of caution is needed, however, concerning the very
high increases at both ends of the day which stem from aspects of the model assumptions
and process. This caveat, though, does not detract from the overall conclusion that future
weather patterns are likely to be favourable for PV and other solar technologies.
Figure 2.5: Ratio of diffuse to global irradiation (DRG) for June at 1300 hrs at 89.5th percentile;
(a) Bracknell and (b) Edinburgh. Note: MetD= Meteorological Office data set, old= old WG
control data sets, v2= WG version 2.0 data sets, LE= Low Emissions, HE= High Emissions.
18COPSE: Coincident probabilistic
climate change weather data
for a sustainable built environment
Figure 2.6: Global solar radiation (GSR) comparison for Bracknell.
Note: MetD= Meteorological Office data set, old= old WG control data sets, v2= WG version 2.0
data sets, LE= Low Emissions, HE= High Emissions.
19COPSE: Coincident probabilistic
climate change weather data
3 Building performance in future climates
for a sustainable built environment
This Chapter provides an account of the research carried out under COPSE on the
performance of existing buildings in future climates, using the files of future weather data
described in Chapter 2. Since most of the building stock that will be in use in the second
half of this century is already constructed, it is important to ascertain whether these
buildings will continue to provide acceptable internal conditions, or whether extensive
modifications will be required. The COPSE research covered the propensity of buildings
to overheat in periods of hot weather, the impact of generally warmer climates on annual
energy consumption, and the relationship between the external noise environment and
the ability to cool a building through natural ventilation. The significance of the third study
for future building performance is explained in Section 3c.
3a Overheating
Only a selection of the studies will be described here; the references 9 and 10 provide a
fuller account of the research12,13.
Four contrasting existing buildings – an office building, a primary school, a hospital and
a residential care home for the elderly – were modelled using EnergyPlus 6 software14.
Thumbnail diagrams of the buildings are shown in Figure 3.1 while key physical details
are in Table 3.1. With the exception of the office building (constructed in 1994), all were
constructed recently. The buildings differed considerably in their patterns of occupation
and the modelling took into account likely hours of occupancy, the number of people likely
to be in the building, and the internal energy gains from lighting and electrical equipment,
using widely accepted data15.
All the buildings were naturally ventilated, the ventilation rate being set during the
summer period at 4 air changes per hour – a typical value that might be expected for
spaces mainly ventilated from one side with windows open on still, or virtually still, warm
summer days. This rate was assumed to occur when the internal temperature exceeded
25ºC and in addition was higher than the external air temperature. An additional
infiltration allowance of 0.5 air changes per hour was assumed for the whole period of the
simulation.
12 Du, H., Underwood, C.P. & Edge, J.S. (2012a). Generating design reference years from the UKCP09
projections and their application to future air conditioning loads.Building Services Engineering Research
and Technology 33(1).
13 Du, H., Underwood, C.P. & Edge, J.S. (2012b) Generating test reference years from the UKCP09
projections and their application in building energy simulations. Building Services Engineering Research
and Technology. Doi: 10.1177/0143624411418132, 20pp.
14 National Calculation Method Modelling Guide. Available at: www.ncm.bre.co.uk
15 Energy Analysis and Tools – EnergyPlus Software. US Department of Energy – National Renewable Energy
Laboratory. Available at: www.nrel.gov/buildings/energy-analysis.html
20COPSE: Coincident probabilistic
climate change weather data
for a sustainable built environment
Figure 3.1: Thumbnails of case study buildings.
Table 3.1: Details of case study buildings
Building Zones Gross floor Treated floor Effective
area (m2) area (m2) thermal
capacity
(kJm-2K-1)
Office 36 4269 2977 466
School 25 4870 2844 285
Hospital 145 21,897 12,786 259
Care Home 51 5683 5345 425
Each of the buildings was simulated using weather data taken to be representative of
present conditions (the ’Control’) and with weather data generated for a range of future
emissions scenarios and for time periods centred on 2030, 2050 and 208016. In addition,
these simulations were repeated for three locations: London, Manchester and Edinburgh
– thus the same building was modelled with weather data relevant for each of these
locations. Only results for Manchester are presented here; Table 3.2 lists the symbols used
in displaying these results.
16 The Control dataset is based on weather data recorded in the period 1961–1990. Hence the time interval
between the middle year of this band and the middle year of the 2030 band is 55 years, which is larger
than the interval between the middle years of the other bands used in the analysis. This accounts for the
significant difference between ‘Control’ and other data points in Figures 3.2 to 3.6.
21You can also read