Global Powers of Luxury Goods 2017 - The new luxury consumer - Deloitte
←
→
Page content transcription
If your browser does not render page correctly, please read the page content below

Global Powers of Luxury Goods 2017
The new luxury consumer
Contents
Foreword                                                                                                       1

Top 100 quick statistics                                                                                       3

The new luxury consumer                                                                                        4

Global economic outlook                                                                                      10

Top 100 highlights                                                                                           14

Global Powers of Luxury Goods Top 100                                                                        15

Top 10 highlights                                                                                            21

Geographic analysis                                                                                          24

Product sector analysis                                                                                      32

Newcomers                                                                                                    39

Fastest 20                                                                                                   41

Study methodology and data sources                                                                           43

Endnotes                                                                                                     46

Contacts                                                                                                     48

Luxury goods in this report focuses on luxury for personal use, and is the aggregation of designer apparel and footwear (ready-to-wear),
luxury bags and accessories (including eyewear), luxury jewellery and watches and premium cosmetics and fragrances.

Global Powers of Luxury Goods 2017                                                                                                         2
Foreword
Welcome to the fourth Global Powers of Luxury Goods.

The report examines and lists the 100 largest luxury goods companies globally, based on the consolidated sales of luxury goods in financial year
2015 (which we define as financial years ending within the 12 months to 30 June 2016). It also discusses the key trends shaping the luxury market
and provides a global economic outlook.

The world’s 100 largest luxury goods companies generated sales of $212 billion in financial year 2015, 4.5 percent down year-on-year. The average
luxury goods annual sales for a Top 100 company is now $2.1 billion.

Consumers in emerging markets continue to drive luxury market growth. In China, Russia and the United Arab Emirates, markets that we have
categorised as emerging luxury markets, the percentage of consumers claiming to have increased their spending stood at 70 per cent, compared to
53 per cent in the more mature markets (EU, US and Japan).

Travel/tourism is still the great growth opportunity. Almost half of luxury purchases are made by consumers who are travelling, either in a foreign
market (31 per cent) or while at the airport (16 per cent). This proportion rises to 60 per cent among consumers from emerging markets, who
typically do not have access to the same range of products and brands that can be found in more mature markets.

Key findings from the report include:

• Luxury goods sales growth is accelerated by currency volatility – sales for the world's 100 largest luxury goods companies grew by more than 3
  percentage points in 2015. Most currencies weakened significantly against the US dollar, which benefited many multinational companies based in
  other regions who experienced favorable currency effects, driving up reported sales.
• Italy is once again the leading luxury goods country in terms of number of companies, while France has the highest share of sales.
• Multiple luxury goods companies double sales growth and lead profitability, while bags and accessories continues to be the fastest growth sector.

We hope you find this report interesting and useful, and welcome your feedback.

Patrizia Arienti
EMEA Fashion & Luxury Leader
Deloitte Touche Tohmatsu Limited

Global Powers of Luxury Goods 2017                                                                                                                    1
Global Powers of Luxury Goods 2017 2

Top 100 quick statistics
                                                                              Composite
            Composite year-over-                                              return on
             year luxury goods                     Aggregate net                assets

                                                                             7.9%
               sales growth
                                                 luxury goods sales

              6.8%                                of Top 100 in US$

                                                 US$212                                         FY2013-2015

                               Average luxury
                               goods sales of
                                                  billion                                     Compound annual
                                                                                             growth rate in luxury
                                                                                                 goods sales
                                                                        Economic

                                                                                               5.2%
                             Top 100 companies
                                                                      concentration
                               US$2.1                                   of Top 10

                               billion                                48.1%
                                                   Minimum sales
                                                  required to be on
                                                     Top 100 list
                                                                                        Composite
              Composite                                                               asset turnover
           net profit margin
                                                    $180                               0.8x
               9.7%                                million

Global Powers of Luxury Goods 2017                                                                                   3
The new luxury consumer: key forces shaping
the luxury market
The decade of change                   Figure 1. In the last 5 years, would you say your
                                       inclination towards purchasing luxury products has…
                                                                                                                 Figure 2. And in the last 12 months such an
                                                                                                                 inclination has…
In last year’s edition of Global
                                                  70%                                                                    62%
Powers of Luxury Goods, we looked                                                                                              53%
                                                        59%                        Mature market                                                        Mature market
at ‘luxury’s new normal’, mid-way           53%                                    Emerging market                 49%                47%               Emerging market
                                                                                   Total                                                          43%   Total
through ‘the decade of change’,                                42%                                                                          35%
and we discussed the opportunities                                         37%

created by changing consumer                                         27%

behaviours, the blurring of channels
to market, increasing international                                               5%
                                                                                       3% 4%
                                                                                                                                                        5%
                                                                                                                                                             2%
                                                                                                                                                                  4%

travel, and the emergence of the             Increased        Stayed the same      Decreased                        Increased        Stayed the same     Decreased

millennial luxury consumer. This       Percentages may not add up to 100% exactly due to rounding
                                       Source: Deloitte Luxury Multicountry Survey for Global Powers of Luxury Goods 2017
year, we pick up on the key theme
of changing shopper behaviour and
the new luxury consumer, focusing
on two of the main trends that are     Consumers in emerging markets                                      Growth continues to be driven by consumers in emerging
                                                                                                          markets. In China, Russia and the United Arab Emirates
                                       continue to drive luxury market growth
driving change in the market, and      In February 2017 Deloitte surveyed luxury consumers across
                                                                                                          (UAE), markets that we have categorised as emerging luxury
                                                                                                          markets, the percentage of consumers claiming to have
exploring some of the implications     11 countries to explore their attitudes to luxury goods and        increased their spending stood at 70 per cent, compared to
for luxury brands and retailers.       their purchase behaviour.1 Our analysis found that over
                                       the last five years consumer spending on luxury goods has
                                                                                                          53 per cent in the more mature markets (EU, US and Japan).

                                       remained relatively robust, with only a small proportion (4 per
                                       cent) claiming to have cut back on their spending.

Global Powers of Luxury Goods 2017                                                                                                                                     4
When we look at spending in the last 12 months we can see Figure 3. Consider the last 12 months. How many of your luxury products purchases
a slight slow-down. The percentage of consumers spending took place in your home country, abroad or at an airport while travelling?
more than in the previous year fell to just over half, while the
percentage stating that they spent the same amount rose to Total Millennials
43 per cent. However, the proportion that stated they had
been cutting back remained the same.
16% 18%
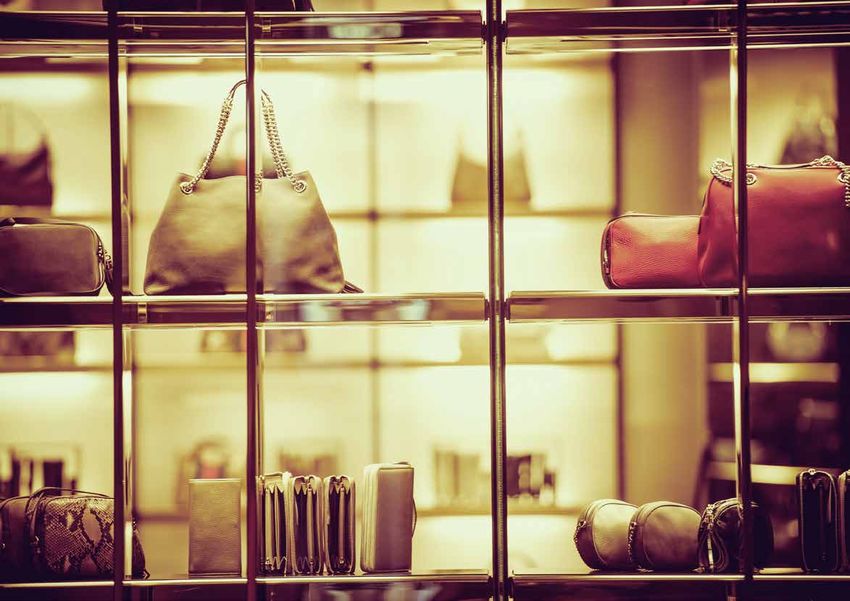
Our analysis of purchases by category shows there is
a relatively even spread across the six product sectors
53% 48%
considered in the survey (cosmetics and fragrances, watches, 31%
jewellery, bags and accessories, shoes and clothes) with one 33%
in five consumers making a purchase of luxury jewellery
or cosmetics and fragrances. However, there were big
differences between consumers in emerging luxury markets
and those in the more mature markets, with watches and Mature markets Generation X
jewellery favoured much more by those in emerging markets,
particularly in Russia and the UAE.
15% 16%
Home country
Travel/tourism still the great growth Abroad
opportunity 26%
59% 31%
54% Travelling at airport
Almost half of luxury purchases are made by consumers
who are travelling, either in a foreign market (31 per cent)
or while at the airport (16 per cent). This proportion rises to
60 per cent among consumers from emerging markets, who
typically do not have access to the same range of products Emerging markets Baby boomers
and brands that can be found in more mature markets.
Looking at this buying behaviour by generation, we can see
that the propensity to buy luxury products in the domestic 20% 13%
marketplace rises with age, peaking with the affluent and
asset rich baby boomers. Greater affordability is a driver of 41% 22%
luxury purchases outside the domestic market for 43 per 65%
cent of consumers. Other benefits associated with making 40%
luxury purchases abroad are access to a wider range of
products (43 per cent) and the ability to buy products that
are not available in the domestic market (65 per cent).
Percentages may not add up to 100% exactly due to rounding
Source: Deloitte Luxury Multicountry Survey for Global Powers of Luxury Goods 2017
Global Powers of Luxury Goods 2017 5Figure 4. Price Index (global average = 100%) by raising their prices; by March 2017 headline prices in
Like-for-like products, US$ equivalent prices the UK were 5 per cent higher for like-for-like items, and a
further effective 5 per cent rise was achieved by replacing
existing inventory with higher-priced products. Conversely,
China
China when the rouble appreciated during 2016, companies cut
Scope: all full price
products in the the prices of their luxury goods in Russia by over 11 per cent,
Japan
Japan
BenchMarque database to remain competitive.
which are listed in all
USA
USA
seven countries However, there remains significant regional price disparities
Russia
Russia Index values represent the within the luxury goods market. BenchMarque data
median US$-equivalent
price in that region relative reveals that despite increasing internationalisation, US
UK
UK
to the global average dollar-adjusted prices for equivalent items are on average
FX rates as reported by over 50 per cent higher in China than in Italy and France.
Italy
Italy
the Bank of England, This presents a clear arbitrage opportunity for travellers
at 13 March 2017 from Asia, and maintains the pre-eminence of European
France
France
brands’ home markets as shopping destinations. Although
0%
0% 20%
20% 40%
40% 60%
60% 80%
80% 100%
100% 120%
120% 140% a premium is charged in Asian markets for all brands,
pricing strategies vary, and the price difference between
Source: BenchMarque - Deloitte’s luxury pricing analytics suite. Each week, BenchMarque captures online prices for over 100,000 China and France varies from just 20 per cent to over 70
items, across 30 of the leading brands, in seven key luxury markets. A series of interactive data visualisations draws out key market
trends, enabling decision makers to deploy responsive, evidence-based pricing strategies. per cent, depending on the brand. The highest premium is
for watches and jewellery (55 per cent on average) and the
lowest is for bags (40 per cent on average).2
Luxury is a genuinely global market; this poses a challenge Data from BenchMarque, Deloitte’s luxury pricing analytics This suggests that luxury goods companies still have an
for both the luxury brands and luxury shoppers, particularly suite, shows that luxury goods companies respond to opportunity to optimise their range and prices for local
those who travel extensively. Prices, stock levels and ranges currency movements in order to maintain their pricing markets, to meet demand and ensure balanced growth
differ from market to market and between cities, making it structures between countries. In the weeks following the globally. Customer data and analytics can play a key role in
difficult to optimise pricing strategies. UK’s EU membership referendum in June 2016, the pound allowing brands to maximise sales at the optimum range and
fell by 18 per cent against the US dollar. Brands responded price points for each market.
Global Powers of Luxury Goods 2017 6Luxury market trends Figure 5. Here is a list of statements about the relation you might or might not have with luxury products,
please let us know to what extent you agree with each of them.
Deloitte has identified two key interconnected trends that we
believe will characterise the luxury goods markets in 2017:
I buy luxury products because they
88% 10% 3% are premium quality products
1. From physical products to digital experiential – the
essence of luxury is changing from an emphasis on the When I buy a luxury product
physical to a focus on the experiential and how luxury 82% 13% 4% I feel happy/confident
makes you feel. However premium quality remains a ‘must
have’ and consumers retain a keen eye for craftsmanship 75% 20% 5% I like to buy luxury products
which are hand-made
and hand-made products.
2. From standardisation to personalisation – expansion 68% 24% 8% For me it's important to buy the latest trend
through globalisation necessitated a one-size-fits-all
approach. However, changing luxury shopper behaviour
63% 21% 16% I buy luxury products because I like to have
demands a different, more personalised response. things that other people haven't heard of yet
From physical products to digital experiential
60% 21% 19% I tend to buy luxury products impulsively
Quality continues to be the key driver of luxury purchases
across all the markets we surveyed. Wealthy Chinese are
57% 24% 20% I tend to wear only luxury products and
the top spenders when it comes to quality: 93 per cent buy accessories (not common products)
luxury products because of their premium quality, and 90
per cent like to buy luxury products which are hand-made. 56% 22% 22% I buy luxury products because
89 per cent avoid buying luxury products that do not respect I like to show them off
ecological sustainability.
Agree Neither agree nor disagree Disagree
Another important issue is how luxury products make
Percentages may not add up to 100% exactly due to rounding
consumers feel. This relates to the intangible quality that Source: Deloitte Luxury Multicountry Survey for Global Powers of Luxury Goods 2017
luxury goods possess. More than half of the consumers in
our survey admit to conspicuous consumption or buying
luxury products purely for the status that comes with
possession of certain objects. Status has now become less and m-commerce will become more widespread, while over materials and methods of manufacturing. We have seen
about 'what I have' and much more about 'who I am': more a third (37 per cent) feel that luxury products and technology some attempts at the ‘premiumisation’ of technology, such
ethical, tasteful and discerning. Consumers are also clear will become more closely linked. as the Pierre Hardy-designed Hermès strap option on the
that they see the future of luxury as digital. When asked how Apple Watch3 and attempts at fusion such as the Samsung
A significant challenge for luxury goods companies is to find collaboration with Grisogono.4
they see the luxury sector developing in their respective
ways of incorporating digital technology into their products
countries, almost half (48 per cent) said that e-commerce
without losing their heritage or their focus on traditional
Global Powers of Luxury Goods 2017 7Disruption in the luxury sector is set to continue as the next Figure 6. Do you think the luxury world will be disrupted by emerging technologies such as robotics,
wave of digital technologies are adopted, such as iterative artificial intelligence and 3D printing?
manufacturing (3D printing), Artificial Intelligence, robotics
and Augmented Reality/Virtual Reality. Our survey found
Don't
that the majority of luxury goods buyers expect the market know
to be further disrupted. However, there was a difference of 8% Yes, in less than 2 years 16%
opinion about how quickly the disruption would happen, with
22 per cent believing that it would take more than six years. Yes, in 3-5 years 23%
No
31%
Another significant challenge for luxury goods companies is Yes
61% Yes, in 6-10 years 14%
how to transition to a more digitally-led distribution model
while retaining the all-important element of quality.
Yes, in more than 10 years 8%
Omnichannel distribution will emerge as the dominant
model in luxury retail, as it has done already in the
mainstream retail market. While e-commerce continues Source: Deloitte Luxury Multicountry Survey for Global Powers of Luxury Goods 2017
its relentless rise, our research shows that 63 per cent
of luxury goods purchases still take place in a physical
store, with luxury consumers in mature markets more Figure 7. How many of your luxury products purchases take place in a physical store, online from a
computer/laptop or online on a mobile device?
likely than average to shop in store, although consumers
in emerging market are more likely to shop on a mobile
device. Millennials are the most digitally-influenced luxury Total Mature markets Emerging markets
consumers, with 42 per cent of their purchases made either
by computer or via mobile devices, which are becoming 22% 21% 23%
more popular with all generations. This figure for Millennials
63% 15% 65% 14% 60% 17%
compares with 35 per cent for Generation X and 28 per cent
for Baby boomers. Online from a
computer/laptop
Online on a
From standardisation to personalisation Millennials Generation X Baby boomers mobile device
Multi-brand stores for luxury goods now account for 78 In a physical store
per cent of online purchases, whereas mono-brand stores 23% 21% 22%
dominate in the physical environment. This partly reflects the 6%
58% 66% 14%
dominance of online specialists (such as Yoox Net-A-Porter) 19% 72%
compared to the relative lack of investment online channels
by many of the major brands. It also reflects the fact that for
much of the past ten years, luxury brands have focused on
expanding their physical store networks into new markets Percentages may not add up to 100% exactly due to rounding
Source: Deloitte Luxury Multicountry Survey for Global Powers of Luxury Goods 2017
and territories.
Global Powers of Luxury Goods 2017 8The luxury sector has been through a period of expansion, Which person do you consider as the 'top influencer' of the luxury world?
as companies have grown by extending the reach of their
distribution networks and opening new stores in new
territories.
During this period of physical expansion the focus has been
on consistency and standardisation of experience which in Glamour
Rich people
VIPs
Actors
turn has led to generic stores and generic (albeit premium)
experiences.
However, consumer expectations from a luxury retail Fashion Bloggers
experience are changing. Our consumer survey shows that
luxury consumers now want:
• more shopping channels – 39 per cent are asking for home
Musicians
delivery
• more reward for their loyalty – 44 per cent are expecting
rewards through gifts Architects
• more personalisation – 45 per cent of are asking for Footballers
personalised products and services
Top Models
Designers Stylists
Digital channels are creating a need for large-scale high-
quality personalised content. Creating customised online
content to engage large numbers of consumers is a highly-
demanding challenge, and some luxury goods companies
have started to open up a dialogue with consumers and Youtubers Athletes
involve them in the marketing process.
Politicians Nobility
Bloggers
Engaging with the new luxury consumer is an opportunity
for companies to move the conversation on from price and
status, to a deeper connection focused on experiences
and the feelings that luxury products can evoke in their
purchasers.
Global Powers of Luxury Goods 2017 9Global economic outlook
Overview
The economic environment for luxury retailers continues
to be challenging, with slow growth in major developed
economies, high levels of debt in emerging markets,
deflation or low inflation in rich countries, a protectionist
backlash against globalisation, troubled credit markets in a
number of countries, and worsening demographics in many. Europe Russia
Yet despite the economic headwinds, the sector is resilient The Eurozone economy is growing at a moderate pace. Yet The Russian economy has been in recession, still suffering
and consumers are still making luxury purchases, especially despite the aggressive monetary policy of the European from the effects of economic sanctions among other factors,
in emerging markets. Central Bank, investment remains weak and unemployment and sales of luxury goods slowed down as middle class
high. Although the European luxury goods market has consumers tightened their belts. As their purchasing power
The US is the leading luxury goods market, and with the
moved on from the most difficult years, national economies decreased, a significant number of them have sought out
slowdown in sales in China, it is expected to remain so for
are recovering at different rates, with countries in southern lower-priced products. Looking ahead, the local currency
the next few years. An important influence affecting several
Europe still suffering from chronic unemployment and low is showing signs of stabilisation and moderate growth is
markets over the past year has been China and the Chinese
consumer confidence. Overall market growth is slow but expected in the market. However if the political and business
luxury consumer. A backdrop of uncertainty – the new US
steady, with both domestic shoppers and wealthy tourists environment worsens, sales from even the most affluent
government regime, Brexit and terrorist attacks in several
cautious about spending. Against a backdrop of further consumer segment will be adversely affected.
European cities – has deterred many potential Chinese
uncertainty, with upcoming elections in the UK (June) and in
buyers from travelling to key shopping destinations in the US
Germany (September), and safety concerns after terrorist
and Europe.
attacks in several European cities, many potential overseas
In this section, we look at the economic outlook for the major shoppers are being deterred from travelling to key shopping
luxury markets and the potential impact this may have on destinations in Europe. For now, Europe’s luxury sector is
retailers. likely to remain on a modest growth trajectory.
Global Powers of Luxury Goods 2017 10United Kingdom China/Hong Kong Rest of Asia
Strict measures by the Indian government in 2016, such as
One of the biggest news items of the past year was Britain’s Both mainland China and Hong Kong continued to
demonetisation, an excise duty on gold and diamond jewellery,
vote to exit the European Union (EU). The ‘Brexit’ decision experience a slowdown in luxury goods spending, with
and the tax on luxury goods to curb ‘black money’, have
led to a sharp decline in the value of the pound due to an economic uncertainty dampening consumer confidence. The
significantly affected luxury good sales in the country. However,
expectation that Brexit might reduce inbound investment Hong Kong market is still affected by the strained relations
India remains the bright spot among Asian and BRIC countries,
into the UK and initiate an economic slowdown. Some of with the mainland, with many wealthy Chinese tourists
and demand for luxury goods is expected to remain strong.
these fears have not materialised, but at the time of this staying away and choosing to travel to other Asian cities for
The long-term economic prospects and demographics are very
report, it is still unclear what type of Brexit deal will be their shopping.
favourable: a rapidly rising urban middle class with increasing
agreed or even whether the UK and the EU can successfully
In mainland China, the slowing economy has resulted in disposable incomes is expected to drive sales of luxury goods.
come to a mutually acceptable separation. After the 8 June
lower spending, and the central government’s crackdown But India still has many challenges to overcome before it
election, there may be more clarity.
on luxury gifts in the corporate sector continues to have becomes a major market for luxury brands. Regulations need to
Prices are expected to rise as the pound has devalued an impact. Nevertheless demand remains steady among be eased to allow entry of new retailers into the country, to help
substantially against the euro, increasing the cost of the country’s expanding middle class, with their increasing drive growth.
imported goods. Luxury retailers have absorbed most of the disposable incomes, as they continue to buy better quality
Despite the economic difficulties in Japan, the luxury sector
cost increases in the past year, but they will eventually have products and showcase their social status. In addition, as
experienced moderate growth in 2016, due to a steady supply
to pass these on to consumers, and this in turn will affect in other emerging markets, prices of luxury goods in China
of affluent consumers who continued to spend and also to a
demand. Wealthy tourists from the Middle East, China, the are being adjusted downwards to bring them into line with
boost from increasing tourist numbers ahead of the 2020 Tokyo
US and Russia continue to drive a significant proportion of global markets. This is leading more Chinese consumers to
Olympic Games. Part of the economic problem is demographics
demand in the UK luxury goods market, which is therefore purchase luxury brands in their domestic market.
– even after several years of an unusually easy monetary policy,
exposed to the risk of economic and political developments
the economy is barely growing. On a per worker basis, Japan’s
in these countries. There has been a noticeable reduction
economy has actually been growing at the same pace as the US,
of inbound tourist numbers and consequently luxury goods
yet the number of workers is declining, and this is contributing
spending (notably by Russian and Chinese visitors).
to slow growth. The strong yen and China’s slowing economy
remain key constraints on exports. However consumer
Global Powers of Luxury Goods 2017 11confidence is rising, and the sector is likely to continue its to make their luxury purchases while travelling abroad in it is now under pressure following the devaluation of
moderate rate of growth. Europe. The region is likely to feel the impact of political the Mexican peso, which has been hitting historical lows
unrest as well as global economic uncertainty, but further against the US dollar. The tactic adopted by retailers and
Although the global economic downturn and local political growth is nevertheless expected as Dubai and Abu Dhabi brands in the past has been to absorb the exchange rate
instability have affected several industries in South Korea, continue as attractive shopping destinations. differences, but this is not sustainable in the long term, and
luxury goods have prospered, with consumers showing many companies will have to pass on the higher prices to
increasingly sophisticated tastes. And as the market matures consumers. Economic growth is expected to slow down in
further, we are likely to see healthy growth in the coming 2017, with deteriorating business confidence and tighter
year. The country continued to benefit from an inflow financial conditions having an impact on consumer spending.
of Chinese tourists, who have shifted their purchasing In addition, the new US government’s attitudes towards
preferences towards higher value products such as jewellery immigration and the North American Free Trade Agreement
and watches. With sales of luxury goods in neighbouring
United States (NAFTA) could pose serious problems for the Mexican
China and Japan coming under political pressure, South economy. Despite this backdrop of economic and political
Korea continues to the most popular luxury shopping The rate of growth in the world’s largest luxury goods
uncertainty, the outlook for luxury goods is optimistic,
destination in Asia. market slowed in 2016, hampered by a strong US dollar
driven by Mexico’s fast-growing middle class who value
and a slowdown in trade from foreign tourists, in particular
quality at the right price, and by the upper-middle class who
from China. However the high value of the dollar has been
are seeking ever-more luxurious lifestyles to differentiate
beneficial for the domestic market, helping to keep down the
themselves.
prices of imported goods, and thereby boosting consumer
purchasing power. However although the improved jobs With a weak economy and widespread government
market and rising pay have supported local consumption, corruption, the dire state of affairs in Brazil is having a
US consumers are starting to cut back on discretionary dampening effect on the luxury market, and consumers
Middle East spending on clothing and other personal accessories, in the are becoming more conservative with their purchases. The
light of uncertainty about where the government’s policies gift sales market, which is a key part of luxury sales in the
The market in the Middle East continues to represent
are heading. In the coming year growth in the market is likely country, is seeing consumers trade down to ‘affordable
a big opportunity for luxury brands: luxury malls in Abu
to continue, although the rate of growth could be affected luxury’ when buying presents, due to weakening purchasing
Dhabi and Dubai have helped to promote these cities as
if the dollar continues to appreciate. Finally, there is a risk power and a wish to avoid seeming ostentatious in the
desirable shopping destinations. Well-established big-name
of protectionist measures that would boost import prices, light of the current economic climate and wider social
brands have performed well in the region, and tourism is a
something that would probably curtail the growth in retail concerns. Many Brazilian consumers, who in the past did
major driver of sales in Dubai. However, the market saw a
spending. their luxury shopping abroad, are now doing more of their
significant slowdown in 2016, caused by the low oil prices,
higher gold prices and an increase in the cost of living. shopping at home as they are travelling less. Also, prices of
luxury brands in Brazil have started to adjust to bring them
Another factor was the currency effect: the dirham is pegged Latin America
to the US dollar, and this effectively made the price of luxury more into line with global prices, making the savings from
Mexico is the largest luxury goods market in Latin America, overseas purchases less worthwhile. Brazil continues to
goods higher for tourists from Europe, whose currencies
followed by Brazil. Over the past year, it has benefited from be an important market for luxury goods as it is home to a
have devalued against the dollar. In addition, higher relative
relatively attractive prices for luxury goods in the domestic large number of wealthy people, and as the market is not yet
costs meant that local residents found it more attractive
market compared to purchasing them overseas. However mature, there is still a lot of potential for growth.
Global Powers of Luxury Goods 2017 12Global Powers of Luxury Goods 2017 13
Top 100 highlights
Luxury goods sales growth accelerated by favourable currency effects: profit margins stabilise

Growth in reported sales of the world's 100 largest luxury       • Luxottica agreed to merge with French lens maker Essilor      For the 80 companies reporting their net profits, asset
goods companies (the ‘Global Powers of Luxury Goods Top            in January 2017. The deal is expected to close in the         turnover (the ratio of net sales to average total assets) was
100’) jumped by more than three percentage points in 2015,         second half of 2017.                                          stable at 0.8 times. The composite return on assets, at 9.7
due primarily to favourable currency effects.                                                                                    percent, was lower than in 2014, but again, this was largely
                                                                 • Swiss luxury watchmaker Frédérique Constant was
                                                                                                                                 due to LVMH's exceptional profit in that year.
                                                                   acquired by Citizen Watch Co in May 2016.
Composite currency-adjusted luxury goods sales growth for
the world’s Top 100 luxury goods companies was 6.8 per           Profit margins in luxury goods companies (based on their        Sales of luxury goods by the Top 100 largest luxury goods
cent in 2015. This was a significant improvement on the 3.7      combined total revenue and net income) were down in 2015.       companies in 2015 totalled US$212 billion, giving average
per cent growth rate in 2014. For the 99 companies in the        The composite net profit margin for the 80 luxury goods         sales of US$2.1 billion per company; and 40companies had
Top 100 that reported their 2014 and 2015 luxury goods           companies disclosing their bottom-line profits fell by 1.7      luxury goods sales of more than US$1 billion, five less than
sales revenue, 67 per cent showed an increase in 2015, and       percentage points, to 9.7 per cent. However the composite       last year. The threshold sales level for belonging to the Top
49 of the Top 100 achieved higher sales growth in 2015 than      net profit margin for the Top 100 in the previous year was      100 in 2015 was US$180 million, less than in 2014 due
in 2014. Only six companies suffered a double-digit sales        boosted by LVMH's €2.677 billion exceptional profit from the    mainly to the strengthening of the US dollar.
decline in 2015: half of these were jewellers, which continued   distribution of Hermès shares. Excluding this effect, the net
to experience volatile demand.                                   profit margin for the Top 100 in 2015 was nearly the same as
                                                                 in 2014.
There was no significant impact from mergers or acquisitions
on the Top 100 luxury goods companies in 2015. The major         Around a quarter of these companies improved their net
M&A activity all happened after the end of 2015:                 profit margin over the previous year. Only nine companies
                                                                 made a loss, the same number as in last year's report.
• Coty acquired Procter & Gamble's global fine fragrances,
  salon professional, cosmetics and retail hair colour           The number of all-round high performers dropped back this
  businesses, along with some hair styling brands, completed     year: eight companies achieved both double-digit growth in
  in October 2016.                                               luxury goods sales and a double-digit net profit margin in
                                                                 2015, compared to 15 in last year's report.
• Elizabeth Arden was acquired by Revlon, completed
  September 2016.

Global Powers of Luxury Goods 2017                                                                                                                                                               14
Global Powers of Luxury Goods Top 100
Top 100 luxury goods companies
FY2015 FY2014 FY2015 FY2015 FY2013-2015
Luxury Luxury Luxury FY2015 Luxury FY2015 Luxury
goods goods goods Total goods Net goods
sales sales Country sales revenue sales profit sales
ranking ranking Company name Selection of luxury brands of origin (US$m) (US$m) growth margin1 CAGR2
1 1 LVMH Moët Hennessy-Louis Vuit- Louis Vuitton, Fendi, Bulgari, Loro Piana, Emilio Pucci, Acqua France 22,431 39,615 15.2% 11.2% 11.0%
ton SE di Parma, Donna Karan, Loewe, Marc Jacobs, TAG Heuer,
Benefit Cosmetics
2 2 Compagnie Financière Richemont Cartier, Van Cleef & Arpels, Montblanc, Jaeger-LeCoultre, Switzerland 12,232 12,232 6.4% 20.1% 5.1%
SA Vacheron Constantin, IWC, Piaget, Chloé, Officine Panerai
3 3 The Estée Lauder Companies Inc. Estée Lauder, M.A.C., Aramis, Clinique, Aveda, Jo Malone; US 11,262 11,262 4.5% 10.0% 1.3%
Licensed fragrance brands
4 4 Luxottica Group SpA Ray-Ban, Oakley, Vogue Eyewear, Persol, Oliver Peoples; Italy 9,815 9,815 15.5% 9.1% 9.9%
Licensed eyewear brands
5 6 Kering SA Gucci, Bottega Veneta, Saint Laurent, Balenciaga, Brioni, Ser- France 8,737 12,867 16.4% 6.2% 10.3%
gio Rossi, Pomellato, Girard-Perregaux, Ulysse Nardin
6 5 The Swatch Group Ltd. Omega, Longines, Breguet, Harry Winston, Rado, Blancpain; Switzerland 8,508 8,795 -3.0% 13.2% 0.0%
Licensed watch brands
7 8 L'Oréal Luxe Lancôme, Biotherm, Helena Rubinstein, Urban Decay, Kiehl's; France 8,031 e 8,031 e 16.7% 15.2% e 11.0%
Licensed brands
8 9 Ralph Lauren Corporation Ralph Lauren, Polo Ralph Lauren, Purple Label, Double RL, US 7,405 7,405 -2.8% 5.3% -0.3%
Club Monaco
9 7 Chow Tai Fook Jewellery Group Chow Tai Fook, Hearts on Fire Hong Kong 7,295 7,295 -11.9% 5.3% -14.5%
Limited 周大福珠宝集团有限公司
10 10 PVH Corp. Calvin Klein, Tommy Hilfiger US 6,292 8,020 -2.3% 7.1% 0.7%
11 11 Rolex SA Rolex, Tudor Switzerland 5,724 e 5,724 e 7.8% n/a 4.9%
12 12 Hermès International SCA Hermès, John Lobb France 5,377 5,377 17.5% 20.2% 13.7%
13 14 Lao Feng Xiang Co., Ltd. Lao Feng Xiang China 4,994 5,747 7.9% 4.0% 6.7%
老凤祥股份有限公司
¹ Net profit margin based on total consolidated revenue and net income
² Compound annual growth rate
e = estimated from company source
n/a = not available
ne = not in existence
Source: Published company data and industry estimates
*Top 100 sales growth rates are sales-weighted, currency-adjusted composites
**Top 100 net profit margin, return on assets and asset turnover ratio are sales-weighted composites
Global Powers of Luxury Goods 2017 15FY2015 FY2014 FY2015 FY2015 FY2013-2015
Luxury Luxury Luxury FY2015 Luxury FY2015 Luxury
goods goods goods Total goods Net goods
sales sales Country sales revenue sales profit sales
ranking ranking Company name Selection of luxury brands of origin (US$m) (US$m) growth margin1 CAGR2
14 16 Michael Kors Holdings Limited Michael Kors, MICHAEL Michael Kors UK 4,712 4,712 7.8% 17.8% 19.3%
迈克高仕控股有限公司
15 18 Coach, Inc. Coach, Stuart Weitzman US 4,492 4,492 7.2% 10.3% -3.3%
16 17 Tiffany & Co. Tiffany & Co., Tiffany US 4,105 4,105 -3.4% 11.3% 0.9%
17 15 Prada Group Prada, Miu Miu, Church's, Car Shoe Italy 3,917 3,917 -0.1% 9.4% -0.6%
18 19 Burberry Group plc Burberry UK 3,794 3,794 -0.3% 12.5% 3.9%
19 20 Hugo Boss AG BOSS, HUGO, BOSS Green, BOSS Orange Germany 3,120 3,120 9.2% 11.4% 7.5%
20 30 Fossil Group, Inc. Fossil, Michele, Relic, Skagen, Zodiac, Misfit Licensed brands US 3,107 e 3,229 -8.4% 7.1% -0.7%
21 21 Giorgio Armani SpA Giorgio Armani, Emporio Armani, Armani, A|X Armani Italy 2,961 2,961 4.6% 9.0% 10.4%
Exchange
22 22 Swarovski Crystal Business Swarovski Austria 2,888 2,888 11.6% n/a 5.6%
23 23 Coty Inc. philosophy, JOOP!, Lancaster, Calvin Klein fragrance; US 2,706 4,349 -8.3% 4.1% -7.8%
Licensed fragrance brands: Marc Jacobs, Chloé, DAVIDOFF
24 26 Pandora A/S Pandora Denmark 2,492 2,492 40.2% 22.0% 36.3%
25 25 Chow Sang Sang Holdings Chow Sang Sang Hong Kong 2,157 2,460 -1.2% 5.9% -8.4%
International Limited
周生生集团国际有限公司
26 27 Christian Dior Couture SA Christian Dior France 2,058 2,058 5.0% 6.1% 11.0%
27 24 Puig S.L. Carolina Herrera, Nina Ricci, Paco Rabanne, Jean Paul Spain 1,827 1,827 9.1% 8.0% 4.8%
Gaultier, Penhaligon's; Licensed fragrance brands
28 31 Luk Fook Holdings (International) Luk Fook Hong Kong 1,809 1,809 -8.9% 6.9% -13.5%
Limited 六福集团(国际)有限公司
29 28 OTB SpA Diesel, Maison Margiela, Viktor&Rolf, Marni Italy 1,766 1,766 2.2% 0.2% 1.2%
30 40 Gitanjali Gems Ltd. Gili, Nakshatra, Sangini, Asmi, Passion Stone India 1,724 2,168 43.1% 1.0% 30.6%
31 32 Titan Company Limited Tanishq, Titan, Zoya, Nebula, Xylys India 1,690 1,738 -5.6% 6.1% 1.5%
32 29 Clarins SA Clarins, My Blend, Thierry Mugler, Azzaro France 1,666 e 1,666 e 0.0% n/a 0.3%
33 34 Salvatore Ferragamo SpA Salvatore Ferragamo Italy 1,574 1,588 7.3% 12.2% 6.6%
34 33 Max Mara Fashion Group Srl MaxMara, SportMax, Marina Rinaldi, Max & Co, PennyBlack Italy 1,558 1,558 4.9% 6.0% 4.3%
¹ Net profit margin based on total consolidated revenue and net income
² Compound annual growth rate
e = estimated from company source
n/a = not available
ne = not in existence
Source: Published company data and industry estimates
*Top 100 sales growth rates are sales-weighted, currency-adjusted composites
**Top 100 net profit margin, return on assets and asset turnover ratio are sales-weighted composites
Global Powers of Luxury Goods 2017 16FY2015 FY2014 FY2015 FY2015 FY2013-2015
Luxury Luxury Luxury FY2015 Luxury FY2015 Luxury
goods goods goods Total goods Net goods
sales sales Country sales revenue sales profit sales
ranking ranking Company name Selection of luxury brands of origin (US$m) (US$m) growth margin1 CAGR2
35 35 Ermenegildo Zegna Holditalia SpA Ermenegildo Zegna, Z Zegna, Zegna Sport Italy 1,429 1,429 0.1% 3.5% 0.6%
36 53 Eastern Gold Jade Co., Ltd Eastern Gold Jade China 1,426 1,426 95.1% 3.4% 22.3%
37 36 Safilo Group SpA Safilo, Carrera, Oxydo, Smith Optics; Licensed eyewear Italy 1,421 1,421 8.5% -4.1% 6.8%
brands
38 37 L'Occitane International SA L’Occitane en Provence, Melvita, erborian, L’Occitane au Luxembourg 1,417 1,417 8.9% 8.9% 10.3%
Brésil
39 38 Dolce&Gabbana S.r.l. Dolce&Gabbana Italy 1,306 1,306 8.7% 1.5% 11.6%
e e
40 41 Patek Philippe SA Patek Philippe Switzerland 1,238 1,238 2.6% n/a 4.0%
41 43 Kate Spade & Company kate spade new york, JACK SPADE US 1,219 1,243 10.3% 1.4% 28.1%
42 39 TOD'S SpA Tod’s, Hogan, Fay, Roger Vivier Italy 1,165 1,165 7.4% 8.8% 3.3%
43 48 Valentino Fashion Group SpA Valentino, REDValentino Italy 1,163 1,163 44.1% 7.0% 37.8%
44 44 PC Jeweller Ltd. PC Jeweller, AZVA India 1,123 1,130 15.2% 5.4% 17.3%
45 45 Tory Burch LLC Tory Burch, Tory Sport US 1,050 e 1,050 e 5.0% n/a 8.0%
46 49 Moncler SpA Moncler Italy 978 978 26.8% 19.1% 23.1%
47 47 Elizabeth Arden, Inc. Elizabeth Arden; Licensed fragrance brands US 967 967 -0.4% -7.6% -8.9%
48 42 Zhejiang Ming Jewelry Co., Ltd. MINGR China 843 843 -23.4% 1.2% -21.7%
浙江明牌珠宝股份有限公司
49 50 Le Petit-Fils de L.-U. Chopard & Chopard Switzerland 833 e 833 e 0.0% n/a 0.0%
Cie SA
50 52 Audemars Piguet & Cie Audemars Piguet Switzerland 833 e 833 e 14.3% n/a 11.8%
51 - SMCP SAS Sandro, maje, Claudie Pierlot France 750 750 32.8% 1.2% 26.5%
52 51 CFEB Sisley SAS Sisley France 745 e 745 e 5.2% n/a 5.0%
53 54 Gianni Versace SpA Versace Collection, Versus Versace, Palazzo Versace Italy 722 722 17.6% 2.6% 16.5%
54 - Ted Baker plc Ted Baker UK 695 695 17.7% 9.7% 19.1%
55 46 Graff Diamonds International Graff UK 630 630 -28.7% 7.4% -3.8%
Limited
56 56 Longchamp SAS Longchamp, Le Pliage France 629 e 629 e 13.2% n/a 10.7%
57 57 Movado Group, Inc. Concord, EBEL, Movado; Licensed watch brands US 595 595 1.4% 7.7% 2.1%
¹ Net profit margin based on total consolidated revenue and net income
² Compound annual growth rate
e = estimated from company source
n/a = not available
ne = not in existence
Source: Published company data and industry estimates
*Top 100 sales growth rates are sales-weighted, currency-adjusted composites
**Top 100 net profit margin, return on assets and asset turnover ratio are sales-weighted composites
Global Powers of Luxury Goods 2017 17FY2015 FY2014 FY2015 FY2015 FY2013-2015
Luxury Luxury Luxury FY2015 Luxury FY2015 Luxury
goods goods goods Total goods Net goods
sales sales Country sales revenue sales profit sales
ranking ranking Company name Selection of luxury brands of origin (US$m) (US$m) growth margin1 CAGR2
58 55 Renown Incorporated C'est Privee, D'Urban, Intermezzo Japan 590 590 -1.4% 0.8% -3.1%
e e
59 - Gerhard D. Wempe KG Wempe, Wempe Glashütte, By Kim Germany 589 589 1.9% n/a 8.2%
60 - Cole Haan LLC Cole Haan US 585 e 585 e n/a n/a -2.1%
61 59 Tumi Holdings, Inc. Tumi US 548 548 3.9% 11.5% 8.2%
62 58 Sungjoo D&D Inc MCM South Korea 497 499 -2.3% 6.7% 11.8%
63 62 Jimmy Choo plc Jimmy Choo UK 486 486 6.1% 6.1% 6.3%
64 63 Marcolin Group Marcolin; Licensed eyewear brands Italy 483 483 20.1% -0.6% 43.1%
65 61 Inter Parfums, Inc. Lanvin, Rochas, Intimate, Aziza; Licensed fragrance brands US 469 469 -6.2% 8.3% -8.8%
66 60 De Rigo SpA Police, Lozza, Sting; Licensed eyewear brands Italy 462 462 7.7% 3.3% 6.7%
67 64 Brunello Cucinelli SpA Brunello Cucinelli Italy 461 461 16.1% 7.9% 13.4%
68 - Marc O’Polo AG MARC O'POLO Germany 455 e 461 e -0.1% n/a 2.4%
69 69 Kurt Geiger Limited Kurt Geiger London, KG Kurt Geiger, Carvela Kurt Geiger, UK 431 431 11.9% 7.2% 13.6%
Miss KG
70 67 True Religion Apparel, Inc. True Religion US 400 e 400 e -7.0% n/a -9.6%
e
71 70 Breitling SA Breitling Switzerland 385 385 e 0.0% n/a 2.8%
72 73 Furla SpA Furla Italy 382 382 27.2% 6.8% 22.9%
73 71 Sociedad Textil Lonia SA Purificación García; Licensed brand : CH Carolina Herrera Spain 368 368 8.8% 9.7% 7.2%
74 79 Restoque Comércio e Confecções Le Lis Blanc Deux, Dudalina, Bo.Bô., JOHN JOHN Brazil 363 363 55.2% -1.4% 29.1%
de Roupas S.A.
75 66 Gefin SpA Etro Italy 352 352 -2.1% -0.6% 2.3%
76 68 Liu.Jo SpA Liu.Jo Italy 339 339 -5.1% 9.4% 4.7%
e e
77 76 Frédérique Constant SA Frederique Constant, Alpina, Ateliers deMonaco Switzerland 333 333 3.2% n/a 8.9%
78 72 S Tous SL Tous Spain 332 332 9.9% 8.5% 10.7%
79 74 Aeffe SpA Moschino, Pollini, Alberta Ferretti, Philosophy Italy 304 304 7.1% 0.6% 4.5%
e e
80 75 Franck Muller Group Franck Muller Switzerland 297 297 -8.1% n/a -4.1%
81 78 Euroitalia S.r.l. Reporter, Naj-Oleari; Licensed Fragrance brands: Moschino, Italy 296 296 6.2% 10.2% 8.1%
Versace, Missoni
¹ Net profit margin based on total consolidated revenue and net income
² Compound annual growth rate
e = estimated from company source
n/a = not available
ne = not in existence
Source: Published company data and industry estimates
*Top 100 sales growth rates are sales-weighted, currency-adjusted composites
**Top 100 net profit margin, return on assets and asset turnover ratio are sales-weighted composites
Global Powers of Luxury Goods 2017 18FY2015 FY2014 FY2015 FY2015 FY2013-2015
Luxury Luxury Luxury FY2015 Luxury FY2015 Luxury
goods goods goods Total goods Net goods
sales sales Country sales revenue sales profit sales
ranking ranking Company name Selection of luxury brands of origin (US$m) (US$m) growth margin1 CAGR2
82 82 Paul Smith Group Holdings Limited Paul Smith UK 285 285 -5.5% 3.5% -2.7%
83 - Marc Cain Holding GmbH Marc Cain Germany 282 288 4.3% 7.0% 0.3%
84 85 Festina Lotus SA Festina, Lotus, Jaguar, Candino, Calypso Spain 275 275 14.5% 2.8% 10.0%
85 84 TWIN SET—Simona Barbieri SpA Twin Set, SCEE, Le Coeur Italy 273 273 12.6% -4.2% 12.6%
86 - Charles Tyrwhitt LLP Charles Tyrwhitt UK 271 271 19.6% 10.7% 19.9%
87 81 Fashion Box SpA Replay Italy 264 264 3.8% -11.1% 8.0%
e e
88 83 Falke KGaA Falke, Burlington Germany 250 250 1.4% n/a -0.2%
89 77 Trinity Limited 利邦控股有限公司 Cerruti 1881, Kent & Curwen, Gieves & Hawkes Hong Kong 247 247 -27.0% -4.6% -15.7%
90 91 Mulberry Group plc Mulberry UK 235 237 4.9% 1.7% -2.3%
91 87 K.Mikimoto & Co., Ltd. Mikimoto Japan 235 235 2.2% n/a 8.2%
e
92 - J Barbour & Sons Ltd Barbour UK 233 233 e -7.4% 9.7% e
0.9%
e e
93 80 Willy Bogner GmbH & Co. KGaA Bogner, Sônia Bogner, Bogner Fire + Ice Germany 230 230 -11.3% n/a -8.4%
94 93 Vicini SpA Guiseppe Zanotti Design, Vicini Italy 203 203 10.7% 12.0% 22.1%
95 88 Canali SpA Canali Italy 200 200 -8.8% 6.7% -3.4%
96 86 Roberto Cavalli SpA Roberto Cavalli, Just Cavalli, Cavalli Class Italy 195 195 -17.0% 18.6% -6.5%
97 105 Richard Mille SA Richard Mille Switzerland 193 193 21.7% n/a 18.4%
98 92 Jeanne Lanvin SA Lanvin France 186 186 -0.6% 1.7% -5.1%
99 103 Acne Studios Holding AB Acne Studios Sweden 181 181 23.7% 12.9% 27.6%
100 98 Wolford AG Wolford Austria 180 188 3.2% -3.7% 2.1%
¹ Net profit margin based on total consolidated revenue and net income
² Compound annual growth rate
e = estimated from company source
n/a = not available
ne = not in existence
Source: Published company data and industry estimates
*Top 100 sales growth rates are sales-weighted, currency-adjusted composites
**Top 100 net profit margin, return on assets and asset turnover ratio are sales-weighted composites
Global Powers of Luxury Goods 2017 19Impact of exchange rates on ranking Impact of data availability on ranking
The Top 100 Global Powers of Luxury Goods have been There were ten new entrants to the Top 100 in
ranked according to their FY2015 luxury goods sales FY2015. Most of these were due to improved data,
in US dollars (US$). Changes in the overall rankings rather than major company sales changes. For more
from year to year are generally driven by increases information, see the Newcomers section. Many luxury
or decreases in company sales. However, a stronger goods companies are privately owned. Some of these
reporting currency vis-à-vis the US$ in 2015 means that file official reports containing financial information; for
a company may rank higher in 2015 than it did in 2014, others, estimates are made from information sources
all other things being equal. Conversely, companies such as press interviews and industry analysts. A small
reporting in a weaker currency may rank lower. 2015 number of companies do not disclose any financial
saw nearly all currencies weakening significantly against information, and so cannot be included in our rankings.
the US$. The Brazilian real weakened the most, by This year, no reasonable estimates could be made for
28%. Next were the Swedish krona, down by 19% and the following companies appearing in last year's 2014
the euro and Danish krone, both down by 16%. The ranking: Shiseido, Bally International and Laboratoire
Japanese yen weakened by 13%, and the British pound Nuxe - so they are not included in this year's Top 100.
and South Korean won by 7%. Other major currencies
for companies in this report saw a change of less than
5% against the US$ in 2015: the Swiss franc and Indian
rupee weakened by just under 5%, and the Chinese yen
by 1%, while there was virtually no change in the US$-
pegged Hong Kong dollar. For companies, the impact
of these exchange rate movements on sales depends
on both their reporting currency, and the geographic
spread of their business and resulting exposure to
different currencies.
Global Powers of Luxury Goods 2017 20Top 10 highlights
Top 10 luxury companies: winners and losers shaped by currency volatility
The world's Top 10 luxury goods companies were the same Figure 8: Impact of exchange rates on growth of Top 10 companies
in 2015 as in 2014, with little acquisition activity by the
leading companies during the year. The major M&A event –
the €50 billion merger of Italy's Luxottica and France's Essilor
– was announced in January 2017. The top three companies, -15% -10% -5% 0% 5% 10% 15% 20%
LVMH, Richemont and Estée Lauder, retained their leading
positions.
LVMH
The Top 10 saw a 7.6 percentage point jump in reported
Richemont
sales growth to 9.6 per cent, although much of this was
due to changes in currency exchange rates. The volatility Estée Lauder
in currencies had significantly different impacts on Top 10
companies, depending on their reporting currency and Luxottica
their geographic spread of business around the world (see Kering
Figure 1). Companies reporting in euros (LVMH, Richemont,
Luxottica, Kering and L'Oréal Luxe) saw sales growth Swatch
higher by 7 to 11 percentage points, when compared with
L'Oréal Luxe
sales growth at constant currency. Currency exchange
rate movements were unfavourable for the other Top 10 Ralph Lauren
companies: US-based Estée Lauder, Ralph Lauren and PVH
suffered from the strength of the dollar in international sales, Chow Tai Fook
and softness in retail and tourist sales in their domestic
PVH Corp.
market. Swatch was hit by the shock January 2015 decision
to unpeg the Swiss franc/euro fixed exchange rate, resulting
in a "massively overvalued Swiss franc" according to Swatch. Total sales growth reported Total sales @ constant exchange rates
Their 3 per cent decline in sales in Swiss francs would have
been growth of 10.3 per cent if reported in euros. Hong
Kong-based Chow Tai Fook's continued sales decline was
also exacerbated by unfavourable currency exchange rates.
Global Powers of Luxury Goods 2017 21Thanks in part to these currency effects, L'Oréal Luxe and directly-operated store network and high tourist numbers in Asian jeweller Chow Tai Fook's sales continued to drop back
LVMH were two of only eight luxury goods 'high achievers' in Western Europe and Japan, plus the full-year consolidation of to levels last seen in 2012, due to the strength of the US
the Top 100, with double-digit growth in luxury goods sales, its 2014 Ulysse Nardin acquisition. Net profit margin was also dollar, a drop in tourist visits to Hong Kong/Macau (partly
and double-digit profit margins. Sales at LVMH, Richemont, up, although this hid a big drop in consolidated net income caused by a change to the 'Individual Visiting Scheme' in
Estée Lauder, Luxottica, Kering and L'Oréal Luxe all grew at from continuing operations. Kering started 2015 by finalising Mainland China) and continuing economic slowdown in the
a faster rate than in 2014. Leading luxury goods company the sale of the last Redcats companies, and finished it by region.
LVMH, which accounts for over ten per cent of total luxury completing the sale of luxury shoemaker Sergio Rossi.
goods sales by the Top 100 companies, delivered record Looking at the Top 10 as a group, their composite
revenues and operating profit in 2015: its luxury goods Swatch maintained its long-term strategy of favouring a compound annual growth rate (CAGR) in luxury goods sales
sales were up six per cent at constant exchange rates and defensive price adjustment policy over short-term profit in the period 2013-2015 was up 1.7 percentage points, at
net profit margin was similar to last year (excluding the making, despite the impact of the Swiss franc revaluation on 6.8 per cent. This was higher than the 5.2 per cent CAGR for
2014 exceptional profit of €2.677 billion from an enforced sales, which created a marked distortion of the international the Top 100 companies. Although the Top 10 composite net
distribution of Hermès shares). pricing structure. It delivered the eighth-highest net profit profit margin dropped 1.8 percentage points, to 11.4 per
margin among the Top 100 companies, losing only three cent, this was due to the effect of LVMH's exceptional 2014
Richemont’s sales dropped slightly, at constant exchange percentage points to 13.2 per cent. profit from the distribution of Hermès shares. Excluding this
rates, as its Swiss-based luxury watch companies felt the effect, the composite net profit margin improved slightly. The
impact of the Swiss franc revaluation on its international L'Oréal Luxe was the best performer in the Top 10. Like its leading luxury goods companies continued to outperform
sales, but it achieved the highest net profit margin in the Top competitor Estée Lauder, it saw strong growth in make-up the Top 100, contributing nearly two-thirds of the total Top
10. This was partly due to a non-cash gain in October 2015 and fragrances, as well as e-commerce. It also achieved an 100 profits. All Top 10 companies were profitable, and half
from the merger of Net-A-Porter Group with Yoox Group. estimated double-digit net profit margin, at a similar level to achieved double-digit net profit margins.
2014.
Estée Lauder's Strategic Modernization Initiative started to
bear fruit, as it returned to sales growth while maintaining US-based fashion companies Ralph Lauren and PVH
net profit margin. Its growth at constant exchange rates, both saw reported sales fall by 2 to3 per cent. Sales at
Among these Top 10 companies, three are
7 per cent, was the highest in the Top 10. Investments in constant exchange rates were higher than in 2014, despite
conglomerates participating in multiple sectors
the luxury end of its portfolio, including the acquisition of soft demand for apparel in the US, their largest market,
of the luxury goods market, two are cosmetics
prestige fragrance brand 'By Kilian' in February 2016, helped and a decline in foreign tourist traffic. PVH exited its Izod
and fragrance companies, two are jewellery and
drive strong growth in make-up and luxury fragrance. It also retail business in 2015, and in April 2016 concluded the
watch companies, two are fashion companies,
passed the US$1 billion milestone for online sales through acquisition of the 55 per cent interest in TH Asia Ltd, its joint
and global eyewear leader Luxottica is the only
both company and retailer e- and m-commerce platforms. venture for Tommy Hilfiger in China that it did not already
accessories company. Three are headquartered
own. This has enabled PVH to operate directly in Asia, its
in the US, three in France, two in Switzerland and
Luxottica saw growth in all regions and distribution channels, fastest growing market. Ralph Lauren's net profit margin
one in each of Italy and Hong Kong.
and improved net profit margin slightly. The balanced dropped nearly four percentage points, whereas PVH's profit
brand portfolio of Kering's Luxury Division, plus favourable margin continued to improve, as charges associated with the
currency effects, helped it to achieve higher growth than any integration of the 2013 Warnaco acquisition and pension
other Top 10 company. Luxury goods sales were up nearly costs both decreased.
12 percentage points, supported by momentum in the
Global Powers of Luxury Goods 2017 22Top 10 luxury goods companies
FY2015 FY2014 FY2015 FY2013-2015
FY2015
Luxury Luxury FY2015 Luxury FY2015 FY2015 Luxury
Luxury
goods goods Total goods Net Return goods
goods
sales sales Country revenue sales profit on sales
sales
ranking ranking Company name Selection of luxury brands of origin (US$m) growth* margin** assets* CAGR* ***
(US$m)
Louis Vuitton, Fendi, Bulgari, Loro Piana, Emilio
LVMH Moët Hennessy- 39,615
1 1 Pucci, Acqua di Parma, Donna Karan, Loewe, France 22,431 15.2% 11.2% 6.9% 11.0%
Louis Vuitton SE Marc Jacobs, TAG Heuer, Benefit Cosmetics
Cartier, Van Cleef & Arpels, Montblanc, Jaeger-
Compagnie Financière 12,232
2 2 LeCoultre, Vacheron Constantin, IWC, Piaget, Switzerland 12,232 6.4% 20.1% 11.1% 5.1%
Richemont SA
Chloé, Officine Panerai
The Estée Lauder Estée Lauder, M.A.C., Aramis, Clinique, Aveda, 11,262
3 3 US 11,262 4.5% 10.0% 12.2% 1.3%
Companies Inc. Jo Malone; Licensed fragrance brands
Ray-Ban, Oakley, Vogue Eyewear, Persol, Oliver 9,815
4 4 Luxottica Group SpA Italy 9,815 15.5% 9.1% 8.4% 9.9%
Peoples; Licensed eyewear brands
Gucci, Bottega Veneta, Saint Laurent, Balen-
5 6 Kering SA ciaga, Brioni, Sergio Rossi, Pomellato, Girard- France 8,737 12,867 16.4% 6.2% 3.0% 10.3%
Perregaux, Ulysse Nardin
Omega, Longines, Breguet, Harry Winston, 8,795
6 5 The Swatch Group Ltd. Switzerland 8,508 -3.0% 13.2% 8.4% 0.0%
Rado, Blancpain; Licensed watch brands
Lancôme, Biotherm, Helena Rubinstein, Urban 8,031e
7 8 L'Oréal Luxe France 8,031e 16.7% 15.2%e 21.0% 11.0%
Decay, Kiehl's; Licensed brands
Ralph Lauren, Polo Ralph Lauren, Purple Label, 7,405
8 9 Ralph Lauren Corporation US 7,405 -2.8% 5.3% 6.4% -0.3%
Double RL, Club Monaco
Chow Tai Fook Jewellery
9 7 Group Limited Chow Tai Fook, Hearts on Fire Hong Kong 7,295 7,295 -11.9% 5.3% 5.4% -14.5%
周大福珠宝集团有限公司
10 10 PVH Corp. Calvin Klein, Tommy Hilfiger US 6,292 8,020 -2.3% 7.1% 5.4% 0.7%
Top 10 102,009 125,339 9.6% 11.4% 7.9% 6.8%
Top 100 212,029 238,739 6.8% 9.7% 7.9% 5.2%
Economic concentration of Top 10 48.1% 52.5%
* Top 10 and Top 100 sales growth figures are sales-weighted, currency-adjusted composites e = estimated from company source
** Top 10 and Top 100 figures are sales-weighted composites Source: Published company data and industry estimates
*** Compound annual growth rate
Global Powers of Luxury Goods 2017 23You can also read