Connecting the Top of the South - Marlborough Regional Land Transport Plan 2015-2021 and Statement of Proposal - Marlborough District ...
←
→
Page content transcription
If your browser does not render page correctly, please read the page content below
Connecting the Top of the South
  Marlborough Regional Land Transport Plan
    2015-2021 and Statement of Proposal

Marlborough District Council, Nelson City Council and Tasman District Council

                                     1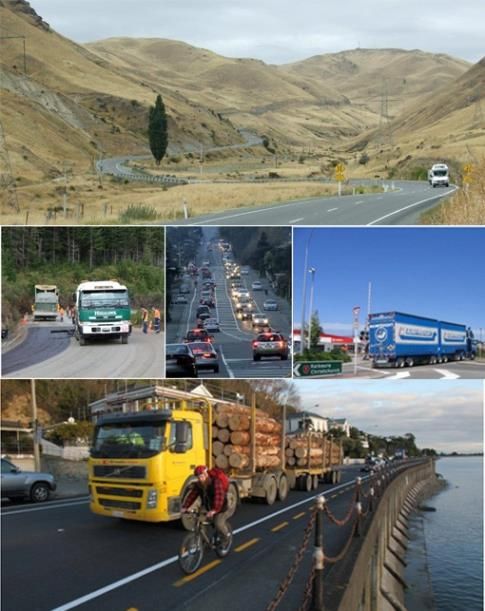
Record of Amendments

Amendment   Description of change       Effective date   Updated by
number

                                    2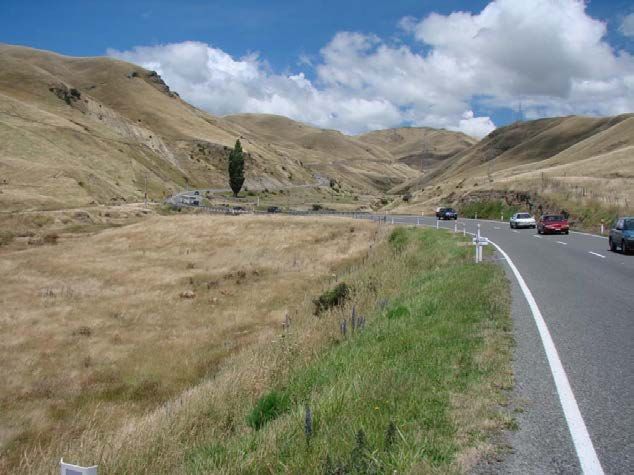
Foreword
Marlborough has 1527 km of local road and 259 km of state highway. Land transport is fundamental to our
community, be it by foot, car, bicycle, motorbike, truck, bus, horse, wheelchair, scooter or push-chair. It
enables and enhances access to employment, education, recreation and services, as well as the movement
of freight. The social and economic well-being of our people is dependent on an efficient and effective
roading network and ongoing transport planning. If the Marlborough District is to continue to grow and
prosper we need to rely on a safe and efficient transport network that provides value for money.

The Marlborough Regional Land Transport Plan (the Plan) is a critical document for the Marlborough District
as it underpins all of the District’s road network and transportation planning and investment priorities over the
next six years. The Plan is expected to be reviewed every three years. From a statutory perspective, the
Plan meets the requirements of the Land Transport Management Act 2003 and contributes to be consistent
with the overall aim of the Act.

On a national perspective, the Plan has been developed taking into account the objectives of the
Government’s Policy Statement on Land Transport, the National Land Transport Programme and the
National Energy Efficiency and Conservation Strategy.

For the first time, a “Top of the South” perspective looking at the needs for transport in partnership with our
neighbouring councils, Tasman District and Nelson City has been considered and adds value to the
respective Regional Land Transport Plans.

The Plan has been reviewed and developed over a time of significant change. The Government’s priority for
its investment in land transport is focused on increasing economic productivity and growth, road safety and
value for money. The aim of the Marlborough Regional Transport Committee is to balance economic, social,
environmental and sustainability considerations in the Plan. The Plan provides a balanced vision for land
transport in Marlborough and the Top of the South for the future.

The Transport Agency’s “one network road classification” system will assist with future investments in
roading infrastructure. Especially on our local roads limited new capital investment is proposed on local
roads however improvements are signalled for the higher volume state highway network and SH1 in
particular. This Plan cements a sound basis for future investment decisions in our network.

Finally, our thanks go to all those who have had input into the development of the Plan. The effort and
enthusiasm shown by all three Top of the South councils has resulted in an inclusive Regional Land
Transport Plan to improve our community.

Cllr Terry Sloan
Chairman
Marlborough Regional Transport Committee

                                                        3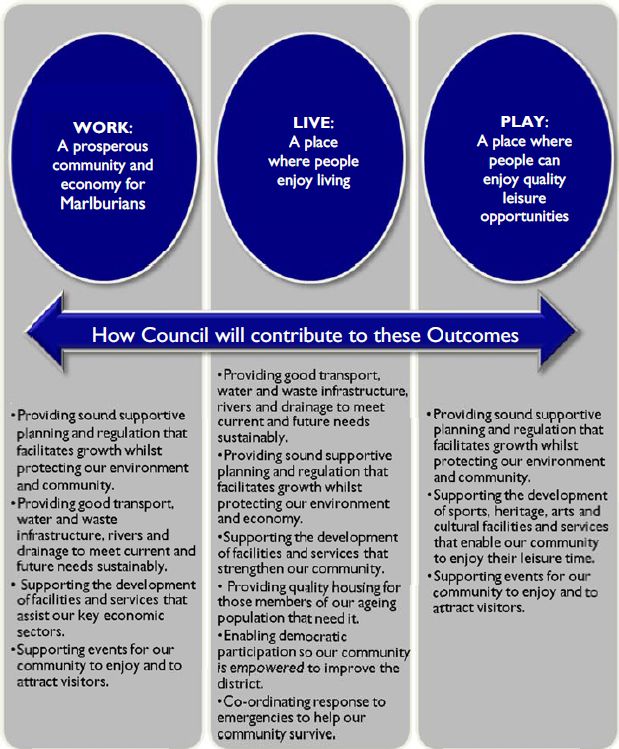
Executive Summary
The Top of the South councils, in partnership with the New Zealand Transport Agency, have collaborated to
develop a joint Regional Land Transport Plan that aims to provide our community with an efficient, safe and
resilient road network.

All three councils recognise that we are highly interdependent on each other for our economic and social
welfare. The Top of the South economy is highly dependent on its road network as there is little alternative
especially for Nelson and Tasman, so the need for resilience and reliability along key journey routes is of
vital importance. The significant projects that are identified consider these key issues and have been agreed
by the three councils as important to the economic growth of our community.

In developing this plan, we’ve drawn on the Top of the South aspirations and aligned them with the national
outcomes that are outlined in the Government’s Policy Statement on land transport. The final document will
be included in the Transport Agency’s National Land Transport Programme 2015–18.

The Regional Land Transport Plan considers the economic drivers for the Top of the South with horticulture,
viticulture, forestry, seafood, farming and tourism being the main areas driving our economic growth. All
three areas are growing, the Tasman District especially. Nelson City continues to be the largest urban area
within the region for employment. The State Highway 1 route through Marlborough District is the highest use
freight route in the South Island.

Section F outlines the specific issues that each of the three councils face in their region and how they intend
to deal with these issues. Each council has developed their own programme of forward works for the next
ten years. This plan also includes the New Zealand Transport Agency’s State Highway programme to
provide the complete picture of the works planned over the next six years in the Marlborough District.

There is a continued focus on the journey, enabling people and freight to travel safely and efficiently. Safety
remains at the forefront, with our commitment to Safer Journeys, New Zealand’s road safety strategy 2010–
2020, making our state highways and local networks increasingly free of death and serious injury.

Marlborough District Council has made smart investments in its roads over the last few years. This good
investment is optimising our spend on roads and still providing acceptable levels of service.

                                                       4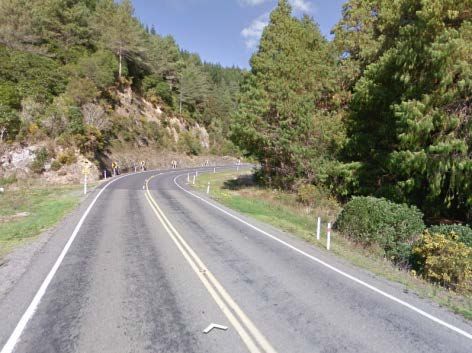
The Plan provides a value for money approach to manage the Marlborough Network.
Consultation on the Draft Marlborough Regional Transport Plan commences on 18 December 2014. The
consultation period will close at 4.30 pm on12 February 2015.
The Plan is available for viewing on the Council’s website at http://www.marlborough.govt.nz and during
normal office hours at the Marlborough District Council offices:

•   15 Seymour Street, Blenheim
•   67 High Street, Picton
•   33 Arthur Street, Blenheim (Library)

Please post to:

Submissions on Marlborough Regional Land Transport Plan 2015-2021

Marlborough District Council
P. O. Box 443
Blenheim 7201

Or deliver to the Marlborough District Council office; or email to mdc@marlborough.govt.nz. Submission
forms are available on the Council’s website.

                                                     5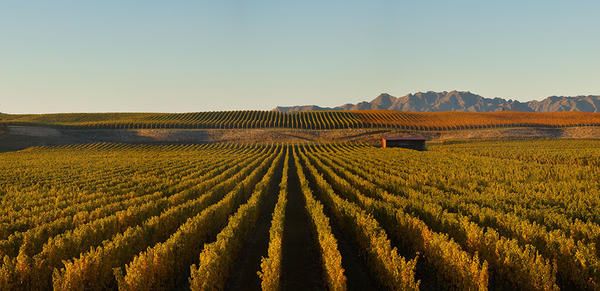
Contents

Record of amendment ................................................................................................................................................. 1

Foreword ..................................................................................................................................................................... 2

Executive Summary ..................................................................................................................................................... 4

Glossary of Terms ....................................................................................................................................................... 8

Part A – Introduction and Purpose ................................................................................................................................ 9

Part B – Government Policy Statement and the RLTP................................................................................................ 10

          Relationships between Land Transport Documents ................................................................................... 10

          The Draft Government Policy Statement on Land Transport 2015/16-2024/25 ...................................... 10

          The National Land Transport Fund and Programme .................................................................................. 11

          Regional Land Transport Plans .................................................................................................................... 11

Part C – Top of the South Setting ............................................................................................................................... 12

          Introduction .................................................................................................................................................. 12

          Transport Network ....................................................................................................................................... 19

Part D – Agreed Top of the South Objectives.............................................................................................................. 26

          Top of the South significant activities to be funded from sources other than the National Land
                    Transport Fund .................................................................................................................................. 26

          Table 2 – Significant activities not funded by the NLTF. ............................................................................ 26

          Objectives, Policies and Measures ............................................................................................................... 26

          Table 3. Draft GPS objectives and the agreed Top of the South objectives, policies and measures of
                    success ............................................................................................................................................... 26

Part E – Top of the South Significant Activities............................................................................................................ 28

          Table 4. Agreed Top of the South significant activities ............................................................................. 28

Part F – Marlborough District Council’s Regional Land Transport Plan ........................................................................ 32

          (1) Introduction............................................................................................................................................. 32

          (2) Table 5 – Community Outcomes and Transportation ........................................................................... 33

Key Issues for Marlborough District ............................................................................................................................ 34

          (3) Objectives, Policies and Measures ………………………………………………………………………………35

          Table 6. GPS and Tasman District Council’s Objectives ............................................................................. 36

          Table 7. Marlborough’s Policies and Measures .......................................................................................... 37

          (4) Detailed Programme………………………………………………………………………………………………..44

          Table 8. Activities proposed within Tasman District – NZTA ..................................................................... 45

          Table 9. Maintenance, Operations and Renewal Activities proposed within Tasman District .................. 47

Part G – Public Transport Plan ................................................................................................................................... 54

Appendices ............................................................................................................................................................... 69

          Appendix 1 - Legislative Context ................................................................................................................ 70

          Appendix 2 - Significance Policy .................................................................................................................. 73

          Appendix 3 – Monitoring and Performance Measures................................................................................ 74

                                                                                       6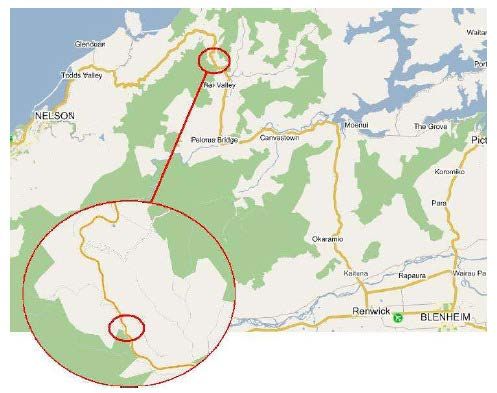
Appendix 4 – Assessment and prioritisation .............................................................................................. 79

Appendix 5 – Significant Projects Description ............................................................................................ 80

Appendix 6 – Alternative Objectives ........................................................................................................... 90

Appendix 7 - Relationship with Police Activities ......................................................................................... 92

Appendix 8 - Consultation ........................................................................................................................... 93
Appendix 9 - Marlborough District Council 10 Year Forecast by Activity Class 2015-18 ………….. ...94

                                                                      7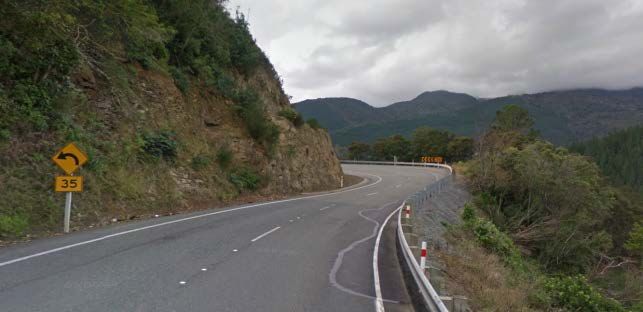
Glossary of Terms
In this document, unless otherwise stated, the following words are defined as stated:
The Act means the Land Transport Management Act 2003
Activity (a) means a land transport output or capital project; and

         (b) includes any combination of activities
Approved organisation means a council or a public organisation approved under section 23 of the Land
     Transport Management Act 2003
District means the district of a territorial authority, i.e. Marlborough, Nelson or Tasman
Economic development – quantified by wellbeing measurements i.e. personal and household income,
education levels and housing affordability.
Economic growth – measured by Gross Domestic Product (GDP)
Fund means the National Land Transport Fund
GPS means the Draft Government Policy Statement on land transport 2015/16 – 2024/25
HPMV means high productivity motor vehicle(s)
Inter-regional means across the three districts of Marlborough, Nelson and Tasman (Top of the South)
Lifeline route – a means or route by which necessary supplies are transported or over which supplies must
       be sent to sustain an area or group of persons otherwise isolated.
NLTP – National Land Transport Programme
NLTF – National Land Transport Fund
NZTA - New Zealand Transport Agency
ONRC – One Network Road Classification - this is NZTA’s unified national method of classifying roads
RLTP – Regional Land Transport Plan
RPTP – Regional Public Transport Plan
Road controlling authority—in relation to a road, means the Minister, department of State, Crown entity,
     State enterprise, or territorial authority that controls the road.
RTC – Regional Transport Committee
Safe System Approach - The Safe System approach recognises that people make mistakes and are
      vulnerable in a crash. It reduces the price paid for a mistake so crashes don't result in death or serious
      injuries.
SH means State Highway.
Sustainability - When a sustainable land transport system is referred to it is considering the following three
objectives:
    • Economy – support economic vitality while developing infrastructure in a cost-efficient manner. Costs
        of infrastructure must be within a community’s ability and willingness to pay. User costs, including
        private costs, need to be within the ability of people and households to pay for success.
    • Social – meet social needs by making transportation accessible, safe and secure; including provision
        of mobility choices for all people (including people with economic disadvantages); and develop
        infrastructure that is an asset to communities.
    • Environment – create solutions that are compatible with the natural environment, reduce emissions
        and pollution from the transportation system, and reduce the material resources required to support
        transportation.

                                                       8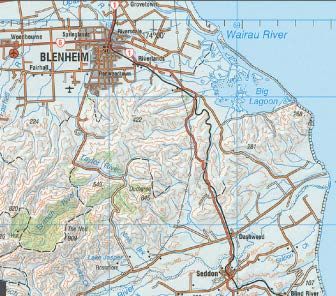
Part A – Introduction and Purpose
This document sets out the forward works programme, maintenance and operations and other land transport
activities that form part of the funding submission to the Transport Agency and the National Land Transport
Fund. It is also our Statement of Proposal as required under the Local Government Act 2002 Special
Consultative Procedure.

The ‘Top of the South’ councils, being Marlborough District Council, Nelson City Council and Tasman District
Council, are all unitary authorities. They undertake the functions of both a regional council as well as a
territorial authority. Each Council is required under the Land Transport Management Act 2003 (the Act) to
prepare a Regional Land Transport Plan (RLTP). This is required every six years with a review every three
years. The purpose of this document is to provide an integrated approach to land transport planning across
the local Government boundaries in the Top of the South region.

Each RLTP must include a ten year forward works programme that sets the direction for the transport system
as part of the RLTP. It identifies what is needed to contribute to the aim of an effective, efficient, safe and
sustainable land transport system for the public interest. This RLTP will help the Top of the South meet the
objectives of the Act and determine and secure investment for the entire transport system. The RLTP’s
purpose (once investment in the transport network has been secured) is to benefit the Top of the South
communities by providing a resilient and reliable network that will meet our current and future needs.

Sections A to E of this RLTP have been prepared by the Regional Transport Committees (committees) of the
three councils together with the New Zealand Transport Agency (the Transport Agency). Part F of this
document has been developed independently by each of the three independent committees to reflect their
individual transport needs. Importantly, this RLTP has been prepared in a manner consistent with the Act
(the legislative context of the RLTP can be viewed in Appendix 1). The Act requires every RLTP to include
activities relating to State Highways proposed by the Transport Agency.

                                        Puka Puka Weld Pass SH1, Marlborough

                                                       9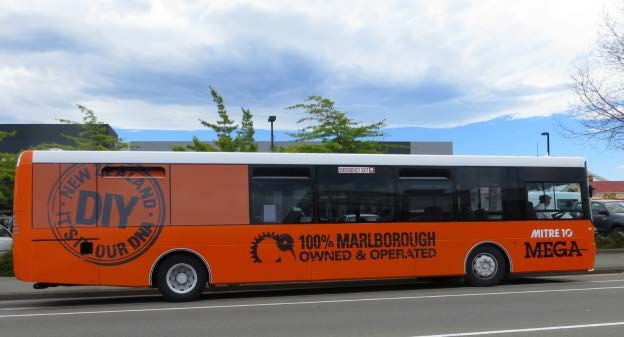
Part B – Government Policy Statement & the RLTP
Relationships between Land Transport Documents

The Government Policy Statement (GPS) sets out national land transport objectives and the results the
Government wishes to achieve from allocation of the National Land Transport Fund (the Fund). Whilst the
RLTP must be consistent with the GPS, the National Land Transport Programme (NLTP) must give effect to
the GPS and must take account of the RLTP. The relationship between the RLTP, the GPS and the NLTP is
shown in Figure 1.
The Transport Agency’s ‘Statement of Intent’ gives effect to the Government’s direction for transport. The
Transport Agency therefore invests and operates with a ‘whole of system’ approach, with their immediate
priority being the development and finalising of the 2015 to 2018 NLTP.

Figure 1 – Statutory Relationship between the RLTP, the NLTP and the GPS.

The Draft Government Policy Statement on Land Transport 2015/16-
2024/25
The GPS is the Government’s main document which sets priorities and funding levels for land transport
investment.
The Government released an ‘Engagement Draft’ of its GPS (the Draft GPS 2015) on 15 June 2014 which
includes:
    •    national objectives for land transport;
    •    the results the Government wishes to achieve from allocation of the Fund;
    •    the Government’s land transport investment strategy in a framework that will guide investment over
         the next 10 years; and
    •    the Government’s policy on borrowing for the purpose of managing the NLTP.
The GPS cannot determine which projects will be funded, or how much funding any particular project will
receive. Rather, the GPS sets ranges of funding which the Government will make available for different

                                                           10
types of activities that best meet its objectives. The Transport Agency then determines which projects
receive funding, and to what level, within those overall funding ranges.
The Draft GPS 2015 proposes to continue the three key priorities from the 2012 GPS. These, along with the
proposed long term results from these priorities, are shown in Table 1. The government is expected to
finalise the GPS by December 2014.
The National Land Transport Programme
The NLTP for 2015 to 2018 contains all of the land transport activities, such as public transport services,
road construction, maintenance and policing, that the Transport Agency anticipates funding over the next
three years. The NLTP is a planning and investment partnership between the Transport Agency and local
authorities which will deliver transport solutions that will help communities across New Zealand thrive. The
NLTP will be published on 1 July 2015.
Regional Land Transport Plan
Section 13 of the Act requires every regional council, through its Regional Transport Committee, to prepare a
RLTP every six financial years. The RLTP provides the strategic context and direction for each region’s
transport network. The Final RLTP is submitted to the Transport Agency approved by 30 April 2015 once it
is approved by the council. The Top of the South Councils have agreed to work together and provide a
coordinated RLTP. Once published on 1 July 2015, the Final RLTP 2015 to 2021 will be available for the
public to view on each council’s website and in each council’s respective service centres.
11Part C – Top of the South Setting
Introduction
The Top of the South includes Marlborough, Nelson and Tasman along with its road partner, the Transport
Agency, and will collectively deliver a land transport system that enables economic growth, accessibility and
resilience to all road users. The areas the Top of the South include as shown in Map 1.
Map 1. Top of the South
As shown, the area covered by the Top of the South goes from the east coast to the west coast and mainly
consists of rural land and national parks. Nelson City in comparison to Tasman and Marlborough is
predominantly urban. Nelson and Tasman are economically interlinked and dependent on each other. This
heavy reliance on each other is reflected in the way the two Councils work together with respect to the
roading network.
Marlborough
Marlborough is situated in the north-east corner of the South Island, accessible by ferry, train, air, or road.
As of the March 2013 Census, the normally resident population was 43,416. The main population of
Marlborough is centred in the town of Blenheim (24,183), followed by Picton (4,056), which is 25km north of
Blenheim. As the ferry transit point from Wellington and entrance to the Marlborough Sounds, Picton is
geared for tourism.
Port Marlborough, in the Marlborough Sounds, is the main portal for freight and tourists travelling between
the North and South Islands. The national rail network generally runs parallel with SH1 through Marlborough
with important connections to the road network at Picton and Spring Creek.
A fifth of Marlborough District’s workforce is employed in the primary sector. However, over the last decade
the Marlborough District has successfully converted most of the land formerly dedicated to cropping and
stone fruit orchards into viticulture so that it is now New Zealand’s largest grape growing region producing
77% of New Zealand’s total wine production.
12Nelson
Nelson City is the smallest ‘region’ in New Zealand (by population and land area). It is bounded by
Champion Road to the south, the Bryant hill range to the east and Cape Soucis and Tasman Bay to the
north. Nelson’s usually resident population at the 2013 Census was 46,437.
Although it is small, Nelson CBD is the main commercial centre within the Top of the South with just under
8000 employees, and is critical to the wellbeing of the regions and their respective economies.
Nelson has developed economic activity in diverse sectors as well as some specialisations. It provides
services for the communities of Tasman and Marlborough and has particular strengths in marine
construction, aviation manufacturing and is home to almost one-third of New Zealand’s fishing and
aquaculture. Like Tasman and Marlborough, Nelson has opportunities to add value to primary products and
for smaller-scale enterprises to work together to grow and to export.
The information communications technology cluster in Nelson has continued to grow and drive change
across all industries. In 2013 Google named Nelson as one of the top five most internet –savvy cities saying
the town is full of businesses making the best use of the internet, social media and online marketing.
Nelson is well known for its thriving local arts and crafts scene. Each year the city hosts many events
popular with locals and tourists alike.
Tourism in Top of the South is driven by its natural beauty and great climate and supported by a premier
food and beverage establishments and shopping opportunities which see the city and the tourist areas
swelling to capacity during the summer months.
Tasman
The Tasman District is located in the north west of the South Island. It covers the area from the boundary of
Nelson City in the east, to Murchison and the West Coast in the south, Golden Bay in the north-west, and
Marlborough to the east.
At the time of the March 2013 census Tasman District had a total normally resident population of 47,157.
The main population of the Tasman District is centred in Richmond which is the largest and fastest growing
town in the District with an estimated 14,036 residents. Motueka is the next largest town, with an estimated
6,590 residents in 2011.
The Tasman District is known for the natural beauty of its landscape. Fifty-eight percent of the Tasman
District is national park – Nelson Lakes, Kahurangi and Abel Tasman National Parks. There are a range of
other forests and reserves in the area, including the Mount Richmond State Forest Park and Rabbit Island.
Tasman District covers 14,812 square kilometres of mountains, parks, waterways, territorial sea and includes
812km of coastline.
The national parks, forests and reserves offer:
• Beautiful sandy beaches and coastal areas,
• Mountain ranges,
• Scenic alpine lakes,
• Rugged rivers, and
• Environmental protection and enhancement.
The District is famous for its wonderful lifestyle and the outdoor adventure and tourism activities, particularly
in the national parks and rivers, in Motueka, Golden Bay and around the Murchison area.
The District enjoys a pleasant sunny climate year round, which makes it ideal to enjoy the wonderful lifestyle
and natural areas available to residents and visitors. Its unique micro climate ensures in excess of 2,450
o o
hours of sunshine annually. Average maximum temperatures in summer are between 21 C and 22 C. Night
o o
minimums are between 12 C and 13 C.
Arts and culture are prominent in the area. The District is home to a number of artists and crafts people, and
has an arts and crafts trail.
13Trail riding in Tasman
Economic Drivers
Our community regards the Top of the South as one region. Our local government boundaries are not
necessarily our economic boundaries. Many economic activities cut across the regional boundaries. The
Nelson, Tasman and Marlborough regional economies are interlinked and dependent on each other through
horticulture, forestry, seafood, farming, tourism, and aviation.
The Top of the South contributes around three percent of New Zealand’s gross domestic product (GDP).
The Top of the South has the highest reliance on primary industry in New Zealand. The Tasman and
Marlborough districts are highly export focused and rely on factories and manufacturing in both Nelson and
Tasman for export. The exports are predominantly distributed via Port Nelson, Port Marlborough, Nelson
Airport and Marlborough Airport.
Regional economies are affected by common national trends, and while there are differences, there are also
dense economic connections between regions. Because regions can have complementary and competing
specialisations, what happens in one region can affect another.
Analysis by the New Zealand Institute of Economic Research (2014) shows there are three broad types of
regional economies:
• two distinctively urban economies: Auckland and Wellington that have complex economies and very
high human capital;
• three distinctively resource-based economies: Taranaki, Upper South Island and Southland, with
concentrated exposures to natural commodities and international commodity prices; and
• remaining regions that are driven by common national factors.
The Top of the South’s economy is driven by five export based clusters:
• horticulture
• forestry
• seafood
• pastoral farming, and
• tourism
Three other significant export sectors contributing to the regional economy are engineering, information
communications technology and aviation.
Annual growth in Nelson-Tasman regional GDP per capita in 2013 was 4.2% compared with the national
average of 2%. In Marlborough, annual growth was 0.8% in 2012, but it had been significantly higher (3.2%)
in the ten years previously.
Nelson City and Tasman District have one of the highest export road freight levels in New Zealand per
capita. Approximately 30% of Nelson-Tasman’s GDP is generated from bulk commodity production. Road
transport is the only means of getting export products to the port or airport as there is no regional rail
network.
14Horticulture and viticulture
Over the past 20 years, horticulture exports have grown from $200 million to $2.23 billion. It is now New
Zealand’s sixth largest export industry. Historically, horticulture and viticulture has been one of the Top of
the South’s key sectors. In 2012, horticulture alone contributed to more than 12% of the regional GDP in
Nelson-Tasman. It provided over 10% of the region’s employment. In Marlborough, this figure was 2.6%.
New Zealand’s largest grape producing region is Tasman-Marlborough. In 2013, there were 145 wineries in
Marlborough and 55 in Tasman out of a total 692 in New Zealand (29%). The movement of horticultural
products and grapes contributes to 15% of Tasman’s economy and 14% of Marlborough’s. Produce is
predominantly transported around the Top of the South by road.
Awatere Valley, Blenheim
The main horticulture clusters include pipfruit, kiwifruit, berryfruit, wine growing and craft beer (hops).
Regional issues that the horticulture and viticulture industries face include an efficient route to Port Nelson.
In 2013, over 288,000 tonnes of fruit were exported from Port Nelson. Transporting that amount of fruit to
both packhouses, coolstores and to the Port requires an efficient and reliable road network. Seasonality of
the industry is a major factor with respect to the road network. Peak horticultural freight movements around
the Top of the South occur in the autumn. It is especially important at this time of the year that the network is
at its most efficient and resilient.
Forestry
As at 1 April 2013 there were a total of 170,171 hectares in Nelson, Tasman and Marlborough (9% of New
Zealand’s forest plantations).
The Top of the South region is home to a mature but innovative forestry cluster that contributed 11% ($430
million) to the region’s GDP in 2012. In the past ten years, forestry has steadily increased its GDP
contribution, as a result of increased technology, consolidation and other productivity improvements.
The wood harvested in the Top of the South flows through to local saw mills, a laminated veneer lumber
plant, a medium density fibreboard plant and the remainder for log exports. The region is home to one of the
world’s most innovative wood processing plants, Nelson Pine Industries, based in Richmond, Tasman.
With the introduction of 50 MAX and the High Productivity Motor Vehicle (HPMV) scheme, trucks are allowed
to carry heavier weights on selected routes. This has resulted in fewer trips to the ports to carry logs and
processed wood products. The Top of the South Councils are working with the forestry industry to increase
the number of approved routes for log trucks.
Export logs and wood products are transported by road to the closest port. Annually, up to three million
tonnes are exported from Port Nelson and one million tonnes from Port Marlborough. The forestry industry is
heavily reliant on the road network and the need for a network across the Top of the South that is resilient,
reliable and efficient.
15Logging truck
Seafood
Seafood is a significant contributor to the New Zealand economy. China, Australia and the USA remain the
top three countries to which New Zealand seafood is exported. The Top of the South’s contribution to the
seafood industry is significant. In 2012, it contributed $293 million or 7.6% of the region’s GDP. The
seafood cluster includes commercial offshore fishing, aquaculture, processing and supporting sectors such
as marine engineering, boat building and seafood scientific research.
Port Nelson is Australasia’s largest deep fishing port and the region is New Zealand’s leading location for
seafood activity, with 24.9% of the national seafood employment and 29.9% of the national seafood GDP.
Sealord and Talley’s Group Ltd are both based in the region. Sealord are based at Port Nelson, while
Talley’s are based at Port Motueka, Tasman, however, its 4,500 tonne cold-store facility is based at Port
Nelson.
Talley’s, Port Motueka
In 2012, the Nelson-Tasman region had 93 fishing associated businesses and 10 seafood processing
business units. Mussel farming is an increasing business opportunity for the region that will provide
employment, capital investment and increased regional GDP.
Salmon farming is becoming increasingly significant for Marlborough as farms are predominantly located in
the Marlborough Sounds. New Zealand King Salmon produces 70% of New Zealand’s salmon, of which
50% is exported. New Zealand and Canada are the only locations where king salmon are farmed in the
16world and as a result New Zealand King Salmon produces 55% of the world’s farmed king salmon. There
are four purpose-built processing facilities in Nelson.
Additionally, Nelson is home to the Cawthron Institute and the Cawthron Aquaculture Park, a world-class
research institute and New Zealand’s largest mussel and oyster hatchery.
As with other primary produce, a resilient, reliable and efficient road network is important to the future of
seafood and its economic significance to the Top of the South in terms of GDP and employment.
Pastoral Farming
The pastoral farming cluster includes sheep, beef, dairy, pig, deer and others such as beekeeping. It also
includes processing, manufacturing and services, such as wool harvesting, road transport, farm equipment
sales and servicing. All these services rely on the road network. In 2012, the farming cluster business
contributed $146 million (4%) to Nelson-Tasman’s GDP. In Marlborough, the farming cluster business
contributed approximately $268 million (19%) of their GDP.
Forty four percent of farming GDP for the Top of the South comes from dairy production. The flow on effect
to processing and manufacturing of dairy products on the region’s road network is significant. The milk
produced on farms in Tasman goes to Fonterra’s milk powder plants in Takaka and Brightwater for
processing and is then exported via Port Nelson.
Dairy farming
Alliance (meat producer and exporter co-operative) has a meat plant in Nelson who takes sheep from the
Top of the South down to Amberley in Canterbury, and from the North Island when required. The main
export markets are the UK and China. The road network is crucial to this operation. Having a road network,
(especially SH6 with its links to the key pastoral farming areas in Tasman and Marlborough, and the two
ports) that is efficient and reliable is important to the Top of the South’s regional economy.
Tourism
Tourism in the region has developed from the spectacular natural environment that we need to protect.
Tourism activities in the Top of the South are diverse. Seasonality is an issue, with a summer peak of
tourists that are typically ‘self-drive’. There are increasing numbers of visitors in recent times during the
winter.
Tourism is a major growth industry in the Top of the South for all three councils. Tasman provides access to
three national parks and Marlborough is home of the Sounds with Picton acting as a gateway to the South
Island for travellers arriving (or departing) by ferry. St Arnaud and the Rainbow skifield are on the boundary
between Tasman and Marlborough.
17The region is fast becoming known for its cycleways and mountain biking. The further development of
Tasman’s Great Taste Trail and the Queen Charlotte Cycling Track in Marlborough will enhance the Top of
the South’s reputation as a premier cycling destination. Nelson and, to a lesser extent, Marlborough Airport
provide a vital gateway to the Top of the South as does Picton ferry and the State Highway links to
Canterbury and the West Coast.
Queen Charlotte Cycle Track
The key journey routes that are mentioned in the Transport Network section are very important as they are a
direct route to the areas that are significant to tourism. The adverse weather event in December 2011,
showed how reliant the region is on these key journey routes for tourism. For example, the road to Totoranui
suffered many slips in December 2011 which closed road access into the Abel Tasman National Park from
Golden Bay. The road as a special purpose road is of great economic significance to the Nelson-Tasman
region and its reliability and resilience is important to tourism and the economic growth of the region.
Kaiteriteri
Aviation
The Top of the South is home to Air Nelson, HNZ Global and the Defence facility at Marlborough Airport.
Aviation makes a considerable contribution to the Top of the South’s economy, with a combined contribution
to the Top of the South’s GDP of $98 million in 2012.
18Nelson Airport is the fourth busiest airport in New Zealand and the busiest regional airport in the country, in
terms of scheduled flights.
The aviation industry supports the five key export drivers including tourism, recreational and business travel.
Both airports are served by SH6 and the adjoining local road network which are identified as key journey
routes.
Marlborough also is home of the Aviation Heritage Centre, attracting national and international visitors.
Transport Network
Key Journey Routes
There are approximately 900 trucks per day travelling on SH1 through Spring Creek in Marlborough.
Spring Creek is the rail head for Nelson/Tasman and operates as a freight hub. Access to Port Nelson and
the Nelson airport are from SH6. Approximately 650 trucks access Port Nelson each day, which can
increase by 50% during the peak log harvest. Of these 650 trucks, over half are log related including logs
from Marlborough Forests These trucks travel along what are known as key journey routes.
Port Nelson
Throughout the Top of the South region there are a number of key journey routes. These are at various
levels of the One Network Road Classification (ONRC) such as a regional route, an arterial route or an
access route. However, they all remain important for the economic growth and benefit of the region and for
that purpose they are described as a key journey routes.
The key journey routes may be related to freight, commuter traffic, and tourism or as a lifeline route. Many of
our key journey routes have multiple functions, such as Waimea Road in Nelson. Waimea Road is a key
commuter route into the city centre, a lifeline route as it serves as an access point to the hospital and is a
back up route to SH6 Rocks Road in the event of an emergency.
The main key journey routes in the Top of the South are:
• SH1 Picton to Christchurch
• SH6/SH62 Blenheim to Nelson
• SH6 Nelson to Richmond
• SH6 Richmond to Canterbury/West Coast
• SH6/SH60 Richmond to Golden Bay.
19The main key journey routes provide access to the respective Top of the South centres and also to Port
Nelson, Port Marlborough and Nelson and Blenheim airports. With the greatest reliance on the primary
industries of any region in the country, the ports are extremely important to the economic development of the
region as they provide the ability for primary production to be exported. As detailed in the previous
paragraphs, the freight tonnage exported from the two ports is considerable.
Resilience
Resilience is the ability of the network to withstand or recover quickly after a disruption such as a storm,
crash or emergency.
On these occasions there may be a need for an available alternative route. This issue can be measured by
the number of journeys impacted by an unplanned event or the number of journeys not made by an
unplanned event as there is no viable alternative.
It is the desire of the Top of the South councils to have a resilient network. For Marlborough and Tasman in
particular, the majority of the network is rural. The need for a robust current route or a viable alternative is
imperative. For Nelson, increasing the resilience of the network also includes maximising the existing
network by encouraging the community to shift to more sustainable ways of moving through the city, be that
by bus, walking or cycling.
SH6 is an important route through Nelson for both Marlborough and Tasman. It provides the link to and
from Marlborough and is Nelson and Tasman’s link to the south to the West Coast and Christchurch. If
something happened to this network due to an unplanned event, the majority of the region is isolated in
terms of land transport.
Marlborough does have a rail network but it is in the same corridor as SH1. In reality, in the event of an
emergency, the rail network is more likely to fail before the road network.
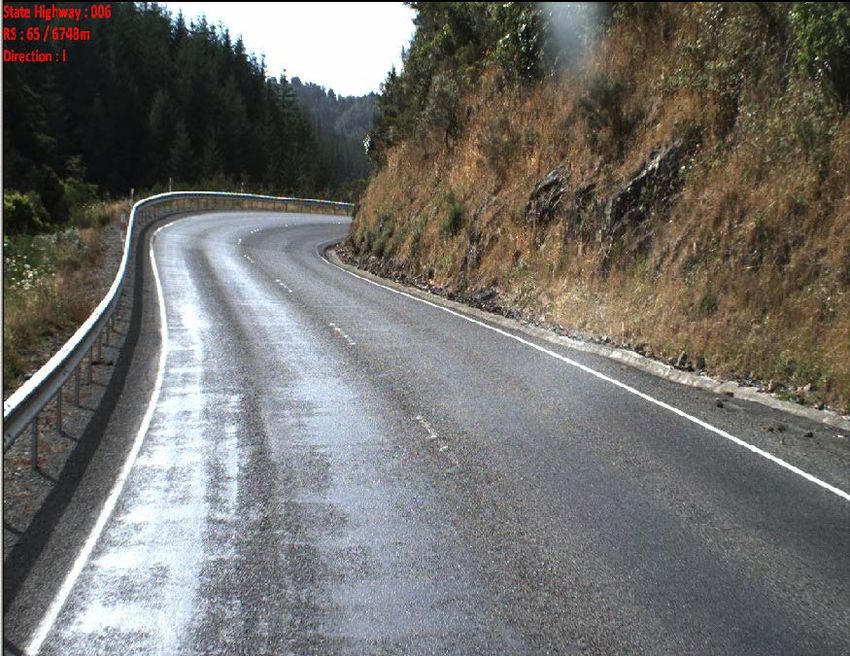
Attention is already being paid to SH1 Opawa River Bridge and SH1 Wairau River Bridge through the
Government’s Future Investment Fund. However, Weld Pass, which has a significant amount of freight
crossing over it on a daily basis travelling between Picton and Christchurch, has significant issues which
need addressing in terms of resilience.
The Top of the South has experienced significant adverse events over the last three years. Tasman, Nelson
and Marlborough have suffered from at least two storm events which have disrupted the network and
affected the movement of primary produce around the region. In Golden Bay, SH60’s Bird Hill collapsed in
the storm event of December 2011. Beyond that point, a considerable area is taken up with dairy farming.
SH60 is the only route in and out of this area and the impact of the road collapse on the region was
considerable. If SH60 on Takaka Hill was to experience an unplanned event, Golden Bay would effectively
be cut off, as this is the only land transport route in and out of the area. Similarly, Easter 2014 SH60 was
flooded and there was no access to Golden Bay past Upper Takaka.
Rocks Road (SH6), in Nelson, also suffered from numerous slips during the December 2011 storm event.
The road remained closed for almost a week. The road then remained single lane in places for an even
longer period of time. Rocks Road is the primary route to Port Nelson from the south. There was a high
level of disruption and reduced efficiency on the alternative routes. In December 2012, both SH6 and the
alternative route, Main Road Stoke, were both closed due to a chemical leak at the Alliance freezing works.
This closure cut of all road connections between Nelson and Tasman.
The Seddon Earthquake has been a reminder that the Top of the South is vulnerable to a major seismic
event. Seismic capability will continue to be reviewed along key journey routes.
Forestry, horticulture, seafood and pastoral farming are the four most significant primary industries in the Top
of the South. The products from these industries (mentioned in the section on economic drivers) are
20transported out of the region through Nelson airport, Port Nelson or Port Marlborough. With this high
reliance on primary production and a lower reliance on business and social services compared to the New
Zealand average, the Top of the South’s road network needs to be resilient during unplanned events
whether it is Takaka Hill, Motueka Bridge, Rocks Road, the Whangamoa, Hope Saddle or Weld Pass.
Weld Pass SH1 South
Reliability
Reliability relates to the consistency of travel times that road users can expect on a journey.
The Top of the South Councils wish to minimise disruptions to customers through controlling planned
activities that have more than a minor effect on required flow capacity to off peak and low flow periods on
key journey routes. Customers can expect to be well informed through our usual communication systems of
expected delays so that they are able to make informed decisions regarding their journey and the time they
allow for that journey.
The Top of the South region’s key journey routes are important for the movement of freight as well as
commuters in the urban areas, so a consistent journey in terms of time and amenity is important. This is
especially so when considering the economic growth of the region and the forecast growth in freight of 2%
per annum every year for the next 30 years.
A large number of overseas and domestic ‘self-driver’ tourists travel to and through the Top of the South, so
the need for a consistent and readable journey that is comparable with other tourist routes around New
Zealand is important.
Many of the projects listed in Table 4 in the RLTP acknowledge the increasing likelihood of our key journey
routes becoming less reliable. This would be detrimental to the economic stability and growth of the Top of
the South. In particular, the activities requiring key journey routes to and from Port Nelson and Port
Marlborough identify that they need to be reliable if the region is to continue growing economically, noting in
particular our reliance on primary industries and on the road network.
Value for Money and Future Accessibility
One of the Government’s objectives for the land transport system is to have a network that addresses
current and future demands. This is especially important to the Top of the South councils.
Our aim is to have a transportation network that is managed so that changes to normal travel time patterns
are communicated effectively. The Top of the South councils also aim to have a transportation network that
21is maintained cost effectively and at an optimum level. Maintenance is planned to provide proactive
intervention procedures for regular events such as snowfall, ice and heavy rain. The vulnerable areas will
have already been identified by the Top of the South councils. It is expected that our road corridors provide
an environment that is clean, comfortable, convenient and secure for all road users. It is also expected that
we will manage the impact of activities and demand on our network across the Top of the South.
There are a number of areas within the Top of the South’s network where efficiency is reduced by unplanned
events and/or congestion at peak travel times during the day or the year e.g. harvesting time in the pipfruit
industry or summer tourism peaks. This affects the movement of freight and people around the region and
getting primary produce to our ports and airports.
Over the last decade, Nelson has proactively worked towards implementing travel demand policies centring
on walking, cycling and the provision of public transport. These factors are very much in the forefront of their
transportation asset management plan. Marlborough and Tasman both support these policies as well
supporting the wish to have an efficient route through Nelson and to its Port. Forestry production in
particular is increasing and sawmills are expecting to double production in the next four to five years. These
products will be transported out of the region through the two ports.
The rapid growth of viticulture in the Marlborough District has seen in excess of 75% of New Zealand’s
grape production located here. Effects on the land transport system from this growth includes an increase in
road freight, an increase in the amount of slow and oversized farm vehicles on the road and a change in
settlement patterns with vineyard workers seeking accommodation close to the vineyards. Additionally,
Tasman District Council is due to commence consultation on the proposed Waimea Community Dam, which
has the potential to see intensified land use and primary production on the Waimea Plains, as well as
enabling further population growth in the Richmond area.
The 50 MAX vehicles have recently been introduced to allow more freight to be carried on fewer trucks on
the local road network. 50 MAX High Productivity Motor Vehicles (HPMV) are trucks that are slightly longer
and heavier than the standard 44 tonne vehicles. The modified design means that these trucks can carry
more, but they perform on the road in the same way as a standard 44 tonne truck. The introduction of 50
MAX will allow more flexibility for freight operators and greater efficiencies for their fleets, which in turn will
ultimately benefit the end user as there should be a reduced cost in the final product. The 50 MAX vehicles
have an improved safety record and should not increase wear and tear on the road network and should
benefit operational costs for each council. The aim for the Top of the South is to continue increasing the
number of routes that are compatible.
Queen Street/Gladstone Road Intersection, Tasman District
22The bulk of population growth is likely to be concentrated in and around Nelson and Richmond. Richmond is
experiencing employment growth due to a significant number of new retail and commercial activities. Nelson
Airport, Stoke and Port Nelson will also remain high growth employment areas. Further diversity in the
economy is expected and growth in the tourism sector in particular is expected to be strong. As mentioned,
Nelson City and Richmond’s roading networks are closely interlinked given their proximity to one another.
Over time this growth will balance the tidal traffic flow that currently occurs at peak times between Nelson
and Richmond.
Demographically, the Top of the South, like many other regions of New Zealand is experiencing an ageing
population. The National Institute of Demographic and Economic Analysis reported that the population of the
combined Marlborough-Nelson-Tasman region is projected to grow (under the medium variant assumptions),
from approximately 139,990 in 2011 to 153,120 by 2061 (9.4 per cent). However, the growth will be most
uneven by age, with declines projected at 0 to 19 and 35 to 54 years, against significant growth at 65 years
and above. The population over 65 is anticipated to grow both numerically (almost doubling between 2011
and 2061) and as a percentage of the population (from 16.7 per cent in 2011 to 28.4 per cent).
The impacts of this will be considerable on transport planning for the Top of the South and how travel
demand policies will have to adapt. For example, Nelson City Council and Tasman District Council is
investigating the extension of the current NBus routes to give greater coverage in Stoke and from Nelson
into Richmond to cater for the extra demand for public transport for those who are transport disadvantaged
including the elderly. With the high increase in employment in the Richmond area, there will be a greater
need for alternative transport options for those commuting to work. In Marlborough, the Blenheim Bus
almost solely caters for over 65’s.
The Top of the South councils have recognised in their choice of projects the need to address this issue and
start meeting future transport demands. The projects identified further on in the RLTP also feed into the
GPS objective of providing a land transport system that provides appropriate transport choices. This
objective will allow communities to have access to a range of travel choices to meet their social, economic,
health and cultural needs.
Road Safety
Road safety is a well documented issue that all areas of New Zealand face. We read and hear of fatal
crashes and serious accidents in the media on a daily basis. Within all the Top of the South council’s
Transportation Activity/Asset Management Plans, a key Level of Service is the aim to have a downward
trend in the number of serious and fatal crashes on the transport network.
The Government's Safer Journeys 2010 – 2020 strategy highlights a safe road system that becomes
increasingly free of death and serious injury. The strategy introduced the Safe System approach to New
Zealand. This approach recognises that people make mistakes and are vulnerable in a crash. It aims to
reduce the price paid for a mistake so crashes don’t result in loss of life or limb. Mistakes are inevitable –
deaths and injuries from road crashes are not.
23Motorcycle training, Blenheim
Through the Top of the South’s Road Safety Action Plans (RSAP), the councils are aware of their road
safety issues. The issues we face centre on motorcycle crashes and loss of control on rural roads.
A number of the crashes we have are motorcyclists from out of the area or riders who have returned to
motorcycling at a later age. A considerable amount of work has taken place in the region through the RSAP
to address the issue with motorcycle crashes. Since 2002, the Top of the South has had a higher serious
injury or death rate caused by a motorcycle crash than the rest of New Zealand as shown in Graph 1.
Although, the data for this issue is displaying a downward trend our figures are still higher than the national
average. It is not acceptable that we have people not returning home to their family as a result of a road
crash.
The other key area of concern for the Top of the South is our crash statistic for rural roads as shown in
Graph 2, where again we are above the national average for New Zealand.
A contributor to these rural road crashes is tourism users due to their unfamiliarity with rural New Zealand
road conditions. With a large number of rural roads over the Top of the South that lead to remote tourist
destinations, such as the Kahurangi National Park, Totaranui and the Marlborough Sounds, road user safety
guidance becomes vitality important. With increasing numbers of overseas ‘self-drive’ visitors, their ability to
‘read the road’ effectively is important.
At a higher level, these crashes have an impact on our road network’s resilience and reliability as journeys
are disrupted and there may be a need for a viable alternative route. By investing in projects and activities
aiming to increase the efficiency, resilience and reliability of our network, a major beneficiary will be road
safety and a continued reduction in the number of deaths and serious injuries.
24Death or serious injuries in Motor Cyclist
18 crashes by 100,000 Population
16
14
12
10
8
6
4
2
0
2002 2003 2004 2005 2006 2007 2008 2009 2010 2011 2012 2013
New Zealand Nelson/Marborough/Tasman
Graph 1. Death or serious injuries in motor cycle crashes.
Death or serious injuries in Rural Road
60 crashes by 100,000 Population
50
40
30
20
10
0
2002 2003 2004 2005 2006 2007 2008 2009 2010 2011 2012 2013
New Zealand Nelson/Marborough/Tasman
Graph 2. Death or serious injury in rural road crashes.
25Part D – Agreed Top of the South Objectives
Top of the South significant activities to be funded from sources other
than the National Land Transport Fund
The Opawa River and Wairau River bridge replacements in Marlborough and the Southern Link
investigation, design and planning in Nelson are funded through the Government’s ‘Future Investment Fund’.
These projects have not been included in the funding submission to the NLTP. The three projects in Table 2
are not included with the other Top of the South significant activities as they do not need to be prioritised for
NLTF funding.
Table 2 – Significant activities not funded by the NLTF
Duration Activity Organisation Region
Responsible
2015-18 SH1 Opawa River bridge NZTA Marlborough
replacement
2015-18 SH1 Wairau River bridge NZTA Marlborough
replacement
2015-18 Southern Link, investigation, NZTA Nelson
design and planning
Objectives, Policies and Measures
This RLTP sets out the Top of the South region’s land transport objectives, policies, and measures of
success to 2025 that are consistent with the Draft GPS. The Draft GPS objectives, along with the agreed
regional objectives, policies and measures of success are presented in Table 3.
Table 3 – Draft GPS objectives and the agreed Top of the South
objectives, policies and measures of success
GPS Objectives Regional Objectives Policy/Direction Measures of success
for our communities
A land transport 1) A sustainable Target investment in Travel times between
system that transport system that regional route SH 6/60 and Port
addresses is integrated with well improvements to key Nelson, and on SH1
current and planned development, journey routes between Picton and
future demand enabling the efficient the Marlborough
Consider Top of the South
and reliable boundary are
options to collaborate and
movement of people consistent
improve road operations
and goods to, from
and maintenance delivery Reduction in the
and throughout the
mechanisms distance per capita
region
travelled in single
Target investment in
2) Supporting occupancy commuter
projects that reduce travel
economic growth vehicles
times and vehicle operating
through providing
costs on key journey routes ONRC is fully
better access across
26You can also read