Connecting Australia The economic and social contribution of Australia's airports - Deloitte
←
→
Page content transcription
If your browser does not render page correctly, please read the page content below
Connecting Australia

Connecting Australia
The economic and social contribution
of Australia’s airports
Australian Airports Association 2018

1

Connecting Australia

Contents
Glossary                                                                                                               i

Executive Summary                                                                                                     ii

1      Introduction                                                                                                   8

       1.1       Our approach                                                                                         8
       1.2       Structure of this report                                                                             9

2      Australia’s airports                                                                                         10

       2.1       A diverse sector                                                                                   10
       2.2       Recent growth and industry trends                                                                  11
       2.2.1       Passenger movements                                                                              11
       2.2.2       The impacts of the mining sector on regional airports                                            14
       2.2.3       Air freight                                                                                      16
       2.3       Market dynamics                                                                                    18
       2.3.1       Transformation in airports’ value proposition                                                    18
       2.3.2       Emerging Chinese markets                                                                         18
       2.4       Investment by the sector                                                                           20
       2.4.1       A pipeline of infrastructure investment                                                          20
       2.4.2       Levels of airport capital investment                                                             21
       2.4.3       The economic benefits of investment at airports                                                  22
       2.5       Innovation                                                                                         22
       2.6       Regulation of the sector                                                                           24

3      Contribution to the economy                                                                                  27

       3.1       Economics of the sector                                                                            27
       3.1.2       Profitability                                                                                    28
       3.2       Overview of approach to measuring the economic size of the
                 sector                                                     29
       3.2.1       Distinguishing between the core and precinct                                                     29
       3.3       Total economic contribution                                                                        30
       3.4       Economic contribution of airport core operations                                                   31
       3.5       Economic contribution of the broader precinct                                                      32
       3.5.1       Caveats and data limitations                                                                     33
       3.6       The wider economic gains generated by airports                                                     34
       3.6.1       Linkages with other sectors of the economy                                                       34
       3.6.2       Catalytic impacts                                                                                35

4      Broader contribution to the community                                                                        37

          Deloitte refers to one or more of Deloitte Touche Tohmatsu Limited, a UK private company limited by guarantee, and its network of member firms, each of which is a
          legally separate and independent entity. Please see www.deloitte.com/au/about for a detailed description of the legal structure of Deloitte Touche Tohmatsu Limited
          and its member firms.

          The entity named herein is a legally separate and independent entity. In providing this document, the author only acts in the named capacity and does not act in any
          other capacity. Nothing in this document, nor any related attachments or communications or services, have any capacity to bind any other entity under the ‘Deloitte’
          network of member firms.

          Liability limited by a scheme approved under Professional Standards Legislation.

          © 2018 Deloitte Access Economics
Connecting Australia
4.2 Facilitated domestic tourism 41
4.3 Broader social contribution to local communities 44
5 Strategic implications 48
5.1 Macroeconomic outlook 48
5.1.2 China and Asian growth 48
5.1.3 Australian dollar 49
5.1.4 Tourism outlook 50
5.2 Exposure to airline related risks 50
5.3 Development costs 51
5.4 Future industry challenges 51
References 54
Appendix A : Economic Contribution modelling framework 55
A.1. Methodology 55
A.1.1. Value added 56
A.1.2. Measuring the economic contribution – income approach 56
A.1.3. Direct and indirect contributions 57
A.1.4. Limitations of economic contribution studies 57
A.1.5. Input-output analysis 58
Limitation of our work 59
General use restriction 59Charts
Chart 2.1 : Classification of Australian airports, 2017 .............................10
Chart 2.2 : Passenger movements at Australian airports between
1986-87 and 2016-2017 .....................................................................12
Chart 2.3 : Aircraft movements at Australian airports, 1986-87 and
2016-2017 ........................................................................................12
Chart 2.4 : Distribution of international passenger movements ................13
Chart 2.5 : Growth in domestic passengers (base year = 2006-07)..........14
Chart 2.6 : Domestic aviation passenger volume index by route type
between 2009 and 2017 .....................................................................15
Chart 2.7 : Total passenger movements, selected regional airports in
Queensland and WA, FY2009-FY2017 ...................................................15
Chart 2.8 : Domestic air freight arrivals and departure for the top five
airports (tonnes) ...............................................................................16
Chart 2.9 : International air freight in Australia (tonnes carried),
2016-17 ...........................................................................................17
Chart 2.10 : Growth air freight by volume of freight transported,
2006-07 to 2016-17...........................................................................17
Chart 2.11 : Investment patterns at airports .........................................20
Chart 2.12 Capital expenditure over time for major airports ($
million).............................................................................................21
Chart 2.13 Survey data on investments by regional and major
regional airports in last three years ......................................................21
Chart 4.1 : International tourist visitor nights supported by air travel,
2016-17 (millions) .............................................................................37
Chart 4.2 : Expenditure of international tourists by industry, 2016-17
($m) ................................................................................................39
Chart 5.1 : Global economic growth over the past 10 years ....................48
Chart 5.2 : Exchange rate outlook .......................................................49
Chart 5.3 : Key challenges identified in the survey by type of airport .......52
Tables
Table i Economic contribution of airport core activities, 2016-17 ............... v
Table ii Contribution of airport core activities to employment (FTEs),
2016-17 ............................................................................................ v
Table iii Economic contribution of airport precinct activities, 2016-17 ........ vi
Table iv Contribution of airport precinct activities to employment
(FTEs), 2016-17 ................................................................................. vi
: Privatised airports .............................................................11
: Non-labour cost structure by airport size, 2016-17 ................28
: Direct economic contribution of airport core activities,
2016-17 ...........................................................................................32
: Indirect economic contribution of airport core activities,
2016-17 ...........................................................................................32
: Total economic contribution of airport core activities,
2016-17 ...........................................................................................32Connecting Australia
Economic contribution of airport precinct activities, 2016-17 .....33
Contribution of airport precinct activities to employment
(FTEs), 2016-17 ................................................................................33
: International tourism expenditure facilitated by the
aviation sector, 2016-17 .....................................................................38
: Economic contribution of international tourism supported
by the aviation sector, 2016-17 ...........................................................40
Economic contribution of international tourism supported by
the aviation sector, 2016-17 ...............................................................40
: Economic contribution of domestic tourism activity by the
aviation sector, 2016-17 .....................................................................41
Economic contribution of domestic tourism activity by the
aviation sector, 2016-17 .....................................................................42
Figures
Figure 2.1 The history of airport regulation in Australia 25
Figure 3.1 : An economic profile of airports 30
Figure 3.2 : Economic contribution 31
Figure 3.3 : The various parts of the economy supported by airports 35
Figure 5.1 : Relationship between individuals, airlines, and airports 50
Figure A.1 Economic activity accounting framework 57Connecting Australia
Glossary
Acronym Full name
AAA Australian Airports Association
AAPA Australian Airline Pilot Academy
ABS Australian Bureau of Statistics
ACCC Australian Consumer and Competition Commission
A-CDM Airport Collaborative Decision Making
BITRE Bureau of Infrastructure, Transport and Regional
Economics
CPI-X Consumer Price Index
DAE Deloitte Access Economics
FIFO Fly-in Fly-out
FTE Full Time Equivalent
GDP Gross Domestic Product
GOS Gross Operating Surplus
IATA International Air Transport Association
RPT Regular Public Transport
iConnecting Australia
Executive summary
Key findings at a glance
In 2016-17, the Australian airport sector facilitated almost 118
million domestic passenger movements and almost 39
million international passenger movements. Over the last five
years to 2016-17, total passenger movements grew by 14%.
Domestic passenger movements grew by 9%, while international
passenger movements grew by 34%.
This growth has seen the total value added of airport core
activities increase to $4.9 billion, up from $3.2 billion in 2011.
The sector is currently supporting employment of over 8,700 Full
Time Equivalent (FTE) jobs.
Outside the core activities of airports themselves, airports
support a much wider ambit of economic activity within
their precincts including retail, office spaces, logistics and
broader aviation sector activity.
Combining both core and precinct, the value added of airports
was estimated at $34.6 billion, or around 2% of Australia’s
GDP. The contribution of airports and their broader precinct to
employment (both direct and indirect) was estimated to be
206,400 FTEs. This is significantly larger than the aviation sector
itself reflecting the degree of non-aeronautical activities
undertaken on airport precincts including: retail and tourism
services; airline operations, general aviation and aircraft
maintenance; transport; activities by government agencies and
broader non-aeronautical commercial activities.Connecting Australia
In contrast to the results for core airport activity, the precinct level
results in this report are not directly comparable to those in the
previous 2012 report. The estimate of precinct level activity
developed for this report has been based on an industry survey of
precinct level airport activity and a number of recent studies of
precinct activity at major airports. This new information has
allowed Deloitte Access Economics to build on the exploratory
analysis undertaken in the last report and develop a more robust
measure of precinct level activity for this report.
The airport sector also has a vital role in transporting time critical
goods within Australia and between Australia and the rest of the
world. In 2016-17, the airport sector supported the transportation
of 450,000 cargo tonnes domestically and over a million tonnes
internationally. The majority of the goods were low density, high
value and time critical, such as eCommerce parcels, perishable
food, and medical items.
While air freight only accounted for 0.1% of freight transported
between Australia and the rest of the world by volume, it
accounted for 21% of freight by value (BITRE 2014).
The airport sector also plays an important role in facilitating
international tourist arrivals. In 2016-17, the aviation sector
facilitated 8 million international tourist trips to Australia and
$27 billion of international tourism expenditure.
The international tourism activity facilitated by the Australian
airport sector contributed $21.6 billion in total value added,
equivalent to 1.3% of the national economy and supported
218,500 jobs, equivalent to 1.8% of the total employment in
Australia.
The airport sector also plays an important role in supporting
domestic tourism activity. Domestic tourism activity facilitated by
the Australian airport sector was estimated to contribute $10.6
billion in total value added and supported 121,200 jobs.
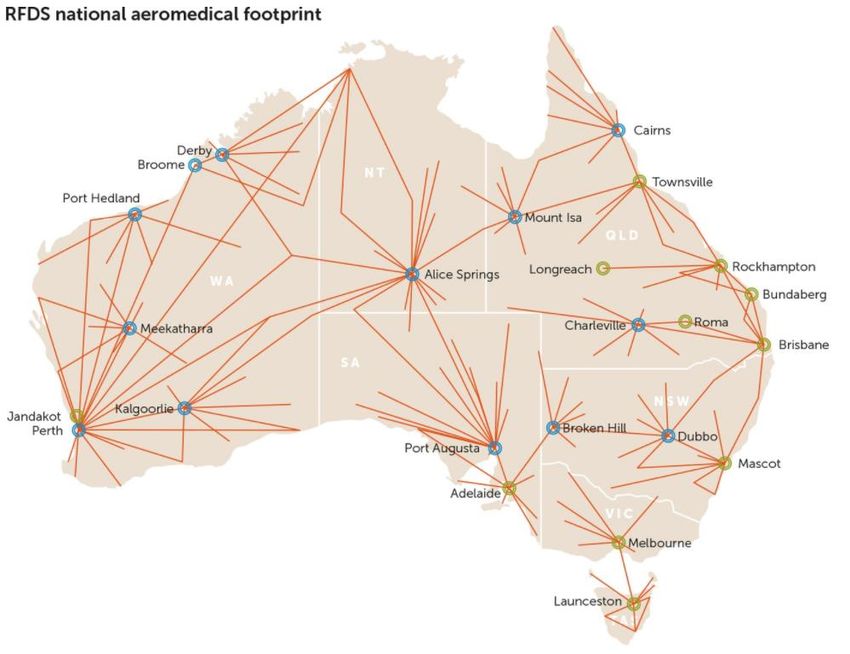
The Australian airport sector plays a defining role in connecting
families, friends and communities, promoting tourism and trade
and supporting essential and emergency services, such as the
Royal Flying Doctor Service, providing aviation skills training and
supporting community groups.
The sector is incredibly diverse encompassing both large
metropolitan airports such as Sydney, Melbourne, Brisbane, Perth
and smaller regional and remote airports as well as a number of
isolated landing strips. Regardless of size or location, all airports
play a role in connecting individuals to essential services and
connecting Australia to the world.
The domestic and international economic outlook for the airport
sector remains favourable with a slowed but positive growth
outlook for major source countries and a lower Australian dollar
helping to offset the winding down of the mining boom, although
the impact of these broader macroeconomic trends will differ
across the sector.
iiiConnecting Australia The Australian airport sector The airport sector in Australia is highly diverse. It is characterised by around 155 airports which receive Regular Public Transport (RPT) services and more than 2000 smaller airfields and landing strips around the country. The airports are classified by size and level of activity into five groups: major, major regional, regional, remote, and federally leased secondary/metro airports. Ten airports were classified as major airports: Sydney; Melbourne; Brisbane; Perth; Adelaide; Gold Coast; Cairns; Canberra; Hobart; and Darwin. A further 30 airports were classified as major regional airports, 79 as regional airports, 58 as remote and 6 as federally leased secondary/metro airports. Currently, just under 25% of total passenger movements facilitated by the sector are international. The overall number of international passenger movements grew sharply by 34% over the last five years to reach 39 million passenger movements in 2016-17. International passenger movements count both arrivals and departures by the more than 8 million tourists who visit Australia each year as well as arrivals and departures by other visitors such as permanent migrants and arrivals and departures of Australian residents. By comparison, domestic passenger movements grew at a more moderate pace increasing by 9% over the same period to reach 118 million passenger movements. The pace of growth across different airports has been far from uniform. A number of regional airports in Queensland and Western Australia saw strong growth as a consequence of the mining construction boom as they met the demands of the Fly-in Fly-out (FIFO) workforce but have since experienced a decline in demand as the mining construction boom has begun to wind down. Meanwhile, other regional areas have benefitted from an increase in both domestic and international leisure travel. The spread of international visitor movements has also progressively broadened. Thirty years ago more than 53% of international passenger movements to Australia occurred through Sydney Airport whereas today, only 40% do. Airports such as Adelaide and the Gold Coast have significantly grown their international market share over recent years, providing a wider choice of destinations for international tourists. In responding to the growth in demand for air travel, airports have committed to record levels of capital investment in recent years and invested in a range of innovations to improve the customer experience. The major airports alone invested a total of $6.6 billion over the last five years and $11.5 billion over the last decade. This investment has been largely influenced by the need to accommodate the growth in demand and the development of new larger aircraft Contribution of airport core activities Airports typically play a large economic and strategic role in connecting individuals, facilitating economic activity and providing critical services for remote communities. Fundamentally, they contain an operational ‘core’, which comprises the central operation of an airport facility, including its runway infrastructure, terminals and critical aviation safety and security. This core activity is a subset of the broader activity that may occur on the airport precinct which may include airline and charter operations, retail and tourism services and landside transport and logistics. Drawing on data from an industry survey and financial reports, the economic contribution analysis estimated the direct and indirect value added of the Australian airport sector. The results in Table i indicate that airport core activities contributed $4.9 billion in value added to the Australian economy in 2016-17, including $3.8 billion in direct value added and $1.1 billion in indirect value added. The vast majority was associated with major airports reflecting their relatively large share of the sector.
Connecting Australia

Table i Economic contribution of airport core activities, 2016-17

                                 Direct value added           Indirect value added      Total value added
                                        ($m)                          ($m)                     ($m)

Major airports                           3,462                           949                 4,411
Major regional/ Federally
                                          219                             83                  303
leased airports
Regional airports                          96                             48                  144
Remote airports                             8                             22                   30
Total                                    3,786                         1,102                 4,888
Source: Deloitte Access Economics
Note: Numbers may not add to totals as value added is rounded to the nearest million.

Table ii shows the contribution of airport core activities to employment. Although the sector is
relatively capital intensive, it supported the employment of over 2,500 FTEs directly and over
8,700 FTEs in total. Direct employment here captures those who are employed by the airport itself
(e.g. Sydney Airport Corporation Limited) and indirect employment captures employment for those
companies that supply the organisations that run airports (e.g. Sydney Airport Corporation
Limited). For example, employment in companies providing office supplies or cleaning services to
Sydney Airport Corporation Limited would be captured as indirect employment for airport core
activities. Employees of other organisations that may be present on the airport precinct e.g. the
Australian Border Force, retail outlets and Airservices Australia are captured under direct
employment at the precinct shown in Table iv below.

Table ii Contribution of airport core activities to employment (FTEs), 2016-17

                                         Direct                       Indirect                Total

Major airports                           1,897                          5,200                7,097
Major regional/Federally
                                          441                            503                  945
leased airports
Regional airports                         171                            314                  485
Remote airports                            51                            144                  195
Total                                    2,560                         6,162                 8,722
Source: Deloitte Access Economics
Note: Numbers may not add to totals due to rounding errors.

Contribution of the broader airport precinct

In addition to their core activities, airports support a much larger range of activity through other
businesses operating within their precinct. These include all activities that are not operated by
airports directly such as airlines, retail, immigration and customs and companies operating on the
broader precinct e.g. rental car companies. Given the large number of businesses that may operate
on a given airport precinct, estimating the contribution of this broader footprint is a more
challenging exercise.

Deloitte Access Economics has sought to estimate the broader footprint by relying on a range of
questions on precinct level employment from a survey of airports as well as previous studies of the
economic precinct of major airports. Nonetheless, given the wide range of activities occurring on
airport precincts, these estimates are necessarily less precise than those for core airport activities
(in the case of the latter, survey results can be supplemented and cross-checked against public
information such as annual reports).

                                                                                                            v
Connecting Australia
The precinct level results in this report should not be directly compared to those in the previous
2012 report to assess the growth of on-airport activity in the sector. The estimates contained in the
2012 report were very much exploratory in nature. This report has been able to draw on a range of
recently published studies of precinct level activities at major airports and also information on
precinct activity from the survey which was not available in the 2012 study to estimate the size of
precinct level activity.
Overall, as illustrated by Table iii and Table iv, precinct level activities outside the core activities of
airports were estimated to contribute $29.7 billion in total value added to Australia. Some of the
indirect value added associated with the precinct would otherwise be captured by the economic
contribution of core airport operations (e.g. rental payments by retailers). These transfers were
excluded from estimates of the economic contribution of the airport precinct to avoid double-
counting activity in the core and broader precinct.
Table iii Economic contribution of airport precinct activities, 2016-17
Direct value added Indirect value added Total value added
($m) ($m) ($m)
Major airports 15,388 12,500 27,888
Major regional/Federally 943 424 1,366
leased airports
Regional airports 318 124 443
Remote airports 25 22 47
Total 16,673 13,070 29,744
Source: Deloitte Access Economics
Note: Numbers may not add to totals as value added is rounded to the nearest million.
Similarly, economic activity on the precinct was estimated to support the employment of over
197,600 FTEs, as shown in Table iv.
Table iv Contribution of airport precinct activities to employment (FTEs), 2016-17
Direct Indirect Total
Major airports 97,241 86,270 183,511
Major regional/Federally 6,092 4,186 10,279
leased airports
Regional airports 2,409 1,146 3,555
Remote airports 186 159 345
Total 105,929 91,761 197,690
Source: Deloitte Access Economics
Note: Numbers may not add to totals due to rounding errors.
Combining both airport core activities and wider precinct activities, total industry value added was
estimated to be $34.6 billion, or 2.0% of Australia’s GDP. The contribution of airports and their
broader precincts to employment (both direct and indirect) was estimated to be over 206,400
FTEs.Connecting Australia
Contribution of tourism facilitated by the Australian airport sector
The Australian airport sector facilitated 8 million international trips and $27 billion in international
tourism expenditure in Australia as well as supporting domestic travel by Australians.
The role of airports in facilitating international tourism contributed $12 billion in direct value added
and supported 146,000 jobs in Australia. Combined with the indirect contribution to upstream
suppliers, it is estimated that international tourism facilitated by the airport sector contributed
$21.6 billion to the national Gross Domestic Product (GDP), and supported 218,500 jobs in
Australia. These contributions were equivalent to 1.3% of the GDP and 1.8% of total jobs in
Australia.
The airport sector also plays an important role in supporting domestic tourism activity. Domestic
tourism activity facilitated by the Australian airport sector was estimated to contribute $10.6 billion
in total value added and support 121,200 jobs. These contributions were equivalent to 0.6% of
GDP and 1.0% of national employment.
Combining both domestic and international tourism, the Australia airport sector facilitated $32.2
billion in tourism activity nationwide.
Deloitte Access Economics
viiConnecting Australia
1 Introduction
The Australian Airports Association has engaged Deloitte Access Economics to undertake an update
of the economic and social contribution study of the airport industry that was previously
undertaken in 2012. The primary aim of this study is to provide the Australian Airports Association
with an up to date picture of the economic and social contribution that the airport sector makes to
the Australian economy and community.
The study examines the significant role of Australia’s network of airports in connecting
communities, facilitating economic activities, and promoting social inclusion. It highlights the range
of commercial activities that are typically supported by the presence and operation of airports.
The study is intended to stand as an information resource for industry, stakeholders and
Government on the economics of airports and the nature of their economic and social contribution
to Australia. In this regard, building on the quantitative findings, the study contains views from
industry participants and discusses some strategic implications for the future of Australia’s airport
industry.
1.1 Our approach
The study has drawn on a range of sources to capture the economic contribution of airports and
the broader benefits of airports on their communities. This has included fielding a detailed
Economic Impact Survey to all airports in Australia as part of this study, drawing on data from
airport financial reports and reviewing previous studies of the economic contribution of larger
airports.
This data has been used to estimate the contribution of airports to value added and employment
with the economic contribution analysis drawing on the Australian National Accounts: Input-Output
Tables, 2014-15 published by the Australian Bureau of Statistics (ABS), the 2015-16 State Tourism
Satellite Account published by Tourism Research Australia, and the Deloitte Access Economics
Regional Input-Output Model.
In addition, this report has drawn on a range of sources to identify the level of investment in the
airport sector, the operation of the regulatory environment, the broader social contribution made
by airports and the strategic environment in which they operate. The key themes of the report are
illustrated by a range of case studies of individual airports.
There are four main components of this study:
The economic contribution of airports’ core operations: The core contribution of
airports focuses on the economic footprint of the airports themselves and the revenue they
generate from their operations including leasing retail and terminal space, and revenue from
car parks. For large airports, the analysis has been based on publicly available financial data,
data from the survey and previous reports on airport activity by Deloitte Access Economics.
For airports without survey data and whose data are not available publicly, contributions have
been estimated based on passenger and aircraft movements.
The economic contribution of broader activity occurring at airport precincts: In
addition to the contribution from the airport’s core operations, there is a substantial portion of
the contribution that is made through other businesses located within airport precincts such
as: retail, logistics, aircraft repair and maintenance and business parks. The analysis in this
section is supported by the Economic Impact Survey conducted by Deloitte Access Economics,
which included questions on airport profiles, financial information, and scale of on precinct
activity. Regional case studies: The report includes a range of case studies to illustrate the
significance of airports to their regions and their commitment in supporting the development
of their regions.
Contributions of tourism activity facilitated by the airport sector: With the vast
majority of international tourists arriving in Australia by air, the activities of the airport sector
are instrumental to facilitating economic activity across Australia’s international tourism
industry. The role of airports in facilitating tourism has been captured by combining
information from the Tourism Satellite Accounts with data on the proportion of tourists who
enter Australia on cruise ships.
1.2 Structure of this report
The report is divided into four chapters:
Chapter 2: Australia’s airports— This chapter sets out the current profile of the nation’s
network of airports and identifies overarching trends that have driven the development of the
sector, including market dynamics, investment by the sector, innovation and the approach to
regulating the airport sector.
Chapter 3: Contribution to the economy — This chapter measures the economic
contribution of both airport core operations and broader precinct activities. It explores how
airports underpin a spectrum of economic activities that in turn contribute to Australia’s
overall economic prosperity.
Chapter 4: Broader contribution to the economy — This chapter discusses the broader
contribution of airports to the economy through facilitating tourism, connecting communities
and promoting social inclusion.
Chapter 5: Strategic implications — This chapter outlines the future opportunities, risks
and policy environment for Australia’s airport sector. This includes a synthesis of issues raised
by industry representatives that have been identified through the survey.
9Connecting Australia
2 Australia’s airports
This chapter sets out the current profile of the nation’s network of airports and recent
developments in the sector. The key role of airports in the economy is also highlighted, supported
by a number of metrics and statistics around the structure, cost and revenue base of the industry.
2.1 A diverse sector
The airport sector in Australia is characterised by around 155 airports and more than 2000 smaller
airfields and landing strips around the country. Among the 155 airports with RPT services, 75% of
them are located in regional and remote areas. Overall activity is dominated by larger facilities and
the 10 largest service about 140 million domestic and international passengers and comprise about
90% of the overall passenger traffic in 2016-17.
Chart 2.1: Classification of Australian airports, 2017
Major airports Federally leased
10 secondary/metro
(6%) airports
6
Major regional (3%)
airports
30
(16%) Regional
airports
79
(43%)
Remote
airports
58
(32%)
Source: Deloitte Access Economics
Note: A total of 183 airports are included here but not all currently have RPT services.
Australia’s airports can also be grouped by ownership type where the major categories of airport
ownership in Australia are:
Privatised airports.
Government (local/state) owned regional airports/aerodromes.
Defence owned airports.
Privately owned airstrips.
A list of airports leased under the Airports Act 1996 (Cth) is provided in Table 2.1. Some other
privatised airports are privately owned, leased from the Queensland Government, local councils
and the Defence department. The majority of regional airports are owned and operated by local or
state governments. Much of this structure is attributable to the Aerodrome Local Ownership Plan
(ALOP), which operated during 1985-1990, under which the Federal Government encouraged local
ownership of airports.: Privatised airports
State/Territory Privatised airports (under long term Federal
leases)
ACT Canberra
NSW Sydney, Bankstown, Camden
QLD Brisbane, Gold Coast, Townsville, Archerfield, Mt. Isa
NT Darwin, Alice Springs, Tennant Creek
VIC Melbourne, Essendon, Moorabbin
TAS Hobart, Launceston
SA Adelaide, Parafield
WA Perth, Jandakot
Source: BITRE 2015
2.2 Recent growth and industry trends
2.2.1 Passenger movements
The Australian airport sector has been supported by a strong growth in passenger movements in
the past 10 years. Total passenger movements have increased by an average of 3% annually over
the last decade, from 112 million in 2006-07 to 156 million in 2016-17. This strong growth has
been driven by an increasing demand for both domestic and international air travel.
Supported by large and fast growing Asian economies, international passenger movements have
increased considerably, from 22 million in 2006-07 to 39 million in 2016-17, an equivalent of 6%
annually. At the same time, domestic passenger movements have increased by an average of 3%
annually. While the growth rate in domestic travel has not been as high as in international travel,
domestic travel accounted for 75% of total passenger movements in 2016-17.
While the trend in passenger movements have been positive in recent years, it has not always
been the case historically. Chart 2.2 shows that there were some sizeable decreases in domestic
passenger movements in 1989-90 and 2001-02 by 28% and 10% respectively. These were entirely
the result of supply side shocks, the pilots’ strike and the collapse of Ansett respectively, and the
rapid recovery is evidence that there was no softening in the underlying demand for RPT services.
The growth of international passenger movements, while being less volatile, declined in 2001-02
and 2002-03 by 4% and 2% respectively. Despite some decreases in certain years, the overall
number of passenger movements, domestically and internationally, has increased substantially
over the last three decades, from 34 million passengers to 156 million passengers.
11Connecting Australia
Chart 2.2: Passenger movements at Australian airports between 1986-87 and 2016-2017
140
Passenger movements
120
(Millions)
100
80
60
40
20
0
1986-87 1991-92 1996-97 2001-02 2006-07 2011-12 2016-17
Domestic passengers International passengers
Source: BITRE Airport Traffic Statistics, 2017
The trend in aircraft movements over the period has been consistent with the trends in passenger
movement growth, although aircraft movements have grown at a slower rate due to a shift to
larger aircraft and higher load factors. Domestic and international aircraft movements have had
average annual growth rates of 2% and 5% per annum respectively between 1986-87 and
2016-17. Chart 2.3 presents the growth in aircraft movements over this period.
Chart 2.3: Aircraft movements at Australian airports, 1986-87 and 2016-2017
1,400
1,200
Aircraft movements (Thousands)
1,000
800
600
400
200
0
1986-87 1991-92 1996-97 2001-02 2006-07 2011-12 2016-17
Domestic aircraft movement International aircraft movement
Source: BITRE Airport Traffic Statistics, 2017
The growth in passenger movements has not been evenly distributed across Australian airports.
The majority of international air travel to and from Australia (99%, 38 million passengers) has
been serviced by seven major airports, including Sydney, Melbourne, Brisbane, Perth, Gold Coast,
Adelaide and Cairns. The majority of Australian airports, as a result, have not directly experienced
the recent growth in international passengers, although these passengers may fly to other
domestic airports subsequently.Chart 2.4: Distribution of international passenger movements
2016-17
2006-07
0% 20% 40% 60% 80% 100%
Sydney Melbourne Brisbane Perth
Gold Coast Adelaide Cairns Other airports
Source: BITRE Airport Traffic Statistics, 2017
Nevertheless, there have been some changes in the relative importance among the top seven
airports. The proportions of international passengers going through the Sydney and Brisbane
airports have slightly decreased over the past 10 years, from 46% to 40% for Sydney airport and
from 18% to 14% for Brisbane airport. Three decades ago, 53% of all international passenger
movements occurred through Sydney airport. By comparison, the proportion of international
passengers going through Melbourne airport has increased from 20% to 26% over the last decade.
The Gold Coast and Adelaide airports, while being relatively small, now provide services to an
increasing proportion of international travellers. Perth airport has a relatively high share of
international passenger movements as a proportion of total movements with 36% of total
movements in 2016-17 being international passenger movements, with only Sydney Airport having
a higher proportion of international to total movements at 37%.
The following case study on Adelaide airport provides an example of the actions that are being
taken to enhance international and domestic route development by smaller international airports.
The recent opening of flights to Singapore and New Zealand from Canberra airport is another
prominent example of route development by international airports.
13Connecting Australia
Case study: Adelaide - International market expansion and route
development
Adelaide Airport is Australia’s fifth-largest domestic, and sixth-largest international airport. Its
continued pursuit of new domestic and international markets and routes has earned it Travel +
Leisure’s 9th best international airport in the world in 2016.
In recent years, Adelaide Airport has actively invested in increasing the number of routes
(domestic and international), available to passengers. Since 2016, three new international
services have commenced operation out of Adelaide, operated by Qatar Airways, China Southern
Airlines and Fiji Airways. On the domestic front, Jetstar has launched two new routes to Avalon
and the Sunshine Coast.
In addition to increasing the number of routes and locations serviced by the airport, the frequency
of existing popular routes has been increased. In particular, Singapore Airlines seasonally
increased their services from daily to a 10-a-week service in December 2016 and January 2017,
and Cathay Pacific has recently added a fifth weekly year round service.
Most recently, on the domestic front, Qantas commenced Adelaide-Kangaroo Island flights in
December 2017 and Adelaide Newcastle flights will commence in March 2018.
Source: Adelaide Airport
Australia’s top seven airports were also responsible for 80% of domestic travel in 2016-17. Chart
2.5 shows that the top seven airports have experienced slightly stronger growth in domestic
passengers than other airports over the last 10 years. An important cause of this slower growth
has been the end of the construction phase of the resources boom. The impacts of this on regional
airports are discussed in the following section.
Chart 2.5: Growth in domestic passengers (base year = 2006-07)
1.4
1.2
1
0.8
0.6
0.4
0.2
0
2006-07 2008-09 2010-11 2012-13 2014-15 2016-17
Other airports Top seven airports
Source: BITRE Airport Traffic Statistics, 2017
2.2.2 The impacts of the mining sector on regional airports
During the mining construction boom, many airlines expanded capacity to regional airports.
However, the completion of a large number of major projects has seen a reduction in services for
many regional airports.
As illustrated in Chart 2.6 below, mining routes for Queensland and Western Australia follow a
similar pattern, with passenger activity falling after February 2013. Both the size of the rise and fallin mining related aviation routes has been more pronounced in Western Australia than Queensland,
reflecting the relative expansion and contraction of mining construction activity in that state and
the heavier reliance on a FIFO workforce. Chart 2.7 shows that the decline in passenger
movements has been particularly pronounced for Karratha, Mackay and Port Hedland.
Overall, the adverse impacts of the decline of the mining sector construction, to a certain extent,
have been offset by the strong growth in other types of travel, namely leisure travel and inter-
capital travel. These types of travel have supported growth in the overall sector.
Chart 2.6: Domestic aviation passenger volume index by route type between 2009 and 2017
2.4
2.2
2
1.8
1.6
1.4
1.2
1
0.8
Regional Inter-capital Leisure Qld Mining WA Mining
Source: BITRE, Deloitte Access Economics
Chart 2.7: Total passenger movements, selected regional airports in Queensland and WA, FY2009-
FY2017
1,800,000
1,600,000
1,400,000
1,200,000
1,000,000
800,000
600,000
400,000
200,000
0
2006-07 2008-09 2010-11 2012-13 2014-15 2016-17
Karratha Mackay Mount Isa
Port Hedland Townsville
Source: BITRE, Deloitte Access Economics
15Connecting Australia
Many regional airports currently operate at a loss and depend heavily on local government
subsidies. A submission by the Australian Airports Association to a review of regional airports by
the Western Australian Parliament notes that close to 40% of Australian regional airports expect to
run on an annual budget deficit over the next 10 years (Australian Airport Association, 2017).
2.2.3 Air freight
Due to great geographical distances between major cities of Australia and between Australia and
the rest of the world, air freight has become increasingly important for transporting goods
domestically and internationally. Goods transported by air are mostly low density, high value, and
time critical commodities, such as eCommerce goods, seafood, fresh produce, jewellery and
medical items. Although global air cargo only accounts for less than 1% of world trade shipments
by volume, it makes up around 35% by value. The majority of air freight is carried in the belly of
passenger planes.
Between 2009-10 and 2014-15, both major and regional airports experienced a gradual decline in
domestic air freight in volume terms (tonnes of freight carried), with total freight volume declining
from 472,400 tonnes in 2009-10 to 390,300 tonnes in 2015-16.1 Nevertheless, domestic air freight
picked up in 2016-17 with a 15% increase to 450,000 cargo tonnes. In the short to medium term,
airline investment in larger aircraft, especially on popular routes, is expected to support the
recovery of domestic air freight.
Chart 2.8: Domestic air freight arrivals and departure for the top five airports (tonnes)
160,000
140,000
120,000
100,000
80,000
60,000
40,000
20,000
0
2009-10 2011-12 2013-14 2015-16
Sydney Melbourne Brisbane
Perth Adelaide Rest of Australia
Source: BITRE
Note: Airport cargo tonnes are the sum of cargo tonnes on arrivals and departures at each airport.
The volume of international air freight in terms of tonnes carried has increased by an average of
3% annually over the last decade, from 755,000 tonnes in 2006-07 to over 1 million tonnes in
2016-17. While carrying only 0.1% of Australia’s international freight by weight, air freight makes
up nearly 21% of freight by value (BITRE 2014). In 2011-12, airports facilitated over 750,000
tonnes of high-value and time sensitive freight, worth over $110 billion (BITRE, 2014).
The strong growth in air freight have been supported by the increasing international demand for
Australian perishable agricultural products such as livestock and fisheries products. The strong
1
Total movements in the BITRE air freight data capture arrivals and departures so each movement is counted
twice.growth in international passengers, coupled with an increasing number of wide-body aircraft has
helped provide additional capacity for international freight movements.
The four largest capital city airports are responsible for transporting the vast majority of
international air freight in Australia, as illustrated in Chart 2.9 below. These four airports were
responsible for transporting 97% all international freight into and out of Australia over the period.
Chart 2.9: International air freight in Australia (tonnes carried), 2016-17
Perth Others
100,954 37,472
(10%) (3%)
Brisbane
126,360
(12%) Sydney
489,183
(47%)
Melbourne
290,827
(28%)
Sydney Melbourne Brisbane Perth Others
Source: BITRE Airport Traffic Statistics, 2017
The volume of air freight transported through Sydney, Melbourne, Brisbane and Perth airports have
increased strongly over the last 10 years, with air freight in Perth airport having the most
significant increase (56%). Among regional airports, the Gold Coast airport has experienced a
notable increase in air freight, from only 63 tonnes in 2006-07 to 7,293 tonnes in 2016-17.
Charts 2.10 represents the growth in air freight movements among the fourth largest airports.
Chart 2.10: Growth air freight by volume of freight transported, 2006-07 to 2016-17
1.8
1.6
1.4
1.2
1
0.8
0.6
0.4
0.2
0
2006-07 2008-09 2010-11 2012-13 2014-15 2016-17
Perth Brisbane Melbourne Sydney
Source: BITRE Airport Traffic Statistics, 2017
17Connecting Australia 2.3 Market dynamics Airports have undoubtedly experienced significant disruptions to their operating environment in the last five years. Demands from travellers for an improved airport experience have led to a transformation in airports’ value proposition. Modern airports are not only infrastructure providers to airlines but also service providers to travellers. Additionally, changes in the broader aviation industry have further influenced the direction in which airports have developed. This section provides a discussion on the major trends in the airport sectors. 2.3.1 Transformation in airports’ value proposition Traditionally, airports have been seen as providers of transport infrastructure, supporting the operation of airlines and aviation-related functions. While the need for transportation remains the primary reason for people to come to an airport, travellers now demand much more from their airport experience. They want a holistic airport experience, including convenient connection to the city centre, automatic check-in and baggage drop services, fast security clearance, automatic border control gates and a wide range of business and leisure opportunities available onsite. While providing transport infrastructure remains the core function of airports, it is essential for airports to recognise traveller demand and transform to be more customer-centric. This transformation, similar to any other airport infrastructure development, requires careful planning and a significant amount of investment. The transformation to improve customer experience is further disrupted by the unprecedented rate of digital development. The emergence of rideshare services has brought certain challenges to the management of vehicle movements. It has also added another dimension to the role of airports in balancing travellers’ demand while maintaining the relationship between airports and traditional taxi services. Additionally, the increasing popularity of smartphones creates a new platform for airports to communicate important information with travellers via mobile apps efficiently and effectively. 2.3.2 Emerging Chinese markets As the primary connection between Australia and the rest of the world, the Australian aviation sector is closely linked to changes in the world economy. The rapid economic development of China, as discussed further in section 5.1, has created significant demand for travel between Australia and China. In December 2016 the Australian and Chinese governments agreed to allow an open aviation market between the two countries, effectively removing all capacity restrictions for airlines of the two countries, liberalising the aviation market and creating a number of opportunities for the aviation sector of both countries. The recent collaborations with Chinese airlines and increase in Chinese passengers require Australian airports to find a way to cater to the specific needs of Chinese travellers. Many airports, including the Sydney and the Gold Coast airport, have employees speaking Mandarin to help Chinese passengers navigate through their airports. Information leaflets in Mandarin are also provided in some airports.
Case study: The growth of Chinese airlines

The rapid economic development in China, coupled with the removal of aviation restrictions between
Australia and China has created significant opportunities for Chinese airlines. Seven new routes serviced
by Chinese airlines were opened in the second half of 2017, connecting Sydney, Melbourne, Brisbane,
and Cairns with Chinese cities. Chinese airlines currently operating in the Australian market are Air
China, Beijing Capital, China Airlines, China Eastern Airlines, China Southern Airlines, Hainan Airlines,
Xiamen Airlines and Sichuan Airlines.

Over the year to October 2017, these Chinese airlines carried 1.5 million passengers into Australia,
representing a 24% increase in inbound passengers compared to the same period the previous year.

Number of passengers travelling to Australia

Source: BITRE

In October 2017, the three largest airlines – China Southern Airlines, China Eastern Airlines and Air
China – accounted for 75% of total passengers travelling on Chinese airlines from China to Australia.
China Southern Airlines is the largest carrier, providing transportation services to 595,971 inbound
passengers over the year to October 2017. It was followed by China Eastern Airlines (361,553
passengers) and Air China (203,301 passengers).

The smaller airlines, including Xiamen Airlines, Hainan Airlines, Sichuan Airlines and Beijing Capital
Airlines are relatively new to the Australian market. Hainan Airlines officially started their operation in
October 2016 after seasonal flights in the previous year. It brought in 83,129 inbound passengers over
the year to October 2017. Beijing Capital started in September 2016 and since then, it has an average
of more than 2100 inbound passengers per month.

The expansion of China Southern Airlines and the entrance of other Chinese airlines facilitated the
increase in Chinese airlines market share. Between October 2015 and October 2017, the market share
of Chinese airlines has increased from 7% to 8%. In 2016-17, China Southern Airlines was the tenth
largest international airline operating in Australia, accounting for 3% of international passenger
travelling to and from Australia.

At the same time as Chinese airlines have experienced growing passenger numbers so has Qantas,
which experienced a 64.4% increase in passenger numbers on Chinese routes over the year to October
2017 from 83,607 passengers to 137,249 almost part of this increase may have been due to cessation
of Jetstar services to China in September 2016.

  19
Connecting Australia

2.4        Investment by the sector
Airports are capital intensive businesses. Airport infrastructure has a long asset life and few, if any,
alternative uses. Now more than ever, airports are also investing to enhance the quality and
breadth of services they provide to improve the customer experience. The expectations for
amenity levels in airport terminals also have increased over time, requiring upgrades to existing
facilities. Some areas where investments have been required in recent years include: terminal and
runway upgrades to handle larger aircraft; redevelopment of passenger terminals, extension of car
parking facilities and property developments relating to logistics, retail and commercial activities.

2.4.1        A pipeline of infrastructure investment
As illustrated in Chart 2.11, airport infrastructure has to exhibit decreasing average costs over its
economic life. Typically, the costs per passenger of additional infrastructure facilities are highest
once they become operational, falling over time with greater usage as high fixed costs can be
spread over a larger customer base. Increases in passenger usage will also dictate the timing of
additional investments, with new infrastructure needed as critical capacity thresholds are reached.
Infrastructure capacity will also be dictated by maximum load requirements, which may not be
reached for some time or used very often.

Chart 2.11: Investment patterns at airports

Source: Deloitte Access Economics 2012.

While airport infrastructure is characterised by an extremely long asset life, it is also associated
with long lead in times. This means that expenditures made today, often take a period of several
years to materialise into operational facilities. Therefore, in order to ensure market demand is
met, airports are required to identify periodic expansion investments far in advance of any forecast
shortfalls, usually through a Master Plan.

Given the level of activity at many of Australia’s capital city and major regional airports, there has
been a continuous stream of comparatively smaller investments associated with ongoing
maintenance and refurbishments. Hence, the unprecedented growth in passenger traffic over the
past few decades has, in some cases, exceeded the planned capacity of some key airports. As a
result, the most substantial investments in the airport industry have stemmed from the large-scale
expansion of aviation related and other aeronautical assets.
2.4.2      Levels of airport capital investment
Chart 2.12 below provides data on historical capital expenditure over time for the major airports.
As can be seen from the chart there was significant growth over time with capital expenditure
peaking in 2015 and 2016. The major airports have invested a total of $6.6 billion over the last five
years and $11.5 billion over the last decade.

Chart 2.12 Capital expenditure over time for major airports ($ million)

 2,000

 1,800

 1,600

 1,400

 1,200

 1,000

     800

     600

     400

     200

       0
            2008 2009 2010 2011 2012 2013 2014 2015 2016 2017

Source: Australian Airports Association.

Detailed information is not available on the capital expenditure levels of regional and remote
airports. A handful of regional airports provided information on capital expenditure levels through
the survey, which is contained in Chart 2.13.

Chart 2.13 Survey data on investments by regional and major regional airports in last three years

Source: Deloitte Access Economics Airport Survey.

21
Connecting Australia Capital expenditure over the last three years was separated into three categories: airside which includes any improvements made to: aviation related facilities, including runways, aprons, taxiways, navigation aids and lighting; upgrades to the terminal; and property which includes any other improvements to the airport’s property, such as electrical, internet or parking infrastructure. In our sample the regional airports invested far more in airside infrastructure than terminal or other property improvements. Regional airports invested $36 million dollars in aviation related improvements, compared to only $15 million in terminal upgrade and $470,000 in property. Only one regional airport surveyed had invested in their terminal and two had invested in property improvements. In contrast, over half had invested in aviation infrastructure. Major regional airports invested $64 million in airside improvements, $28 million in property and $8 million in terminal upgrades. A third of major regional airports surveyed invested in their terminal, four in 10 upgraded their property and three quarters improved their airside facilities. Respondents were also asked about capital expenditure planned for the next five years. Every respondent replied that their airport had some degree of investment planned for the coming five years. In total four in five respondents had airside improvement in the pipeline, showing the continued emphasis placed on aviation infrastructure investment of the last three years. Of the airports surveyed over half indicated plans to invest in property improvements and over 40% indicated plans to invest in the airport’s terminal. A slightly higher proportion of major regional airports have plans to invest in their terminal and property, with 45% and 73% percent respectively. 2.4.3 The economic benefits of investment at airports Consistent with the considerable commercially-focused investment activity that is currently occurring and planned at airports, there are also appreciable economic benefits to related industries. In particular, there are direct employment gains to the construction and manufacturing industries involved in developing airport infrastructure projects. In this way, the stream of infrastructure investments in the airport industry helps support growth across the broader construction sector. The benefits of infrastructure investments are more widespread as facilities become operational. Principally, the aeronautical capacity of airports can expand significantly once infrastructure investments are fully functional. As a consequence, further job opportunities are potentially created in the air transport sector and other industries operating on or near airport grounds (i.e. in commercial buildings developed by airport corporations). Over time, the increase in passenger throughput facilitated by new infrastructure contributes to higher revenues at airports, potentially generating job opportunities both at the airport precinct and indirectly through the chain of suppliers which service the airport industry. Indeed, the current turnover of the airport industry has been largely enabled by infrastructure investment decisions made in the past. Productivity and network efficiency Airports play a pivotal role in broader transport networks, facilitating the time-sensitive movement of people and goods. Therefore, investments in airport infrastructure can play an important role in improving the functioning of the overall transport system — especially at larger capital city airports which have greater intermodal interface. Additions to airport infrastructure, such as the development of large freight handling facilities, assist in building the capacity to not only process greater volumes of freight, but to do so with increased efficiency. 2.5 Innovation In addition to investing in infrastructure, the airports that responded to our survey indicated they were investing in a range of innovations and initiatives to support their community.
You can also read