Graphite - Professional Paper 1802-J - Chapter J of Critical Mineral Resources of the United States-Economic and Environmental Geology and ...
←
→
Page content transcription
If your browser does not render page correctly, please read the page content below
Graphite

Chapter J of
Critical Mineral Resources of the United States—Economic and
Environmental Geology and Prospects for Future Supply

Professional Paper 1802–J

U.S. Department of the Interior
U.S. Geological Survey
Periodic Table of Elements
1A 8A
1 2
hydrogen helium
1.008 2A 3A 4A 5A 6A 7A 4.003
3 4 5 6 7 8 9 10
lithium beryllium boron carbon nitrogen oxygen fluorine neon
6.94 9.012 10.81 12.01 14.01 16.00 19.00 20.18
11 12 13 14 15 16 17 18
sodium magnesium aluminum silicon phosphorus sulfur chlorine argon
22.99 24.31 3B 4B 5B 6B 7B 8B 11B 12B 26.98 28.09 30.97 32.06 35.45 39.95
19 20 21 22 23 24 25 26 27 28 29 30 31 32 33 34 35 36
potassium calcium scandium titanium vanadium chromium manganese iron cobalt nickel copper zinc gallium germanium arsenic selenium bromine krypton
39.10 40.08 44.96 47.88 50.94 52.00 54.94 55.85 58.93 58.69 63.55 65.39 69.72 72.64 74.92 78.96 79.90 83.79
37 38 39 40 41 42 43 44 45 46 47 48 49 50 51 52 53 54
rubidium strontium yttrium zirconium niobium molybdenum technetium ruthenium rhodium palladium silver cadmium indium tin antimony tellurium iodine xenon
85.47 87.62 88.91 91.22 92.91 95.96 (98) 101.1 102.9 106.4 107.9 112.4 114.8 118.7 121.8 127.6 126.9 131.3
55 56 72 73 74 75 76 77 78 79 80 81 82 83 84 85 86
cesium barium hafnium tantalum tungsten rhenium osmium iridium platinum gold mercury thallium lead bismuth polonium astatine radon
132.9 137.3 178.5 180.9 183.9 186.2 190.2 192.2 195.1 197.0 200.5 204.4 207.2 209.0 (209) (210) (222)
87 88 104 105 106 107 108 109 110 111 112 113 114 115 116 117 118
francium radium rutherfordium dubnium seaborgium bohrium hassium meitnerium darmstadtium roentgenium copernicium flerovium livermorium
(223) (226) (265) (268) (271) (270) (277) (276) (281) (280) (285) (284) (289) (288) (293) (294) (294)
57 58 59 60 61 62 63 64 65 66 67 68 69 70 71
Lanthanide Series*
lanthanum cerium praseodymium neodymium promethium samarium europium gadolinium terbium dysprosium holmium erbium thulium ytterbium lutetium
138.9 140.1 140.9 144.2 (145) 150.4 152.0 157.2 158.9 162.5 164.9 167.3 168.9 173.0 175.0
89 90 91 92 93 94 95 96 97 98 99 100 101 102 103
Actinide Series**
actinium thorium protactinium uranium neptunium plutonium americium curium berkelium californium einsteinium fermium mendelevium nobelium lawrencium
(227) 232 231 238 (237) (244) (243) (247) (247) (251) (252) (257) (258) (259) (262)
element names in blue are liquids at room temperature
element names in red are gases at room temperature
element names in black are solids at room temperature
Modified from Los Alamos National Laboratory Chemistry Division; available at http://periodic.lanl.gov/images/periodictable.pdf.
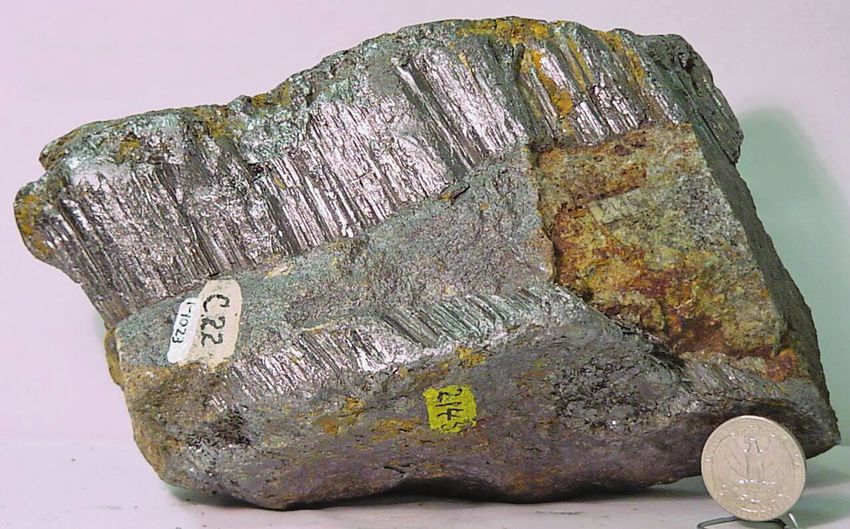
Cover. Graphite. U.S. quarter for scale. Mineral collection of Brigham Young University Department of Geology, Provo, Utah.
Photograph by Andrew Silver (BYU index 1-1023a).Graphite By Gilpin R. Robinson, Jr., Jane M. Hammarstrom, and Donald W. Olson Chapter J of Critical Mineral Resources of the United States—Economic and Environmental Geology and Prospects for Future Supply Edited by Klaus J. Schulz, John H. DeYoung, Jr., Robert R. Seal II, and Dwight C. Bradley Professional Paper 1802–J U.S. Department of the Interior U.S. Geological Survey
U.S. Department of the Interior RYAN K. ZINKE, Secretary U.S. Geological Survey William H. Werkheiser, Acting Director U.S. Geological Survey, Reston, Virginia: 2017 For more information on the USGS—the Federal source for science about the Earth, its natural and living resources, natural hazards, and the environment—visit https://www.usgs.gov or call 1–888–ASK–USGS. For an overview of USGS information products, including maps, imagery, and publications, visit https://store.usgs.gov/. Any use of trade, firm, or product names is for descriptive purposes only and does not imply endorsement by the U.S. Government. Although this information product, for the most part, is in the public domain, it also may contain copyrighted materials as noted in the text. Permission to reproduce copyrighted items must be secured from the copyright owner. Suggested citation: Robinson, G.R., Jr., Hammarstrom, J.M., and Olson, D.W., 2017, Graphite, chap. J of Schulz, K.J., DeYoung, J.H., Jr., Seal, R.R., II, and Bradley, D.C., eds., Critical mineral resources of the United States—Economic and environmental geology and prospects for future supply: U.S. Geological Survey Professional Paper 1802, p. J1–J24, https://doi.org/ 10.3133/pp1802J. ISSN 2330-7102 (online)
iii

Contents
Abstract......................................................................................................................................................... J1
Introduction.................................................................................................................................................. J1
     Commercial Classifications of Graphite.......................................................................................... J1
           Natural Graphite........................................................................................................................ J3
           Synthetic Graphite..................................................................................................................... J3
     Uses and Applications....................................................................................................................... J3
     Demand and Availability of Supply.................................................................................................. J4
           Graphite Prices and Pricing..................................................................................................... J4
           Substitutes for Natural Graphite............................................................................................. J4
           Strategic and Critical Resource Issues................................................................................. J5
Geology.......................................................................................................................................................... J5
     Geochemistry...................................................................................................................................... J5
     Mineralogy........................................................................................................................................... J5
     Deposit Types...................................................................................................................................... J6
           Amorphous Graphite Deposits................................................................................................ J6
           Deposits of Flake Graphite Disseminated in Metasedimentary Rocks............................. J7
           Vein Deposits Containing Lump or Chip Graphite............................................................... J15
Mining and Beneficiation Methods........................................................................................................ J16
Resources and Production....................................................................................................................... J16
     Distribution of Graphite Deposits and Districts........................................................................... J16
     World Graphite Production and Resources................................................................................. J17
Exploration for New Deposits.................................................................................................................. J19
Environmental Considerations................................................................................................................. J19
     Mine Waste Characteristics........................................................................................................... J19
     Human Health Concerns.................................................................................................................. J20
     Ecological Health Concerns............................................................................................................ J20
     Carbon Footprint............................................................................................................................... J21
     Regulatory and Environmental Considerations........................................................................... J21
Problems and Future Research............................................................................................................... J21
References Cited....................................................................................................................................... J22
iv
Figures
J1. Diagram showing the arrangement of carbon atoms in graphite...................................... J6
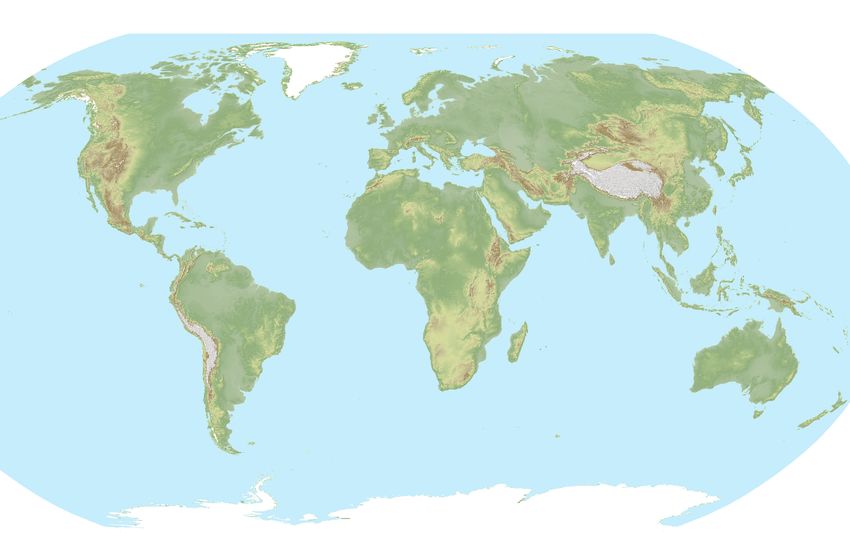
J2. World map showing locations of major graphite deposits and districts in the
world, by commodity type....................................................................................................... J14
J3. Plot of grade and tonnage for some of the amorphous and crystalline graphite
deposits listed in table J3, by deposit type........................................................................... J16
J4. Pie chart showing average annual natural graphite production for the period
2006–10, by country or region and amount........................................................................... J17
Tables
J1. Characteristics of graphite commodities, deposits, and uses, by commodity type........ J2
J2. Selected physical properties of graphite............................................................................... J3
J3. Location, grade, tonnage and other data for selected graphite deposits and
districts of the world.................................................................................................................. J8
J4. Estimates of world graphite resources, by country, commodity type, and
resource category, in thousand metric tons of recoverable graphite............................. J18v
Conversion Factors
International System of Units to Inch/Pound
Multiply By To obtain
Length
angstrom (Å) (0.1 nanometer) 0.003937 microinch
angstrom (Å) (0.1 nanometer) 0.000003937 mil
micrometer (µm) [or micron] 0.03937 mil
millimeter (mm) 0.03937 inch (in.)
centimeter (cm) 0.3937 inch (in.)
meter (m) 3.281 foot (ft)
meter (m) 1.094 yard (yd)
kilometer (km) 0.6214 mile (mi)
Area
hectare (ha) 2.471 acre
square kilometer (km2) 247.1 acre
square meter (m2) 10.76 square foot (ft2)
square centimeter (cm2) 0.1550 square inch (ft2)
square kilometer (km2) 0.3861 square mile (mi2)
Volume
milliliter (mL) 0.03381 ounce, fluid (fl. oz)
liter (L) 33.81402 ounce, fluid (fl. oz)
liter (L) 1.057 quart (qt)
liter (L) 0.2642 gallon (gal)
cubic meter (m3) 264.2 gallon (gal)
cubic centimeter (cm3) 0.06102 cubic inch (in3)
cubic meter (m3) 1.308 cubic yard (yd3)
cubic kilometer (km3) 0.2399 cubic mile (mi3)
Mass
microgram (μg) 0.00000003527 ounce, avoirdupois (oz)
milligram (mg) 0.00003527 ounce, avoirdupois (oz)
gram (g) 0.03527 ounce, avoirdupois (oz)
gram (g) 0.03215075 ounce, troy
kilogram (kg) 32.15075 ounce, troy
kilogram (kg) 2.205 pound avoirdupois (lb)
ton, metric (t) 1.102 ton, short [2,000 lb]
ton, metric (t) 0.9842 ton, long [2,240 lb]
Deposit grade
gram per metric ton (g/t) 0.0291667 ounce per short ton (2,000 lb) (oz/T)
Pressure
megapascal (MPa) 10 bar
gigapascal (GPa) 10,000 bar
Density
gram per cubic centimeter (g/cm3) 62.4220 pound per cubic foot (lb/ft3)
milligram per cubic meter (mg/m3) 0.00000006243 pound per cubic foot (lb/ft3)
Energy
joule (J) 0.0000002 kilowatthour (kWh)
joule (J) 6.241 × 10¹⁸ electronvolt (eV)
joule (J) 0.2388 calorie (cal)
kilojoule (kJ) 0.0002388 kilocalorie (kcal)vi
International System of Units to Inch/Pound—Continued
Multiply By To obtain
Radioactivity
becquerel (Bq) 0.00002703 microcurie (μCi)
kilobecquerel (kBq) 0.02703 microcurie (μCi)
Electrical resistivity
ohm meter (Ω-m) 39.37 ohm inch (Ω-in.)
ohm-centimeter (Ω-cm) 0.3937 ohm inch (Ω-in.)
Thermal conductivity
watt per centimeter per degree 693.1798 International British thermal unit
Celsius (watt/cm °C) inch per hour per square foot per
degree Fahrenheit (Btu in/h ft2 °F)
watt per meter kelvin (W/m-K) 6.9318 International British thermal unit
inch per hour per square foot per
degree Fahrenheit (Btu in/h ft2 °F)
Inch/Pound to International System of Units
Length
mil 25.4 micrometer (µm) [or micron]
inch (in.) 2.54 centimeter (cm)
inch (in.) 25.4 millimeter (mm)
foot (ft) 0.3048 meter (m)
mile (mi) 1.609 kilometer (km)
Volume
ounce, fluid (fl. oz) 29.57 milliliter (mL)
ounce, fluid (fl. oz) 0.02957 liter (L)
Mass
ounce, avoirdupois (oz) 28,350,000 microgram
ounce, avoirdupois (oz) 28,350 milligram
ounce, avoirdupois (oz) 28.35 gram (g)
ounce, troy 31.10 348 gram (g)
ounce, troy 0.03110348 kilogram (kg)
pound, avoirdupois (lb) 0.4536 kilogram (kg)
ton, short (2,000 lb) 0.9072 ton, metric (t)
ton, long (2,240 lb) 1.016 ton, metric (t)
Deposit grade
ounce per short ton (2,000 lb) (oz/T) 34.285714 gram per metric ton (g/t)
Energy
kilowatthour (kWh) 3,600,000 joule (J)
electronvolt (eV) 1.602 × 10⁻¹⁹ joule (J)
Radioactivity
microcurie (μCi) 37,000 becquerel (Bq)
microcurie (μCi) 37 kilobecquerel (kBq)
Temperature in degrees Celsius (°C) may be converted to degrees Fahrenheit (°F) as follows:
°F = (1.8 × °C) + 32
Temperature in degrees Celsius (°C) may be converted to kelvin (K) as follows:
K = °C + 273.15
Temperature in degrees Fahrenheit (°F) may be converted to degrees Celsius (°C) as follows:
°C = (°F – 32) / 1.8vii
Datum
Unless otherwise stated, vertical and horizontal coordinate information is referenced to the
World Geodetic System of 1984 (WGS 84). Altitude, as used in this report, refers to distance
above the vertical datum.
Supplemental Information
Specific conductance is given in microsiemens per centimeter at 25 degrees Celsius (µS/cm
at 25 °C).
Concentrations of chemical constituents in soils and (or) sediment are given in milligrams per
kilogram (mg/kg), parts per million (ppm), or parts per billion (ppb).
Concentrations of chemical constituents in water are given in milligrams per liter (mg/L),
micrograms per liter (µg/L), nanogams per liter (ng/L), nanomoles per kilogram (nmol/kg),
parts per million (ppm), parts per billion (ppb), or parts per trillion (ppt).
Concentrations of suspended particulates in water are given in micrograms per gram (µg/g),
milligrams per kilogram (mg/kg), or femtograms per gram (fg/g).
Concentrations of chemicals in air are given in units of the mass of the chemical (milligrams,
micrograms, nanograms, or picograms) per volume of air (cubic meter).
Activities for radioactive constituents in air are given in microcuries per milliliter (μCi/mL).
Deposit grades are commonly given in percent, grams per metric ton (g/t)—which is equivalent
to parts per million (ppm)—or troy ounces per short ton (oz/T).
Geologic ages are expressed in mega-annum (Ma, million years before present, or 106 years ago)
or giga-annum (Ga, billion years before present, or 10 9 years ago).
For ranges of years, “to” and (or) the en dash (“–”) mean “up to and including.”
Concentration unit Equals
milligram per kilogram (mg/kg) part per million
microgram per gram (µg/g) part per million
microgram per kilogram (μg/kg) part per billion (109)
Equivalencies
part per million (ppm): 1 ppm = 1,000 ppb = 1,000,000 ppt = 0.0001 percent
part per billion (ppb): 0.001 ppm = 1 ppb = 1,000 ppt = 0.0000001 percent
part per trillion (ppt): 0.000001 ppm = 0.001 ppb = 1 ppt = 0.0000000001 percent
Metric system prefixes
tera- (T-) 1012 1 trillion
giga- (G-) 109 1 billion
mega- (M-) 106 1 million
kilo- (k-) 103 1 thousand
hecto- (h-) 102 1 hundred
deka- (da-) 10 1 ten
deci- (d-) 10–1 1 tenth
centi- (c-) 10–2 1 hundredth
milli- (m-) 10–3 1 thousandth
micro- (µ-) 10–6 1 millionth
nano- (n-) 10–9 1 billionth
pico- (p-) 10–12 1 trillionth
femto- (f-) 10–15 1 quadrillionth
atto- (a-) 10–18 1 quintillionthviii
Abbreviations and Symbols
°C degree Celsius
μm micrometer
cm centimeter
g/cm3 gram per cubic centimeter
ISMI International Strategic Minerals Inventory
kg/cm2 kilogram per square centimeter
km kilometer
m meter
MRDS Mineral Resources Data System
NIOSH National Institute for Occupational Safety and Health
TWA time-weighted averageGraphite
By Gilpin R. Robinson, Jr., Jane M. Hammarstrom, and Donald W. Olson
Abstract graphite deposits in the United States are too small, low-grade,
or remote to be of commercial value in the near future, and
Graphite is a form of pure carbon that normally occurs the likelihood of discovering larger, higher-grade, or favorably
as black crystal flakes and masses. It has important properties, located domestic deposits is unlikely. The United States is a
such as chemical inertness, thermal stability, high electrical major producer of synthetic graphite.
conductivity, and lubricity (slipperiness) that make it suit-
able for many industrial applications, including electronics,
lubricants, metallurgy, and steelmaking. For some of these
uses, no suitable substitutes are available. Steelmaking and
Introduction
refractory applications in metallurgy use the largest amount
Graphite, which is a soft form of elemental carbon, is an
of produced graphite; however, emerging technology uses in
industrial mineral commodity that is produced only in small
large-scale fuel cell, battery, and lightweight high-strength
amounts globally—worldwide production of approximately
composite applications could substantially increase world
1 million metric tons of graphite concentrate was reported as
demand for graphite.
yearly production from 2010 to 2012 (Olson, 2012, 2013).
Graphite ores are classified as “amorphous” (micro-
The word graphite is derived from the Greek word for writing,
crystalline), and “crystalline” (“flake” or “lump or chip”)
graphein, which reflects the long use of graphite (mixed
based on the ore’s crystallinity, grain-size, and morphology.
with clay) for the “lead” in pencils. The unique physical and
All graphite deposits mined today formed from metamorphism
chemical properties of graphite, particularly coarse crystalline
of carbonaceous sedimentary rocks, and the ore type is
graphite, make it useful for many industrial applications, and
determined by the geologic setting. Thermally metamorphosed
for some of those uses, no suitable substitutes are available.
coal is the usual source of amorphous graphite. Disseminated
Although graphite is widely disseminated in many types of
crystalline flake graphite is mined from carbonaceous
metamorphic and some igneous rocks, most occurrences have
metamorphic rocks, and lump or chip graphite is mined from
no economic importance. The significant deposits of graphite
veins in high-grade metamorphic regions. Because graphite
are found in carbonaceous sedimentary rocks that have been
is chemically inert and nontoxic, the main environmental
subjected to regional or contact metamorphism and in veins
concerns associated with graphite mining are inhalation of
precipitated from fluids.
fine-grained dusts, including silicate and sulfide mineral
particles, and hydrocarbon vapors produced during the mining
and processing of ore. Synthetic graphite is manufactured from Commercial Classifications of Graphite
hydrocarbon sources using high-temperature heat treatment,
and it is more expensive to produce than natural graphite. Sources of commercial graphite include both natural
Production of natural graphite is dominated by China, graphite mined from rock and synthetic graphite manufac-
India, and Brazil, which export graphite worldwide. China tured from other carbonaceous materials. For commercial
provides approximately 67 percent of worldwide output of purposes, natural graphite is classified into the following
natural graphite, and, as the dominant exporter, has the ability three categories, according to its crystallinity, grain size, and
to set world prices. China has significant graphite reserves, morphology: amorphous, crystalline (flake), and crystalline
and China’s graphite production is expected to increase, (lump or chip). These commodity classes differ in the level
although rising labor costs and some mine production of purity of the graphite, the proposed industrial use, the
problems are developing. China is expected to continue to be price, and the geologic setting in which the graphite occurs
the dominant exporter for the near future. Mexico and Canada (table J1). Descriptions of (a) the graphite commodity classes
export graphite mainly to the United States, which has not had and their industrial uses, and (b) their associated deposit types,
domestic production of natural graphite since the 1950s. Most geologic settings, and producing deposit locations are givenJ2 Critical Mineral Resources of the United States — Graphite
Table J1. Characteristics of graphite commodities, deposits, and uses, by commodity type.
[Descriptions of graphite commodity classes and their industrial uses, commodity prices, and classes of associated deposit types and geologic settings are
summarized from information in Klar (1958), Weis (1973), Krauss and others (1988), Sutphin (1991a–c), Simandl and Kenan (1997a–c), Taylor (2006),
and Olson (2011, 2012, 2013). NA, not applicable; µm, micrometer; cm, centimeter; °C, degree Celsius; m, meter; $, U.S. dollar]
Commodity type
Characteristic
Amorphous Flake Lump or chip Synthetic
Deposit type Amorphous Disseminated flake Vein NA
Crystallinity Microcrystalline Crystalline Crystalline Microcrystalline to
crystalline
Properties Earthy to compact micro- Well-developed crystal Interlocking aggregates of Available in particle sizes
(crystallinity, crystalline aggregates; platelets, with grain size coarse crystals. Available from 2-μm powders to
form) grain size is < 4 μm between 40 μm and 4 cm as powders to 10-cm pieces 2-cm pieces
(but generally ≤ 1 cm),
and 1 to 150 μm thick
Origin Contact metamorphism, Regional metamorphism Epigenetic veins and lodes Produced by heat treat-
often by diabasic or of carbonaceous sedi- formed from metamorphic ment (graphitization)
granitic intrusions, and ments at or exceeding fluids in high-grade of, or chemical deposi-
(or) regional metamor- amphibolite facies metamorphic rocks, tion from, hydrocarbon
phism of carbonaceous conditions usually granulites materials above
sediments, often coal 2,100 °C
Orebody Layers, seams, and lenses Strata-bound; tabular or Vein and fracture-filling NA
in carbonaceous rock, lense form, as much as within or crosscutting
each a few meters thick 33 m thick and thou- metamorphic structures
and hundreds of meters sands of meters long. and rock contacts. Indi-
to several kilometers in Irregular in hinge areas vidual veins range from
length; may be folded of folds. The lenses 0.05 to 3 m thick, although
and faulted have variable graphite usually less than 0.3 m,
content internally and and extend up to hundreds
between lenses of meters, although rarely
more than tens of meters
Ore grade 50 to 90 (aggregates may Generally 5 to 30, 40 to 90 (may require NA
(percent carbon) contain nongraphitic locally higher hand sorting)
carbonaceous material)
Deposit tonnage 0.1 to 500 0.1 to 100 Small; no reliable data NA
(million metric tons) for individual veins
Mine operations Surface or underground Generally open pit surface Mines are typically small, NA
mines using mecha- mines. Graphite grades labor-intensive, and under-
nized and sometimes and ease of mining ground. Mines in Sri Lanka
hand methods enhanced by weather- are from 30 to 400 m deep.
ing destruction of Ore is hand sorted, washed,
gangue minerals and screened
Product grade 60 to 90 75 to 97 90 to 99.9 99.95
(percent graphite)
Main uses Refractories, steel Refractories, brake Carbon brushes, brake Batteries, carbon brushes,
industry, paint, coat- linings, lubricants, linings, and lubricants graphite electrodes,
ings, and batteries batteries, and nuclear moderator rods
expandable graphite (porosity unsuitable for
applications refractory applications)
Prices December 2011 prices December 2011 prices Prices in 2011 for Sri Lankan December 2011 prices
(per metric ton) (80 – 85 percent (90% graphite, lump and chip graphite (99.9 percent graphite)
graphite) ranged medium-large flake) (99% graphite) ranged ranged from $7,000 to
from $600 to $800 ranged from from $1,700 to $2,070. $20,000, which was
$1,150 to $2,000 Prices vary by purity, about 4 to 7 times that
grade, and size of flake graphite
Major producers China, Republic of Korea, China, Brazil, India, Sri Lanka China, Japan, United
and resources Mexico, Austria Madagascar, Germany, States, Germany
(in order of pro- Austria, Norway, (Roskill Information
duction level) Canada, Zimbabwe Services, Ltd., 2012)Introduction J3
by Klar (1958), Weis (1973), Krauss and others (1988), and Synthetic Graphite
Taylor (2006). Descriptive models of the geology and charac-
teristics of the deposit types that produce graphite are given by Most of the graphite used by industries in the
Sutphin and Bliss (1990), Sutphin (1991a–c), and Simandl and United States is synthetic. Synthetic graphite of high purity
Kenan (1997a–c). A summary of information from these and is produced by heat treatment (graphitization) of, or chemical
other sources follows. deposition from, hydrocarbon materials above 2,100 degrees
Celsius (°C). High-temperature processing is required to
transform the precursor carbon forms to a graphite structure
Natural Graphite and to vaporize impurities, which include hydrogen, metals,
nitrogen, organic compounds, and sulfur in the source materials.
Natural graphite is mined from deposits in metamorphic As a result of this treatment, synthetic graphite is more than
rocks, such as marble, schist, and gneiss, and from accumu 99.9 percent graphite, but it has slightly higher porosity, lower
lations in vein deposits. Natural graphite typically forms as a density, lower electrical conductivity, and a much higher price
result of metamorphism (regional or contact) of accumulations than natural flake graphite. Synthetic graphite is available in
of organic matter in sedimentary rocks. Commercial deposits particle sizes ranging from 2-μm powders to 2-cm pieces; the
of graphite occur in three types of geologic settings that morphology varies from flakey in fine powders to irregular
generally correspond to the following commodity classes grains and needles in coarser products.
(table J1):
a. “Amorphous graphite” is the commercial designation
for earthy to compact fine-grained graphite that Uses and Applications
generally results from thermal metamorphism of Graphite has physical and chemical properties of both
coal. Commercial deposits typically contain more metals and nonmetals, which make it ideally suited for many
than 1 million metric tons of ore that is more than industrial and technology applications. The metallic properties
75 percent carbon. Both the raw ore and the include high thermal and electrical conductivity (table J2).
commodity may contain nongraphitic carbonaceous The nonmetallic properties include inertness to most chemical
material in addition to graphite. reagents (strong acids, bases, solvents, and fluxes), high
thermal resistance, low thermal expansion, and excellent
b. “Flake graphite” is the commercial designation for
cleavage and lubricity (slipperiness). In a nonoxidizing
well-developed crystal platelets of graphite that are
atmosphere, graphite remains stable to temperatures above
between 40 micrometers (μm) and 4 centimeters (cm—
3,000 °C. Graphite has a hardness of 1 to 2 on the Mohs scale
but generally less than or equal to 1 cm) in size and
and is thus extremely soft.
that are disseminated in beds of carbonaceous sedi-
ments that have been subjected to amphibolite-facies Table J2. Selected physical properties of graphite.
or higher grade regional metamorphism. Commercial
deposits generally contain more than 200,000 metric [Modified from Krauss and others (1988). g/cm3, gram per cubic centimeter;
°C, degree Celsius; watt/cm °C, watt per centimeter per degree Celsius;
tons of ore that grade greater than 8 percent graphite. Ω-cm, ohm-centimeter]
Disseminated flake graphite deposits are located in
belts of crystalline metamorphic rock that are predomi- Property Description
nately Archean to late Proterozoic in age. Composition Carbon
Color Gray to black, metallic luster
c. “Lump or chip” is the commercial designation for
interlocking aggregates of coarse graphite crystals Hardness (Mohs scale) 0.5 to 1
that occur as veins or fracture-fillings in igneous and Density (g/cm3) 2.09 to 2.26
crystalline metamorphic rocks that commonly are Morphology Hexagonal system; perfect basal
of Precambrian age. The only commercial deposits cleavage; usually platy
occur in Sri Lanka where families of veins that Melting point About 3,550 °C in nonoxidizing
are up to 3 meters (m) thick and which consist of conditions; decomposes above
600 °C in oxidizing conditions
60 to 95 percent graphite are mined to depths of
30 to 650 m (Touzain and others, 2010). The ore Miscellaneous Chemically inert; nontoxic; high ther-
mal and electrical conductivity; high
may be hand sorted to provide a product grade that
lubricity (natural lubricant)
exceeds 90 percent. No reliable data on the tonnages
Thermal conductivity a axis: 4.0
of individual vein deposits are available, but most
(watt/cm °C) c axis: 0.8
of the deposits are small and likely do not exceed
Thermal expansion a axis: 1×10 –7
100,000 metric tons.
coefficient (1/ °C) c axis: 140×10 –7
Electrical resistivity a axis: 1 to 100
(Ω-cm×104) c axis: 10,000J4 Critical Mineral Resources of the United States — Graphite
Some of the major end uses of graphite are in brake Graphite Prices and Pricing
linings, refractories, and steelmaking. Batteries, brushes for
electrical motors, foundry materials, fuel cells, and high- Graphite is not traded on any commodity exchange.
temperature lubricants are additional end uses of graphite. Commodity prices are subject to negotiation between buyer and
Graphite forms intercalation compounds with alkali metal seller and depend on carbon content, flake size and distribution
vapors—usually potassium, lithium, rubidium, and cesium— (for crystalline flake), and the amount and nature of impurities.
where the metal ions fit between the planar carbon sheets of China is the dominant global natural graphite producer and
the graphite structure. These compounds have applications in has been the world price setter for decades. Four price series
the energy sector and other technologies. The industrial uses for graphite commodities based on production and value data
and associated commercial value of natural graphite depend reported by the U.S. Geological Survey (Olson, 2013) and
on the characteristics and crystallinity of the mined graphite Roskill Information Services, Ltd. (2012) are given in table J1.
(table J1). They are (a) microcrystalline (amorphous) graphite powder
Fine-grained microcrystalline graphite powder (amor- (from Mexico), which is currently in a long-term decline in
phous graphite) is used extensively in foundry and refractory importance because its low-technology end uses are becoming
applications, as a source of carbon in steelmaking, and in obsolete; (b) crystalline flake, which has become the most
other applications where additions of graphite improve important natural graphite commodity in the past few decades
the manufacturing process or end product. Coarse-grained and accounts for 80 to 90 percent of the value of U.S. imports
crystalline graphite in the form of separate lamellar crystals of natural graphite; (c) lump graphite from Sri Lanka, which
(flake graphite) has high value and is used in high-temperature is a specialty product because its relatively high price results
lubricants, high-quality foundry and refractory ware, powder in low demand, and (d) synthetic graphite, which is a specialty
metallurgy, coatings, and battery and fuel cell applications. product used primarily for applications that require high purity;
Crystalline flake graphite accounted for about 50 percent of its high price also limits demand. The price of microcrystalline
natural graphite usage in the United States in the past decade. (amorphous) graphite powder (80 to 85 percent carbon) ranged
Massive crystalline graphite from vein deposits (lump from $600 to $800 per metric ton in 2011; that of flake graphite
or chip graphite) has the highest purity and grain size of the (90 percent graphite) ranged from $1,150 to $2,000 per metric
natural graphite sold commercially. Because of its purity and ton; Sri Lankan lump and chip graphite (99 percent graphite),
crystallinity, many of the highest quality electrical motor from $1,700 to $2,070, depending on purity, grade, and
brushes and other current-carrying carbon products use particle size; and synthetic graphite (99.9 percent graphite),
formulations of graphite from vein deposits. from $7,000 to $20,000 per metric ton, which is about four
Synthetic graphite is used in many applications that to seven times that of flake graphite (table J1).
require high-purity graphite, including anticorrosion products, In 2010, graphite prices increased more rapidly for
batteries, carbon brushes, coatings, conductive fillers, elec- crystalline flake graphite than for amorphous graphite owing
trodes and electrolytic processes, fuel cell bipolar plates, and to increased demand for crystalline graphite used in friction
nuclear moderator rods. Synthetic graphite is unsuitable for material applications, such as brake linings, high-quality
foundry applications because of its increased porosity relative refractories, and lubricants, and in the manufacturing of
to natural graphite. Synthetic graphite is used in more applica- graphite foils and long-life alkaline batteries (Industrial
tions in North America than natural graphite and accounts for Minerals, 2010).
a significant share of the graphite market.
Substitutes for Natural Graphite
Demand and Availability of Supply The most common substitutes for natural graphite are
other forms of carbon. Manufactured synthetic graphite
No natural graphite was reported to have been mined powders and graphite recovered from discarded foundry and
in the United States in 2010 (Olson, 2012), and the major manufactured materials can substitute for natural graphite
domestic sources of industrial graphite included imports in some applications, depending on the relative price. In
of natural graphite, mostly from China, Mexico, Canada, steelmaking and some foundry applications, petroleum
Brazil, and Madagascar (in order of tonnage of imports), coke, anthracite, and synthetic graphite can be used instead
and synthetic graphite manufactured from carbonaceous of natural graphite. Synthetic graphite and natural graphite
materials. In 2010, 65,400 metric tons of natural graphite powder are commonly substituted for each other, or mixtures
valued at an estimated $52 million was reported to have been containing both kinds are prepared for customers (Taylor,
imported into the United States for domestic consumption 2006). Crystalline graphite is recovered from some foundry
and 134,000 metric tons of synthetic graphite valued at an and refractory materials, although its recovery cost makes it
estimated $1.07 billion was reported to have been produced noncompetitive relative to natural graphite for some applica-
in the United States (Olson, 2012). tions (Weis, 1973; Olson, 2013).Geology J5
Strategic and Critical Resource Issues Geology
Graphite is considered a critical and strategic mineral Geochemistry
because of its essential applications in the aerospace and
energy sectors (such as refractory and foundry applications Carbon is the fourth most abundant element in the
in the steel and metal industries and use in high-temperature solar system, and in terms of its abundance in Earth’s
lubricants, high-strength lightweight composite materials, crust, is ranked about 12th to 17th in abundance, with an
batteries, modern nuclear reactors, fuel cells, electric motors, estimated crustal concentration between 180 and 270 parts
and evolving electronic applications that anticipate rapid per million. The abundance of carbon in Earth’s crust is
growth in demand for graphite). The high concentration difficult to determine because carbon stores exist and cycle
of resource supply from few countries could increase the between rock, sediment, atmosphere, biosphere, and ocean
commodity’s susceptibility to market manipulation or reservoirs. The behavior of carbon in its geochemical cycle is
disruption (Krauss and others, 1988; Taylor, 2006; European influenced by the form in which the carbon occurs. Most of
Commission, 2014). The United States has not produced the carbon in Earth’s crust (approximately 80 to 90 percent)
natural graphite since the 1950s; China, Mexico, and Canada, is contained in carbonate minerals in carbonate rocks. Most
in order of import supply, are the dominant sources of graphite of the remaining carbon in the Earth system occurs in living
imports to the United States (Olson, 2013). China has very low and fossil organic matter and as carbon dioxide (CO2 ) in the
labor and production costs, and, with aggressive marketing, atmosphere or dissolved in the ocean. These remaining carbon
it established dominance in the world market in the 1980s forms dominate the carbon cycle. Graphite makes up only a
(Taylor, 2006; Olson, 2013). China’s graphite production small proportion of the carbon in Earth’s crust, probably less
is expected to increase and remain dominant in the world than 0.5 percent, and much of this graphite likely formed
graphite market for the near future (Olson, 2013). China’s by high-temperature thermal alteration of organic matter
rapidly growing domestic market for graphite may restrict from biogenic sources deposited in sedimentary rocks and
future exports, however, which has raised concerns about subsurface reservoirs. The mineral graphite is stable and inert
possible supply shortages of graphite, particularly crystalline in the crustal environment and is unchanged under surface
flake graphite, needed for anticipated large-scale fuel cell weathering conditions. Burial and thermal metamorphism
and battery applications; such applications could dramati- tends only to recrystallize graphite. Therefore, graphite is
cally increase world demand for graphite (Taylor, 2006; largely isolated from the overall carbon cycle.
Olson, 2013; Olson and others, 2016).
Graphite has played an important role in the emerging
noncarbon energy sector and is used in several new energy Mineralogy
applications. In energy production applications, graphite is
used in pebbles for modular nuclear reactors and in high- Graphite is one of four forms of crystalline elemental
strength composites for wind, tide, and wave turbines. In carbon; the others are carbon nanotubes, diamond, and
energy storage applications, graphite is used in bipolar plates fullerenes. Graphite crystallizes in the hexagonal system, with
for fuel cells and flow batteries, in anodes for lithium-ion rhombohedral symmetry, commonly forming six-sided tabular
batteries, in electrodes for supercapacitors, in high-strength crystal flakes. It occurs naturally in metamorphic rocks and
composites for fly wheels, in phase change heat storage, in some igneous rocks. Well-crystallized graphite flakes have
and in solar boilers. In energy management applications, a black metallic luster, whereas microcrystalline material is
graphite is used in high-performance thermal insulation and in black and earthy with an amorphous appearance.
silicon chip heat-dissipation applications. These new energy The crystal structure of graphite consists of carbon
applications commonly use specialty graphite products with atoms tightly arranged in parallel-stacked (c axis, fig. J1),
such properties as extreme purity (> 99.9 percent graphite), planar honeycomb-lattice sheets (a axis, fig. J1). When the
very large or small (nano) particle size, and perfect crystal- graphite structure is only a 1-atom-thick planar sheet, it is
linity. Current graphite capacity may not be adequate for the called graphene.
increasing demands of these new energy applications, which, The physical properties of graphite are listed in table J2.
when fully implemented, may require double the current Many properties listed in table J2 vary by crystallographic
graphite supply, especially of high-purity crystalline flake orientation (a-axis and c-axis values, table J2) because of
graphite (O’Driscoll, 2010; Olson and others, 2016). differences in bonding within (a axis, fig. J1) and between
lattice sheets (c axis, fig. J1). The intraplanar (a axis) covalent
bonding in graphite sheets is strong, but the electrostatic
interlayer (c axis) forces holding the sheets together are
weak, resulting in delocalized electrons that are free to move
between sheets, which separates the sheets and allows them toJ6 Critical Mineral Resources of the United States — Graphite
Figure J1. Diagram showing the
A
arrangement of carbon atoms in graphite,
which consists of stacks of parallel sheets
of carbon atoms (red circles in the figure),
c-axis
with each sheet containing hexagonal arrays
xis
of carbon atoms. Each carbon atom within a-a
a sheet is connected to its three nearest 3.354 Å
Unit cell
neighbors by covalent bonds that separate 1.415 Å
the atoms by a distance of 1.415 angstroms B
(Å) —an angstrom is one ten-billionth of a
meter. The stacked sheets (shown here in
their A and B orientation) are held together
by weak intermolecular van der Waals’
forces and are separated from each other
by a distance of 3.354 Å. The arrangement of
atoms defined by the dashed lines portrays A
one hexagonal (2H) unit cell of graphite.
Modified from Kraus and others, 1989.
slide across one another easily. This gives graphite a density of a deposit depend on its location and transportation costs to
2.09 to 2.26 grams per cubic centimeter (g/cm 3), perfect basal markets in addition to deposit grade, size, and mining charac-
(one-plane) cleavage, softness (0.5 to 1 on the Mohs scale), a teristics. Impurities in the deposit, such as silica, sulfides, or
greasy feel, and self-lubricating properties that make it useful biotite, may limit the economic potential of a deposit.
as a lubricant. The ratio of force required to induce gliding of
graphite sheets relative to compression force is low, resulting Amorphous Graphite Deposits
in high lubricity. These delocalized interlayer electrons also
give graphite its high electrical and thermal conductivity. Amorphous graphite deposits, which are formed by
Graphite is the most electrically and thermally conductive of thermal metamorphism of coal, petroleum pools, or other
the nonmetallic elements (a-axis values, table J2); however, highly carbonaceous sedimentary rocks, contain earthy to
Graphite,
compactfig 1masses of microcrystalline graphite. Deposits may
the intraplanar covalent bonds are very strong and require high
energy to break them. These bonding properties make graphite consist of multiple layers, seams, and lenses containing
chemically inert and physically stable at high temperatures 50 to 90 percent carbon; each deposit is a few meters thick
(refractory). Graphite resists chemical attack by most reagents and up to a kilometer in length and lies within clastic meta-
and is infusible in most common fluxes. Thermal oxidation of sedimentary rocks. The carbon content of amorphous deposits
graphite in the presence of oxygen begins at about 300 °C, and is dependent on the amount of carbon present in the original
the rate increases with temperature; however, it is stable in a sediments, and the grade, tonnage, and purity of the deposit
nonoxidizing atmosphere to above 3,000 °C. Graphite sublimes depend upon the characteristics of the precursor coal sequence
between 3,300 °C and 3,500 °C at 1.033 kilograms per square or carbonaceous material. Deposits in metamorphosed
centimeter (kg/cm ) and it melts at approximately 3,550 °C
2 massive coal seams may contain as much as 90 percent
at a triple point under a pressure of 88 kg/cm . Graphite is
2 graphitic carbon, whereas deposits in other carbonaceous
flexible but not elastic. All these properties combined make sediments or impure coal sequences commonly range from
graphite desirable for many industrial applications. 25 to 60 percent carbon.
Chemical and isotopic biomarkers found in natural
graphite provide evidence of its origin from ancient biological
Deposit Types material. Amorphous graphite deposits occur in geologic
settings and environments where coal and other organic-
Natural graphite is a common constituent of meta rich sedimentary rocks, such as oil shale, occur, including
sedimentary rocks and is mined in three geologic settings: (a) shoreline, fluvial-deltaic, and alluvial fan depositional
(a) microcrystalline (amorphous) graphite deposits formed by environments in passive continental margin settings, and
metamorphism of coal, petroleum, or carbon-rich sediments, (b) lacustrine and shallow inland seas and margins in foreland,
(b) disseminated flakes in metamorphic rock (flake graphite), continental, sag, or intracontinental rift basin settings. Host
and (c) graphite vein deposits (lump or chip graphite). Similar rocks include conglomerate, metagraywacke, quartzite, and
to most industrial mineral commodities, the economics of schist. The thermal metamorphism is commonly caused byGeology J7
crosscutting diabasic or granitic intrusions with associated be deposited directly on existing basement rocks of the crust
hornfels alteration of host rocks. Hornfels is a hard meta and are termed supracrustal rocks.
morphic rock formed by contact metamorphism of sedimen- The metamorphic conditions sufficient to form these
tary rocks close to intrusive igneous bodies. deposits occur in the roots of continental mountain belts
Graphite does not form until temperatures exceed 300 °C formed by deformation of Earth’s crust, and significant post-
to 400 °C (Landis, 1971). The degree of metamorphism metamorphic uplift and erosion are required to expose deposits
controls the degree of graphitization, and the ratio of graphite in minable settings. Alumina-rich paragneiss, quartzites, and
to nongraphitic carbon varies, but typically increases towards marbles at or near the highest grade of regional metamorphism
the heat source. Mineral impurities include meta-anthracite, at medium pressure (granulite facies) are favorable host rocks
anthracite, quartz, mica, pyrite, and other sulfides. Most for flake graphite deposits because of their granular texture,
currently mined deposits typically contain at least 80 percent coarse grain size, and low mica content. Supracrustal meta-
carbon in deposits exceeding 1 million metric tons. sedimentary belts with these metamorphic features are termed
The world’s main sources of amorphous graphite are the crystalline metamorphic basement; their worldwide distribu-
metamorphosed coal deposits in Sonora, Mexico; Siberia, tion has been mapped by Chorlton (2007). Most flake graphite
Russia; and the large coal province stretching from China deposits are located in Precambrian crystalline metamorphic
into the Korean peninsula (table J3). The deposits in Sonora, basement (fig. J2), principally of Neoarchean to Proterozoic
Mexico, are the most significant deposits of amorphous eras; however, deposits could occur in crystalline basement of
graphite in the Western Hemisphere. They occur in a series of any age. Precambrian supracrustal metamorphic belts appear
beds in an area 30 kilometers (km) long by 15 km wide located to be more extensive, and metamorphosed to higher grades,
60 km southeast of Hermosillo. In the district, the orebodies than Phanerozoic belts (Chacko and others, 1987).
average 3 m in thickness, but deformation can produce seams The principal flake graphite deposits occur as strata-
up to 7 m wide. Grades exceed 75 percent contained graphite bound lenses or layers; individual lenses in deposits are as
and some contain as much as 95 percent. The Moradillas much as tens of meters thick and hundreds of meters long.
deposit (Lourdes area, Mexico) has been reinterpreted as The lenses have variable graphite content, both within
formed from a graphitized hydrocarbon protolith owing to its themselves and from one lens to another. The graphite content
vein-like structure and lack of evidence that it is metamor- of a typical deposit varies from about 8 to 15 percent carbon,
phosed coal (Taylor, 2006). In the United States, small amor- but the grade can vary from as low as 3 percent to about
phous graphite deposits occur in metamorphosed coal deposits 60 percent carbon locally in individual deposits and between
in the Narragansett Basin, Rhode Island, and in deposits in deposits. In Madagascar, one rich lens was reported to contain
northern Michigan. An additional U.S. example occurs at 60 percent graphite, and grades in the Kigluaik Mountains
Raton, New Mexico, where a basalt dike intersects a coal seam. graphite district, Alaska, exceed 50 percent graphite in some
areas (Coats, 1944). In paragneiss-hosted deposits, gangue
(non-ore) minerals include in order of general abundance,
Deposits of Flake Graphite Disseminated in feldspar, biotite, pyroxene, garnet, and sulfide minerals.
Metasedimentary Rocks Gangue minerals in carbonate-hosted deposits include calcite,
pyroxene, feldspar, garnet, and sulfides. Flake graphite
A large proportion of worldwide graphite production is in crushed ore is separated from mineral impurities using
derived from deposits of disseminated flake graphite found washing, screening, flotation, and, sometimes, leach methods.
in metamorphic rocks, such as paragneiss (a gneiss derived The highest graphite grades commonly are associated
from sedimentary rock), quartzite, and, sometimes, marble. with rock contacts between marble and paragneiss or quartzite,
These deposits formed when preexisting carbonaceous matter lenses in fault zones, in segregations within fold crests, and
in the host sedimentary rock was converted to graphite in structures that acted as channels for metamorphic fluids, all
during regional metamorphic conditions at or exceeding suggesting structural control of mineralization. Although most
medium-pressure and medium-to-high-temperature condi- carbon in these deposits is thought to be present in the original
tions (amphibolite facies). These metamorphic conditions sedimentary rocks, some carbon enrichment may be caused by
are sufficient to crystallize fully ordered graphite (Hoefs and processes involving internal or external buffering or mixing of
Frey, 1976) and recrystallize the rock matrix. The precursor metamorphic fluids (Lamb and Valley, 1984; Newton, 1986).
host rocks of these deposits are interpreted as occurring in Crystals in each deposit vary from a fraction of a milli-
depositional settings where organic-rich sediments accumulate meter to a few centimeters in size, usually reflecting the grain
and are preserved. These settings include sediment-starved size in the parent rock. Most currently mined flake graphite
intracratonic and continental margin basins with low-oxygen deposits typically contain at least 8 to 12 percent graphitic
conditions at depth to accumulate organic sediments, and carbon in deposits exceeding 0.5 million metric tons. Graphite
periods of transgression (compare with, for example, Wilde is stable in the weathering environment; deposit grades and
and others, 1999), when sea level rises relative to land, ease of mining are enhanced by weathering destruction of
preserving organic-rich sediments without erosion. The other minerals. Some deposits become so weathered that they
sedimentary rocks that are deposited during transgression may can be mined with shovels and other hand tools.J8 Critical Mineral Resources of the United States — Graphite
Table J3. Location, grade, tonnage and other data for selected graphite deposits and districts of the world.—Continued
[The names, locations, and descriptions of most of the deposits are taken from the International Strategic Minerals Inventory (ISMI) graphite inventory
(Krauss and others, 1988) and the U.S. Geological Survey Mineral Resources Data System (MRDS; U.S. Geological Survey, 2012). Identification number is
keyed to the deposits shown in figure J2. Negative values for latitude indicate that the deposit is in the Southern Hemisphere; negative values for longitude
indicate that the deposit is in the Western Hemisphere. Record types are from the MRDS. Ore type is characterized as amorphous, crystalline, flake, or lump
(includes chip), as defined in table J1. “Weathering” indicates surface ores that have been deeply weathered, which lowers mining costs. Development status
of the deposit is given as follows: Current, current or recent mine activity; Past, past producer with no current mining; Prospect, an unmined deposit with
characterized resources; Occurrence, an unmined deposit with uncharacterized resources. Tonnage of ore has been updated from the values in the MRDS and
is given in metric tons or, alternatively, is categorized as large (likely exceeds 1 million metric tons but is not well characterized) or small (likely is less than
100,000 metric tons). %, percent; —, unknown; WGS 84, World Geodetic System of 1984]
Identification Latitude Longitude
Name Country State/Province
number Decimal degrees WGS 84
1 Quebrada Del Gato Argentina San Juan –31.43 –68.13
2 Undercliff Australia New South Wales –28.66 152.21
3 Jack’s Creek Australia Queensland –20.67 147.87
4 Koppio-Uley mines Australia South Australia –34.80 135.71
5 Munglinup River Australia Western Australia –33.50 120.85
6 Doppl-Muehldorf-Zettlitz Austria Niederosterreich 48.38 15.45
7 Kaisersberg-Trieben Austria Steiermark 47.35 15.07
8 Itanhem Brazil Bahia –17.10 –40.35
9 Itapacerica Brazil Minas Gerais –20.43 –45.13
10 Pedra Azul Brazil Minas Gerais –15.88 –45.13
11 Bisset Creek Canada Ontario 46.23 –78.07
12 Coronation Canada Ontario 45.29 –77.94
13 Graphite Lake-Ryerson-Todd area Canada Ontario 45.73 –79.08
14 Kirkham-Portland-Timmins area Canada Ontario 44.56 –76.57
15 Tagliamonte Canada Ontario 46.23 –78.07
16 Graphex-Graphico-Orwell Mines Canada Quebec 46.14 –75.55
17 North American Mine Canada Quebec 45.52 –75.55
18 St-Amime-Lac Des Iles Canada Quebec 46.25 –75.53
19 Lac Knife Canada Quebec 52.55 –61.18
20 Pollon Lake area Canada Saskatchewan 56.38 –103.13
21 Haikou China Hainan 20.08 110.42
22 Heling China Heilongjiang 46.31 129.55
[Heilungkiang]
23 Jixi (Liu Mao) China Heilongjiang 45.28 131.00
[Heilungkiang]
24 Liu Mao China Heilongjiang 45.30 131.07
[Heilungkiang]
25 Honan deposits China Henan [Honan] 32.50 113.88
26 Hunan China Hunan 26.00 113.00
27 Panshi China Jilin [Kirin] 42.93 125.97
28 Hohot China Nei Mongol 40.81 111.62
(Inner Mongolia)
29 Shandong Peninsula China Shandong [Shantung] 37.03 120.32
30 Xing He China — 40.88 113.88
31 Kolledeye Czech Republic — 49.22 14.45
32 Velke Vbrno-Konstantin Vvk Czech Republic — 50.13 17.33
33 Kropfmühl-Cesky Krumlov Germany and Bayern [Bavaria, 48.80 14.32
Czech Republic Germany]Geology J9
Table J3. Location, grade, tonnage and other data for selected graphite deposits and districts of the world.—Continued
[The names, locations, and descriptions of most of the deposits are taken from the International Strategic Minerals Inventory (ISMI) graphite inventory
(Krauss and others, 1988) and the U.S. Geological Survey Mineral Resources Data System (MRDS; U.S. Geological Survey, 2012). Identification number is
keyed to the deposits shown in figure J2. Negative values for latitude indicate that the deposit is in the Southern Hemisphere; negative values for longitude
indicate that the deposit is in the Western Hemisphere. Record types are from the MRDS. Ore type is characterized as amorphous, crystalline, flake, or lump
(includes chip), as defined in table J1. “Weathering” indicates surface ores that have been deeply weathered, which lowers mining costs. Development status
of the deposit is given as follows: Current, current or recent mine activity; Past, past producer with no current mining; Prospect, an unmined deposit with
characterized resources; Occurrence, an unmined deposit with uncharacterized resources. Tonnage of ore has been updated from the values in the MRDS and
is given in metric tons or, alternatively, is categorized as large (likely exceeds 1 million metric tons but is not well characterized) or small (likely is less than
100,000 metric tons). %, percent; —, unknown; WGS 84, World Geodetic System of 1984]
Identification Record Development Grade
Ore type Operation Tonnage
number type status (% of carbon)
1 District Crystalline (flake Unknown Producer — —
or lump?)
2 Site Amorphous Surface Past producer 793 32
3 Site Amorphous Surface,underground Past producer 2,200 61
4 District Flake, weathering Surface,underground Past producer 35,030 15
5 District Flake Surface,underground Past producer 30,000 25
6 District Flake Surface Producer 1,000,000 10
7 District Amorphous Underground Producer 1,000,000 85
8 Site Lump Surface Producer 2,778 40
9 Site Flake, weathering Surface Producer 383,000 15.7
10 Site Flake, weathering Surface Producer 26,800,000 11.9
11 Site Flake Surface Prospect 4,938,000 15.58
12 Site Flake Unknown Occurrence — —
13 District Flake Surface Producer Large —
14 District Flake Surface Producer 478,000 9
15 Site Flake Surface Prospect — —
16 District Flake Surface Producer 2,200,000 10
17 Site Flake Unknown Past producer — —
18 Site Flake Surface Producer — —
19 Site Flake Surface Prospect 4,900,000 15.8
20 District Flake Unknown Past producer 1,663,000 10.3
21 Site Flake Surface Producer 5,000,000 3.7
22 Site Amorphous Unknown Producer — —
23 Site Amorphous Surface Past producer 300,000,000 85
24 Site Flake Unknown Producer 3,000,000 18.5
25 District Unknown Unknown Producer — —
26 District Amorphous Underground Producer — —
27 Site Amorphous Underground Producer — —
28 District Crystalline (flake Surface Producer — —
or lump?)
29 District Flake Surface Producer 5,900,000 5
30 Site Flake Unknown Producer — —
31 District Flake Surface,underground Prospect — —
32 Site Amorphous Surface Producer 200,000 50
33 District Flake Underground Producer — 16You can also read