Traffic Speed Task Group - Corporate Infrastructure and Regulatory Services Scrutiny Committee - Democracy in Devon
←
→
Page content transcription
If your browser does not render page correctly, please read the page content below
Corporate Infrastructure and Regulatory
     Services Scrutiny Committee

      Traffic Speed
       Task Group

                             June 2019

                                          0
Contents
Section                                                             Page
   1       Recommendations                                            2
   2       Introduction                                               4
   3       National Speed Policy Context                              5
           Environmentally friendly vehicle Policy                    6
   4       Why do Drivers Speed?                                      7
   5       Local Policy and Safety Context                            8
           The SCARF Process                                          9
   6       20mph Speed Limits                                         11
           Findings from the Atkins report                            12
           20’s plenty for us                                         13
   7       Re-envisaging Traffic Speeds and Living Streets            16
           Safe Systems and Healthy Streets Approach                  21
           Nudging Speed Down                                         22
   8       Enforcement                                                26
           Community Speed Watch                                      28
           Speed Limiting Technology                                  29
   9       Conclusion                                                 30
   10      Sources of Evidence                                        31
           Witnesses                                                  31
           Bibliography                                               33
   11      Membership                                                 35
   12      Contact                                                    35
           Appendix I: Glossary of Terms                              36
           Appendix II: Torbay Matrix for consideration of 20 mph     37
           Appendix III: Collision and KSI Data for Devon             39

                                                                           1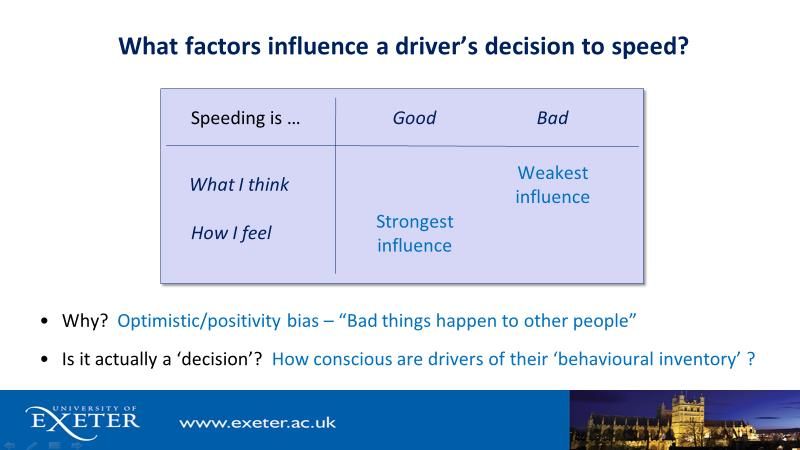
1. Recommendations
The Task Group ask the Corporate Infrastructure and Regulatory Services Scrutiny Committee, Devon
County Council Cabinet and the Police to endorse and take action on the report and recommendations
below; with a report on progress against the recommendations in nine months’ time.

 Ambition            Recommendation                                                     Agency    Timefra
                                                                                                  me

 1. Taking a        1.1 Review and refocus the Road Safety Strategy and current         DCC       Within 6
    different           Speed Limits Policy to reflect;                                           months
    approach to
    our policy of       a) The wider consideration of health, sustainable travel
    setting traffic         and whole environmental impacts of speed
    speeds and              management;
    embedding           b) Adoption of the safe systems approach;
    the safe            c) Inspirations from the TfL Healthy Streets Strategy;
    systems             d) DfT 2013 Speed Limit Policy recommendations
    approach            e) Public consultation on substantial changes.

                     1.2 All new residential developments (over 50 houses) to be        DCC       From
                         designed as 20mph from 2019 onwards.                                     now

                     1.3 Trial a default residential 20 mph limit in Newton Abbot       DCC
                         and Kingkerswell.

 2. Supporting       2.1 Review the SCARF process to reflect changes made to the DCC              Within 6
    local areas to       Road Safety Strategy and Speed Limits Policy, ensuring                   months
    determine            local communities have a meaningful and transparent
    their own            say on proposed local schemes, using a matrix similar to
    environment          that used in Torbay. (Appendix 2)

                     2.2 Develop a local toolkit that Communities and Town and          DCC       9
                         Parishes can use to create Healthy Streets supporting a        Highway   months
                         hyper local approach to communication on lower speeds          s and
                         as well as practical steps that can be taken in local areas.   Comms
                         This should be supported where possible with practical
                         support and training.

 3. Enforcement      3.1 DCC to be more open to innovative trials, including            DCC       From
    of existing          associated monitoring, where safe to do so and funding                   now
    limits               can be secured.

                     3.2 A named County Councillor to sit on the Speed Watch            Police/   From
                         Community development group to lead on the planning            PCC       now
                         and development of Speed Watch across Devon.

                                                                                                             2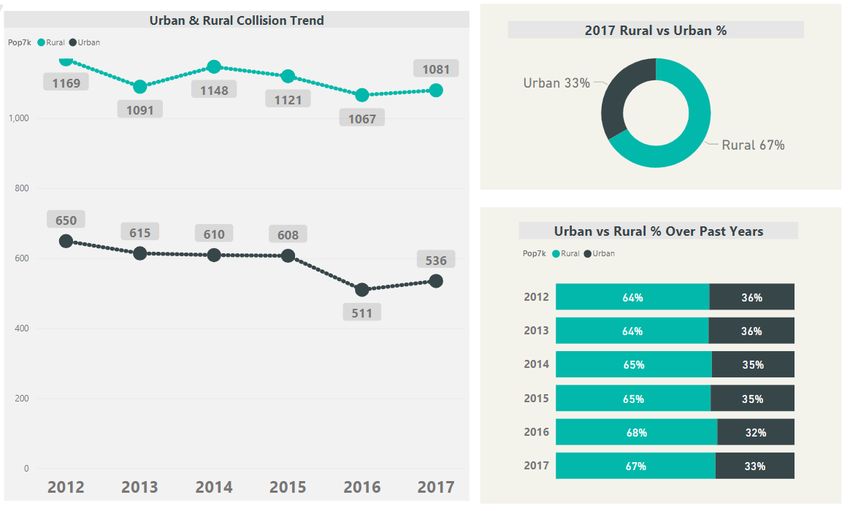
Ambition        Recommendation                                                    Agency     Timefra
                                                                                             me

                3.3 Improving the approach and processes around                   Police/P   From
                    Community Speed Watch to include;                             CC/lead    now
                                                                                  Councill
                    a) Clear lines of communication with County and Parish
                                                                                  or once
                       Councillors as well as local police
                                                                                  appoint
                    b) Resolution of the blockages in accessing equipment         ed
                    c) Better access to training for volunteers
                    d) Publicity of other opportunities for people in Devon
                       to volunteer to support local police work including
                       Speed Watch.
                    e) Consideration of a shared database to share and
                       publicise speed offences – e.g. as used in Kent and
                       Sussex.
                To ultimately increase the number of communities involved
                in the Speed Watch programme.

4. Leading by   4.1 Sign up to the ‘Driving for Better Business’ initiative and   DCC        From
   example          promote across Devon.                                                    now

                4.2 The ‘doing what matters’ team to take forward the             DCC        Nine
                    recommendations and report with leaders to ensure                        months
                    maximum impact.
                4.3 Write to all Devon MPs to encourage Government to             DCC        On
                    push for greater use of Intelligent Speed Adaptation for                 conclusi
                    works vehicles eg. Buses, taxis etc.                                     on of
                                                                                             review

                                                                                                        3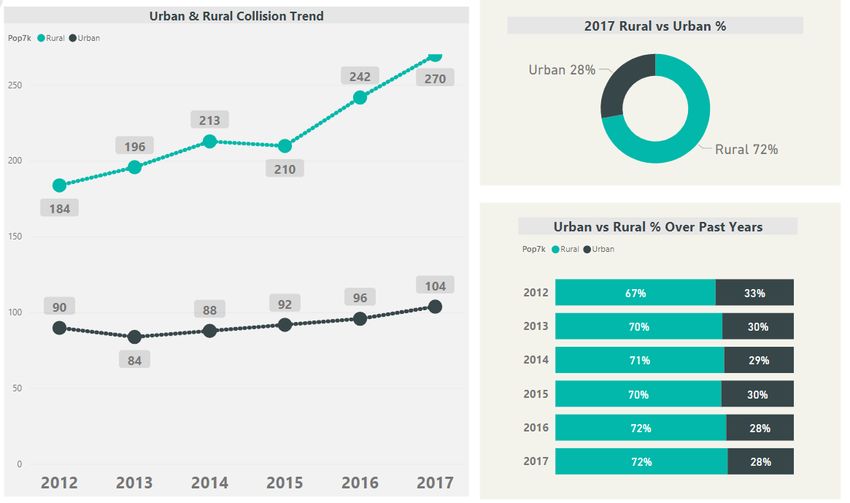
2. Introduction
2.1 Speed, speeding and road safety have been consistent themes throughout the evolution of the scrutiny
    process at Devon County Council. The first task group concerned with speed was established by the
    Place Scrutiny Committee in 2008. Recommendations included taking a consistent and clear approach
    to the implementation of all speed limits and speed management across Devon be maintained and
    publicised, that representation be made to the government to change the guidance governing 20mph
    limits, and that 20 mph speed restrictions be pursued in the vicinity of Devon Schools. However, Cabinet
    resolved that 20 mph speed limits should only be introduced with reference to school’s individual
    circumstances.1
2.2 During the Place Scrutiny Committee meeting on 11 September 2015, Members requested that the
    Committee consider reviewing DCC’s speed limit policy. There were concerns that the recent South
    Devon Link Road speed limit proposals risked compromising current DCC policy on speed limits. There
    were also concerns surrounding the implementation of the policy where some roads with 30mph limits
    had given way to unrestricted national speed limits.2
2.3 The Corporate Infrastructure and Regulatory Services Scrutiny Committee (CIRS) agreed on 12 June
    2018 that a Task Group be set up to review DCC’s existing speed limit policy. The terms of reference for
    the review were:
          ➢ to review DCC’s existing speed limit policy;
          ➢ to explore the ways in which vehicle speeds can be managed in conjunction with enforcement
            and education, for the benefit of people’s health;
          ➢ to consider how DCC could further involve local communities in decisions surrounding speed
            limits and to examine the approach of other local authorities to this; and
          ➢ to understand how DCC’s policy relates to anticipated government guidance.
2.4 Since its inception, the task group has met ten times and taken evidence from twenty-six witnesses,
    named at the end of this report. The task group also carried out a survey and then a focus group/round
    table discussion with Town and Parish Councils across Devon.
2.5 The Task Group has approached the issue of speed with a broader approach; viewing the community,
    road safety and appearance of vehicle speeds as having a significant impact upon community
    environment and human health. The recommendations and the conclusion in the report are designed to
    prompt policy makers to think differently about speed and move beyond a reductive intervention based
    only upon injury or death.
2.6 The Task Group has understood the difference between setting the speed limit on a road at the right
    level and then also ensuring that drivers comply with the speed limit. In some Communities even when
    traffic is travelling at the legal limit it can still feel too fast and deter healthy lifestyle choices.
    Technology is being developed that will limit speeds on vehicles, however this will only be useful in
    conjunction with the right speed limit. The task group would like to see communities playing a bigger
    part in setting and supporting healthy movements of traffic.

1
  Environment, Economy and Culture Overview and Scrutiny Committee 9/9/08, Minutes,
https://democracy.devon.gov.uk/CeListDocuments.aspx?CommitteeId=135&MeetingId=1464&DF=09%2f09%2f2008&Ver=2 (accessed, 05/06/2019)
2
  Devon County Council, minutes of the Place Scrutiny Committee, 11 September 2015, Item 90 – ‘Speed Limit Policy’.

                                                                                                                                4
3. National Speed Policy Context
3.1 The Highways Agency is responsible for determining speed limits on the trunk road network. Local
    highways authorities can set their own speed limits on the local road network and in situations where
    local needs and conditions suggest a speed limit which is lower than the national speed limit, but these
    speed limits must be clearly signed. Local Highways authorities must also consider guidance issued by
    the Department for Transport when setting speed limits.3
3.2 Nationally there were 24,831 serious injuries in road traffic accidents reported to the police in 2017.
    There was a total of 170,993 casualties of all severities in reported road traffic accidents in 2017. This is
    6% lower than in 2016 and is the lowest level on record. The number of fatalities aged 60 and over in
    reported road traffic accidents has increased from 533 in 2016 to 559 in 2017. This increase was driven
    by more older fatalities as pedestrians in 2017.

‘Local speed limits should not be set in isolation, but as part of a package with other
measures to manage vehicle speeds and improve road safety’4
3.3 Effective speed management involves many components designed to work together. Speed limits in
    areas where vehicle speeds are not self-limited by features such as on-street parking or by natural
    features such as road bends, are effective when supported by speed calming measures such as speed
    cushions or road narrowings. Increased road width and space are linked to increased vehicle speeds.5

                              Chart showing the correlation of speed and fatality

3.4 Impact speed is the underlying determinant of injury severity during traffic collisions. For every 1 mph
    reduction in average speed, collision frequency reduces by around 5%. Drivers travelling at higher
    speeds have less time to react to their environment. Longer stopping distances mean that resulting

3 Department for Transport, ‘Speed Limits', Department for Transport Circular 01/2013, ‘Setting Local Speed Limits’, January 2013.
https://www.gov.uk/speed-limits (accessed 07/05/2019)
4 Department for Transport, ‘Setting Local Speed Limits’, 01/2013,

https://assets.publishing.service.gov.uk/government/uploads/system/uploads/attachment_data/file/63975/circular-01-2013.pdf,
(accessed 07/05/2019)
5 Department for Transport, ‘Setting Local Speed Limits’, 01/2013,

https://assets.publishing.service.gov.uk/government/uploads/system/uploads/attachment_data/file/63975/circular-01-2013.pdf,
(accessed 07/05/2019)

                                                                                                                                     5
crashes are more severe, causing greater injury.6 As speed increased, so does the severity of injury, this
is demonstrated on the chart below where there is a fatality risk of 1.5% at 20mph compared to an 8%
chance at 30mph. The dotted lines represent the 95% confidence interval: 7
3.5 In built up areas the general speed limit is 30mph; on single carriageway roads it is 60 mph and on dual
carriageways, 70 mph. However, in urban areas, particularly around schools, there has been a growing
trend for local authorities to reduce the limit to 20 mph. It is important to remember that the speed
limit is the absolute maximum - it does not mean that it is safe to drive at this speed in all conditions.8
Environmentally friendly vehicle policy
3.6 The effectiveness of speed management measures in reducing vehicle speeds must be matched with
their appropriateness for local people and balanced with issues such as noise and air pollution and
congestion. Managing vehicle speed is essential for sustainable transportation policies, which are
friendly to the environment, promote safety, and protect public health. Community coherence and an
improved environment are increasingly recognised as key outcomes of speed reduction measures.
3.7 Making engineering measures appropriate for local people is difficult to achieve. Dangerous vehicle
speeds discourage forms of active travel such as cycling and walking. Excessive vehicle speeds also bring
problems to communities such as noise pollution, which can undermine the quality of life of local
people. When new speed calming measures are introduced, meaningful monitoring must be in place to
ensure that these speed calming measures are having the desired effects on vehicle speeds.
3.8 There is a complex relationship between speed management and vehicle emissions. The effects of
speed limits on air pollution should not be generalised; different studies have produced varying results
and an uneven picture. The task group has heard that lower speeds are better for the environment to a
point, as vehicle engines reach maximum efficiency at specific speeds. However not all vehicles are
made equally, with different emissions and optimal running speeds between petrol and diesel cars, not
to mention different engineering on different models. With at least one study demonstrating that
lowering speeds to 20mph reduces NO2 and CO2 emissions for diesel cars but increases them for petrol
cars9 and this does not apply to engines over 2.0 litres.
3.9 In urban environments, and where drivers do not maintain a constant speed, accelerating and
frequently braking can disproportionately increase vehicle emissions. Traffic calming engineering works
can unfortunately exacerbate this problem with heavy braking up to the measure (e.g. a chicane or
speed hump) and then rapid accelerating away. As a result, the National Institute for Health and Care
Excellence (NICE), has recommended “20 mph limits without physical measures to reduce speeds in
urban areas where average speeds are already low (below around 24 mph) to avoid unnecessary vehicle
accelerations and decelerations.”10
6 Taylor, M. C., Lynam, D. A. and Baruya, A. (2000), TRL Report 421 – ‘The Effects of Drivers' Speed on the Frequency of Road
Accidents’. Crowthorne: TRL, cited in DfT, ‘Setting Local Speed Limits’;
7 The Royal Society for the Prevention of Accidents. ‘20mph factsheet’ https://www.rospa.com/rospaweb/docs/advice-
services/road-safety/drivers/20-mph-zone-factsheet.pdf Nov 2017
8 House of Commons Briefing Paper, ‘Speed Limits in England’, 21 September 2017, p.3; https://www.gov.uk/speed-limits; The
Department for Transport, ‘Speed Compliance Statistics, Great Britain: 2016’, 29 June 2017, p. 1.
9 Imperial College London; Transport and Environmental Analysis Group, Centre for Transport Studies: ‘An evaluation of the
estimated impacts on vehicle emissions of a 20mph speed restriction in central London’, April 2013
https://www.cityoflondon.gov.uk/business/environmental-health/environmental-protection/air-quality/Documents/speed-
restriction-air-quality-report-2013-for-web.pdf (accessed 06/06/2019)
10National Institute for Health and Care Excellence, ‘Air pollution: outdoor air quality and health’, June 2017, p62
https://www.nice.org.uk/guidance/ng70/chapter/Recommendations (accessed 06/06/2019)
64. Why do Drivers Speed?
4.1 The task group spoke to a senior academic from the University of Exeter to better understand why
drivers might speed to equip the task group with greater understanding upon which to base their
recommendations. As well as to gain greater insight into some of the contradictions in speed policy and
approaches and public opinion.
‘26% of drivers who support 20mph admit to frequently
breaking those limits’ 11
4.2 The task group heard that there is a difference between the cognitive attitude and the affective attitude
of a driver. A cognitive attitude is the logical differentiation as to whether speeding is harmful or
beneficial. (Is anyone going to get hurt/can I get to my destination quicker?) The affective attitude is the
feeling as to whether speeding is enjoyable or not.
4.3 These attitudes do not have to be aligned, which leads to cognitive dissonance, meaning that speeding
can be seen simultaneously as good and bad. If a motorist thinks speeding is probably bad but whizzing
along a country road feels good, then they are likely to speed.
4.4 Feelings are a stronger determinant than rational thought, as demonstrated on the slide below.
Furthermore, positive expectance beliefs and attitudes are more influential than negative ones in
changing behaviour, particularly affective attitudes. Therefore, a negative cognitive attitude (I think
speeding is bad) has the weakest influence on behaviour while positive affective attitudes (I love going
fast) have the strongest.
4.5 Perceived capability and perceived task difficulty also have significant impacts upon driver behaviour
and risk taking. So, a road that appears hazard free, with clear visibility, smooth surface etc is more
likely to encourage risk taking behaviour. If the driver in question has a high impression of their own
11Tapp et all 2015 ‘Vicious or virtuous circles? Exploring the vulnerability of drivers to break low urban speed limits
http://eprints.uwe.ac.uk/29286/3/Tapp%20et%20al%2020mph%20limits%20-
%20paper%20responding%20to%202nd%20reviews%20-%20version%20sent.pdf (accessed 06/06/2019)
7skill as a driver, they are even more likely to break the speed limit. This is particularly an issue where
low speed limits have been placed on inappropriate roads where faster speeds do not feel difficult to
achieve. So, to decrease this, perceived capability must be reduced, and perceived task difficulty must
be increased. Perceived capability can be reduced through education, persuasion and enforcement.
Perceived difficulty can be reduced through engineering or other measures so that roads with slower
speed limits feel objectively different to those with faster speed limits.
4.6 The RAC undertook research as part of their yearly review of motoring attitudes and behaviours. The
graph below shows the self-reported reasons that people give for breaking the speed limit on roads
with different speed limits.
12
5. Local Policy and Safety Context
5.1 Councillors have reported that vehicle speeds are a highly emotive issue for the public. Groups such as
older people (aged 60 and over) are more vulnerable to dangerous vehicle speeds. There is also an
increasing number of older people in the population, especially in Devon.13
5.2 Appendix 3 of this report detailed the urban and rural road collisions from 2013-17. The heat map and
associated graph in the Appendix demonstrates that collisions that result in casualties being killed or
seriously injured (KSI) in Devon is increasing, particularly on rural roads. In Devon it is unsurprising that
rural roads make up a consistent 70% of serious collisions over the past five years. The task group has
heard that there are 48 collision clusters currently in Devon, if it were possible to address the top 20
then the authority could make some serious inroads in changing the trend. Treating these clusters
would make a significant difference to the KSI.
5.3 Devon has a low number of children that are Killed or Seriously Injured (KSI) in traffic collisions but
fears about the dangers of speeding from parents still exist and prevent some children from
12RAC, ‘Report on motoring’ 2017 https://www.rac.co.uk/report-on-motoring/report-on-motoring-2017 (accessed 06/06/2019)
13Department for Transport, ‘Reported road casualties in Great Britain: 2017 annual report’, 27 September 2018, p. 15,
https://assets.publishing.service.gov.uk/government/uploads/system/uploads/attachment_data/file/744077/reported-road-
casualties-annual-report-2017.pdf (accessed 06/06/2019)
8walking/cycling to school. This could have negative long-term health implications for children if their
physical activity is limited.
5.4 Devon County Council Speed Limit Policy was last revised in 2009, the details of speed limit guidance
can be found below. The most recent guidance from the Department for Transport on speed limits,
particularly 20mph speed limits, was released in 2013. This guidance stated that Local Councils should
“consider the introduction of more 20 mph limits and zones, over time, in urban areas and built-up
village streets that are primarily residential, to ensure greater safety for pedestrians and cyclists”14. It
was felt by Devon County Council that these changes to policy were unnecessary and due to
budgetary constraints would not bring about any real change if implemented. The 20’s plenty
campaign group was clear to the task group that this meant that the Council was not compliant with
the latest speed policy.
15
The SCARF Process
5.5 The effectiveness of engineering measures in reducing vehicle speeds must be matched with their
appropriateness for local people and balanced with issues such as noise and air pollution, congestion
14 Department for Transport, Department for Transport Circular 01/2013, Setting Local Speed Limits, January 2013, p5
15 Devon County Council, Traffic Policy Note, Local Speed Limits, DTP 34/05, November 2009, p3
9and public transportation requirements. The task group has heard that traffic calming measures are
often expensive to engineer and to maintain and there are challenges with funding. There was
previously funding available for local changes such as traffic calming measures through the Local
Transport Plan Budget. As outlined above, engineering measures are not always desirable as, in urban
areas such as Exeter, introducing speed calming measures can lead to increased
acceleration/deceleration and the associated problems of noise and air pollution.
5.6 The Speed Compliance Action Review Forum (SCARF) is the means by which speeding is analysed by
DCC and Devon and Cornwall Constabulary, through this analysis it is determined what further
enforcement action needs to be taken. To avoid duplication and to provide a co-ordinated, highly
evidence-based response, DCC and the Police have developed a joint procedure to allow the concerns
to be assessed in a consistent manner. SCARF makes use of data held by DCC, D&CC and the Peninsula
Safety Camera Partnership (SCP) to ensure that assessment of complaints is evidence based. SCARF
keeps records of its investigations and will not normally re-consider complaints that have already been
assessed until a three-year period has elapsed.
5.7 The mean or average speed and the 85th percentile speed (the speed at which 85% of drivers travel at
or below) are used to determine if there is a speeding issue and the appropriate intervention level.
National Police Chief’s Council (NPCC) guidelines are that enforcement may be appropriate where the
mean speed is in excess of the Speed Limit or where the 85th%ile speed exceeds the speed limit by
10%+ 2mph. e.g. In a 30mph Speed Limit, a mean speed of 30mph would be normally be expected to
have an 85th%ile speed of no greater than 35mph. The 5 potential outcomes from SCARF are
demonstrated on the table below which has been produced by the task group based on information
shared. It is important to note that outcomes from the SCARF process can be a blend of different
measures.
Level Recorded speed Action Taken
Average (Mean) Speed 85% of vehicles travel
at:
0 The speed limit Not more than 15% No action or Speed Indicator Device (SID)
above the Speed Deployment.
Limit.
1 The speed limit Between 15% and SID Deployment with Police support &/or
25% above the Speed Community Speed Watch.
Limit.
2 Up to 15% above speed Between 25% and Occasional Police or SCP Enforcement,
limit 35% above the speed suitable for an Educational Initiative eg.
limit Police Speed Gun or Mobile Vehicle
Activated Sign (VAS) deployment
3 Greater than 15% Greater than 35% Level 3 Regular Police Enforcement and
above Speed Limit above the Speed Limit Review Signing consider Mobile VAS (See
TMT02- Vehicle Activated Signs)
4 Greater than 25% Suitable for SCP Mobile Camera
above the Speed Limit Enforcement or Engineered Solution
5.8 When recorded speeds fall substantially outside of the guidelines this could indicate that the speed
limit is either set at the wrong level or that Enforcement, Engineering or Education, Training and
Publicity are required. In cases of consistently high levels of a speed limit being broken, this could be
10taken as evidence that perhaps the speed limit is inappropriate. As such, in these cases, raising the
speed limit and enforcing this should be considered. Indeed, inappropriate speed limits are
considered potentially dangerous in that they can decrease the legitimacy of all other speed limits and
create a disconnect between expectation (based on the posted limit) and the reality (the actual
speeds travelled). If this disconnect between expectation and reality encourages inappropriate or
unsafe behaviours amongst more vulnerable road users, then the risk of injury will rise. So it could be
that the outcome of the SCARF process would result in raising a speed limit.
5.9 The SCARF process takes a clear evidence-based approach when speed limits are consistently broken
to put in place interventions that are designed to improve compliance and therefore safety. However,
the task group has heard several concerns about the process. Firstly, the approach relies on the local
officer or enough residents and Councillors raising complaints, that may not be taken forward (see
speech bubble below). Secondly the process can be cumbersome and lengthy to ascertain the
evidence. Finally, the measures that are recommended are limited, often financially constrained, and
may not address the actual problem.
The Parish Council has asked numerous times for traffic calming and a
SCARF but have been declined.
16
5.10 The task group has understood that there is often a challenge between providing what residents are
asking for and what the budget is able to deliver. Whilst the SCARF process does manage resources in
an evidence-based way, it does not consider what residents are asking for. This is further complicated
as often residents and PARISH Councils may have a solution in mind already, as in the call out above.
The task group have heard examples of the successful implementation of different solutions to those
that residents have asked for, particularly in Cornwall where residents wanted a bypass and instead
had a shared space scheme. The onus upon the County Council is to understand what is the change
that residents want, rather than what is the intervention that they think might best address the
problem.
5.11 There is work underway to change the thinking of the organisation; the Doing What Matters team is
supporting the organisation to fully understand what life really feels like for the people of Devon, and
to put citizen need at the heart of everything. The Doing What Matters team is developing leadership
to constantly test our assumptions about our work, about citizen need and about the interaction
between the public and the services we provide. The team helps leaders to engage in continual
learning in order to improve the way our work is designed and managed, based on new knowledge
and understanding, so that we can truly make a difference to people’s lives.
6. 20mph Speed Limits
6.1 20mph Speed Limits have recently undergone a great deal of scrutiny, most notably with the long-
anticipated publication of the Atkins Report in November 2018. The report bases its theory of change
on the assumption that lower speeds reduce the frequency and severity of accidents.
16 Task Group Survey free text box to all Town and Parish Councils
1120mph zones vs limits?
A 20mph zone only requires one physical calming device (the rest may be roundels or
repeater signs) there is little practical difference between zones and limits.
Most authority-wide 20mph implementations use a mixture of both to produce
community-wide 20mph areas. Often a single legacy table or ramp may be used to
designate a series of roads as a zone.
17
Findings from the Atkins Report
6.2 The Atkins report was a much-anticipated National study into the effectiveness of 20 mph. Using
twelve core case studies comprising a variety of area types, road types, and scale:
18
6.3 The schemes involved lowering the speed limit from 30mph to 20mph through signing and road
markings and supporting community engagement activities to raise awareness and encourage
support. None of the schemes involved the introduction of physical traffic calming measures or
changes to the street design.
6.4 A majority of people from almost all groups surveyed were in favour of 20mph speed limits before and
after implementation. However, there was a consistent net agreement post implementation that
20mph speed limits had not improved perception of area as a community environment.
- Analysis of TomTom GPS journey speed data shows that a substantial proportion of drivers were
already travelling at less than 20mph prior to the introduction of the new limits and median before
speeds were already close to 20mph, 44% in residential case study areas and 59% in city centre case
study areas. However, these numbers increased by 6% and 3% respectively after the implementation
of 20mph speed limits.
- Journey speed analysis shows that the median speed has fallen by 0.7mph in residential areas and
0.9mph in city centre areas.
- In residential areas, in the short term, the absolute number of collisions and casualties has reduced.
However, due to similar experiences in control areas, the analysis indicates a high level of probability
(generally more than 50%) that the relative reductions identified in the case study areas are due to
chance, and that there is no meaningful difference between the reduction in the case study and
comparator areas.
17Information taken from witness session with Rod King from ‘20’s Plenty’ 2018
18Atkins and Maher, 20mph Research Study Process and Impact Evaluation Headline Report, Nov 2018, p13
https://www.gov.uk/government/publications/20-mph-speed-limits-on-roads (accessed 06/06/2019)
126.5 Although 69% of residents agreed that the 20mph limits are beneficial for cyclists and pedestrians,
there was only a small (but significant) increase in the proportion of survey respondents stating that
they have increased their use of active travel modes. Some 5% of residents surveyed said that they
are walking more, and 2% said that they are cycling more, since the introduction of the 20mph limits.
6.6 Journey times are estimated to have increased by 3% in residential areas and 5% in city centre areas,
however, the vast majority of residents did not see an increase in frustrated driving behaviour and
there is little evidence of route changes, as only 8% of (non-resident) drivers said that they avoid
driving in the area, and only 4% of residents felt that there are less vehicles using their road. This is
congruous with testimony from 20’s plenty below:
There is no evidence that there is any increase in congestion in 20mph roads compared to
30mph.
19
6.7 Longer term evidence from Portsmouth journey speed analysis shows an increase in 20mph
compliance over time, from 58% one year after (2009) to 62% seven years after implementation.
Implying that the positive effects from 20mph speed limits do not disappear over time.
6.8 The summary finding from the research is that although the effects from 20mph speed limits are
positive, they can be small at best. 20mph speed limits must be ensured to be appropriate to the
road, for example if traffic speeds are already close to 20mph or are self-enforcing with measures
such as traffic calming engineering.
20’s plenty for us
6.9 The task group spoke to Rod King, founder of The Campaign Group ‘20’s Plenty’ who was disappointed
with the final Atkins report. The group highlight that the original objectives were not addressed, that
the primary data used in the report has several limitations which are not taken into account, as well as
the low numbers of figures used to limit the statistical validity of the data around casualty figures. The
table below summarises the original objectives of the study and then gives the response from the
campaign group:
Objective Our assessment
1. Effectiveness. To evaluate the Not met Methodology is flawed in comparisons
effectiveness of 20mph speed limits, in a made; uses data with inherent bias on
range of settings. speed measurements and data
gathered is insufficient on casualties.
2. Perceptions. To examine drivers’ and Met The wide range of surveys are useful.
residents’ perceptions of 20mph limits.
3. Cost/Benefits. To assess the relative Not met Cost-effectiveness was not assessed or
costs/benefits to compared with other interventions
such as physically calmed zones.
vulnerable groups e.g. children, cyclists, the
elderly.
19 Witness Session with Rod King, founder of 20’s plenty
134. Processes & Factors. To evaluate the Not met These were discussed, but no
processes and factors which contribute to evaluation made of the possible
the level of effectiveness of 20mph speed contribution in case studies chosen.
limit schemes.
20
6.10 The task group is very interested in the application of default 20 mph limits in Area-wide 20mph limits
were first introduced in residential streets, city-wide, in Portsmouth. Portsmouth’s vision was for
speeding on residential streets to become as unacceptable as drink driving. Initial results of the
Portsmouth scheme were encouraging, with a reduction in average speeds (greatest on roads with the
highest ‘before’ speeds), and indications that casualties have fallen.
6.11 Several English local authorities have since followed this approach by implementing 20mph as the
default speed limit for residential streets, including Oxford, Bristol, Warrington, Islington, and
Hackney. A greater number have made the political commitment to 20mph limits in principle, for
example Norwich and Birmingham. The benefits of 20mph areas goes beyond a lowering of speed and
many of the softer measures are harder to capture in statistical evaluation.
In Edinburgh a pilot implementation of the 20mph speed limit was found to have tripled the
number of children cycling to school.
21
6.12 Rod King presented to the task group the five factors to consider and work into the introduction of a
20mph limit to ensure a successful change to speed:
1/ Conviction – Is the traffic authority communicating conviction with an authority-wide
implementation. This delivers the benefits to most drivers’ home streets and increases ownership?
Or alternatively, is it communicating a lack of conviction by implementing in an isolated manner on a
trial basis?
2/ Enforcement – Do the police support the change in speed limit with a policy that includes some
enforcement, so endorsing the mandatory nature of the limits? Alternatively do the police refuse to
enforce and send a clear message that a 20mph limit should not be taken seriously?
3/ Previous speed – When implemented across a wide area, many streets that already have a low
speed will be included for consistency. Reductions will be less or not at all on such streets and higher
where previous speeds have been greater. Hence overall averages of average speeds may well
underestimate the reductions on faster streets.
4/ Engagement – By recognising the social norming and engagement aspects of an implementation
then the public will be far more aware of and buy into the values and benefits associated with the
change. Especially if this is framed around making the community a better place for all. Public health
specialists can bring useful skills and experience to such a behaviour change program. Alternatively,
solely communicating via road signs is a poor substitute for engagement.
2020’s Plenty for Us, DfT 20mph Evaluation Conclusions, no date; http://www.20splenty.org/20mph_evaluation_conclusions,
(accessed 06/06/2019)
21Edinburgh City Council Transport and Environment Committee, South Central Edinburgh 20mph Limit Pilot Evaluation 2013, August
2013,
http://www.edinburgh.gov.uk/download/downloads/id/7820/south_central_edinburgh_20mph_limit_pilot_evaluation_2013.pdf
2.27, (accessed 06/06/2019)
145/Multi-agency approach – By approaching an authority-wide implementation with a team
comprising Ambulance, Fire, Social Services, Traffic, Road Safety, Public Health, Police and Schools
then each can play their part in setting this as a community enhancing initiative. Alternatively, only
seeing it as a “traffic management” issue limits behaviour change and public buy-in.
6.13 In Torbay, a different model is used when assessing if an area should be lowered to 20mph. Their
criteria for lowering to 20mph is to have two of either: Current mean speeds are at or below 24 mph,
there is a depth of residential development and evidence of pedestrian and cyclist movements
within the area and/or there is a record of injury accidents (based on police collision data) within the
area, over a period of the last five years. Following this a matrix (Appendix 2) is used. This gives an
example of how community support can be given more weight while still tackling speed limits
through an evidence-based approach.22
6.14 The task group followed up two authorities that had successfully reported their introduction of
20mph limits, these are detailed in the boxes below. There are key aspects of both schemes that are
reflected in the 20’s plenty step by step approach above. This includes the need for early engagement
and winning over hearts and minds. In Sefton much of this was done after the introduction of 20mph.
In Bristol the publicity campaign started much earlier. The task group would like DCC to explore
default 20mph limits and evaluate how they work locally, learning lessons from other authorities that
have already done this.
Introduction of widespread 20mph zones in Sefton
In 2011, following the widely publicised conversion of all residential roads within Portsmouth, Elected
Members requested a similar process be carried out within Southport. This was discussed in a report
and on 3 October 2011, Sefton Cabinet Member – Transportation widened this request to include the
whole of Sefton and introduced an annual rolling programme, funded from Sefton’s Local Safety
Scheme allocation within the Capital Programme.
The rolling programme started in 2012/13 and completed in 2015/16. Approximately eight self-
contained areas were treated each year. In each of these areas, consultation packs and questionnaires
were hand delivered to every property in the area. This resulted in a spread of support for the
introduction of the 20mph speed limits ranging from 53.4% to 94%, with an average of 74.7% of
residents supporting the schemes over the four years of the programme. An average reduction of
1mph in 85%ile speeds has been observed since the introduction of the lower speed limits.
Sefton are complimenting the introduced speed limits with education, training and publicity
programmes funded from the Capital programme for the next four or five years. The
publicity/education programme that the Task Group has seen in Sefton’s local press comprises of
subliminally ‘drip fed’ information every week in the local free papers. These messages highlight the
advantages and reasons why people should drive at lower speeds in residential areas. They have no
reference to Sefton Council. The messages change every week and hopefully prompt the reader to
think about how they drive and understand how their actions impact upon others.
22Torbay Council, 20mph Speed Limit Policy Criteria, no date,
http://www.torbay.gov.uk/DemocraticServices/documents/s63224/Appendix%201%2020%20mph%20Residential%20Criteria.pdf,
(accessed 30/05/2019)
15Introduction of 20mph limits in Bristol
In 2010 two pilot areas of 20mph were trialled in the inner-city area and the results proved
very fruitful which led to a Cabinet report. This agreed to rollout 20mph citywide and from
Sept 2013 to Sept 2015 the speed limit was implemented across the whole city in six phases.
The results are that 90% of roads have a 20mph with a 30/40 and 50mph network of main
arterial routes, although some main road in the centre of city are 20mph due to the volume of
pedestrians and cyclists in the area. The overall outcomes of the project are to ensure
reduced speed limits continue to help improve active travel and subsequently health and
wellbeing for residents and make streets safer for all road users. The 20mph speed limits are
wholly sign based interventions and rely on driver compliance to adhere to the speed limit (as
is the case for all speed limits).
The rollout also included a comprehensive monitoring programme and in Feb 2018 the Bristol
Twenty Miles Per Hour Limit Evaluation (BRITE) study was produced by the University of the
West of England (UWE). This independent peer reviewed report assessed the impact of
20mph speed limits and found a reduction in road speeds and fatalities following road
collisions since the lower speeds were introduced. 94% of surveyed roads have slower speeds,
active travel levels have increased and there was a significant reduction in the number of
fatal, serious and slight injuries and commensurate significant financial savings for the NHS.
(www.bristol20mph.co.uk). A dedicated website was set up and there is now a Facebook page
and twitter account to continue this work which has been invaluable as an engagement tool.
7. Re-envisaging Traffic Speeds and Living Streets
7.1 The task group undertook a survey to all Town and Parish Councils with the purpose of testing local
opinion on speed limits. The response rate was 69, which is approximately one fifth of the Councils
in Devon. Most respondents feel that vehicles travel too fast, especially in built up and residential
areas:
Town and Parish Council views on speed
built up areas
single carriageways
dual carriageways
0% 10% 20% 30% 40% 50% 60% 70% 80% 90% 100%
too fast about right too slow
167.2 Conducting a survey in this way did highlight limitations in road descriptors as the task group had
limited scope to precisely define single carriageways where passing is possible compared to single
carriage ways where there can be significant differences between urban and rural roads.
7.3 Of the 46 comments referring to speed, 32 spoke of ways to reduce speed, but only 21 gave a reason
as to why they wanted to see traffic slowed. The most common reason for wanting slower speeds
was safety, the only other concern spoken of was traffic congestion/volume. The most popular
measures to reduce speed were greater enforcement and greater physical traffic calming
measures/signage. A selection of typical comments is graphically shown below:
The village would like We will look at self-help
a 20-mph speed limit signage adhered to Wheelie
to be put in place Bins by way of an
awareness campaign to
inconsiderate drivers.
Please don't waste money
changing speed limits in the
parish. The only people who
drive too fast on our narrow National speed limit
lanes are the ones who on country roads is
won't obey a speed limit a farce.
anyway.
7.4 Respondents to the survey were also invited in to a focus group/round table discussion about speed.
The table below is a summary of the main points that were raised coupled with suggestions that
could help the issues
Challenges/problems Possible solutions
➢ policy to have the ability to be more pro-
Changing the speed limit to a lower speed
active to speed problems, rather than
- Will only be reduced if the average speed is reactive
fairly close to the proposed new speed. ➢ Changes to the SCARF process to listen to
- traffic speed policy does not take into residents.
account local opinion and observations ➢ More regular reviews of speed limits
- Traffic speeds are not in keeping with ➢ ‘Quiet Country Lanes’ adopted as a
growing rural communities classification with a maximum speed of
50mph
Reducing speeding (drivers being within the ➢ Hard hitting informational posters
speed limit but driving at inappropriate speeds) ➢ Signage tactics from communities
➢ Flashing lights next to a school to alert
drivers picking up/dropping off time at the
17Challenges/problems Possible solutions
school. This could be used more extensively
in Devon.
➢ More enforcement
➢ More innovative methods of ensuring speed
remains close to a speed limit.
20mph Speed Limits seen as somewhat ➢ Have to be accompanied by traffic calming
ineffective but lots of communities would still measures
like them.
➢ Community could invest themselves
Engineering measures
➢ Vehicle Activated Signs which show the
- no budget given for traffic calming measures speed of the vehicle may be more effective
until there is a history of road traffic ➢ Communities expressed a wish for DCC to
accidents in that area. engage more with such methods as tree
- not all physical traffic calming engineering planting, road colours and other such cost-
measures are helpful or achieve the right effective methods.
result.
- Nothing can be done until there is a fatality!
- Vehicle Activated Signs have proved to be
unsuccessful
Rat-running through small villages creating a ➢ Sat navs may be sending large vehicles
large problem with the volume of fast-moving down small and inappropriate country
vehicles which are unsafe and unsociable roads. It would be beneficial if there were a
warning to alert people as to when they
were in a residential area
Community Speed Watch ➢ More support from the Police for
Community Speed Watch and more visible
One community set up a community Speed
support.
Watch and managed to gain vehicle activated
signage as a result. This did not change speed,
however. It did garner much abuse toward the
Speed Watch volunteers. The fear of harassment
of Speed Watch volunteers was echoed by
others.
7.5 The task group has considered the testimonies from witnesses and put together the diagram over
the page, which attempts to demonstrate the nuances that even in cases where the majority of
speed is not breaking the speed limit, it may still feel too fast. This in turn can set the tone around
safety for the neighbourhood. The task group asserts that an approach is required where roads are
viewed as one aspect of a community and can act as an enabler for better health.
7.6 The speed set on any road will be informed by the local interpretation of National Policy. It may
already have some features that make drivers adhere to the speed limit. The policy guidance
suggests setting speed limits in line with how fast traffic is already travelling. If for example in a
twenty mph zone the road is narrow and frequently has parked cars down one side, with several
turns and corners, drivers are unlikely to exceed the speed limit. In an ideal world traffic meeting this
speed limit will be felt by pedestrians and residents to be part of an environment where roads are
safe spaces. This means that the goal – of promoting health environments has been met. However,
18an alternative outcome is that although traffic is complying with the speed limit, it still feels fast. This
is likely to be a deterrent to pedestrians and cyclists and may even encourage residents to get in
their cars more for short journeys like taking their children to school.
7.7 Going to the other side of the diagram, a speed limit is set with a road that is not self-enforcing – this
may be at a higher speed, or simply one where the topography does not lend itself to maintain the
speed limit – for example with a long, straight road in a 30 mph. This scenario sees motorists
breaking the speed limit. The next stage in the process is that through traffic monitoring, residents
or Councillors complaining the SCARF process is initiated. Assuming that the SCARF process goes
ahead, an evidence-based solution will be suggested. This could be engineering measures, to calm
traffic on roads where the limit is being most severely broken. It could be enforcement on roads
where the limit is still being broken, or it could be community speed watch, or no action if most of
the traffic is travelling within the speed limit. This determination and subsequent action may resolve
the concerns, reducing the actual speeding as well as the perception of speeding. However, it may
be that traffic still feels too fast for residents, even if most of the traffic is staying within the speed
limit. This is likely to inhibit walking and cycling and road us for vulnerable users.
7.8 One concept that the task group discussed was the idea that speeding and travelling too fast could
and should become socially unacceptable, in the way of drink driving or smoking. A societal shift in
attitude to speed would potentially negate the need to respond with engineering measures or
enforcement.
19Set Speed limit on road
Speed is self-enforcing Speed is not self-enforcing
Engineering Measures
Enforcement
No No Action Speeding
Speeding S
C
A
R
F
Traffic travels at Traffic feels too fast Traffic is too fast
appropriate speed X X
Outcome
Community that are encouraged and enabled to make active lifestyle choices e.g. walk, cycle and enjoy
their neighborhood 20Safe Systems and Healthy Streets Approach
7.9 The need for a different approach has been heard throughout the task group’s investigation. The Safe
System approach is one that aligns road safety management with broader ethical, social, economic and
environmental goals. By creating partnerships where government or transport agencies work closely with
other groups. Given the complex multi-agency and multi-sectoral context of safe system methodology, it
requires careful leadership by top management of organisations to bring together the unique contribution of
each agency. Safe System has five pillars of action:
- Safe Roads
- Safe Speeds
- Safe Vehicles
- Safe Road Users
- Post Collision Response
23
7.10 In 2017 TfL published their Strategy on the Healthy Streets Approach. This is a street planning strategy which
tries to re-prioritise the pedestrian, vulnerable road users and public transport while reducing pollution and
congestion, to make for an environment which promotes health and wellbeing.24 The strategy uses 10
Healthy Street indicators as cornerstones of its guidance around streets. These are:
23PACTS; ‘Developing Safe system road safety indicators for the UK http://www.pacts.org.uk/wp-content/uploads/sites/2/PactsReport_-
Developing-Safe-System-Road-Safety-Indicators-for-the-UK_Oct18-FINAL.pdf
24 Transport for London, Healthy Streets for London, London, February 2017, p6-11
211) Pedestrians from all walks of life 6) Easy to cross
2) People choose to walk, cycle and 7) Places to stop and rest
use public transport
8) Shade and shelter
3) Clean air
9) People feel relaxed
4) People feel safe
10) Things to see and do
5) Not too noisy
Of these, Pedestrians from all walks of life and people choose to walk, cycle and use public transport are
shown as being the most important while the remaining eight help to support these two.25
7.11 The Healthy Streets approach gives a great deal of guidance on how these indicators may be implemented.
One of the main recommended methods of achieving a Healthy Streets approach is a reduction in traffic
speed;
“If we could reduce the speed of vehicles, then the street would feel safer, more relaxed, less noisy and
easier to cross. A street with slower moving traffic is likely to attract more people to walk, cycle and spend
time in it. Reducing speeds may involve physical traffic calming but also requires changing the way the
street feels and how it is used, to encourage people to drive with more care. This can all help encourage
people to feel more comfortable playing, socialising, exercising and resting in the street environment.”26
Speed reduction is one the many example methods of achieving the Healthy Streets Indicators suggested. It
is of course most effective when paired with other goals such as traffic volume reduction, promoting
community ownership and reducing street clutter.
7.12 In the absence of government targets for road safety the task group advocates a Performance Indicator
approach which measures progress against key indicators of collision outcome severity. These are taken
from the recommendations in ‘Developing safe system road safety indicators for the UK Parliamentary
Advisory Council for Transport Safety, in association with Ageas’. These are in line with the Safe system
approach:
1. Traffic complying with speed limits on national roads
2. Traffic complying with speed limits on local roads
3. Drivers who do not drive after consuming alcohol or drugs
4. Car occupants using a seat belt or child seat
5. Drivers not using an in-car phone
6. Passenger cars with highest safety rating
7. Major roads with appropriate safety ratings
8. Emergency medical services arriving at priority accident scenes within 18 minutes.
Nudging Speed down
7.13 The task group head from the University of Exeter about the potential to apply Nudge Theory to reduce
speeds travelled. Nudge theory alters people's behaviour in a predictable way without forbidding any
options or significantly changing their economic incentives. 27 To count as a mere nudge, the intervention
must be easy and cheap to avoid. Nudges are not mandates. For example, putting fruit at eye-level counts as
a nudge, whereas banning junk food does not.
25 Transport for London, Guide to Healthy Streets Indicators, London, November 2017, p4
26 Transport for London, Guide to Healthy Streets Indicators, London, November 2017, p26
27 Thaler, R. and Sunstein, C. ‘Nudge: Improving Decisions About Health, Wealth and Happiness’ 2009
227.14 Nudge theory can be used to encourage a more positive affective attitude towards following speed limits
and a negative affective attitude to speeding. A ‘nudge’ is a cheap and easy cue in the environment that
alters people's behaviour in a predictable way without forbidding any options or significantly changing their
economic incentives.
7.15 Strategies to decrease speeding could therefore include:
➢ In depth training, although this must be done carefully, to ensure it does not simply increase confidence
➢ Social and public campaigns to stigmatise speeding
➢ Improved road design, where roads feel that they should be a maximum of the speed limit
➢ Reminder campaigns which use behavioural science approaches
➢ Specific local campaigning and Community Speed Watch to reinforce the visible presence
7.16 A crucial aspect of access relates to the extent to which neighbourhoods can be described as walkable. That
is, the ease with which pedestrians can get out and about around outdoor spaces, services and facilities,
which has significant implications for sociability, health and well-being. Walkable environments consider not
only the physical design of routes, but also features and facilities that are inclusive of the widest possible
range of needs; for example, places for people to rest along their journeys, including well designed seats and
benches, accessible toilet facilities, signage and street design that is sensitive to a range of needs and that
can help with orientation and wayfinding.
7.17 Examples of this being attempted in a rural setting can be seen through such legislation as Section 268 of the
Transport Act 2000, “Quiet lanes and home zones” which was later clarified further by the Quiet Lanes and
Home Zones (England) Regulations 2006.
7.18 The law gives local authorities the power to create Home Zones and Quiet Lanes. Quiet Lanes are a
designation that can be given to small rural roads that are extensively used by walkers, cyclist and riders with
the aim to increasing the awareness of drivers. Evidence surrounding the scheme shows mixed results. DCC
considered implementing the legislation in 2006. In a 2006 DCC Transport Plan Environmental Assessment it
was given a brief paragraph of rejection.28 where it stated that “the concept of Quiet Lanes is supported by
the Areas of Outstanding Natural Beauty and The Countryside Agency, and so they should be reconsidered
by Devon County Council in the future”.
7.19 The DCC document makes reference to a Department for Transport Traffic Advisory Leaflet 03/04 which in
turn is summarising a study done on the effect of Quiet Lanes.29 The leaflet in question shows that the
results of how effective Quiet Lanes are is mixed. A reduction in speed compared to control roads was seen
in only one of the three tested Quiet Lanes. However, they were a popular idea both before and after
implementation, traffic flows were seen to decrease on Quiet Lanes and, perhaps most importantly, driver
awareness increased.
7.20 A very similar policy to the Quite Lanes was considered by Devon County Council as a part of the Rural Road
Safety Demonstration project back in the late 2000s with a Green National Speed Limit Sign. This scheme
was ultimately abandoned though due to surveys showing that the Green National Speed Limit Sign was not
understood enough by the public in relation to the traditional national speed limit sign.30
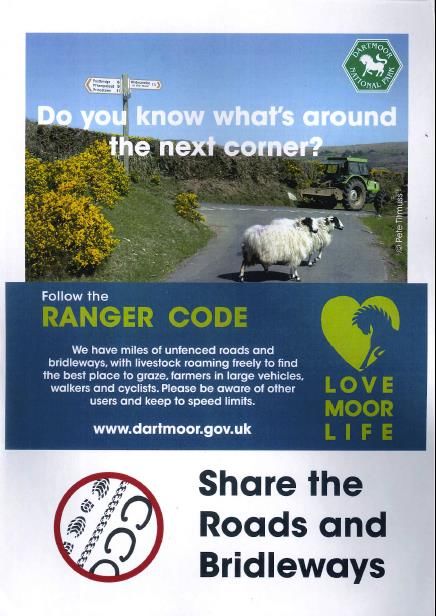
7.21 However, a reduced speed approach has been taken across Dartmoor National Park in response to high
numbers of animal deaths, see box below:
28Devon County Council, Strategic Environmental Assessment Statement: Devon Local Transport Plan 2006-2011,
http://www.devon.gov.uk/sea_statement.pdf (accessed 18/01/2019)
29Department for Transport, Traffic Advisory Leaflet 3/04, June 2004, http://www.ukroads.org/webfiles/TAL%203-04%20Quiet%20Lanes.pdf
(accessed 18/01/2019)
30Department for Transport, Taking on the Rural Road Safety Challenge, Report Annex 1, March 2011, p124
https://webarchive.nationalarchives.gov.uk/20121103223512/http://www.dft.gov.uk/publications/taking-on-the-rural-road-safety-challenge/
(accessed 18/01/2019)
23Case Study: 40mph Dartmoor National Park Authority
▪ High numbers of livestock killed or injured on Dartmoor’s roads – 448 between 2015 and 2017;
many of these have been killed by speeding motorists
▪ Animal carcasses are not only unsightly; injured livestock cause local farmers financial damage
through veterinary bills. Dead livestock have even greater financial repercussions for farmers.
Dartmoor is not only a tourist area but an agricultural environment. The National Park is also
protected for its wildlife
▪ To reduce the number of livestock killed on Dartmoor’s roads through speeding, the DNPA has
undertaken a package of measures which include a combination of legislation, education, and
enforcement. These measures are:
1) Legislation - The introduction of blanket 40 mph speed limits to large parts of Dartmoor
2) Education - The use of Vehicle Activated Signs (VAS) to remind drivers about the 40 mph
speed limits. There are three VAS units, rotated around 6 sites throughout Dartmoor
3) Education - The use of signage to raise awareness about animals crossing roads and the
numbers of animals killed and injured by speeding motorists.
4) Enforcement - Joint work with the Police and DVLA through the Dartmoor Rangers
surrounding the enforcement of speed limits
24You can also read