Expert Systems With Applications
←
→
Page content transcription
If your browser does not render page correctly, please read the page content below
Expert Systems With Applications 168 (2021) 114351
Contents lists available at ScienceDirect
Expert Systems With Applications
journal homepage: www.elsevier.com/locate/eswa
Credibility assessment of financial stock tweets
Lewis Evans a, *, Majdi Owda a, Keeley Crockett a, Ana Fernandez Vilas b
a
Department of Computing and Mathematics, Manchester Metropolitan University M1 5GD UK Manchester, England
b
Ana Fernandez Vilas, I&C Lab, AtlantTIC Research Centre, University of Vigo, 36310 Pontevedra, Spain
A R T I C L E I N F O A B S T R A C T
Keywords: Social media plays an important role in facilitating conversations and news dissemination. Specifically, Twitter
Machine learning has recently seen use by investors to facilitate discussions surrounding stock exchange-listed companies. In
Supervised learning vestors depend on timely, credible information being made available in order to make well-informed investment
Twitter
decisions, with credibility being defined as the believability of information. Much work has been done on
Financial stock market
Feature selection
assessing credibility on Twitter in domains such as politics and natural disaster events, but the work on assessing
the credibility of financial statements is scant within the literature. Investments made on apocryphal information
could hamper efforts of social media’s aim of providing a transparent arena for sharing news and encouraging
discussion of stock market events. This paper presents a novel methodology to assess the credibility of financial
stock market tweets, which is evaluated by conducting an experiment using tweets pertaining to companies listed
on the London Stock Exchange. Three sets of traditional machine learning classifiers (using three different feature
sets) are trained using an annotated dataset. We highlight the importance of considering features specific to the
domain in which credibility needs to be assessed for – in the case of this paper, financial features. In total, after
discarding non-informative features, 34 general features are combined with over 15 novel financial features for
training classifiers. Results show that classifiers trained on both general and financial features can yield improved
performance than classifiers trained on general features alone, with Random Forest being the top performer,
although the Random Forest model requires more features (37) than that of other classifiers (such as K-Nearest
Neighbours − 9) to achieve such performance.
1. Introduction features for determining the credibility of both the content of the tweet,
and the user posting it (de Marcellis-Warin et al., 2017). The problem
Investments made on stock markets depend on timely and credible with such features (namely a user’s follower count) is that they can be
information being made available to investors. Twitter has seen artificially inflated, as users can obtain thousands of followers from
increased use in recent years as a means of sharing information relating Twitter follower markets within minutes (Stringhini et al., 2013), giving
to companies listed on stock exchanges (Ranco et al., 2015). The time- a false indication that the user has a large follower base and is credible
critical nature of investing means that investors need to be confident (De Micheli & Stroppa, 2013). Determining the credibility of a tweet
that the news they are consuming is credible and trustworthy. Credi which is financial in nature becomes even more challenging due to the
bility is generally defined as the believability of information (Sujoy regulators and exchanges need to quickly curb the spread of misinfor
Sikdar, Kang, O’donovan, Höllerer, & Adal, 2013), with social media mation surrounding stocks. Specifically, Twitter users seeking to capi
credibility defined as the aspect of information credibility that can be talize on news surrounding stocks by leveraging Twitter’s trademark fast
assessed using only the information available in a social media platform information dissemination may be susceptible to rumours and acting
(Castillo et al., 2011). People judge the credibility of general statements upon incredible information within tweets (Da Cruz & De Filgueiras
based on different constructs such as objectiveness, accuracy, timeliness Gomes, 2013). Recent research has found that Twitter is becoming a
and reliability (Sujoy Sikdar, Kang, O’donovan, & Höllerer, 2013). hotbed for rumour propagation (Maddock et al., 2015). Although such
Specifically, in terms of Twitter, tweet content and metadata (referred to rumours and speculation on Twitter can be informative, as this can
as features herein), such as the number of followers a user has, and how reflect investor mood and outlook (Ceccarelli et al., 2016), this new age
long they have been a member of Twitter have been seen as informative of financial media in which discussions take place on social media
* Corresponding author.
E-mail address: l.evans@mmu.ac.uk (L. Evans).
https://doi.org/10.1016/j.eswa.2020.114351
Received 16 March 2020; Received in revised form 28 August 2020; Accepted 17 November 2020
Available online 20 November 2020
0957-4174/© 2020 The Authors. Published by Elsevier Ltd. This is an open access article under the CC BY license (http://creativecommons.org/licenses/by/4.0/).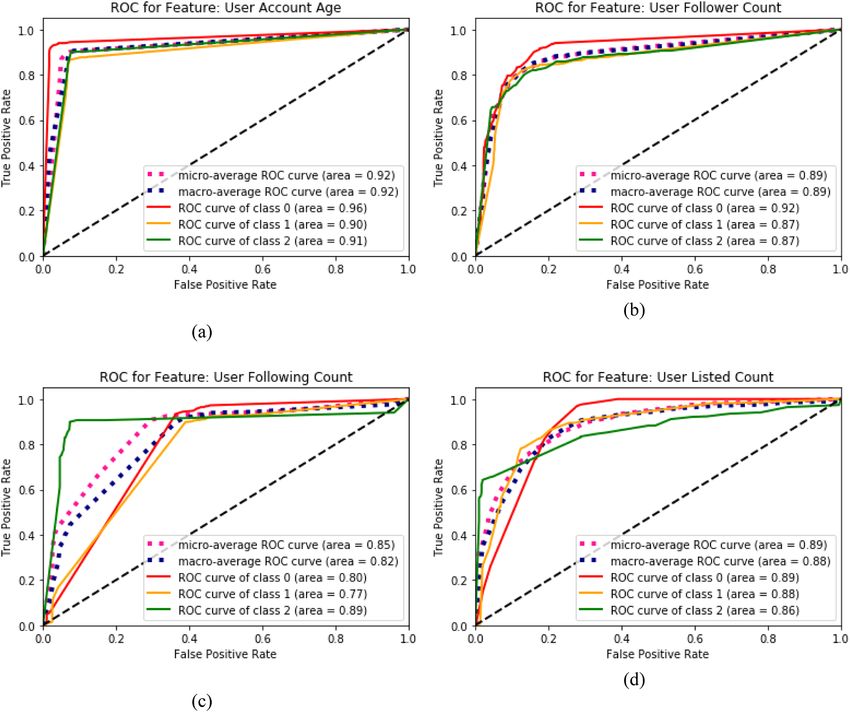
L. Evans et al. Expert Systems With Applications 168 (2021) 114351
demands mechanisms to assess the credibility of such posts. Re • We highlight the importance of performing feature selection for
percussions for investors include being cajoled into investing based on assessing financial credibility of stock tweets, particularly for ma
apocryphal or incredible information and losing confidence in using a chine learning models which do not have inherent feature selection
platform such as Twitter if such a platform can be used by perfidious mechanisms embedded within them.
individuals with impunity (De Franco et al., 2007). Twitter does not just
act as a discussion board for the investor community, but also acts as an The remainder of this paper is organised as follows: Section 2 ex
aggregator of financial information by companies and regulators. The plores the related work on the credibility of microblog posts. Section 3
financial investment community is currently bereft of ways to assess the provides an overview of the methodology used. Section 4 outlines the
credibility of financial stock tweets, as previous work in this field has proposed features used to train the machine learning models. Section 5
focused primarily on specific areas such as politics and natural disaster describes the feature selection techniques used within the methodology.
events (Alrubaian et al., 2018). Section 6 outlines the experimental design used to validate the meth
To this end, one must define what constitutes a financial stock tweet odology. Section 7 provides a discussion of the results obtained. Section
and what is meant by determining the credibility of a financial stock 8 concludes the work undertaken and outlines avenues of potential
tweet. This paper defines a financial stock tweet as any tweet which future work.
contains an occurrence of a stock exchange-listed company’s ticker
symbol, pre-fixed with a dollar symbol, referred to as a cashtag within 2. Background
the Twitter community. Twitter’s cashtag mechanism has been utilised
by several works for the purposes of collecting and analysing stock Although there has been no research on the credibility of financial
discussion (Oliveira et al., 2016, 2017; Cresci et al., 2018). Although stock-related tweets, work does exist on the credibility of tweets in areas
tweets may be relating to a financial stock discussion and not contain a such as politics (Sujoy Sikdar, Kang, O’donovan, Höllerer, & Adal, 2013;
cashtag, this paper takes the stance that tweets are more likely to be Page & Duffy, 2018), health (Bhattacharya et al., 2012), and natural
related to stock discussions if cashtags are present, and this research disaster events (Yang et al., 2019; Thomson et al., 2012). Although some
focuses on such tweets. We define the credibility of a financial stock work has been undertaken on determining credibility based on unsu
tweet as being three-fold: (1) is the cashtag(s) within the tweet related to pervised approaches (Alrubaian et al., 2018), the related work on
a specific exchange-listed company? (2) how credible (based on the credibility assessment is comprised mainly of supervised approaches,
definition above) is the information within the tweet? and (3) how which we now explore.
credible is the author circulating the information? We adopt the defi
nition of user credibility from past research as being the user’s perceived 2.1. Tweet credibility
trustworthiness and expertise (Liu et al., 2012).
The main contribution of this paper is a novel methodology for The majority of studies of credibility assessment on Twitter are
assessing the credibility of financial stock tweets on Twitter. The comprised of supervised approaches, predominately decision trees,
methodology is based on feature extraction and selection according to support vector machines, and Bayesian algorithms (Alrubaian et al.,
the relevance of the different features according to an annotated training 2018). An extensive survey into the work of credibility on Twitter has
set. We propose a rich set of features divided into two groups – general been undertaken by Alrubaian et al. (2018), in which they looked at 112
features found in all tweets, regardless of subject matter, and financial papers on the subject of microblog credibility over the period
features, which are engineered specifically to assess the credibility of 2006–2017. Alrubaian et al. (2018) cited one of the key challenges of
financial stock tweets. We train three different sets of traditional ma credibility assessment is that there is a great deal of literature which has
chine learning classifiers, (1) trained on the general features, (2) trained developed different credibility dimensions and definitions and that a
on the financial features, and (3) trained on both general and financial unified definition of what constitutes credible information does not
feature sets – to ascertain if financial features provide added value in exist. This section will now explore the related work on supervised
assessing the credibility of financial stock tweets. The methodology learning approaches for determining credibility, due to its popularity
proposed in this paper is a generalizable approach which can be applied versus unsupervised approaches.
to any stock exchange, with a slight customisation of the financial fea Castillo et al. (2011) were amongst the first to undertake research on
tures proposed depending on the stock exchange. An experiment uti the credibility of tweets, this work involved assessing the credibility of
lising tweets pertaining to companies listed on the London Stock current news events during a two-month window. Their approach,
Exchange is presented in this paper to validate the proposed financial which made use of Naïve Bayes, Logistic Regression, and Support Vector
credibility methodology. The motivation of this paper is to highlight the Machine, was able to correctly recognize 89% of topic appearances and
importance of incorporating features from the domain in which one their credibility classification achieved precision and recall scores in the
wishes to assess the credibility of tweets for. The novelty of this work lies range of 70–80%. Much of the work undertaken since has built upon the
in the incorporation of financial features for assessing the credibility of initial features proposed in this work. Morris et al. (2012) conducted a
tweets relating to the discussion of stocks. series of experiments which included identifying features which are
The research questions this paper will address are as follows: highly relevant for assessing credibility. Their initial experiment found
RQ 1: Can features found in any tweet, regardless of subject matter that there are several key features for assessing credibility, which
(i.e. general features), provide an accurate measure for credibility include predominately user-based features such as the author’s expertise
classification of the tweet? of the particular topic being assessed (as judged by the author’s profile
RQ 2: Can financial features, engineered with the intent of assessing description) and the user’s reputation (verified account symbol). In a
the financial credibility of a stock tweet, provide improved classification secondary experiment, they found that the topics of the messages
performance (over the general features) when combined with the gen influenced the perception of tweet credibility, with topics in the field of
eral features? science receiving a higher rating, followed by politics and entertain
In addition to the methodology for assessing the financial credibility ment. Although the authors initially found that user images had no
of stock tweets, the other key contributions of this paper can be sum significant impact on tweet credibility, a follow-up experiment did
marised as follows: establish that users who possess the default Twitter icon as their profile
picture lowered credibility perception (Morris et al., 2012). Features
• We present a novel set of financial features for the purpose of which are derived from the author of the tweet have been studied
assessing the financial credibility of stock tweets intently within the literature, such features derived from the user have
been criticised in recent works (Alrubaian et al., 2018)(Stringhini et al.,
2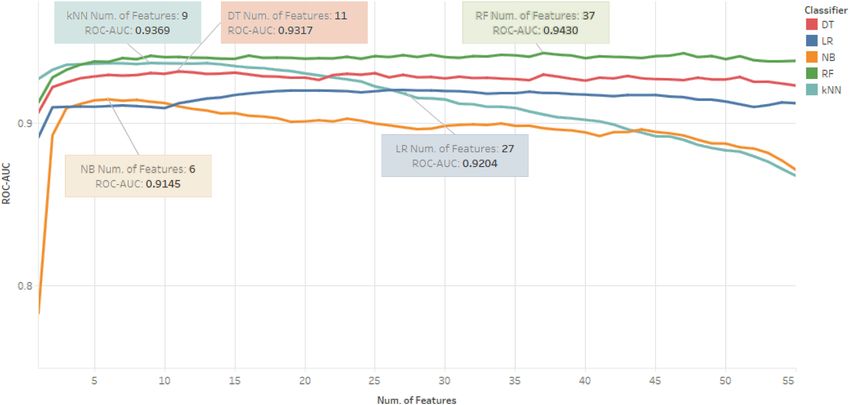
L. Evans et al. Expert Systems With Applications 168 (2021) 114351
Table 1
Related Supervised Research on Social Media Credibility.
Authors Year Num. of Microblog Posts Annotation Strategy Algorithm(s) Num. of Results
Labelled Used Features
Hassan et al., 2018 5,802 Team of journalists – 2 labels (credible and not RF 32 79.6% precision (RF)
(2018) credible) kNN
SVM
LR
NB
Ballouli et al., 2017 9,000 3 annotators RF 48 66.8 – 76.1% precision
(2017) 2 labels (credible and not credible) NB (RF)
SVM
Krzysztof et al., 2015 1,206 2 annotators SVM 12 84 – 89% precision (across
(2015) 4 labels (highly credible, highly non-credible, the 4 classes)
neutral, controversial)
F. Yang et al., 2012 5,155 2 annotators RF 19 74.4 – 76.3% precision
(2012) 2 labels (non-rumour and rumour)
C. Castillo et al., 2011 N/A – Tweets collected 7 annotators (from crowdsourcing) NB 30 89.1% precision
(2011) based on 2,500 topics 4 labels (almost certainly true, likely to be false, LR (weighted average)
almost certainly true, I can’t decide) RF
(RF – Random Forest, kNN – k-Nearest Neighbours, LR – Logistic Regression, NB – Naïve Bayes, SVM – Support Vector Machine)
Note: Results shown as based on the top-performing classifier.
2013), as features such as the number of followers a user has can be previous exposure to the domain in which they are being asked to give a
artificially inflated due to follower markets (De Micheli & Stroppa, credibility rating to, and as a result, may not be invested in providing
2013)(Cresci et al., 2015), indicating that feature could give a false good-quality annotations (Hsueh et al., 2009). Alrubaian et al. (2018)
indication of credibility. also argue that depending on the wisdom of the crowd is not ideal, since
Hassan et al. (2018) proposed a credibility detection model based on a majority of participants may be devoid of related knowledge, partic
machine learning techniques in which an annotated dataset based on ularly on certain topics which would naturally require prerequisite in
news events was annotated by a team of journalists. They proposed two formation (e.g. political events).
features groups – content-based features (e.g. length of the tweet text) Although much of the supervised work on tweet credibility has been
and source-based features (e.g. does the account have the default undertaken in an off-line (post-hoc) setting, some work has been un
Twitter profile picture?) – in which classifiers were trained on features dertaken on assessing the credibility of micro-blog posts in real-time as
from each of these groups, and then trained on the combined feature the tweets are published to Twitter. Gupta et al. (2014) developed a
groups. The results of this work showed that combining features from plug-in for the Google Chrome browser, which computes a credibility
both groups led to performance gains versus using each of the feature score for each tweet on a user’s timeline, ranging from 1 (low) to 7
sets independently. The authors, however, neglected to test that the (high). This score was computed using a semi-supervised algorithm,
performance between the two classifiers were statistically significant. trained on human labels obtained through crowdsourcing based on>45
A summary of the previous work involving supervised approaches to features. The response time, usability, and effectiveness were evaluated
assessing the credibility of microblog posts (Table 1) involves datasets on 5.4 million tweets. 63% of users of this plug-in either agreed with the
annotated by multiple annotators. Bountouridis et al. (2019) studied the automatically-generated score, as produced by the SVMRank algorithm
bias involved when annotating datasets in relation to credibility. They or disagreed by 1 or 2 points.
found that data biases are quite prevalent in credibility datasets. In
particular, external, population, and enrichment biases are frequent and 2.2. Feature selection for credibility assessment
that datasets can never be neutral or unbiased. Like other subjective
tasks, they are annotated by certain people, with a certain worldview, at Much of the related work mentioned does not report on how infor
a certain time, making certain methodological choices (Bountouridis mative each of the features are in their informative power to the clas
et al., 2019). Studies often employ multiple annotators when a task is sifiers, and simply just report the list of features and the overall metrics
subjective, choosing to take the majority opinion of the annotators to of the classifiers trained. Some of the features proposed previously in the
reach a consensus (Sujoy Sikdar, Kang, O’donovan, Höllerer, & Adal, literature could be irrelevant, resulting in poorer performance due to
2013; Castillo et al., 2011; Ballouli et al., 2017; Sikdar et al., 2014; overfitting (Rani et al., 2015). Due to much of the related work not
Krzysztof et al., 2015), with some work removing observations in which emphasising the importance of feature selection, this paper will attempt
a class cannot be agreed upon by a majority, or if annotators cannot to address this shortcoming by emphasising the importance of effective
decide upon any pre-determined label (Sujoy Sikdar, Kang, O’donovan, feature selection methods. We will report on which features are the most
& Höllerer, 2013; Gupta & Kumaraguru, 2012). deterministic, and which features are detrimental for assessing the
Several other studies (Sikdar et al., 2014; Odonovan et al., 2012; financial credibility of microblogging tweets.
Castillo et al., 2013) have focused on attempting to leverage the opinion As the aforementioned previous works have explored, features are
of a large number of annotators through crowdsourcing platforms such typically grouped up into different categories (e.g. tweet/content, user/
as Amazon’s Mechanical Turk1 and Figure Eight2 (formerly Crowd author) and a credibility classification is assigned to a tweet, or to the
Flower). As annotators from crowdsourcing platforms tend not to know author of the tweet. As a result of certain user features (e.g. number of
the message senders and likely do not have knowledge about the topic of followers a user has) being susceptible to artificial inflation, the meth
the message, their ratings predominantly rely on whether the message odology presented in this paper will assign a credibility to the tweet, and
text looks believable (Odonovan et al., 2012; Yang & Rim, 2014). Such not make assumptions of the user and their background. With the related
platforms introduce other issues, in that such workers may not have work on credibility assessment explored, the next section will present
the methodology for assessing the credibility of financial stock tweets.
1
https://www.mturk.com/
2
https://www.figure-eight.com/
3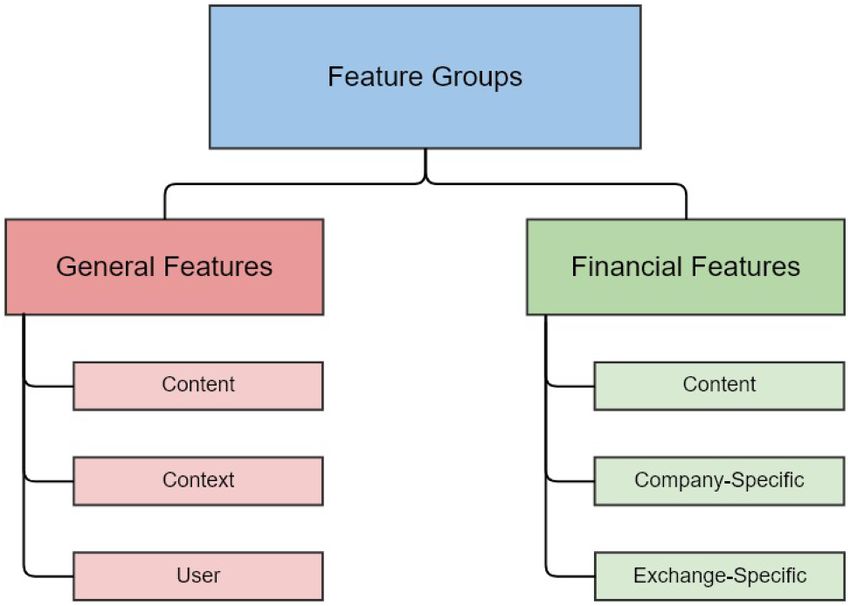
L. Evans et al. Expert Systems With Applications 168 (2021) 114351
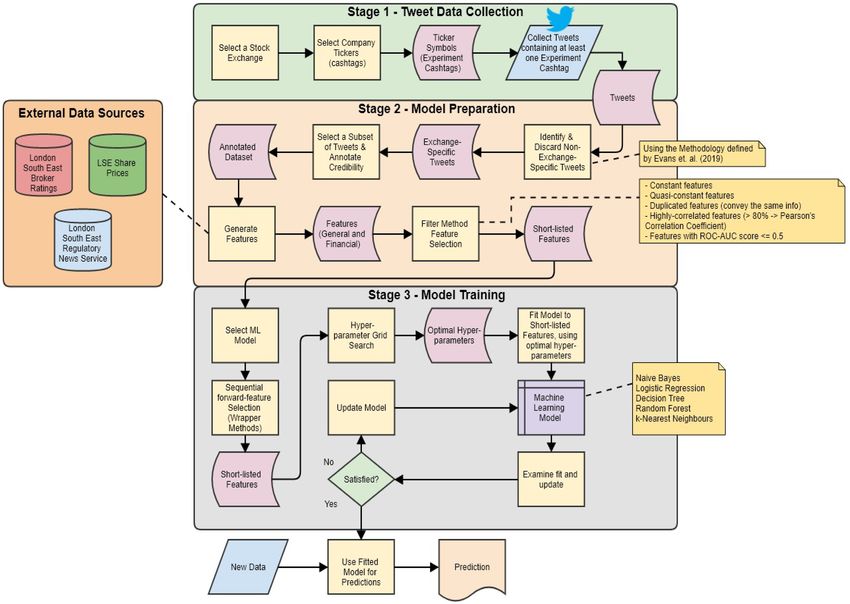
Fig. 1. Financial Credibility Assessment Methodology.
3. Methodology 3.1. Stage 1 – Data collection
Motivated by the success of supervised learning approaches in The first step of the data collection stage is to select a stock exchange
assessing the credibility of microblogging posts, we propose a method in which to collect stock tweets. Companies are often simultaneously
ology (Fig. 1) to assess the credibility of financial stock tweets (based on listed on multiple exchanges worldwide (Gregoriou, 2015), meaning
our definition of a stock tweet in Section 1). The methodology is statements made about a specific exchange-listed company’s share price
comprised of three stages – the first stage of the methodology involves may not be applicable to the entire company’s operations. A shortlist of
selecting a stock exchange in which to assess the credibility of financial company ticker symbols can then be created to collect tweets for. Tweets
stock tweets. With a stock exchange selected, a list of companies, and can be collected through the official Twitter API (specific details dis
their associated ticker symbols can then be shortlisted in which to collect cussed in Section 6.2). Once tweets have been collected for a given
tweets. The second stage involves preparing the data for training ma period for a shortlisted list of company ticker symbols (cashtags), tweets
chine learning classifiers by performing various feature selection tech can be further analysed to determine if the tweet is associated with a
niques, explained in detail in Section 5. The final stage is the model stock-exchange listed company – the primary goal of the second stage of
training stage, in which models are trained on different feature groups the methodology – discussed next.
with their respective performances being compared to ascertain if the
proposed financial features result in more accurate machine learning
models. This methodology will be validated by an experiment tailored 3.2. Stage 2 – Model preparation
for a specific stock exchange, explained further in Section 6. We now
explain the motivation for each of these stages below. The second stage is primarily concerned with selecting and gener
ating the features required to train the machine learning classifiers
(Section 4) and to perform a quick screening of the features to identify
those which are non-informative (e.g. due to being constant or highly-
correlated with other features). Before any features can be generated,
4
L. Evans et al. Expert Systems With Applications 168 (2021) 114351
3.3. Stage 3 – Model training
The final stage of the methodology involves further feature selection
techniques (discussed in Section 5) through repeated training of classi
fiers to discern optimal feature sets by adopting techniques such as
wrapper methods. Once an optimal feature subset has been identified,
the methodology proposes performing a hyperparameter grid search to
further improve the performance of the various classifiers. Although the
methodology proposes training traditional supervised classifiers, this list
is not exhaustive and can be adapted to include other supervised ap
proaches. The next section introduces the proposed general and finan
cial features to train the machine learning models.
4. Proposed features
Many of the general features (GF) we propose have been used in
previous work on the assessment of tweet credibility (Alrubaian et al.,
Fig. 2. Feature Subgroups. 2018). The full list of proposed features (both general and financial),
along with a description of each feature can be found in Appendix A. We
concede that not every feature proposed will offer an equal amount of
informative power to a classification model, and as a result, we do not
however, it is important to note that identifying and collecting tweets for attempt to justify each of the features in turn, but instead remove the
companies for a specific exchange is not always a straightforward task, feature(s) if they are found to be of no informative value to the classi
as we will now discuss in the next subsection. fiers. The general and financial feature groups, including their associ
ated sub-groups, are provided in Fig. 2.
3.2.1. Identification of stock exchange-specific tweets
The primary issue of collecting financial tweets is that any user can 4.1. General features (GF)
create their own cashtag simply by prefixing any word with a dollar
symbol ($). As cashtags mimic the company’s ticker symbol, companies The GF group is divided into three sub-groups – content, context, and
with identical symbols listed on different stock exchanges share the user. Content features are derived from the viewable content of the
same cashtag (e.g. $TSCO refers to Tesco PLC on the London Stock Ex tweet. Context features are concerned with information relating to how
change, but also the Tractor Supply Company on the NASDAQ). This has the tweet was created, including the date and time and source of the
been referred to as a cashtag collision within the literature, with pre tweet. User features are concerned with the author of the tweet. Each of
vious work (Evans et al., 2019) adopting trained classifiers to resolve these sub-groups will now be discussed further.
such collisions so that exchange-specific tweets can be identified, and
non-stock-related market tweets can be discarded. We utilise the 4.1.1. Content
methodology of (Evans et al., 2019) to ensure the collection of exchange- Content-derived features are features directly accessible from the
specific tweets and is considered a data cleaning step. Once a suitable tweet text or can be engineered from the tweet text. The features pro
subsample of tweets has been obtained after discarding tweets not posed in this group include the count of different keyword groups (e.g.
relating to the pre-chosen exchange, features can then be generated for noun, verb) and details of the URLs found within the tweet. Many of the
each of the observations. features within this group assists in the second dimension of financial
tweet credibility – how credible is the information within the tweet?
3.2.2. Dataset annotation
As supervised machine learning models are to be trained, a corpus of 4.1.2. Context
tweets must be annotated based on a pre-defined labelled system. As Features within the context sub-group include when the tweet was
discussed in the related work on supervised learning approaching for published to Twitter, in addition to extracting the number of live URLs
credibility assessment (Section 2.1), this is sometimes approached as a from the tweet. We argue that simply the presence of a URL should not
binary classification problem (i.e. the tweet is either credible or not be seen as a sign of credibility, as it could be the case that the URL is not
credible), with some work opting for more granularity of labels by active in the sense it redirects to a web server. The count of live URLs
incorporating labels to indicate the tweet does not have enough infor within the tweet (F27 - Table A1) involves visiting each of the URLs in
mation to provide a label in either direction. Section 6.3 includes a the tweet to establish if the URL is still live. We define a live URL as any
detailed overview of the annotation process undertaken for the experi URL which returns a successful response code (200). The number of
ment within this paper. popular URLs within the tweet, as determined by the domain popularity
ranking website, moz3.
3.2.3. Feature engineering and selection Tweets can be published to Twitter in a variety of ways – these can
After an annotated dataset has been obtained, the features can be typically be grouped into manual or automatic. Manual publishing
analysed through appropriate filter-based feature selection techniques methods involve the user manually publishing a tweet to Twitter,
in an attempt to reduce the feature space, which may result in more whereas automatic tweets are published based on rules and triggers
robust machine learning models (Rong et al., 2019). Such filter methods (Castillo et al., 2019), such as a specific time of the day. Many providers
include identifying constant or quasi-constant features, duplicated fea exist for the automatic publishing of content to Twitter (Saguna et al.,
tures which convey the same information, and features which are highly 2012), such as TweetDeck, Hootsuite, IFTTT. The Tweet Source feature
correlated with one another (Bommert et al., 2020). Section 5 provides a is encoded based on which approach was used to publish the tweet, as
detailed overview of each of the feature methods in this work. described in Table A1.
3
https://moz.com/top500
5
L. Evans et al. Expert Systems With Applications 168 (2021) 114351
Table 2 (summarised in Table 2) contains over 4,000 keywords and was ob
Financial Keyword Groups (as defined by (Loughran et al., 2011)). tained using standard financial texts. Each of the keyword categories is
Keyword Group Description Total Example Keywords transformed into its own respective feature (see F45-F49 in Table A2).
Group Number of There are other lexicons available which have been adapted for micro
Keywords in blogging texts (Oliveira et al., 2016; Houlihan & Creamer, 2019), which
Group
could be also be effective to this end. However, we elect to use the
Positive Positive in a financial 354 booming, delighted, lexicon constructed by Loughran et al. (2011) due to it being well-
setting encouraged, excited, established within the literature.
lucrative, meritorious,
strong, winner
Negative Negative in a financial 2355 abnormal, aggravated, 4.2.2. Company-specific
setting bankruptcy, bribe, Stock prices for exchange-listed companies are provided in open,
challenging, high, low, and close (OHLC) variants. These can either be specific to a
defamation, disaster
certain time window, such as every minute, or to a period such as a day.
Uncertainty Indicates uncertainty 297 anomalous, could,
fluctuation, probable, We propose two features which are engineered from these price variants
random – the range of the high and low price for the day (F50) the tweet was
Litigious Indicates litigious 904 claimholder, testify, made, and the range of the close and open price (F51).
action whistleblower, voided,
ruling, perjury
Constraining Words indicating 194 compel, depend,
4.2.3. Exchange-specific
constraints, (debt, indebted, mandate, Several of the FF proposed differ slightly depending on the stock
legal, employee, and pledge, prevent, exchange in question. The number of credible financial URLs in the
environmental) refrain, strict, tweet (F54) requires curating a list of URLs which are renowned as being
unavailable
a credible source of information. Several other features proposed (F55-
F56) involve establishing if the tweet was made when the stock ex
4.1.3. User change was open or closed – different stock exchanges have differing
Used extensively within the literature for assessing credibility opening hours, with some closing during lunch. The next section will
(Alrubaian et al., 2018), user features are derived or engineered from the discuss the feature selection techniques to be adopted by the
user authoring the tweet. This feature group assists with the third methodology.
dimension of financial tweet credibility – how credible is the author of
the tweet? The proposed user features to be used in the methodology 5. Feature selection
involve how long a user has been active on Twitter at the time a tweet
was published (F31) and details on their network demographic (fol Naturally, not each of the features proposed in Appendix A will
lower/following count). As discussed in Section 2.1, previous work provide informative power to all machine learning classifiers. It is,
(Morris et al., 2012) found that users possessing the default profile therefore, appropriate to perform appropriate feature selection tech
image were perceived as less credible. niques to assess how informative each of these features are. Sometimes,
a large number of features may lead to models which overfit, leading
them to reach false conclusions and negatively impact their performance
4.2. Financial features (FF)
(Arauzo-Azofra et al., 2011). Other benefits of feature selection include
improving interpretability and lowering the cost of data acquisition and
We now present an overview of the FF proposed for assessing the
handling, thus improving the quality of such models. It is also prudent to
financial credibility of stock tweets. FF are further divided into three
note that not every classifier will benefit from performing feature se
groups: content, company-specific, and exchange-specific. As discussed
lection. Decision trees, for instance, have a feature selection mechanism
in Section 1, the financial features proposed (Table A2) are novel in that
embedded within them where the feature importance is calculated as the
they have yet to be proposed in the literature. We hypothesise that the
decrease in node impurity weighted by the probability of reaching that
inclusion of such features will contribute to improved performance (over
node. The node probability can then be calculated by the number of
classifiers trained on general or financial features alone) when combined
samples that reach that node, divided by the total number of samples –
with the GF proposed in Section 4.1. Many of these features are
with higher values indicating the importance of the feature (Ronaghan,
dependent on external sources relating to the company corresponding to
2018). Random Forest classifiers also naturally share this mechanism of
the tweet’s cashtag (such as the range of the share price for that day),
feature selection. Other machine learning models often employ some
including the exchange in which the company is listed on (e.g. was the
kind of regularization that punish model complexity and drive the
stock exchange open when the tweet was published). These FF will now
learning process towards robust models by decreasing the less impactful
be discussed further, beginning with the features which can be derived
feature to zero and then dropping them (e.g. Logistic Regression with L1-
from the content of the tweet.
regularization) (Coelho & Richert, 2015).
4.2.1. Content
Although many sentiment keyword lists exist for the purpose of 5.1. Filter methods
assessing the sentiment of text, certain terms may be perceived differ
ently in a financial context. If word lists associate the terms mine, drug, Often used as a data pre-processing step, filter methods are based on
and death as negative, as some widely used lists do (Loughran & statistical tests which are performed prior to training machine learning
Mcdonald, 2016), then industries such as mining and healthcare will models. The goal of filter methods is to identify features which will not
likely be found to be pessimistic. Loughran et al. (2011) have curated offer much, or any, informative power to a machine learning model.
keyword lists which include positive, negative, and uncertainty key Such methods are aimed at finding features which are highly correlated
words in the context of financial communication. This keyword list or features which convey the exact same information (duplicated). Filter
6L. Evans et al. Expert Systems With Applications 168 (2021) 114351
Table 3 Table 4
Annotated Tweet Breakdown. Inter-Item Correlation Matrix & CA Scores for binary-labelled tweets. CA =
Label Meaning Count of Annotated Count when
0.591 (Sample size = 10).
Tweets Merged MA A1 A2 A3 CA if item deleted
0 Strong Not Credible 814 2134 MA 1.000 − 0.200 0.816 0.816 0.148
1 Not Credible 1320 A1 − 0.200 1.000 0.000 − 0.408 0.895
2 Ambiguous/Not enough 693 693 A2 0.816 0.000 1.000 0.583 0.179
Info A3 0.816 − 0.408 0.583 1.000 0.433
3 Fairly Credible 1020 2173
4 Very Credible 1153
Table 5
methods can be easily scaled to high-dimensional datasets, are compu Inter-Item Correlation Matrix & CA Scores for five-class labelled tweets. CA =
tationally fast and simple to perform, and are independent of the clas 0.699 (Sample size = 10).
sification algorithms to which they aim to improve (Tsai & Chen, 2019). MA A1 A2 A3 CA if item deleted
Different filter methods exist and perform differently depending on the
MA 1.000 − 0.061 0.722 0.827 0.443
dimensionality and types of datasets. A detailed overview of the A1 − 0.061 1.000 0.210 − 0.063 0.866
different types of filter methods available for high-dimensional classi A2 0.722 0.210 1.000 0.578 0.538
fication data can be found in (Bommert et al., 2020). A3 0.827 − 0.063 0.578 1.000 0.518
5.2. Wrapper methods
Table 6
Wrapper methods are also frequently used in the machine learning Inter-Item Correlation Matrix & CA Scores for three-class labelled tweets. CA =
process as part of the feature selection stage. This technique aims to find 0.686 (Sample size = 30).
the best subset of features according to a specific search strategy (Do MA A1 A2 A3 CA if item deleted
rado et al., 2019). Popular search strategies include sequential forward
MA 1.000 0.715 0.752 0.173 0.449
feature selection, sequential backward feature selection, and recursive A1 0.715 1.000 0.600 0.052 0.547
feature elimination. As such wrapper methods are designed to meet the A2 0.752 0.600 1.000 0.055 0.537
same objective – to reduce the feature space – any of these techniques A3 0.173 0.052 0.055 1.000 0.866
can be adopted to meet this end.
aggregator for financial news for the LSE for the dates covering the data
6. Experimental design
collection period.
In order to validate the credibility methodology (Section 3), an
experiment has been designed using tweets relating to companies listed 6.3. Tweet annotation
on the London Stock Exchange (LSE). This experiment will follow the
suggested steps and features proposed in the methodology for assessing After tweets containing at least one occurrence of an experiment
the financial credibility of tweets (Section 4.2). company’s cashtag, a subsample of 5,000 tweets were selected. We
began by attempting to retrieve 25 tweets for each experiment company
6.1. Company selection cashtag, this resulted in 3,874 tweets – tweets were then randomly
selected to reach a total of 5,000 tweets.
Before collection of the tweets can commence, the ticker symbols of As discussed in Section 2.1, subjective tasks such as annotating levels
companies need to be determined. The LSE is divided into two secondary of credibility can vary greatly depending on the annotators’ perceptions.
markets; the Main Market (MM), and the Alternative Investment Market Any dataset annotated by an individual which is then used to train a
(AIM). Each exchange-listed company belongs to a pre-defined industry: classifier will result in the classifier learning the idiosyncrasies of that
basic materials, consumer goods, consumer services, financials, health particular annotator (Reidsma and op den Akker, 2008). To alleviate
care, industrials, oil & gas, technology, telecommunications, and utili such concerns, we began by having a single annotator (referred herein as
ties. We have selected 200 companies (100 MM, 100 AIM) which have the main annotator – MA) provide labels for each tweet based on a five-
been listed on the LSE for at least two years (to give an optimal chance label system (Table 3). We then take a subsample (10) of these tweets
that tweets can be collected for that cashtag, and therefore the com and get the opinion of three other annotators who have had previous
pany), these companies are referred to as the experiment companies in experience with Twitter datasets, to ascertain the inter-item correlation
the rest of this paper and can be viewed in Appendix B. between the annotations. To assess the inter-item correlation, we
compute the Cronbach’s Alpha (CA) (Eq. (1)) of the four different an
6.2. Data collection notations for each of the tweets.
Nc
Twitter provides several ways to collect tweets. The first is from α= (1)
v + (N − 1)c
Twitter’s Search API, which allows the collection of tweets from up to a
week in the past for free. Another way is to use the Twitter Streaming where N is the number of items, c is the average inter-item covariance
API (Nguyen et al., 2015), allowing the real-time collection of tweets. among the items and v is the average variance. A Cronbach score of >0.7
We have collected tweets containing at least one occurrence of a cashtag infers a high agreement between the annotators (Landis & Koch, 1977).
of an experiment company. In total, 208,209 tweets were collected over The CA for the binary labelled tweets (Table 4) – 0.591 – shows that the
a one-year period (15/11/19 – 15/11/20). Several of the features pro four annotators were unable to reach a consensus as to what constitutes
posed in Appendix A require that the data be retrieved from external a credible or not credible tweet. The CA for the five-label system
APIs. The daily share prices for each experiment company has been (Table 5) – 0.699 – shows that annotators were able to find a more
collected from AlphaVantage for the date. Broker ratings and dates in consistent agreement, although it did not meet the threshold of consti
which Regulatory News Service notices were given have been web tuting a high agreement. A further experiment involving a three-label
scraped from London South East, a website which serves as an scale (not credible, ambiguous, and credible), with a larger sample
7L. Evans et al. Expert Systems With Applications 168 (2021) 114351
Fig. 3. Top Four Features based on Macro-AUC.
size of 30 tweets, was then performed to assess the annotators’ agree
Table 7 ment on such a scale. In each of these experiments, it is clear that if the
Non-Informative Features. CA is computed with the MA removed, it results in the greatest decrease
Feature Selection Description Features Identified in the CA score – indicating the majority of the annotators’ opinions are
Technique mostly aligned to that of the MA. Although none of these experiments
Constant features Features which are constant Tweet contains pos results in a CA of > 0.7, we seek to find a consensus with the majority
among all observations emoticons annotators, provided that the MA is not in the minority. The highest CA
Tweet contains neg score (from the majority − 3) comes from the binary-labelled system, in
emoticons
which if A1 is removed, the CA becomes 0.895, indicating the MA, A2
Quasi-constant Features which are constant Tweet contains multiple
features amongst almost all question marks and A3 have reached a consensus on annotating credibility. A binary
observations. Tweet contains exclamation label approach, however, does not offer the granularity which is often
mark achieved versus a multiclass approach. As the five-class system has a
Tweet contains exclamation
significant class imbalance when taking into consideration the individ
Count of second-person
pronouns
ual classes (814 strong not credible vs 1320 not credible tweets), We
User is verified have elected to adopt the three-class approach which combines the two
Tweet is a quote tweet not-credible classes and the two credible classes, and to ensure that
Contains media ambiguous tweets can be taken into consideration (Table 6).
Interjection word count
Constraining keyword
count
Duplicated Features which convey the None 6.4. Assessing feature importance
features same information
Highly-correlated Features with a Pearson’s User has non-fictional As discussed in Section 5, assessing the informative power of each of
features correlation coefficient of > 0.8 location
the features in isolation can help remove features which will not posi
Is RT
Tweet Length (Words) tively affect the performance of the machine learning classifiers. To this
Username word count end, for each feature, a Decision Tree (DT) classifier has been trained to
Univariate ROC- Features which have a ROC- Financial CTs assess the importance of the feature when predicting each of the classes.
AUC score AUC score close to random Technology CTs The metric used to calculate the importance of each feature is the
chance Telecommunication CTs
probability returned from the DT. We then calculate the total area under
the curve (AUC) for the feature. Naturally, the AUC can only be
computed for a binary classification problem. In order to calculate the
8L. Evans et al. Expert Systems With Applications 168 (2021) 114351
AUC for a multi-class problem, the DT classifier, which is capable of
94.3
producing an output y = {0, 1, 2}, is converted into three binary clas
AUC
91.4
92.0
93.1
93.6
sifiers through a One-Vs-Rest approach (Ambusaidi et al., 2016). Each of
the AUC scores for the three binary classifiers, for each feature, can then
be calculated to ascertain the feature’s predictive power for each class.
93.7
85.1
86.9
90.0
92.9
F1
The AUC score can be computed in different ways for a multiclass
classifier: the macro average computes the metric for each class inde
pendently before taking the average, whereas the micro average is the
93.2
85.6
86.8
90.0
92.5
Rec
traditional mean for all samples (Aghdam et al., 2009). Macro-averaging
treats all classes equally, whereas micro-averaging favours majority
classes. We elect to judge the informative power of the feature based on
94.3
84.9
87.1
90.1
93.6
Pre
its AUC macro average, due to ambiguous tweets being relatively more
uncommon than credible and not credible tweets. Four of the features
General + Financial Features
(Fig. 3) exhibit a macro AUC score of > 0.8, indicating they will likely
93.5
85.6
87.6
89.7
92.7
Acc
offer a great degree of informative power when used to train machine
learning classifiers. These four features are all contained within the
general group and are attributed to the user of the tweet, and is
Features (/55)
consistent with previous work (Yang et al., 2012) which found that user
37 (12FF)
27 (9FF)
11 (3FF)
attributes to be incredibly predictive of credibility.
6 (2FF)
9 (2FF)
The filter methods outlined in the methodology (Fig. 1), have been
applied to the annotated dataset (5,000 tweets). Based on these five
different filter method feature selection techniques, 18 features
AUC
70.4
64.0
63.1
70.9
71.1
(Table 7) have been identified to provide no meaningful informative
power based on the probability returned from the DT.
With the informative and non-informative features indentified, ma
59.7
43.0
43.0
60.4
60.8
chine learning classifiers can now be trained on an optimal feature set.
F1
The 18 non-informative features identified have been dropped due to the
reasons outlined in Table 7.
60.3
50.7
49.6
60.9
61.3
Rec
7. Experimental results & discussion
63.9
40.8
55.1
63.1
64.0
We now present the results (Table 8) obtained from the experiment
Pre
based on all of the features after the non-informative features are
removed (34 GF, 21 FF), and illustrate that some models’ performance
61.0
55.9
54.2
61.9
61.5
Acc
suffers if feature selection techniques are not taken into consideration.
We have trained classifiers which have demonstrated previous success in
Financial Features
assessing the credibility of microblog messages (Naïve Bayes, k-Nearest
Features (/21)
Neighbours, Decision Trees, Logistic Regression, and Random Forest)
(Alrubaian et al., 2018). All of the results obtained are a result of 10-fold
cross-validation using an 80/20 train/test split and implemented using
12
10
11
the scikit-learn library within Python. Each of the classification models
9
7
underwent a grid search to find optimal hyperparameters. Three sets of
classifiers have been trained; (1) trained on the GF, (2) trained on the FF,
AUC
89.1
90.5
92.6
93.8
93.2
and (3) trained on both sets of features.
As indicated by the results of the sequential feature selection (Fig. 4),
the kNN and NB classifiers suffer clear decreases in their performance
85.0
85.3
90.5
92.9
91.6
F1
when more features are added to the feature space due to the well-
Note: Scores presented are the macro average percentage (%).
documented phenomenon of the curse of dimensionality (Parmezan
et al., 2017). DT, RF, and LR, also suffer minor decreases, although, due
85.5
86.0
90.4
92.6
91.1
Rec
to the nature of these three algorithms, they are less impacted. Based on
the AUC, the RF classifier is the top-performing classifier when trained
on the GF and FF sets respectively. Clearly, classifiers trained solely on
84.8
84.6
90.6
93.1
92.3
Pre
the FF pale in performance when compared to classifiers trained on the
other feature sets. Regarding RQ1, GF by themselves are extremely
informative for assessing the credibility classification of tweets. When
85.5
88.0
90.1
92.7
91.4
Acc
combined with FF (RQ2), performance gains are evident in all of the
classifiers trained on the combined feature sets. The importance of
General Features
feature selection is particularly prevalent for the kNN classifier, which
Features (/34)
reaches its zenith at 9 features and almost outperforms the RF when both
are compared at such a feature space size. In terms of which FFs were
seen to be informative, the RF trained on the combined features utilised
21
18
20
Classifier Results.
4
7
12 financial features, which included; F46, F55, F56, F58, and 8xF59+).
In respect to the five classifiers trained on the combined features, the
Classifier
most popular FFs utilised by the classifiers were the count of cashtags in
Table 8
the tweet (F58), and the count of technology and healthcare cashtags
kNN
NB
DT
RF
LR
within the tweet (2xF59+).
9L. Evans et al. Expert Systems With Applications 168 (2021) 114351
Fig. 4. Sequential Forward Feature Selection Results (Combined features).
As evident from the initial experiment results, RF appears to be the stock movements of the cashtags contained in the tweet. This would be
best performing classifier when the feature sets are combined. We now most beneficial if attempting to classify user credibility – does a user
test if the differences between the predictions of the RF trained on GF often tweet information about stock-listed companies which turned out
versus the RF trained on the combined features are statistically signifi to be true? Adopting a lexicon which has been constructed based on
cant by conducting the Stuart-Maxwell test. The Stuart-Maxwell test is financial microblog texts, such as the one constructed by (Oliveira et al.,
an extension to the McNemar test, used to assess marginal homogeneity 2016) could yield improved results when assessing tweet credibility, this
in independent matched-pair data, where responses are allowed more is an avenue for future work.
than two response categories (Yang et al., 2011). The p-value of the As discussed in section 3.3, the list of supervised classifiers in this
Stuart-Maxwell test on the predictions of both the RF trained on GF and work is not exhaustive, Support Vector Machines (SVM) were included
the RF trained on the combined features is 0.0031, indicating the dif in the list of classifiers to be trained, but performing hyperparameter
ference between the two classifiers are statistically significant. grid searches were extremely computationally expensive and were
abandoned due to the unsuitability of comparing the SVM classifier with
8. Conclusion no hyperparameter tuning to that of models which had undergone
extensive hyperparameter tuning. Future work in this regard would
This paper has presented a methodology for assessing the credibility include the SVM to assess its predictive power in classifying the credi
of financial stock tweets. Two groups of features were proposed, GF bility of financial stock tweets, with neural network architectures also
widely used within the literature and a domain-specific group specific to being considered. The credibility methodology presented in this paper
financial stock tweets. Before the training of classifiers, feature selection will be utilised in the future by a smart data ecosystem, with the intent of
techniques were used to identify non-informative features. Based on the monitoring and detecting financial market irregularities.
two groups of features (general and financial), three sets of classifiers
were trained, with the first two groups being the set of general and FF CRediT authorship contribution statement
respectively, and the third being the combination of the two. Perfor
mance gains were noted in the machine learning classifiers, with some Lewis Evans: Conceptualization, Methodology, Software, Valida
classifiers (NB and kNN) suffering when their respective feature spaces tion, Formal analysis, Investigation, Data curation, Writing - original
grew, undoubtedly due to the curse of dimensionality. Although the RF draft, Writing - review & editing, Visualization. Majdi Owda: Concep
classifiers were certainly the best performing classifiers in respect to the tualization, Methodology, Validation, Writing - review & editing, Su
AUC, it is important to note that the kNN classifier trained on the pervision, Project administration. Keeley Crockett: Conceptualization,
combined feature set was also a formidable classifier due to its Methodology, Validation, Writing - review & editing, Supervision,
comparative performance with the RF classifiers without having to take Project administration. Ana Fernandez Vilas: Conceptualization,
into account as many features (9 features compared to 37 for RF). The Methodology, Validation, Writing - review & editing, Supervision,
number of dependent features for the RF classifier presents some limi Project administration.
tations for deploying a model dependent on a larger number of features,
some of which are more computationally to obtain than others. The
count of live URLs within the tweet (F27) requires querying each URL in Declaration of Competing Interest
the tweet, which can be computationally expensive to generate the
feature if a tweet contains multiple URLs. Establishing the computa The authors declare that they have no known competing financial
tional cost of features such as the count of live URLs in a tweet and to interests or personal relationships that could have appeared to influence
assess their suitability in a real-time credibility model is an interesting the work reported in this paper.
avenue for future work. There are other features which could be engi
neered by querying external APIs such as historical stock market values Appendix A
and ascertaining if the tweet contains credible information regarding
Table A1
10L. Evans et al. Expert Systems With Applications 168 (2021) 114351
Table A1
Feature Sub- Feature Feature Notes
Group Num.
Content 1 Tweet Length (Chars) Length of the tweet in characters (including spaces)
2 Tweet Length (Words) Length of the tweet in words
3 Tweet Contains Question Mark Does the tweet contain a question mark
(QM)
4 Tweet Contains Multiple QMs Does the tweet contain multiple question marks
5 Tweet Contains Exclamation Does the tweet contain an exclamation mark
Mark (EM)
6 Tweet Contains Multiple EMs Does the tweet contain multiple exclamation marks
7 Tweet Contains First Person e.g. I, we, us, me, my, mine, our, ours
Pronouns
8 Tweet Contains Second Person e.g. you, your, yours
Pronouns
9 Tweet Contains Third Person e.g. he, she, her, him, it, they, them, theirs
Pronouns
10 Tweet Contains Positive e.g. :), :-)
Emoticons
11 Tweet Contains Negative e.g. :(, :-(
Emoticons
12 Tweet Contains User Mention Does the tweet contain an @ user mention
13 Tweet Hashtag Count The count of word prefixed with a hashtag (#) as determined by the tweet JSON object
14 Is Retweet (RT) Contains RT at the start of the tweet text
15 URL Count The count of URLs within the tweet
16 Per cent Uppercase The percentage of the tweet which is in UPPERCASE
17 Is Quote Tweet If the tweet is quoting (e.g. replying) to another tweet
18 Contains Media Contains an image, video or gif
19 Present Verb Count Count of verbs in present tense within the tweet text
20 Past Verb Count Count of verbs in past tense within the tweet text
21 Adjective Count Count of adjectives within the tweet text
22 Interjection Count Count of interjections within the tweet text
23 Noun Count Count of nouns within the tweet text
24 Adverb Count Count of adverbs within the tweet text
25 Proper Noun Count Count of proper nouns within the tweet text
26 Numerical Cardinal Count Count of numerical cardinal values within the tweet text
Context 27 Live URL Count The count of URLs in the tweet which resulted in a successful web response (2 0 0)
28 Tweeted on Weekday If the tweet was tweeted on a weekday
29 Top 500 URL Count As defined by https://moz.com/top500
30 Tweet Source 0 – Official Twitter Web Client1 – Twitter for Android2 – Twitter for iPhone3 – Automated Tool (e.g. Zapier,
IFTTT, Hootsuite, TweetDeck)4 – Other
User 31 User Account Age (at time of The number of days an account has been active on the Twitter platform from when the tweet was published to
tweet) Twitter
32 User has URL on Profile Does the user have a URL on their profile?
33 User has Default Profile Pic Is the user using the default profile image provided by Twitter upon registering their account
34 User has set a Location Has the user set a location on their profile?
35 User Verified Is the user a verified user (blue tick verification seal)?
36 User Num of Tweets The number of tweets the user has made (at the time the tweet was collected)
37 User Follower Count The number of followers the user’s account has
38 User Following Count The number of accounts the user is following
39 User Listed Count How many lists is the user account’s listed on?
40 User has Desc Does the user have a description on their profile page?
41 User Description Length The length of the user description, 0 if none
42 User has Real Location Does the user have a factual location?
43 Username Length Length of the user’s username
44 Username Words The number of words comprising the user name
11You can also read