Fundamental Analysis - Part 2 - ZERODHA - ZERODHA.COM/VARSITY
←
→
Page content transcription
If your browser does not render page correctly, please read the page content below
ZERODHA

 Fundamental
Analysis - Part 2
     ZERODHA.COM/VARSITY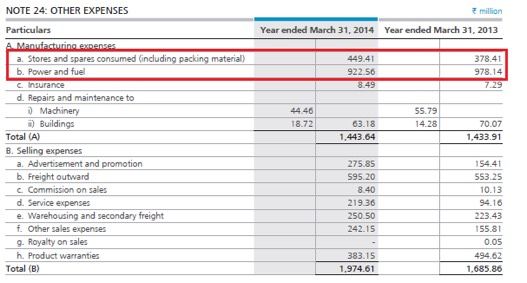
TABLE OF CONTENTS

 9     The Financial Ratio Analysis                                1
9.1    A note on Financial Ratios                                  1
9.2    The Financial Ratios                                        2
9.3    The Profitability Ratios                                    4

10     The Financial Ratio Analysis (Part 2)                      15
10.1 The Leverage Ratios                                           15
10.2 Operating Ratios                                             19

11     The Financial Ratio Analysis (Part 3)                      31
11.1   The Valuation Ratio                                        31
11.2 The Index Valuation                                          36

12     The Investment Due Diligence                               40
12.1 Taking stock                                                 40
12.2 Generating a stock idea                                      41
12.3 The Moat                                                     43
12.4 The Due Diligence                                            44

13     Equity Research                                            48
13.1   What to expect?                                            48
13.2 Stock price vs Business Fundamentals                         48
13.3 Understanding the Business                                   49
13.4 Application of the checklist                                 52

14     DCF Primer                                                 61

                                                  zerodha.com/varsity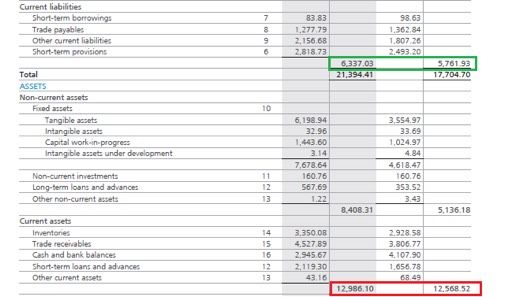
14.1 The Stock Price                                               61
14.2 The future cash flow                                          62
14.3 Time value of money (TMV)                                     64
14.4 The Net Present values of cash flows                          65

15     Equity Research (Part 2)                                    68
15.1   Getting started with the DCF Analysis                       68
15.2 The Cash flow                                                 69
15.3 The Terminal Value                                            72
15.4 The Net Present value (NPV)                                   73
15.5 The Share price                                               74
15.6 Modeling error and the intrinsic value band                   75
15.7 Spotting the buying opportunities                             77
15.8 Conclusion                                                    78

16     The Finale                                                  80
16.1 The follies of the DCF Analysis                               80
16.2 Margin of safety                                              81
16.3 When to sell ?                                                82
16.4 How many stocks in the portfolio?                             83
16.5 Conclusion                                                    83

                                                   zerodha.com/varsity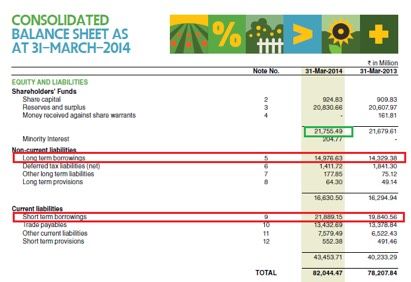
C H A PT E R 1

   The Financial Ratio Analysis
            (Part 1)
9.1 – A note on Financial Ratios
Over the last few chapters we have understood how to read the financial statements. We will now
focus our attention on analyzing these financial statements. The best way to analyze the financial
statements is by studying the ‘Financial Ratios’. The theory of financial ratios was made popular
by Benjamin Graham, who is popularly known as the father of fundamental analysis. Financial ra-
tios help in interpreting the results, and allows comparison with previous years and other compa-
nies in the same industry.

A typical financial ratio utilizes data from the financial statement to compute its value. Before we
start understanding the financial ratios, we need to be aware of certain attributes of the financial
ratios.

On its own merit, the financial ratio of a company conveys very little information. For instance,
assume Ultratech Cements Limited has a profit margin of 15%, how useful do you think this infor-
mation is? Well, not much really. 15% profit margin is good, but how would I know if it is the best?

However, assume you figure out ACC Cement’s profit margin is 12%. Now, as we comparing two
similar companies, comparing the profitability makes sense. Clearly, Ultratech Cements Limited
seems to be a more profitable company between the two. The point that I am trying to drive
across is that more often than not, Financial Ratios on its own is quite mute. The ratio makes
sense only when you compare the ratio with another company of a similar size or when you look
into the trend of the financial ratio. This means that once the ratio is computed the ratio has to be
analyzed (either by comparison or tracking the ratio’s historical trend) to get the best possible in-
ference.

Also, here is something that you need to be aware off while computing ratios. Accounting policies
may vary across companies and across different financial years. A fundamental analyst should be
cognizant of this fact and should adjust the data accordingly, before computing the financial ra-
tio.

                                                 1                          zerodha.com/varsity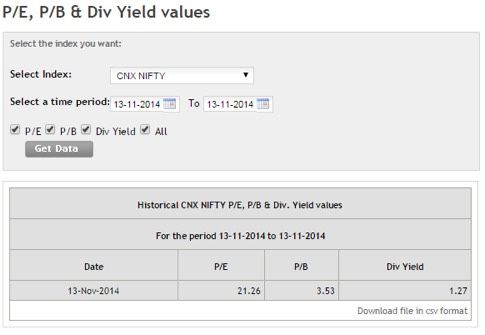
9.2 – The Financial Ratios
Financial ratios can be ‘somewhat loosely’ classified into different categories, namely –

     1. Profitability Ratios
     2. Leverage Ratios
     3. Valuation Ratios
     4. Operating Ratios

The Profitability ratios help the analyst measure the profitability of the company. The ratios
convey how well the company is able to perform in terms of generating profits. Profitability of
a company also signals the competitiveness of the management. As the profits are needed for
business expansion and to pay dividends to its shareholders a company’s profitability is an im-
portant consideration for the shareholders.

The Leverage ratios also referred to as solvency ratios/ gearing ratios measures the com-
pany’s ability (in the long term) to sustain its day to day operations. Leverage ratios measure
the extent to which the company uses the debt to finance growth. Remember for the company
to sustain its operations, it has to pay its bills and obligations. Solvency ratios help us under-
stand the company’s long term sustainability, keeping its obligation in perspective.

                                                  2                         zerodha.com/varsity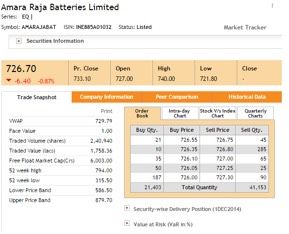
The Valuation ratios compare the stock price of the company with either the profitability of the
company or the overall value of company to get a sense of how cheap or expensive the stock is
trading. Thus this ratio helps us in analyzing whether the current share price of the company is
perceived as high or low. In simpler words, the valuation ratio compares the cost of a security
with the perks of owning the stock.

The Operating Ratios, also called the ‘Activity Ratios’ measures the efficiency at which a busi-
ness can convert its assets (both current and non current) into revenues. This ratio helps us under-
stand how efficient the management of the company is. For this reason, Operating Ratios are
sometimes called the ‘Management Ratios’.

Strictly speaking, ratios (irrespective of the category it belongs to) convey a certain message, usu-
ally related to the financial position of the company. For example, ‘Profitability Ratio’ can convey
the efficiency of the company, which is usually measured by computing the ‘Operating Ratio’. Be-
cause of such overlaps, it is difficult to classify these ratios. Hence the ratios are ‘somewhat
loosely’ classified.

                                                 3                          zerodha.com/varsity
9.3 – The Profitability Ratios
We will look into the following ratios under ‘The Profitability Ratio’:

     1. EBITDA Margin (Operating Profit Margin)
           • EBITDA Growth (CAGR)
     2. PAT Margin
           • PAT Growth (CAGR)
     3. Return on Equity (ROE)
     4. Return on Asset (ROA)
     5. Return on Capital Employed (ROCE)

EBITDA Margin:

The Earnings before Interest Tax Depreciation & Amortization (EBITDA) Margin indicates the
efficiency of the management. It tells us how efficient the company’s operating model is. EBITDA
Margin tells us how profitable (in percentage terms) the company is at an operating level. It al-
ways makes sense to compare the EBITDA margin of the company versus its competitor to get a
sense of the management’s efficiency in terms of managing their expense.

In order to calculate the EBITDA Margin, we first need to calculate the EBITDA itself.

EBITDA = [Operating Revenues – Operating Expense]

Operating Revenues = [Total Revenue – Other Income]

Operating Expense = [Total Expense – Finance Cost – Depreciation & Amortization]

EBIDTA Margin = EBITDA / [Total Revenue – Other Income]

Continuing the example of Amara Raja Batteries Limited, the EBITDA Margin calculation for the
FY14 is as follows:

We first calculate EBITDA , which is computed as follows:

[Total Revenue – Other Income] – [Total Expense – Finance Cost – Depreciation & Amortization]

                                                  4                         zerodha.com/varsity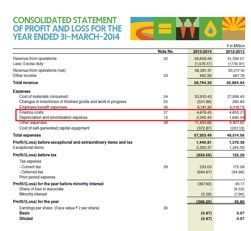
Note: Other income is income by virtue of investments and other non operational activity. Includ-
ing other income in EBITDA calculation would clearly skew the data. For this reason, we have to
exclude Other Income from Total Revenues.

[3482 – 46] – [2942 – 0.7 – 65]

= [3436] – [2876]

= 560 Crores

Hence the EBITDA Margin is:

560 / 3436

= 16.3%

I have two questions for you at this stage:

     1. What does an EBITDA of Rs.560 Crs and an EBITDA margin of 16.3% indicate?
     2. How good or bad an EBITDA margin of 16.3% is?
The first question is a fairly simple. An EBITDA of Rs.560 Crs means that the company has retained
Rs.560 Crs from its operating revenue of Rs.3436 Crs. This also means out of Rs.3436 Crs the com-
pany spent Rs.2876 Crs towards its expenses. In percentage terms, the company spent 83.7% of
its revenue towards its expenses and retained 16.3% of the revenue at the operating level, for its
operations.

Now for the 2nd question, hopefully you should not have an answer.

Remember we did discuss this point earlier in this chapter. A financial ratio on its own conveys
very little information. To make sense of it, we should either see the trend or compare it with its
peers. Going with this, a 16.3% EBITDA margin conveys very little information.

To makes some sense of the EBITDA margin, let us look at Amara Raja’s EBITDA margin trend for
the last 4 years, (all numbers in Rs Crs, except EBITDA margin):

     Year       Operating Revenues        Operating Expense          EBITDA      EBITDA Margin
     2011                 1761                       1504              257            14.6%
     2012                 2364                       2025              340            14.4%
     2013                 2959                       2508              451            15.2%
     2014                 3437                       2876              560            16.3%

                                                 5                           zerodha.com/varsity
It appears that ARBL has maintained its EBITDA at an average of 15%, and in fact on a closer look
it is clear the EBITDA margin is increasing. This is a good sign as it shows consistency and effi-
ciency in the management’s operational capabilities.
In 2011 the EBITDA was Rs.257 Crs and in 2014 the EBITDA is Rs.560 Crs. This translates to a 4 year
EBITDA CAGR growth of 21%.
Please note, we have discussed the formula for CAGR in module 1.
Clearly, it appears that both EBITDA margin and EBITDA growth are quite impressive. However we
still do not know if it is the best. In order to find out if it is the best one needs to compare these
numbers with its competitors. In case of ARBL it would be Exide batteries Limited. I would encour-
age you to do the same for Exide and compare the results.
PAT Margin:
While the EBITDA margin is calculated at the operating level, the Profit After Tax (PAT) margin is
calculated at the final profitability level. At the operating level we consider only the operating ex-
penses however there are other expenses such as depreciation and finance costs which are not
considered. Along with these expenses there are tax expenses as well. When we calculate the PAT
margin, all expenses are deducted from the Total Revenues of the company to identify the overall
profitability of the company.
PAT Margin = [PAT/Total Revenues]
PAT is explicitly stated in the Annual Report. ARBL’s PAT for the FY14 is Rs.367 Crs on the overall
revenue of Rs.3482 Crs (including other income). This translates to a PAT margin of:
= 367 / 3482
=10.5 %
Here is the PAT and PAT margin trend for ARBL:
Year PAT (in INR Crs) PAT Margin
2011 148 8.4%
2012 215 8.9%
2013 287 9.6%
2014 367 10.5%
6 zerodha.com/varsityThe PAT and PAT margin trend seems impressive as we can clearly see a margin expansion. The 4
year CAGR growth stands at 25.48 %, which is again good. Needless to say, it always makes sense
to compare ratios with its competitors.
Return on Equity (RoE):
The Return on Equity (RoE) is a very important ratio, as it helps the investor assess the return the
shareholder earns for every unit of capital invested. RoE measures the entity’s ability to generate
profits from the shareholders investments. In other words, RoE shows the efficiency of the com-
pany in terms of generating profits to its shareholders. Obviously, higher the RoE, the better it is
for the shareholders. In fact this is one of the key ratios that helps the investor identify investable
attributes of the company. To give you a perspective, the average RoE of top Indian companies
vary between 14 – 16%. I personally prefer to invest in companies that have a RoE of 18% up-
wards.
This ratio is compared with the other companies in the same industry and is also observed over
time.
Also note, if the RoE is high, it means a good amount of cash is being generated by the company,
hence the need for external funds is less. Thus a higher ROE indicates a higher level of manage-
ment performance.
RoE can be calculated as: [Net Profit / Shareholders Equity* 100]
There is no doubt that RoE is an important ratio to calculate, but like any other financial ratios it
also has a few drawbacks. To help you understand its drawbacks, consider this hypothetical ex-
ample.
Assume Vishal runs a Pizza store. To bake pizza’s Vishal needs an oven which costs him
Rs.10,000/-. Oven is an asset to Vishal’s business. He procures the oven from his own funds and
seeks no external debt. At this stage you would agree on his balance sheet he has a shareholder
equity of Rs.10,000 and assets equivalent to Rs.10,000.
Now, assume in his first year of operation, Vishal generates a profit of Rs.2500/-. What is his RoE?
This is quite simple to compute:
RoE = 2500/10000*100
=25.0%.
7 zerodha.com/varsityNow let us twist the story a bit. Vishal has only Rs.8000/- he borrows Rs.2000 from his father to
purchase an oven worth Rs.10000/-. How do you think his balance sheet would look?
On the liability side he would have:
Shareholder Equity = Rs.8000
Debt = Rs.2000
This makes Vishal’s total liability Rs. 10,000. Balancing this on the asset side, he has an asset
worth Rs.10,000. Let us see how his RoE looks now:
RoE = 2500 / 8000*100
= 31.25%
With an additional debt, the RoE shot up quite significantly. Now, what if Vishal had only Rs.5000
and borrowed the additional Rs.5000 from his father to buy the oven. His balance sheet would
look like this:
On the liability side he would have:
Shareholder Equity = Rs.5000
Debt = Rs.5000
Vishal’s total liability is Rs. 10,000. Balancing this on the asset side, he has an asset worth
Rs.10,000. Let us see how his RoE looks now:
RoE = 2500 / 5000 *100
=50.0%
Clearly, higher the debt Vishal seeks to finance his asset, (which in turn is required to generate
profits) higher is the RoE. A high RoE is great, but certainly not at the cost of high debt. The prob-
lem is with a high amount of debt, running the business gets very risky as the finance cost in-
creases drastically. For this reason inspecting the RoE closely becomes extremely important. One
way to do this is by implementing a technique called the ‘DuPont Model’ also called DuPont
Identity.
8 zerodha.com/varsityThis model was developed in 1920’s by the DuPont Corporation. DuPont Model breaks up the RoE
formula into three components with each part representing a certain aspect of business. The Du-
Pont analysis uses both the P&L statement and the Balance sheet for the computation.
The RoE as per DuPont model can be calculated as:
If you notice the above formula, the denominator and the numerator cancels out with one an-
other eventually leaving us with the original RoE formula which is:
RoE = Net Profit / Shareholder Equity *100
However in the process of decomposing the RoE formula, we gained insights into three distinct
aspects of the business. Let us look into the three components of the DuPont model that makes
up the RoE formula :
๏ Net Profit Margin = Net Profits/ Net Sales*100
This is the first part of the DuPont Model and it expresses the company’s ability to generate
profits. This is nothing but the PAT margin we looked at earlier in this chapter. A low Net
profit margin would indicate higher costs and increased competition.
๏ Asset Turnover = Net Sales / Average Total asset
Asset turnover ratio is an efficiency ratio that indicates how efficiently the company is using
its assets to generate revenue. Higher the ratio, it means the company is using its assets
more efficiently. Lower the ratio, it could indicate management or production problems.
The resulting figure is expressed as number of times per year.
๏ Financial Leverage = Average Total Assets / Shareholders Equity
Financial leverage helps us answer this question – ‘For every unit of shareholders equity,
how many units of assets does the company have’. For example if the financial leverage is 4,
this means for every Rs.1 of equity, the company supports Rs.4 worth of assets. Higher the
financial leverage along with increased amounts of debt, will indicate the company is highly
leveraged and hence the investor should exercise caution. The resulting figure is expressed
as number of times per year.
As you can see, the DuPont model breaks up the RoE formula into three distinct components,
with each component giving an insight into the company’s operating and financial capabilities.
9 zerodha.com/varsityLet us now proceed to implement the DuPont Model to calculate Amara Raja’s RoE for the FY 14.
For this we need to calculate the values of the individual components.
Net Profit Margin: As I mentioned earlier, this is same as the PAT margin. From our calculation
earlier, we know the Net Profit Margin for ARBL is 9.2%
Asset Turnover = Net Sales / Average Total assets
We know from the FY14 Annual Report, Net sales of ARBL stands at Rs.3437 Crs.
The denominator has Average Total Assets which we know can be sourced from the Balance
Sheet. But what does the word ‘Average’ indicate?
From ARBL’s balance sheet, the total asset for FY14 is Rs.2139Crs. But think about this, the re-
ported number is for the Financial Year 2014, which starts from 1st of April 2013 and close on 31st
March 2014. This implies that at the start of the financial year 2014 (1st April 2013), the company
must have commenced its operation with assets that it carried forward from the previous finan-
cial year (FY 2013). During the financial year (FY 2014) the company has acquired some more as-
sets which when added to the previous year’s (FY2013) assets totaled to Rs.2139 Crs. Clearly the
company started the financial year with a certain rupee value of assets but closed the year with a
totally different rupee value of assets.
Keeping this in perspective, if I were to calculate the asset turnover ratio, which asset value
should I consider for the denominator? Should I consider the asset value at the beginning of the
year or at the asset value at the end of the year? To avoid confusion, the practice is to take aver-
age of the asset values for the two financial years.
Do remember this technique of averaging line items, as we will be using this across other ratios
as well.
From ARBL’s annual report we know:
Net Sales in FY14 is Rs.3437Crs
Total Assets in FY13 is Rs.1770 Crs
Total Assets in FY14 is Rs.2139 Crs
Average Assets = (1770 + 2139) / 2
= 1955
10 zerodha.com/varsityAsset Turnover = 3437 / 1955
= 1.75 times
This means for every Rs.1 of asset deployed, the company is generating Rs.1.75 in revenues.
We will now calculate the last component that is the Financial Leverage.
Financial Leverage = Average Total Assets / Average Shareholders Equity
We know the average total assets is Rs.1955. We just need to look into the shareholders equity.
For reasons similar to taking the “Average Assets” as opposed to just the current year assets, we
will consider “Average Shareholder equity” as opposed to just the current year’s shareholder eq-
uity.
Shareholders Equity for FY13 = Rs.1059 Crs
Shareholders Equity for FY14 = Rs.1362 Crs
Average shareholder equity = Rs.1211 Crs
Financial Leverage = 1955 / 1211
= 1.61 times
Considering ARBL has little debt, Financial Leverage of 1.61 is indeed an encouraging number.
The number above indicates that for every Rs.1 of Equity, ARBL supports Rs.1.61 of assets.
We now have all the inputs to calculate RoE for ARBL, we will now proceed to do the same:
RoE = Net Profit Margin X Asset Turnover X Financial Leverage
= 9.2% * 1.75 * 1.61
~ 25.9%. Quite impressive I must say!
I understand this is a lengthy way to calculate RoE, but this is perhaps the best way as in the proc-
ess of calculating RoE, we can develop valuable insights into the business. DuPont model not
only answers what the return is but also the quality of the return.
However if you wish do a quick RoE calculation you can do so the following way:
RoE = Net Profits / Avg shareholders Equity
11 zerodha.com/varsityFrom the annual report we know for the FY14 the PAT is Rs.367 Crs
RoE = 367 / 1211
= 30.31%
Return on Asset (RoA):
Having understood the DuPont Model, understanding the next two ratios should be simple. Re-
turn on Assets (RoA) evaluates the effectiveness of the entity’s ability to use the assets to create
profits. A well managed entity limits investments in non productive assets. Hence RoA indicates
the management’s efficiency at deploying its assets. Needless to say, higher the RoA, the better it
is.
RoA = [Net income + interest*(1-tax rate)] / Total Average Assets
From the Annual Report, we know:
Net income for FY 14 = Rs.367.4 Crs
And we know from the Dupont Model the Total average assets (for FY13 and FY14) = Rs.1955 Crs
So what does interest *(1- tax rate) mean? Well, think about it, the loan taken by the company is
also used to finance the assets which in turn is used to generate profits. So in a sense, the debt
holders (entities who have given loan to the company) are also a part of the company. From this
perspective the interest paid out also belongs to a stake holder of the company. Also, the com-
pany benefits in terms of paying lesser taxes when interest is paid out, this is called a ‘tax shield’.
For these reasons, we need to add interest (by accounting for the tax shield) while calculating the
ROA.
The Interest amount (finance cost) is Rs.1 Crs, accounting for the tax shield it would be
= 7* (1 – 32%)
= 4.76 Crs . Please note, 32% is the average tax rate.
Hence ROA would be –
RoA = [367.4 + 4.76] / 1955
~ 372.16/ 1955
~19.03%
12 zerodha.com/varsityReturn on Capital Employed (ROCE):
The Return on Capital employed indicates the profitability of the company taking into considera-
tion the overall capital it employs.
Overall capital includes both equity and debt (both long term and short term).
ROCE = [Profit before Interest & Taxes / Overall Capital Employed]
Overall Capital Employed = Short term Debt + Long term Debt + Equity
From ARBL’s Annual Report we know:
Profit before Interest & Taxes = Rs.537.7 Crs
Overall Capital Employed:
Short term debt: Rs.8.3 Crs
Long term borrowing: Rs.75.9 Crs
Shareholders equity = Rs.1362 Crs
Overall capital employed: 8.3 + 75.9 + 1362 = 1446.2 Crs
ROCE = 537.7 / 1446.2
= 37.18%
13 zerodha.com/varsityKey takeaways from this chapter:
1. A Financial ratio is a useful financial metric of a company. On its own merit the ratio con-
veys very little information
2. It is best to study the ratio’s recent trend or compare it with the company’s peers to de-
velop an opinion
3. Financial ratios can be categorized into ‘Profitability’, ‘Leverage’, ‘Valuation’, and ‘Operat-
ing’ ratios. Each of these categories give the analyst a certain view on the company’s busi-
ness
4. EBITDA is the amount of money the company makes after subtracting the operational ex-
penses of the company from its operating revenue
5. EBITDA margin indicates the percentage profitability of the company at the operating
level
6. PAT margin gives the overall profitability of the firm
7. Return on Equity (ROE) is a very valuable ratio. It indicates how much return the share-
holders are making over their initial investment in the company
8. A high ROE and a high debt is not a great sign
9. DuPont Model helps in decomposing the ROE into different parts, with each part throwing
light on different aspects of the business
10. DuPont method is probably the best way to calculate the ROE of a firm
11. Return on Assets in an indicator of how efficiently the company is utilizing its assets
12. Return on Capital employed indicates the overall return the company generates consid-
ering both the equity and debt.
13. For the ratios to be useful, it should be analyzed in comparison with other companies in
the same industry.
14. Also, ratios should be analyzed both at a single point in time and as an indicator of
broader trends over time
14 zerodha.com/varsityC H A PT E R 2
The Financial Ratio Analysis
(Part 2)
10.1 – The Leverage Ratios
We touched upon the topic of financial leverage while discussing Return on Equity and the Du-
Pont analysis. The use of leverage (debt) is like a double edged sword.
Well managed companies seek debt if they foresee a situation where, they can deploy the debt
funds in an environment which generates a higher return in contrast to the interest payments the
company has to makes to service its debt. Do recollect a judicious use of debt to finance assets
also increases the return on equity.
However if a company takes on too much debt, then the interest paid to service the debt eats into
the profit share of the shareholders. Hence there is a very thin line that separates the good and
the bad debt. Leverage ratios mainly deal with the overall extent of the company’s debt, and help
us understand the company’s financial leverage better.
We will be looking into the following leverage ratios:
15 zerodha.com/varsity1. Interest Coverage Ratio
2. Debt to Equity Ratio
3. Debt to Asset Ratio
4. Financial Leverage Ratio
So far we have been using Amara Raja Batteries Limited (ARBL) as an example, however to under-
stand leverage ratios, we will look into a company that has a sizable debt on its balance sheet. I
have chosen Jain Irrigation Systems Limited (JISL), I would encourage you calculate the ratios for
a company of your choice.
Interest Coverage Ratio:
The interest coverage ratio is also referred to as debt service ratio or the debt service coverage ra-
tio. The interest coverage ratio helps us understand how much the company is earning relative to
the interest burden of the company. This ratio helps us interpret how easily a company can pay
its interest payments. For example, if the company has an interest burden of Rs.100 versus an in-
come of Rs.400, then we clearly know that the company has sufficient funds to service its debt.
However a low interest coverage ratio could mean a higher debt burden and a greater possibility
of bankruptcy or default.
The formula to calculate the interest coverage ratio:
[Earnings before Interest and Tax / Interest Payment]
The ‘Earnings before Interest and Tax’ (EBIT) is:
EBITDA – Depreciation & Amortization
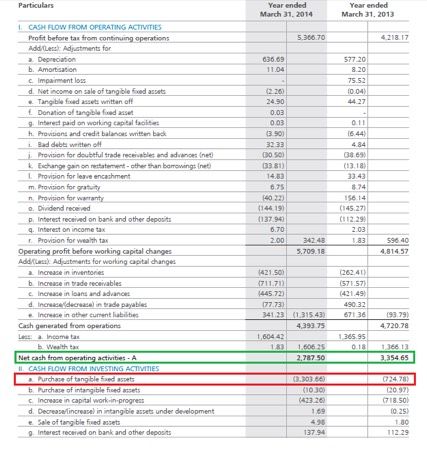
Let us apply this ratio on Jain Irrigation Limited. Here is the snapshot of Jain Irrigation’s P&L state-
ment for the FY 14, I have highlighted the Finance costs in red:
16 zerodha.com/varsityWe know EBITDA = [Revenue – Expenses]
To calculate the expenses, we exclude the Finance cost (Rs.467.64Crs) and Depreciation & Amorti-
zation cost (Rs.204.54) from the total expenses of Rs.5730.34 Crs.
Therefore EBITDA = Rs.5828.13 – 5058.15 Crs
EBITDA = Rs. 769.98 Crs
We know EBIT is EBITDA – [Depreciation & Amortization]
= Rs. 769.98 - Rs. 204.54
= Rs. 565.44
We know Finance Cost = Rs.467.64, Hence Interest coverage is:
= 565.44/ 467.64
= 1.209x
The ‘x’ in the above number represents a multiple. Hence 1.209x should be read as 1.209 ‘times’.
Interest coverage ratio of 1.209x suggests that for every Rupee of interest payment due, Jain Irri-
gation Limited is generating an EBIT of 1.209 times.
Debt to Equity Ratio:
This is a fairly straightforward ratio. Both the variables required for this computation can be
found in the Balance Sheet. It measures the amount of the total debt capital with respect to the
total equity capital. A value of 1 on this ratio indicates an equal amount of debt and equity capi-
tal. Higher debt to equity (more than 1) indicates higher leverage and hence one needs to be care-
ful. Lower than 1 indicates a relatively bigger equity base with respect to the debt.
The formula to calculate Debt to Equity ratio is:
[Total Debt/Total Equity]
Please note, the total debt here includes both the short term debt and the long term debt.
Here is JSIL’s Balance Sheet, I have highlighted total equity, long term, and short term debt:
17 zerodha.com/varsityTotal debt = Long term borrowings + Short term borrowings
= 1497.663 + 2188.915
= Rs.3686.578 Crs
Total Equity is Rs.2175.549 Crs
Thus, Debt to Equity ratio will be computed as follows:
= 3686.578 / 2175.549
= 1.69
Debt to Asset Ratio:
This ratio helps us understand the asset financing pattern of the company. It conveys to us how
much of the total assets are financed through debt capital.
The formula to calculate the same is:
Total Debt / Total Assets
For JSIL, we know the total debt is Rs.3686.578 Crs.
From the Balance Sheet, we know the total assets as Rs.8204.447 Crs:
18 zerodha.com/varsityHence the Debt to Asset ratio is:
=3686.578 / 8204.44
= 0.449 or ~45%.
This means roughly about 45% of the assets held by JSIL is financed through debt capital or credi-
tors (and therefore 55% is financed by the owners). Needless to say, higher the percentage the
more concerned the investor would be as it indicates higher leverage and risk.
Financial Leverage Ratio
We briefly looked at the financial leverage ratio in the previous chapter, when we discussed about
Return on Equity. The financial leverage ratio gives us an indication, to what extent the assets are
supported by equity.
The formula to calculate the Financial Leverage Ratio is:
Average Total Asset / Average Total Equity
From JSIL’s FY14 balance sheet, I know the average total assets is Rs.8012.615. The average total
equity is Rs.2171.755. Hence the financial leverage ratio or simply the leverage ratio is:
8012.615 / 2171.755
= 3.68
This means JISL supports Rs.3.68 units of assets for every unit of equity. Do remember higher the
number, higher is the company’s leverage and the more careful the investor needs to be.
10.2 – Operating Ratios
Operating Ratios also called ‘Activity ratios’ or the ‘Management ratios’ indicate the efficiency of
the company’s operational activity. To some degree, the operating ratios reveal the manage-
ment’s efficiency as well. These ratios are called the Asset Management Ratios, as these ratios in-
dicate the efficiency with which the assets of the company are utilized.
19 zerodha.com/varsitySome of the popular Operating Ratios are:
1. Fixed Assets Turnover Ratio
2. Working Capital Turnover Ratio
3. Total Assets Turnover Ratio
4. Inventory Turnover Ratio
5. Inventory Number of Days
6. Receivable Turnover Ratio
7. Days Sales Outstanding (DSO)
The above ratios combine data from both the P&L statement and Balance sheet. We will under-
stand these ratios by calculating them for Amara Raja Batteries Limited.
To get a true sense of how good or bad the operating ratios of a company are, one must compare
the ratios with the company’s peers /competitors or these ratios should be compared over the
years for the same company.
Fixed Assets Turnover
The ratio measures the extent of the revenue generated in comparison to its investment in fixed
assets. It tells us how effectively the company uses its plant and equipment. Fixed assets include
the property, plant and equipment. Higher the ratio, it means the company is effectively and effi-
ciently managing its fixed assets.
Fixed Assets Turnover = Operating Revenues / Total Average Asset
The assets considered while calculating the fixed assets turnover should be net of accumulated
depreciation, which is nothing but the net block of the company. It should also include the capi-
tal work in progress. Also, we take the average assets for reasons discussed in the previous chap-
ter.
From ARBL’s FY14 Balance Sheet:
20 zerodha.com/varsity= (767.864 + 461.847)/2
= Rs.614.855 Crs
We know the operating revenue for FY14 is Rs.343.7 Crs, hence the Fixed Asset Turnover ratio is:
= 343.7 / 614.85
=0.558
While evaluating this ratio, do keep in mind the stage the company is in. For a very well estab-
lished company, the company may not be utilizing its cash to invest in fixed assets. However for a
growing company, the company may invest in fixed assets and hence the fixed assets value may
increase year on year. You can notice this in case of ARBL as well, for the FY13 the Fixed assets
value is at Rs.461.8 Crs and for the FY14 the fixed asset value is at Rs.767.8 Crs.
This ratio is mostly used by capital intensive industries to analyze how effectively the fixed assets
of the company are used.
Working Capital Turnover
Working capital refers to the capital required by the firm to run its day to day operations. To run
the day to day operations, the company needs certain type of assets. Typically such assets are –
inventories, receivables, cash etc. If you realize these are current assets. A well managed com-
pany finances the current assets by current liabilities. The difference between the current assets
and current liabilities gives us the working capital of the company.
Working Capital = Current Assets – Current Liabilities
If the working capital is a positive number, it implies that the company has working capital sur-
plus and can easily manage its day to day operations. However if the working capital is negative,
it means the company has a working capital deficit. Usually if the company has a working capi-
tal deficit, they seek a working capital loan from their bankers.
The concept of ‘Working Capital Management’ in itself is a huge topic in Corporate Finance. It in-
cludes inventory management, cash management, debtor’s management etc. The company’s
CFO (Chief Financial Officer) strives to manage the company’s working capital efficiently. Of
course, we will not get into this topic as we will digress from our main topic.
The working capital turnover ratio is also referred to as Net sales to working capital. The working
capital turnover indicates how much revenue the company generates for every unit of working
capital. Suppose the ratio is 4, then it indicates that the company generates Rs.4 in revenue for
every Rs.1 of working capital. Needless to say, higher the number, better it is. Also, do remember
21 zerodha.com/varsityall ratios should be compared with its peers/competitors in the same industry and with the com-
pany’s past and planned ratio to get a deeper insight of its performance.
The formula to calculate the Working Capital Turnover:
Working Capital Turnover = [Revenue / Average Working Capital]
Let us implement the same for Amara Raja Batteries Limited. To begin with, we need to calculate
the working capital for the FY13 and the FY14 and then find out the average. Here is the snapshot
of ARBL’s Balance sheet, I have highlighted the current assets (red) and current liabilities (green)
for both the years:
The average working capital for the two financial years can be calculated as follows:
Current Assets for the FY13 Rs.1256.85
Current Liabilities for the FY13 Rs.576.19
Working Capital for the FY13 Rs.680.66
Current Asset for the FY14 Rs.1298.61
Current Liability for the FY14 Rs.633.70
Working Capital for the FY14 Rs.664.91
Average Working Capital Rs.672.78
22 zerodha.com/varsityWe know the revenue from operations for ARBL is Rs.3437 Crs. Hence the working capital turn-
over ratio is:
= 3437 / 672.78
= 5.11 times
The number indicates that for every Rs.1 of working capital, the company is generating Rs.5.11 in
terms of revenue. Higher the working capital turnover ratio the better it is, as it indicates the com-
pany is generating better sales in comparison with the money it uses to fund the sales.
Total Assets Turnover
This is a very straight forward ratio. It indicates the company’s capability to generate revenues
with the given amount of assets. Here the assets include both the fixed assets as well as current
assets. A higher total asset turnover ratio compared to its historical data and competitor data
means the company is using its assets well to generate more sales.
Total Asset Turnover = Operating Revenue / Average Total Assets
The average total assets for ARBL is as follows –
Total Assets for FY 13 – Rs.1770.5 Crs and Total Assets for FY 14 – 2139.4 Crs. Hence the average
assets would be Rs. 1954.95 Crs.
Operating revenue (FY 14) is Rs. 3437 Crs. Hence Total Asset Turnover is:
= 3437 / 1954.95
= 1.75 times
Inventory Turnover Ratio
Inventory refers to the finished goods that a company maintains in its store or showroom with an
expectation of selling the finished goods to prospective clients. Typically, the company besides
keeping the goods in the store would also keep some additional units of finished goods in its
warehouse.
If a company is selling popular products, then the goods in the inventory gets cleared rapidly, and
the company has to replenish the inventory time and again. This is called the ‘Inventory turn-
over’.
For example think about a bakery selling hot bread. If the bakery is popular, the baker probably
knows how many pounds of bread he is likely to sell on any given day. For example, he could sell
200 pounds of bread daily. This means he has to maintain an inventory of 200 pounds of bread
23 zerodha.com/varsityevery day. So, in this case the rate of replenishing the inventory and the inventory turnover is
quite high.
This may not be true for every business. For instance, think of a car manufacturer. Obviously sell-
ing cars is not as easy as selling bread. If the manufacturer produces 50 cars, he may have to wait
for sometime before he sells these cars. Assume, to sell 50 cars (his inventory capacity) he will
need 3 months. This means, every 3 months he turns over his inventory. Hence in a year he turns
over his inventory 4 times.
Finally, if the product is really popular the inventory turnover would be high. This is exactly what
the ‘Inventory Turnover Ratio’ indicates.
The formula to calculate the ratio is:
Inventory Turnover = [Cost of Goods Sold / Average Inventory]
Cost of goods sold is the cost involved in making the finished good. We can find this in the P&L
Statement of the company. Let us implement this for ARBL.
To evaluate the cost of goods sold, I need to look into the expense of the company, here is the ex-
tract of the same:
Cost of materials consumed is Rs.2101.19 Crs and purchases of stock-in-trade is Rs.211.36 Crs.
These line items are directly related to the cost of goods sold. Along with this I would also like to
inspect ‘Other Expenses’ to identify any costs that are related to the cost of goods sold. Here is
the extract of Note 24, which details ‘Other Expenses’.
24 zerodha.com/varsityThere are two expenses that are directly related to manufacturing i.e. Stores & spares consumed
which is at Rs.44.94 Crs and the Power & Fuel cost which is at Rs.92.25Crs.
Hence the Cost of Goods Sold = Cost of materials consumed + Purchase of stock in trade + Stores
& spares consumed + Power & Fuel
= 2101.19 + 211.36 + 44.94 + 92.25
COGS= Rs.2449.74 Crs
This takes care of the numerator. For the denominator, we just take the average inventory for the
FY13 and FY14. From the balance sheet – Inventory for the FY13 is Rs.292.85 Crs and for the FY14
is Rs.335.00 Crs. The average works out to Rs.313.92 Crs
The Inventory turnover ratio is:
= 2449.74 / 313.92
= 7.8 times
~ 8.0 times a year
This means Amara Raja Batteries Limited turns over its inventory 8 times in a year or once in
every 1.5 months. Needless to say, to get a true sense of how good or bad this number is, one
should compare it with its competitor’s numbers.
Inventory Number of days
While the Inventory turnover ratio gives a sense of how many times the company ‘replenishes’
their inventory, the ‘Inventory number of Days’ gives a sense of how much time the company
takes to convert its inventory into cash. Lesser the number of days, the better it is. A short inven-
25 zerodha.com/varsitytory number of day’s number implies, the company’s products are fast moving. The formula to
calculate the inventory number of days is:
Inventory Number of Days = 365 / Inventory Turnover
The inventory number of days is usually calculated on a yearly basis. Hence in the formula above,
365 indicates the number of days in a year.
Calculating this for ARBL:
= 365 / 7.8
= 46.79 days
~ 47.0 days
This means ARBL roughly takes about 47 days to convert its inventory into cash. Needless to say,
the inventory number of days of a company should be compared with its competitors, to get a
sense of how the company’s products are moving.
Now here is something for you to think about – What would you think about the following situa-
tion?
1. A certain company under consideration has a high inventory turnover ratio
2. Because of a high inventory turnover ratio, the inventory number of days is very low
On the face of it, the inventory management of this company looks good. A high inventory turn-
over ratio signifies that the company is replenishing its inventory quickly, which is excellent.
Along with the high inventory turnover, a low inventory number of days indicate that the com-
pany is quickly able to convert its goods into cash. Again, this is a sign of great inventory manage-
ment.
However, what if the company has a great product (hence they are able to sell quickly) but a low
production capacity? Even in this case the inventory turnover will be high and inventory days will
be low. But a low production capacity can be a bit worrisome as it raises many questions about
the company’s production:
1. Why is the company not able to increase their production?
2. Are they not able to increase production because they are short of funds?
3. If they are short of funds, why can’t they seek a bank loan?
4. Have they approached a bank and are not been able to raise a loan successfully?
5. If they are not able to raise a loan, why?
26 zerodha.com/varsity6. What if the management does not have a great track record, hence the banks hesitation
to give a loan?
7. If funds are not a problem, why can’t the company increase production?
8. Is sourcing raw materials difficult? Is the raw material required regulated by government
(like Coal, power, Oil etc).
9. Difficult access to raw material – does that mean the business is not scalable?
As you can see, if any of the points above is true, then a red flag is raised, hence investing in the
company may not be advisable. To fully understand the production issues (if any), the fundamen-
tal analyst should read through the annual report (especially the management discussion & analy-
sis report) from the beginning to the end.
This means whenever you see impressive inventory numbers, always ensure to double check the
production details as well.
Accounts Receivable Turnover Ratio
Having understood the inventory turnover ratio, understanding the receivable turnover ratio
should be quite easy. The receivable turnover ratio indicates how many times in a given period
the company receives money/cash from its debtors and customers. Naturally a high number indi-
cates that the company collects cash more frequently.
The formula to calculate the same is:
Accounts Receivable Turnover Ratio = Revenue / Average Receivables
From the balance sheet we know,
Trade Receivable for the FY13 : Rs.380.67 Crs
Trade Receivable for the FY14 : Rs. 452.78 Crs
Average Receivable for the FY13 : Rs.416.72
Operating Revenue for the FY14 : Rs.3437 Crs
Hence the Receivable Turnover Ratio is:
= 3437 / 416.72
= 8.24 times a year
~ 8.0 times
This means ARBL receives cash from its customers roughly about 8.24 times a year or once every
month and a half.
27 zerodha.com/varsityDays Sales Outstanding (DSO) )/ Average Collection Period/ Day Sales in Receivables
The days sales outstanding ratio illustrates the average cash collection period i.e the time lag be-
tween billing and collection. This calculation shows the efficiency of the company’s collection de-
partment. Quicker/faster the cash is collected from the creditors, faster the cash can be used for
other activities. The formula to calculate the same is:
Days Sales outstanding = 365 / Receivable Turnover Ratio
Solving this for ARBL,
= 365 / 8.24
= 44.29 days
This means ARBL takes about 45 days from the time it raises an invoice to the time it can collect
its money against the invoice.
Both Receivables Turnover and the DSO indicate the credit policy of the firm. A efficiently run
company, should strike the right balance between the credit policy and the credit it extends to its
customers.
28 zerodha.com/varsityKey takeaways from this chapter
1. Leverage ratios include Interest Coverage, Debt to Equity, Debt to Assets and the Financial
Leverage ratios
2. The Leverage ratios mainly study the company’s debt with respect to the company’s abil-
ity to service the long term debt
3. Interest coverage ratio inspects the company’s earnings ability (at the EBIT level) as a mul-
tiple of its finance costs
4. Debt to equity ratio measures the amount of equity capital with respect to the debt capi-
tal. Debt to equity of 1 implies equal amount of debt and equity
5. Debt to Asset ratio helps us understand the asset financing structure of the company (es-
pecially with respect to the debt)
6. The Financial Leverage ratio helps us understand the extent to which the assets are fi-
nanced by the owner’s equity
7. The Operating Ratios also referred to as the Activity ratios include – Fixed Assets Turn-
over, Working Capital turnover, Total Assets turnover, Inventory turnover, Inventory number
of days, Receivable turnover and Day Sales Outstanding ratios
8. The Fixed asset turnover ratio measures the extent of the revenue generated in compari-
son to its investment in fixed assets
9. Working capital turnover ratio indicates how much revenue the company generates for
every unit of working capital
10. Total assets turnover indicates the company’s ability to generate revenues with the
given amount of assets
11. Inventory turnover ratio indicates how many times the company replenishes its inven-
tory during the year
12. Inventory number of days represents the number of days the company takes to convert
its inventory to cash
a. A high inventory turnover and therefore a low inventory number of days is a great
combination
b. However make sure this does not come at the cost of low production capacity
13. The Receivable turnover ratio indicates how many times in a given period the company
receives money from its debtors and customers
29 zerodha.com/varsity14. The Days sales outstanding (DSO) ratio indicates the Average cash collection period i.e
the time lag between the Billing and Collection
30 zerodha.com/varsityC H A PT E R 3
The Financial Ratio Analysis
(Part 3)
11.1 – The Valuation Ratio
Valuation in general, is the estimate of the ‘worth’ of something. In the context of investments,
‘something’ refers to the price of a stock. When making an investment decision, irrespective of
how attractive the business appears, what matters finally is the valuation of the business. Valua-
tions dictate the price you pay to acquire a business. Sometimes, a mediocre business at a ridicu-
lously cheap valuation may be a great investment option as opposed to an exciting business with
an extremely high valuation.
The valuation ratios help us develop a sense on how the stock price is valued by the market par-
ticipants. These ratios help us understand the attractiveness of the stock price from an invest-
ment perspective. The point of valuation ratios is to compare the price of a stock viz a viz the
benefits of owning it. Like all the other ratios we had looked at, the valuation ratios of a company
should be evaluated alongside the company’s competitors.
31 zerodha.com/varsityValuation ratios are usually computed as a ratio of the company’s share price to an aspect of its
financial performance. We will be looking at the following three important valuation ratios:
1. Price to Sales (P/S) Ratio
2. Price to Book Value (P/BV) Ratio and
3. Price to Earnings (P/E) Ratio
Continuing with the Amara Raja Batteries Limited (ARBL) example, let us implement these ratios
to see how ARBL fares. The stock price of ARBL is a vital input used to calculate the valuation ra-
tios. As I write this chapter on 28th of Oct 2014, ARBL is trading at Rs.661 per share.
We also need the total number of shares outstanding in ARBL to calculate the above ratios. If you
recollect, we have calculated the same in chapter 6. The total number of shares outstanding is
17,08,12,500 or 17.081Crs
Price to Sales (P/S) Ratio
In many cases, investors may use sales instead of earnings to value their investments. The earn-
ings figure may not be true as some companies might be experiencing a cyclical low in their earn-
ing cycle. Additionally due to some accounting rules, a profitable company may seem to have no
earnings at all, due to the huge write offs applicable to that industry. So, investors would prefer
to use this ratio. This ratio compares the stock price of the company with the company’s sales per
share. The formula to calculate the P/S ratio is:
Price to sales ratio = Current Share Price / Sales per Share
Let us calculate the same for ARBL. We will take up the denominator first:
Sales per share = Total Revenues / Total number of shares
We know from ARBL’s P&L statement the:
Total Revenue = Rs.3482 Crs
Number of Shares = 17.081 Crs
Sales per share = 3482 / 17.081
Therefore the Sales per share = Rs. 203.86
This means for every share outstanding, ARBL does Rs.203.86 worth of sales.
32 zerodha.com/varsityPrice to Sales Ratio = 661 / 203.86
= 3.24x or 3.24 times
A P/S ratio of 3.24 times indicates that, for every Rs.1 of sales, the stock is valued Rs.3.24 times
higher. Obviously, higher the P/S ratio, higher is the valuation of the firm. One has to compare the
P/S ratio with its competitors in the industry to get a fair sense of how expensive or cheap the
stock is.
Here is something that you need to remember while calculating the P/S ratio. Assume there are
two companies (Company A and Company B) selling the same product. Both the companies gen-
erate a revenue of Rs.1000/-each. However, Company A retains Rs.250 as PAT and Company B re-
tains Rs.150 as PAT. In this case, Company A has a profit margin of 25% versus Company B’s which
has a 15% profit margin. Hence the sales of Company A is more valuable than the sales of Com-
pany B. Hence if Company A is trading at a higher P/S, then the valuation maybe justified, simply
because every rupee of sales Company A generates, a higher profit is retained.
Hence whenever you feel a particular company is trading at a higher valuation from the P/S ratio
perspective, do remember to check the profit margin for cues.
Price to Book Value (P/BV) Ratio
Before we understand the Price to Book Value ratio, we need to understand what the term ‘Book
Value’ means.
Consider a situation where the company has to close down its business and liquidate all its as-
sets. What is the minimum value the company receives upon liquidation? The answer to this lies
in the “Book Value” of the firm.
The “Book Value” of a firm is simply the amount of money left on table after the company pays off
its obligations. Consider the book value as the salvage value of the company. Suppose the book
value of a company is Rs.200 Crs, then this is the amount of money the company can expect to re-
ceive after it sells everything and settles its debts. Usually the book value is expressed on a per
share basis. For example, if the book value per share is Rs.60, then Rs.60 per share is what the
shareholder can expect in case the company decides to liquidate. The ‘Book Value’ (BV) can be
calculated as follows:
BV = [Share Capital + Reserves (excluding revaluation reserves) / Total Number of shares]
Let us calculate the same for ARBL:
33 zerodha.com/varsityFrom ARBL’s balance sheet we know:
Share Capital = Rs.17.1 Crs
Reserves = Rs.1345.6 Crs
Revaluation Reserves = 0
Number of shares: 17.081
Hence the Book Value per share = [17.1+1345.6 – 0] / 17.081
= Rs.79.8 per share
This means if ARBL were to liquidate all its assets and pay off its debt, Rs.79.8 per shares is what
the shareholders can expect.
Moving ahead, if we divide the current market price of the stock by the book value per share, we
will get the price to the book value of the firm. The P/BV indicates how many times the stock is
trading over and above the book value of the firm. Clearly the higher the ratio, the more expen-
sive the stock is.
Let us calculate this for ARBL. We know:
Stock price of ARBL = Rs.661 per share
BV of ARBL = 79.8 per share
P/BV = 661/79.8
= 8.3x or 8.3 times
This means ARBL is trading over 8.3 times its book value.
A high ratio could indicate the firm is overvalued relative to the equity/ book value of the com-
pany. A low ratio could indicate the company is undervalued relative to the equity/ book value of
the company.
Price to Earning (P/E) Ratio
The Price to Earnings ratio is perhaps the most popular financial ratio. Everybody likes to check
the P/E of a stock. Because of the popularity the P/E ratio enjoys, it is often considered the ‘finan-
cial ratio superstar’.
34 zerodha.com/varsityThe P/E of a stock is calculated by dividing the current stock price by the Earning Per share
(EPS). Before we proceed further to understand the PE ratio, let us understand what “Earnings
per Share” (EPS) stands for.
EPS measures the profitability of a company on a per share basis. For example assume a certain
company with 1000 shares outstanding generates a profit of Rs.200000/-. Then the earnings on a
per share basis would be:
=200000 / 1000
= Rs.200 per share.
Hence the EPS gives us a sense of the profits generated on a per share basis. Clearly, higher the
EPS, better it is for its shareholders.
If you divide the current market price with EPS we get the Price to Earnings ratio of a firm. The P/E
ratio measures the willingness of the market participants to pay for the stock, for every rupee of
profit that the company generates. For example if the P/E of a certain firm is 15, then it simply
means that for every unit of profit the company earns, the market participants are willing to pay
15 times. Higher the P/E, more expensive is the stock.
Let us calculate the P/E for ARBL. We know from its annual report –
PAT = Rs.367 Crs
Total Number of Shares = 17.081 Crs
EPS = PAT / Total Number of shares
= 367 / 17.081
= Rs.21.49
Current Market Price of ARBL = 661
Hence P/E = 661 / 21.49
= 30.76 times
This means for every unit of profit generated by ARBL, the market participants are willing to pay
Rs.30.76 to acquire the share.
35 zerodha.com/varsityNow assume, ARBL’s price jumps to Rs.750 while the EPS remains at Rs.21.49, the new P/E would
be:
= 750/21.49
= 34.9 times
While the EPS stayed flat at Rs.21.49 per share, the stock’s P/E jumped. Why do you think this hap-
pened?
Clearly, the P/E Ratio jumped because of the increase in the stock price. As we know the stock
price of a company increases when the expectations from the company increases.
Remember, P/E Ratio is calculated with ‘earnings’ in its denominator. While looking at the P/E ra-
tio, do remember the following key points:
1. P/E indicates how expensive or cheap the stock is trading at. Never buy stocks that are
trading at high valuations. I personally do not like to buy stocks that are trading beyond 25
or at the most 30 times its earnings, irrespective of the company and the sector it belongs to
2. The denominator in P/E ratio is the ‘Earnings’, and the earnings can be manipulated
3. Make sure the company is not changing its accounting policy too often – this is one of the
ways the company tries to manipulate its earnings.
4. Pay attention to the way depreciation is treated. Provision for lesser depreciation can
boost earnings
5. If the company’s earnings are increasing but not its cash flows and sales, then clearly
something is not right
11.2 – The Index Valuation
Just like a stock, the stock market indices such as the BSE Sensex and the CNX Nifty 50 have their
valuations which can be measured by the P/E ,P/B and Dividend Yield ratios. The Index valuation
is usually published by the stock exchanges on a daily basis. The index valuations give us a sense
of how cheap or expensive the market is trading at. To calculate the CNX Nifty 50 P/E ratio, the Na-
tional Stock Exchange combines the market capitalization for all the 50 stocks and divides that
amount by the combined earnings for all the 50 stocks. Tracking the Index P/E ratio, gives a sense
of the current state of market as perceived by the market participants. Here is the historical chart
of Nifty 50 P/E ratio* –
36 zerodha.com/varsity*Source – Creytheon
From the P/E chart above, we can make a few important observations –
1. The peak Index valuation was 28x (early 2008), what followed this was a major crash in
the Indian markets
2. The corrections drove the valuation down to almost 11x (late 2008, early 2009). This was
the lowest valuation the Indian market had witnessed in the recent past
3. Usually the Indian Indices P/E ratio ranges between 16x to 20x, with an average of 18x
4. As of today (2014) we are trading around 22x, which is above the average P/E ratio
Based on these observations, the following conclusions can be made –
1. One has to be cautious while investing in stocks when the market’s P/E valuations is
above 22x
2. Historically the best time to invest in the markets is when the valuations are around 16x
or below.
One can easily find out Index P/E valuation on a daily basis by visiting the National Stock Ex-
change (NSE) website.
On NSE’s home page click on Products > Indices > Historical Data > P/E, P/B & Div > Search
In the search field enter today’s date and you will get the latest P/E valuation of the market. Do
note, the NSE updates this information around 6:00 PM every day.
37 zerodha.com/varsityYou can also read