A Comparative History of Oil and Gas Markets and Prices: is 2020 just an extreme cyclical event or an acceleration of the energy transition?
←
→
Page content transcription
If your browser does not render page correctly, please read the page content below
April 2020

         A Comparative History of Oil and Gas
  Markets and Prices: is 2020 just an extreme cyclical
   event or an acceleration of the energy transition?

   Introduction
   Natural gas markets have gone through an unprecedented transformation. Demand growth for this
   relatively clean, plentiful, versatile and now relatively cheap fuel has been increasing faster than for
   other fossil fuels.1 Historically a `poor relation’ of oil, gas is now taking centre stage. New markets,
   pricing mechanisms and benchmarks are being developed, and it is only natural to be curious about
   the direction these developments are taking. The oil industry has had a particularly rich and well
   recorded history, making it potentially useful for comparison. However, oil and gas are very different
   fuels and compete in different markets. Their paths of evolution will very much depend on what happens
   in the markets for energy sources with which they compete. Their history is rich with dominant
   companies, government intervention and cycles of boom and bust.
   A common denominator of virtually all energy industries is a tendency towards natural monopoly
   because they have characteristics that make such monopolies common. 2 Energy projects tend to
   require multibillion – often tens of billions of - investments with long gestation periods, with assets that
   can only be used for very specific purposes and usually, for very long-time periods. Natural monopolies
   are generally resolved either by new entrants breaking their integrated market structures or by
   government regulation. Historically, both have occurred in oil and gas markets.3 As we shall show, new
   entrants into the oil market in the 1960s led to increased supply at lower prices, and higher royalties,
   resulting in the collapse of control by the major oil companies. Initially, the creation of the Organisation
   of Petroleum Exporting Countries (OPEC) was an attempt to prevent IOCs from reducing the posted
   prices which would have caused a fall in the revenues accruing to the governments. Later, in the early
   1970s, they assumed the control of the pricing system with mixed results. 4
   Monopoly structures in North American gas markets started to break up in the 1980s and in Europe
   from the 1990s to the 2010s but remain relatively intact in Asia. Japanese, Korean and other utilities
   traditionally purchase gas on long term, oil price-related contracts and pass on the price risk onto the
   consumers, justifying some of the price premium on the grounds of security of supply. However, starting

   1
     IEA (2019) p. 175. ‘Over the next two decades, global demand for natural gas grows more than four times faster than demand
   for oil in the Stated Policies Scenario. Natural gas sees broad-based growth across the energy economy, in contrast to oil
   where growth is concentrated in parts of the transport sector (trucks, shipping and aviation) and petrochemicals.’
   2
     Economists define a ‘natural monopoly’ by presence of both economies of scale and ‘sub-additivity’. The latter simply means
   that it is more efficient to have one provider than two or more. Natural monopoly can emerge in perfectly competitive markets.
   Economists define ‘natural monopoly’ by presence of both economies of scale and ‘sub-additivity’. The latter simply means that
   it is more efficient (cheaper) to have one provider than two or more. For more details, see The New Palgrave Dictionary of
   Economics (1998), p. 306.
   3
     Mitchell (1976), p. 108.
   4
    For an overview, see Parra (2004), p. 276 and more recently Fattouh and Imsirovic (2020), p. 7.

Energy Insight: 68                                     Jonathan Stern, Distinguished Research Fellow, OIES &
                                                                     Adi Imsirovic, Research Associate, OIES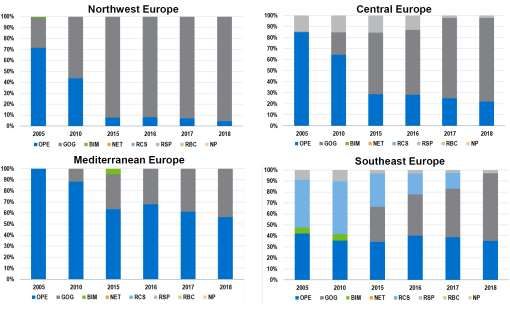
in 2019 and accelerating in 2020, short-term and spot markets offer LNG from various and secure
sources at low, gas-related prices exposing traditional practice as illogical and inefficient.
This paper will take a very broad economic and historical perspective to compare the two industries,
specifically in relation to pricing. This paper starts with a short history of the oil industry and shows how
the changing structure and liberalisation had an impact on development of spot prices, benchmarks
and a whole network of associated derivatives markets. This is followed by a history of gas pricing with
emphasis on recent development and importance of Asian LNG pricing. We then draw parallels
between the evolution of pricing in oil and gas markets and consider whether 2019/20 developments
simply represent an extreme phase of the regular commodity cycle or could mark a dramatic
acceleration in the transition away from fossil fuels. Finally we summarise and conclude.
Oil Markets, Monopolies and Prices
End of the ‘Golden Era’ of oil ‘Majors’
In the 1950s and 60s, the industry and the markets were largely run by large oil companies or ‘Majors’.5
They did all the exploring, producing, transporting and refining of oil. Also, they distributed and marketed
the finished products. In other words, they were vertically integrated. This structure gave the oil
companies control of every barrel from the time it was taken from the ground to the point of its use. The
production was fine-tuned to the prevailing demand for petroleum products ensuring an overall price
stability from the 1930s to the early 1970s. 6
The industry was also integrated ‘horizontally’; oil was carefully supplied from various geographic areas
around the globe to ensure that supply and demand were balanced at lowest cost. Horizontal integration
was done through joint ownership in several operating companies throughout the Middle East
(ARAMCO, Anglo Persian - later to become British Petroleum, Kuwait Oil Company etc). The
companies operated several mutual agreements, preventing ‘harmful’ competition 7. The share of each
‘Major’ oil company in any of the markets was to remain 'As-Is' (in line with the prevailing market shares
in 1928). By 1950, the 'Seven Sisters' owned 70% of the world refining capacity outside the Communist
block and North America, almost 100% of the pipeline networks and over 60% of the world's privately-
owned tanker fleet. They priced crude oil using ‘posted prices’ to maximise they own revenues within
their vertically integrated systems. The producing countries received royalties on a percentage basis
and posted prices were kept low to minimise them.
Towards the end of the 1950s, cracks started appearing in these cosy arrangements. Existing oil
producers such as Venezuela and Iran were pushing for higher oil revenues and hence production.
Large profits of the oil 'Majors' were attracting 'newcomers' in terms of smaller 'independent' 8 oil
companies. In Libya, the 1955 Petroleum Law offered many smaller concessions and stricter terms for
exploration than the existing producers.9 More than half of the Libyan production ended up in the hands
of companies which had no integrated systems in Europe (such as Conoco, Marathon and Amerada
Hess) and hence no outlets for the oil. In 1956, BP and Shell found oil in Nigeria. In 1959, ENI started

5
  Sampson (1988) p 475. Also referred to as the ‘Seven Sisters’: Exxon, Shell, BP, Chevron and Texaco (now Chevron), Gulf
and Mobil (now both Exxon).
6
  BP (2019), p.24.
7
  Mechanisms for controlling these large petroleum reserves were ingenious, generally based on various 'rules' such as
Average Program Quantity (APQ) in Iran, the 'Five Sevenths' rule in Iraq and the 'Dividend Squeeze' in Saudi Arabia. Monopoly
prices were charged using a ‘Gulf Plus System’; all delivered oil prices included freight cost from the US Gulf regardless of its
origin.
8
  The term loosely means companies ‘other than Majors’. In USA, these were: Amoco, Sohio, Conoco, Atlantic Richfield (Arco),
Occidental and some others. By and large, they emerged from Texas, which, in 1960 produced some 39% of US oil. Libya was
a stepping stone for Amerada (Hess), Continental and Marathon. Occidental took off in Russia and Getty in Saudi Arabia and
later Iran. In Europe, ‘independents’ included French Total (CFP) and Elf, Italian Agip (ENI), Belgian Petrofina and others.
These newcomers, such as J.P. Getty paid more for concessions and offered higher royalties. For an excellent narrative, see
Sampson (1975), Chapter 7.
9
  Yergin (1991), p. 528.

                                                                                                                            2
    The contents of this paper are the authors’ sole responsibility. They do not necessarily represent the views
                          of the Oxford Institute for Energy Studies or any of its Members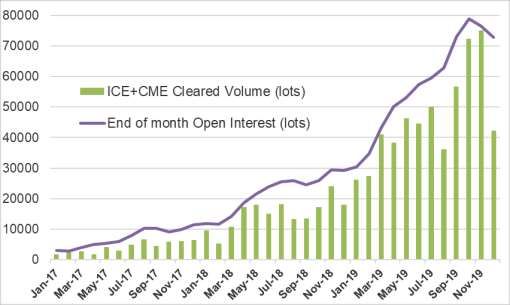
importing cheap Russian oil from the Urals region into Italy, undercutting posted prices. At the same
time, the US had an import quota system, designed to protect its domestic oil producers. This legislation
left the independents 'stranded' with oil which had to find markets elsewhere in the world.
These newcomers, not unlike the independent shale producers today, were keen to get the oil out of
the ground quickly and secure a return on their investment. Oversupply was becoming obvious and oil
was being offered at a discount to posted prices. In the 1960 to 1965 period, the Majors’ share of
European refining capacity fell from 67% to 54%. This intensified competition in the products markets
reducing the refinery margin and putting further pressure on the oil prices. The Majors were losing the
ability to balance supply and demand and pressure on the integrated structure of the industry increased.
At the same time, producing countries wanted to increase the posted price and reassert control over
their natural resources, resulting in equity participation in the existing concessions and outright
nationalisations in some countries.10 The ‘last straw’ was a move by Exxon, the largest Major and a
price leader to cut posted price of up to 14 cents per barrel - without warning or consulting the
governments of the producing countries - other international companies in the Middle East followed
suit. Producing countries acted decisively and arranged a meeting on September 10th, 1960 in
Baghdad. Four days later, the Organisation of Petroleum Exporting Countries (OPEC) was born. 11
Equity participation and nationalisation profoundly affected the structure of the oil industry. The majors
lost large reserves of crude oil and found themselves increasingly net short and dependent on OPEC
supplies. The degree of vertical integration between upstream and downstream considerably
weakened. While the majors retained both their upstream and downstream assets, their position
became more imbalanced: the companies no longer had enough access to crude oil to meet their
downstream requirements. This encouraged the development of an oil market outside the control of the
Majors.
Figure 1: Annualised Nominal Crude Oil prices, 1960–2017 ($/bbl)
                        $120.00

                        $100.00

                         $80.00
                $/bbl

                         $60.00

                         $40.00

                         $20.00

                          $0.00
                                                                            1978
                                  1960
                                         1963
                                                1966
                                                       1969
                                                              1972
                                                                     1975

                                                                                   1981
                                                                                          1984
                                                                                                 1987
                                                                                                        1990
                                                                                                               1993
                                                                                                                      1996
                                                                                                                             1999
                                                                                                                                    2002
                                                                                                                                           2005
                                                                                                                                                  2008
                                                                                                                                                         2011
                                                                                                                                                                2014
                                                                                                                                                                       2017

Source: BP (2019), p.24.

10
   They also had stong leaders such as Nasser in Egypt, Muammar al-Qaddafi in Libya, Boumediene in Algeria, Abdullah Tariki
in Saudi Arabia and Perez Alfonso in Venezuela. Apart from being better educated than their predecessors, they shared strong
anti-colonial feelings.
11
   Founding members were Saudi Arabia, Venezuela, Kuwait, Iraq and Iran.

                                                                                                                                                                              3
     The contents of this paper are the authors’ sole responsibility. They do not necessarily represent the views
                           of the Oxford Institute for Energy Studies or any of its Members
Thus, the early 1970s ended the era of control of the crude oil industry by the Major oil companies.
Control of production decisions shifted from these companies to national governments and their national
companies giving them a power to decide output and set oil prices. The new system was centred on
the concept of reference or marker price with Saudi Arabia’s Arabian Light being the chosen marker
crude.
Despite these fundamental changes, in the early stages of the OPEC administered pricing system,
OPEC countries remained dependent on the majors to lift and dispose of the crude oil and initially sold
only small volumes through their national oil companies to firms other than the old concessionaires. As
a result the majors continued to have preferential access to crude which narrowed the scope of a
competitive oil market. The situation changed in the late 1970s with the emergence of new players on
the global oil scene. A distinction between buyers and sellers became clear. As the horizontal market
control by the Majors broke up, oil prices became highly volatile (Figure 1). 12
‘Spot’ markets and prices
Following the collapse of horizontal integration in the early 1970s, the vertical integration of the industry
ended with the fall of Shah of Iran in 1979. After the revolution, the Majors were forced to cancel third-
party oil deliveries, which drove buyers of oil into the spot market.13 With no vertically integrated market
tightly controlled by the companies, discrepancies between nomination dates, quantities, types and
location of the crudes purchased by refiners appeared. To remedy these problems, term contract
holders had to increase crude swaps and trade among themselves 14. The result was a massive growth
of spot trade volumes from some 3-5% in January 1979 to about 15-20% by March of the same year.
OPEC pricing arrangements were challenged by price volatility. Official Saudi prices were not changed
frequently enough to reflect the volatility in the spot market. For example, at the 1979 Geneva OPEC
meeting, the Arab Light price was increased from $18 to $24 per barrel as the spot price rocketed to
$45 per barrel. It was obvious that this price risk had to be managed. This was especially the case as
the term supplies from OPEC countries were generally of a long-haul nature.15 In a volatile market, the
price could significantly change between the time of purchase and delivery, exposing both seller and
buyer to a large financial risk. Around the same time, large oil discoveries were made in the North Sea,
facilitating relatively free market trading of the commodity that could be used to manage price risk.
The Ekofisk oilfield was discovered in 1969 in Norway by Amoco, Forties in 1970 by BP and Brent in
1971 by Shell.16 By 1980, North Sea production was 2 million barrels per day (mbd), making the region
an important supplier of non-OPEC crude oil. Underpinned by English law, with standardised
contracts17, no destination restrictions and tax advantages in ‘spinning’ or ‘churning’ the cargoes, the
North Sea Brent market developed into the premiere, transparent and liquid spot market. 18 Price
reporting agencies (PRAs) Argus and Platts added to the transparency of the market. 19 Benchmarks
were set by participants in the spot and paper markets (‘price makers’) and the producers became ‘price
takers’. When we talk about the price of oil today, we normally mean the price of one of these
12
McNally (2017), pp.130-141: ‘…OPEC … announced a unilateral price increase of the benchmark Arabian Light from $3.01
to $5.11 per barrel, a 70 percent bump…’; ‘Saudi Arabia fuelled the panic by cutting production by around 600 kbd in January
1979. Spot oil prices rose from $12.80 per barrel before … October 1978 to $21.80 in February 1979…’.
13
Although this process accelerated following the Iranian revolution, had its roots in the early 1970s. In the ten years following
the Arab embargo in 1973, the oil available to the Majors fell by nearly 50%. Equity volumes fell even more, by about 75% and
their share of internationally traded oil fell from 62% to 37%.
14
Swapping cargoes to minimise cost and optimise delivery will become common in the 2010s in the LNG markets.
15
A very large crude carrier (VLCC) would take about six weeks to arrive to NWE from the Arab Gulf.
16
McGrandle (1975).
17
Such as the Brent ‘SUKO 1990’ (Shell UK) 1990 contract.
18
For a comprehensive introduction, see Mabro and Horsnell (1993).and also Fattouh (2010) .
19
Platts started publishing its ‘Crude Oil Market Wire’ in 1978, and in the same year Argus started first daily reporting on the
emerging spot crude market in the ‘Argus Telex’. Platts started publishing Brent price assessments in the early 1980s
4
The contents of this paper are the authors’ sole responsibility. They do not necessarily represent the views
of the Oxford Institute for Energy Studies or any of its Membersbenchmarks. Derivative markets which grew alongside Brent and WTI facilitated risk management
associated with physical trading. These benchmarks became the backbone of oil trading.
Throughout its history, OPEC has experienced disarray in its ranks over pricing policy and fundamental
long-term strategy. This was particularly obvious at the 1980 conference in Algiers where a lack of
agreement led to a ‘free for all’ policy. By adhering to the system of ‘Official Prices’ which most of OPEC
was abandoning, Saudi Arabia was forced to reduce its volumes and take on the role of a ‘swing
producer’.20 But their rigid official prices were falling out of line with the ‘real’ spot market, and Saudi
Arabia rejected a continuous decline in the volume of their exports (exports fell from about 10 mbd to
just 3 mbd between 1980 and 1986!). They opted to recover their share of the world market by changing
their sales to ‘netback’ prices. 21 A year later, oil prices fell to $8/barrel. 22 Without an integrated
structure, the industry resembled the early decades of intense competition, the booms and busts of the
late 19th and early 20th centuries.23
A gradual price recovery followed a key OPEC meeting in November 1986 which changed the overall
strategy of the Organisation away from the ‘official’ prices and towards managing OPEC supply through
a quota system. A new system of ‘spot’-related formulae prices was gradually adopted, and free markets
prevailed.24 By 1987, over 60% of all traded oil prices were tied to the spot market. This principle of
setting prices of individual grades of oil against a published benchmark has not changed to this day.
Subsequently, three main benchmarks emerged in the key oil markets: WTI in the US, Brent in the
Atlantic basin and Dubai in Asia. 25 Being seaborne crude, Brent has been the main international
benchmark.26 Over time, all three have had ups and downs, caused mainly by changes in production
of the respective streams and changing oil flows.
The two key events leading to the birth of WTI contract happened in the 1980s: lifting of US price
controls by the Reagan administration in 1981, and the creation of the WTI futures contract on the New
York Mercantile Exchange (NYMEX) in March 1983. Following the ‘decontrol’ of prices in 1981, spot
markets quickly grew and the price reporting agency (PRA) Platt’s started surveying and publishing
prices for WTI as well as the sour grades, Louisiana Light Sweet (LLS) and West Texas Sour (WTS).27
The NYMEX WTI contract had a good and well-established location at Cushing underpinning the
physical trades.28
Being land-locked, oil balances at the Cushing storage hub are subject to changes in flows and
infrastructure in and around the hub. For this reason, the oil price crash in 1986 led to a fall in domestic
20
Saudi Arabia was forced to take on a role of a 'swing' producer, absorbing the impact of changes in supply and demand. Ever
since the last Iraqi war at the end of 2011, the Saudis have used their large excess capacity to balance the market and regain
leadership status within the Organisationl.
21
The price is set to be equal to the value of the products derived from the given crude. In effect, it guaranteed a refinery
margin which, in periods of excess refining capacity which prevailed at the time, resulted in falling products prices. This in turn,
led to a collapse of oil prices.
22
A similar event happened later, at the end of 2014, in response to the growing US shale output. In both cases, it was
previously high oil prices (1970s and early 2000s respectively) that encouraged new investment in exploration and production,
eventually (with a time lag) resulting in oversupply. In the 1979 to 1985 period, oil’s share of primary energy demand fell from
48% to 40%. World Bank (1995), p. 1.
23
Montague (1903, Tarbell (2003).
24
The national Oil Company Pemex of Mexico pioneered it. It involves setting ‘official’ discounts relative to other ‘marker’ grade
such as Brent. These discounts are usually set once per month and would reflect relative quality differential between the two
grades of oil. However, the ‘absolute’ price level is set on daily basis by the marker crude.
25
WTI is a light crude oil, with an API gravity around 39.5 and 0.24% sulphur; Brent has an API of about 38 and is 0.37%
sulphur, and Dubai is 'sour' or high sulphur (about 2%) with API gravity of about 31. Qualities of these grades have varied over
time. Most importantly, over time, they simply became ‘brand names’ for baskets of crudes deliverable against these contracts.
For details see Imsirovic (2019) and Fattouh and Imsirovic (2019).
26
It is generally accepted that Dubai benchmark is derived from Brent. See Imsirovic (2014).
27
For a historical overview see: Purvin & Gertz (2010).
28
Ibid. ‘The Cushing location not only represented a gathering hub for the local crudes for refiners in Oklahoma, Kansas and
Missouri, but it also was the central gathering point for terminus of pipelines originating in Texas and Oklahoma with onward
distribution to the main refining centres in the central and eastern Midwest markets in Indiana, Illinois and Ohio.’
5
The contents of this paper are the authors’ sole responsibility. They do not necessarily represent the views
of the Oxford Institute for Energy Studies or any of its Membersproduction by over 1.5 mbd and change in flows around the hub. 29 Starved of the local crude oil, inland
refineries had to import oil from the US Gulf (USG) using reversed pipeline flows.30 Given the ‘price
war’ at the time (not unlike the markets in 2020), foreign imports became competitive again and NYMEX
(now CME) soon introduced an ‘alternative delivery procedure’ which allowed for the foreign sweet
crudes to be delivered into the contract.31 This increased the ‘depth’ of the market; there was more oil
to be delivered into the contract and more new players to do so. Open interest took off in 1986 and
grew steadily from about 100,000 contracts then, to about half a million contracts in 1990s.
The greatest challenges for the WTI benchmark followed the increases in the Canadian production,
particularly the huge growth in shale output, eventually leading to the lifting of the oil export ban in 2015.
This trend started somewhat earlier, in the mid-1990s with increasing Canadian oil sands production 32,
which was mainly exported to the US where the Midwest and Midcontinent refineries invested in
upgrading their facilities to take advantage of these cheap barrels. 33
After 2011, US shale oil production picked up substantially, choking off international imports and
resulting in domestic oversupply. As there was a ban on US oil exports at the time, excess supply
resulted in the price of WTI falling relative to other benchmarks. Oversupplied and banned from exports,
WTI started trading at deep discounts to Brent as well as domestic LLS and became useless for trades
in waterborne international markets. USG refineries and exporters of sweet crude from Europe and
West Africa started to rely on LLS as an indicator of market fundamentals at the USG refining hub.
Unhappy with the state of affairs, in 2009 Saudi Aramco switched from Platts WTI benchmark to The
Argus Sour Crude Index (“ASCI”)34 followed by Kuwait and Iraq later. The future of the benchmark was
seriously in question. Fortunately, common sense prevailed, and the US oil export ban was lifted in
December 2015, relieving the pressure at Cushing and lifting prices. WTI reconnected with the
international oil markets, increasing and eventually achieving record volumes of open interest. 35
The explosive development of the Brent market started in a parallel and similar fashion: The Thatcher
government’s opening of the energy markets to competition in the UK in 1981 and 1982 was
instrumental in growth of free markets. Exploration and production business of the national ‘champion’
British Oil national Corporation (BNOC) was denationalised, later to become a part of BP. Brent trading
started as a ‘forward’ physical or ‘cash’ market where oil was ‘churned’ for tax optimisation reasons;
dated Brent was simply spot traded Brent with loading dates. 36 Being a price of actual physical oil,
Dated Brent is generally used as a benchmark for trades of other types of crude oil. PRAs such as
Platts and Argus report a wide variety of price differentials (for instance, Urals, West African,
Mediterranean, North Sea and even many Asia-Pacific crudes) vis-à-vis the Forward Dated Brent. This
allows refineries to compare relative values of different qualities of oil and calculate which are the most
optimal for their systems.
Due to falling production, other sweet North Sea grades were gradually introduced into the Brent
delivery mechanism forming what we now call a Brent or ‘BFOET basket’ comprising and named after:
29
Ibid, p. 14. WTI dropped to near $10/Bbl at the lows in 1986. ‘… 25,000 producing wells were lost in 1986 and by 1990 that
drop had approached 45,000 wells versus the peak number in 1985.’
30
Seaway pipeline was converted (again) from gas to oil and started importing USG oil in 1996.
31
In 2020 Platts and Argus are considering inclusion of WTI into the ‘Brent’ contract. How times have changed!
32
Conventional production in Canada peaked at over 1.5 mbd in 1970; however, ‘oil sands’ production took off sharply in 2000s
supported by high oil prices, raising total production to well over 3.5 mbd in 2018, most of it exported to the US.
33
Due to geography and environmental reasons, Canadian production is ‘landlocked’ and confined to a monopsony buyer.
34
The ASCI differential index is a daily volume-weighted average of deals done for the component crude trades of US sour
grades of oil: Mars, Poseidon and Southern Green Canyon; it is expressed as a differential to WTI.
35
This was not a smooth process. With shale output increasing by over 1 mbd on annual basis, offtake pipeline capacity lagged
behind until at least 2020.
36
It means that the nomination procedure has been completed and a three-day laycan or loading window is known. The
seminal work on Brent, explaining details of the original forward market is Mabro and Horsnell (1993).
6
The contents of this paper are the authors’ sole responsibility. They do not necessarily represent the views
of the Oxford Institute for Energy Studies or any of its MembersBrent, Forties, Oseberg, Ekofisk and Troll crude oils. 37 Physical volumes of oil in the ‘Brent basket’
have increased over time by widening the ‘window’ of cargo loadings which qualify for the price
assessment of Dated Brent. Brent has been trading as a futures contract since 1983 and is listed on
both ICE and CME exchanges.
By the late 1980s, global oil price formation mechanisms were firmly established. In subsequent
decades, the market faced some difficult challenges, especially in terms of price levels and volatility.
The key benchmarks overcame these challenges by evolving and adapting rather than radically
changing. Their liquidity, coupled with a web of various derivative instruments based on them, enabled
a smooth and relatively riskless flow of barrels across the globe. By contrast, natural gas price formation
would change significantly over the following four decades. This is the topic of the following section of
the paper.
Gas Pricing: the long (and painful) march towards Economics 101
Historically, natural gas started out as a `poor relation’ of oil. It was a by-product of oil production with
‘little or no value’38, usually flared or re-injected into the field to maintain the oil well pressure. As many
fields were far from centres of consumption, it was often left in the ground as a stranded asset. This
was due to its characteristics. Being a gas, it has low calorific value per volume (diesel contains about
850 times more energy) 39 and it is difficult to store and transport 40. While oil has found a niche in the
transport sector where it is hard to replace (given its high energy density and ease of storage and
transport), gas competes with most other fuels in power, industry, residential and commercial sectors.
The history of natural gas price formation can be simply summed up: the gas community never believed
that prices should be set by the forces of supply and demand for gas i.e. Economics 101. 41 Theoretical
literature provides little guidance because the major energy and resource price theorists were writing
before natural gas became a significant energy source. 42 A theory worth considering is that gas pricing
has been a product of discriminating monopoly behaviour – arising from natural monopoly - in the many
markets where, by virtue of their monopoly positions, sellers or buyers were able to segment domestic
and international markets and charge customers different prices for the same product. 43
Major obstacles to changes in price formation have been lack of transparency (commercial
confidentiality is often a condition of international contracts and domestic prices are not available in the
official statistics of many countries), and a plethora of units (btu, cubic metres, megawatt hours, therms,
tons of LNG) and currencies. This is a stark contrast with the common, relatively straightforward and
transparent dollars per barrel of the oil sector. A rough but acceptable generalisation is that over the
past 40 years, in Europe and North America - markets which have accounted for the majority of
international gas trade and have transitioned from monopolistic to competitive markets - prices have
moved from:
37
The physical oil underpinning the benchmark has been maintained by adding alternative delivered grades: Forties
(introduced in 2002, with Buzzard field entering production in 2007), Oseberg (2002), Ekofisk (2007), and most recently Troll
(2018). What is left of Brent blend crude oil, loading at Sullom Voe terminal, is now just a brand name.
38
BP 1977, p.372.
39
Calorific values of gas and diesel are about 55 and 45 MJ/ kg and densities are about 0.8 and 840 kg/ M3 respectively; which
means calorific value of diesel is almost 850 times that natural gas per volume (cubic meter here).
40
On a flip side, reservoir recovery of natural gas fields is about double (70–80 percent) that of oil (30–40 percent). Unlike oil,
gas requires relatively little processing before it is sold.
41
This section deals mainly with international gas pricing or the price of gas delivered to importing countries either by pipeline
or as LNG. The pricing of gas to end-consumers in national gas markets is a much more complex subject and may or may not
relate to international prices depending on customer class. Very few gas and LNG exporting countries deliver gas to their
domestic markets at prices related to their exports.
42
A possible exception would be Coase’s transaction cost theory which considers long term contracts a determining factor in
the development of markets
43
Allsopp and Stern (2012).
7
The contents of this paper are the authors’ sole responsibility. They do not necessarily represent the views
of the Oxford Institute for Energy Studies or any of its Members fixed, regulated or cost-related mechanisms through..
prices linked to crude oil or oil products and finally to..
market, spot or hub-based prices.
However, Asian markets, which import 70–75% of global LNG, remained largely monopolistic and
dominated by oil-linked pricing.
The Evolution of Market Pricing in Different Countries and Regions
If a definitive date can be placed on the start of national and international market pricing for gas it is
April 1990 with the start of the NYMEX futures market based on Henry Hub spot prices (although the
latter had been quoted since the mid-1980s).44 The US and Canada had emerged from a decades-long
period of regulated prices and, following a brief period of (now long forgotten) oil-related pricing (which
included Mexico), began a period which 30 years later continues to evolve in terms of depth and
complexity.45 Deregulation unleashed conventional gas supplies which had been constrained by the
state and federal rules, creating a significant surplus of supply over demand and liquidity for Henry Hub
(and other emerging hubs).46
The next example nearly a decade later was in Great Britain 47 where, following a long period of cost-
related pricing, the privatisation of British Gas ended its monopoly and opened the market to
competition. This resulted in a flood of new gas supply, the creation of the National Balancing Point
(NBP) in 1996 and the following year by the NBP futures contract on the Intercontinental Exchange
(ICE).48 NBP liquidity began to increase and climbed steadily through the 2000s. A feature of the British
gas market was that, aside from a large Norwegian import contract, oil-linkage was never a significant
price formation mechanism.
The Continental European price transition
More than a decade after Great Britain, and many false starts, continental north west European gas
hubs began to achieve materiality due to a combination of surplus supply and the development of
regulated third party access.49 This finally broke the stranglehold of the monopoly gas suppliers which
had operated the oil-linked pricing system, based on the Groningen principle of netback market pricing
from oil products (mainly fuel oil and gas oil) since the emergence of a large scale gas market in the
late 1960s and early 70s. 50 This principle had been logical at the start of the natural gas era as
customers needed to be persuaded to switch from oil products to the new fuel, which required it to be
priced relative to (but below) their existing energy source.51
Over time, both the NBP (Sterling) and the Dutch TTF (Euro) hubs increased their liquidity and,
facilitated by the EU gas target model and introduction of entry/exit pricing which required all EU gas
markets to trade gas at a virtual or physical trading point, market hubs (with varying degrees of liquidity)
emerged all over Europe.52 In 2018 Gazprom established its own electronic sales platform and had
44
Foss (2012) which also includes detail on Canada and Mexico. IEA (1998), pp. 93-118.
45
For a brief history of North American international pricing including the oil-linked period see Stern (2012), pp. 46-54.
46
Foss, loc.cit.
47
The designation `Great Britain’ is deliberate as Northern Ireland’s gas (and power) regime is governed by different laws.
Northern Ireland did not have an ‘NBP’ equivalent until 2015 when the NIBP was created in order to comply with European
Union Directives.
48
Heather (2010), (2015) and (2019).
49
Stern and Rogers (2014).
50
More details can be found in Stern (2012).
51
The dissenting voice at that time was Professor Peter Odell who maintained that oil-linked pricing was never logical and had
been created to high profits for upstream companies as well as the Dutch State. Odell (1969).
52
Heather (2015) and (2019); Yafimava, (2013).
8
The contents of this paper are the authors’ sole responsibility. They do not necessarily represent the views
of the Oxford Institute for Energy Studies or any of its Membersbeen forced by European competition (anti-trust) authorities to offer hub prices to its (previously captive)
customers in central and south east Europe. 53
Figure 2: Long Term Oil-Indexed and European Spot Prices 2010-20 (€/MWh)
45
40
35
30
€/MWh
25
20
15
10
5
0
Jul-11
Jul-16
May-12
Jun-14
Apr-15
Jun-19
Aug-13
Nov-14
May-17
Dec-16
Aug-18
Nov-19
Sep-10
Feb-11
Dec-11
Mar-13
Jan-14
Sep-15
Feb-16
Mar-18
Jan-19
Oct-12
Oct-17
TTF Day Ahead Monthly Average NWE Oil-Indexed LTC
Source: Platts, European Gas Daily.
With energy and gas demand falling, LNG supply being diverted from the US (where the shale gas
revolution had removed the need for imports into the newly built regasification terminals) and oil prices
rising around $100/bbl, the commercial position of those with oil-linked contracts became untenable.
Post-2008, their purchase prices were significantly higher than hub prices which were increasingly
visible and available to end-users (as shown in Figure 2).54 Commercial pressures mounted very rapidly
and the transition of European long-term gas contracts from oil-linked to hub-based prices was
exceptionally painful, involving substantial numbers of international arbitration proceedings a few of
which were still ongoing in 2020.55 By the time of the next great disconnect between oil-linked and hub-
based prices at the end of the 2010s, the transition was virtually complete in most major European
markets.
In 2005, nearly 80% of European gas was sold on an oil-linked basis but by 2018 that figure had fallen
to around 25% with 75% of European gas sold at spot or hub prices (and regulated prices had virtually
disappeared). But there remained considerable differences between regions as Figure 3 shows. 56 By
2018, north west Europe was virtually 100% market priced in comparison to less than 30% in 2005. In
Central Europe, market pricing only emerged around 2010 but had increased to around 75% by 2018.
Mediterranean gas markets still had more than 50% of their gas indexed to oil, and Italy accounted for
much of the remaining 45% which was market-priced. South East Europe, which is mostly comprised
of small markets still had 35% of gas linked to oil but the majority of the remainder was market-priced.
53
Gazprom had previously been a very strong supporter of oil-linked prices. Stern and Rogers (2013); Sharples and Henderson
(2019); Stern and Yafimava (2017).
54
For the early years of this transition see Stern and Rogers (2012) and (2014).
55
Similar problems had been experienced in North America and Great Britain but most of those were between parties in the
same legal and regulatory jurisdiction, whereas continental Europeans were dealing with Gazprom, Sonatrach and other LNG
exporting countries.
56
Analysis of pricing at a regional level has been greatly assisted by the publication since 2006 of the International Gas Union
(IGU) Wholesale Price Surveys.
9
The contents of this paper are the authors’ sole responsibility. They do not necessarily represent the views
of the Oxford Institute for Energy Studies or any of its MembersFigure 3: Gas Price Formation* Transition in Different Regions** of Europe (2005–18)57
*OPE – oil linked, GOG – Hub-based (or market prices), BIM – bilateral monopoly, NET- neback from final
product, RCS- regulated cost of service, RSP – regulated social pricing, RBC- regulation below cost, NP – no
price.
**NW Europe: Belgium, Denmark, France, Germany, Ireland, Netherlands, UK
Central Europe: Austria, Czech Rep, Hungary, Poland, Slovakia, Switzerland
Mediterranean Europe: Greece, Italy, Portugal, Spain, Turkey
SE Europe: Bosnia, Bulgaria, Croatia, FYROM, Romania, Serbia, Slovenia
Source: IGU various years.
In summary, by the end of the 2010s most of the major European markets had moved to market pricing.
In the south east and Mediterranean regions of Europe oil-linked prices remained important, and in
some smaller markets still dominant, but the trend towards market-pricing was clear and ongoing.
The Focus Switches to LNG
With a few regional exceptions, North American and European gas markets are overwhelmingly pipeline
markets but in Europe, LNG is important as the marginal supply source. The changes described above
led to the share of global pipeline imports linked to oil prices falling from 57% in 2005 to 30% in 2018;
over the same period market-priced imports rose from 23% to 61%. 58 Global LNG import pricing
changed rather less during 2005-18 with oil-linkage still dominant but falling from 82% to 66%, and the
share of market-priced LNG rising from 13% to 34%. 59 In the second half of the 2010s, the focus of
attention switched to LNG pricing, partly because of the huge increase in global LNG supply but also
because of the volatility of oil prices which in turn impacted oil-linked LNG contracts. The final bastion
of oil linkage is Asia and especially the major and emerging LNG markets where traditional long-term
contracts are based on and indexed to crude oil prices.
57
The region not included here is Scandinavia and the Baltics which includes: Estonia, Latvia, Lithuania, Norway, Sweden. This
region accounts for a relatively small percentage of European gas demand and in 2018 was 40% oil-linked and 60% hub-
priced. IGU (2019), p.59.
58
Ibid, Figure 3.3, p.23.
59
Ibid, Figure 3.5, p.24.
10
The contents of this paper are the authors’ sole responsibility. They do not necessarily represent the views
of the Oxford Institute for Energy Studies or any of its MembersJCC Pricing
Crude oil price linkage was introduced into Japanese LNG import contracts in the 1970s when LNG
was replacing crude oil in Japanese power stations. By the time that Japan was joined by other LNG
importers in the Pacific Basin (South Korea in 1986 and Taiwan in 1990), the pricing principle of the
“Japan Crude Cocktail” – usually abbreviated to JCC60 – was well established. The price formula is
based on the average price of crude oils imported into Japan, and the main focus of commercial
negotiations is the index – known in Pacific LNG contracts as `the slope’ – or the extent to which the
LNG price changes in response to a change in crude oil prices. 61
Over subsequent decades, Japanese electric power utilities moved away from crude oil-fired generation
with the exception of peaking and emergency situations (for city gas companies, crude oil was never a
competing fuel). It was also somewhat strange that South Korean and Taiwanese (later followed by
Chinese and Indian) LNG buyers should price their imports relative to crude oils imported into Japan.
Despite these contradictions, the JCC pricing and contractual framework worked well for many decades
(similar to oil product-linked pricing in Continental Europe) since in all Asian countries, gas was
replacing oil products in stationary energy balances. Cost pass-through mechanisms protected
importing utilities from risks associated with purchase prices, and although Japan and South Korea
flirted with liberalising their gas and power markets in the 1990s and 2000s, this never progressed to
exposing incumbents to (what in North American and European markets would be considered) serious
competition.62
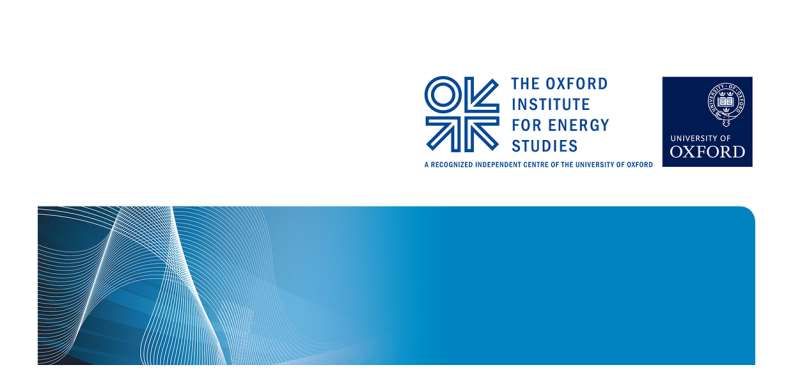
Figure 4 shows US and European hub and Asian LNG prices for the period 2008-20. In 2008, the
regional prices were in a narrow band, and for most of 2009 regional spot/hub prices 63 were also roughly
equivalent but broke apart over the course of 2010. The period 2011-15 saw an unprecedented spread
of regional prices: Henry Hub prices averaged $3-5/MMbtu at the same time as Asian LNG prices were
in double figures – reaching $18/MMbtu at their height – with European prices close to and occasionally
above 10/MMbtu. This period was a product of a coincidence of events, none of which could have been
foreseen:64
rapid low cost shale oil and gas development in North America;
Brent crude oil prices at or above $100/bbl;
the impact of recession and liberalisation forcing European markets to move from oil-linked to
market pricing;
the Fukushima disaster and subsequent closure of Japanese nuclear reactors, combined with
problems in the Korean nuclear sector and rapid economic growth in China, creating far high
demand for LNG in Asia than had been anticipated.
60
The official name is “Japan customs-cleared crude oil price”.
61
Flower and Liao (2012). For details of the history see Stern (2012), pp. 68-73.
62
In the late 2010s competition was introduced into the Japanese gas and power markets but, in the gas sector had still not
reached significant proportions. Aside from Singapore (which has a liberalised gas market), other Asian LNG importers had
made little progress towards liberalisation with the exception of China where structural changes were being introduced, and
Malaysia where legislation and regulation were in place. Meidan (2019), O’Sullivan (2019). Kumar and Stern (2020).
63
Asia’s JKM spot price only began regular quotations in early 2009.
64
These were the main factors but there were also others. Stern (2016).
11
The contents of this paper are the authors’ sole responsibility. They do not necessarily represent the views
of the Oxford Institute for Energy Studies or any of its MembersFigure 4: US, European and Asian Natural gas Prices 2008-20 ($/MMbtu)*
25.00
20.00
15.00
$/MMbtu
10.00
5.00
-
Jul-16
Jul-08
Jul-09
Jul-10
Jul-11
Jul-12
Jul-13
Jul-14
Jul-15
Jul-17
Jul-18
Jul-19
Jan-17
Jan-08
Jan-09
Jan-10
Jan-11
Jan-12
Jan-13
Jan-14
Jan-15
Jan-16
Jan-18
Jan-19
Jan-20
HH TTF JKM Japan Average
*`Japan Average’ is roughly equivalent to crude oil-linked JCC prices; February-April 2020 are estimated taking
into account the lag effect of crude oil prices in long term LNG contracts.
Sources: Platts and Argus data.
Figure 4 shows that by early 2020, regional spot prices had again converged significantly and in Europe
and Asia had reduced to historical lows. This happened significantly before the collapse in oil prices
which can be ascribed (at least in part) to the coronavirus pandemic. The fall in gas prices was caused
(at least partially) by a 25% increase in global LNG capacity in the five years up to 2019 (and especially
spot and short-term LNG deliveries) with an additional 10% expected in 2020.65
But the 2011-15 period had convinced many LNG project promoters that $10-15/MMbtu would be the
long-term price range for LNG, driven principally by high Asian demand led by China and India. This
was despite evidence that domestic wholesale price levels in many non-OECD countries had never
been high enough to support imports in this price range without substantial government subsidy. 66 And
furthermore that the surge in Chinese gas demand – a product of very high GDP growth and coal to
gas switching policy – might not be sustainable. This period of historically high prices in Asia, and an
unprecedented regional price spread, informed the decisions of many project developers, particularly
in the US, to press ahead with new LNG projects. US projects were welcomed by Asian buyers because
they introduced a new price formation mechanism based on Henry Hub rather than JCC prices.
Henry Hub-based pricing
The first US LNG projects, with Cheniere as the seller, created a Henry Hub-based price formula to sell
LNG to buyers on an FOB basis. The formula was the Henry Hub futures price multiplied by 1.15 to
cover the cost of gas consumed as fuel in the liquefaction process and transport costs to the liquefaction
facility, plus a liquefaction fee. The liquefaction fee in Cheniere’s first agreement was set at
65
Global capacity rose from around 400 bcm in 2014 to more than 500 bcm in 2019 and will increase to 560 bcm in 2020.
Fulwood (2020a), Corbeau (2016), Figure 10.1, p. 565.
66
Stern (2019) Table 1. showed that in very few non-OECD countries currently importing (or expecting to import) LNG were
wholesale gas prices consistently higher than $8/mmbtu during the period 2000-18, and in many countries prices were
significantly below that figure.
12
The contents of this paper are the authors’ sole responsibility. They do not necessarily represent the views
of the Oxford Institute for Energy Studies or any of its Members$2.25/MMBtu; for subsequent customers this rose to $2.50 and $3.00/MMBtu. 67 During 2011-15, Henry
Hub prices in the $2-5/MMbtu range meant that those signing US LNG contracts during this period
could anticipate delivering LNG to Asia for $7-10/MMbtu, and in Europe at somewhat lower figures,
thereby earning a healthy profit. As the regional price spread closed in 2015/16 with prices converging
to a relatively narrow range in 2019/20, US LNG exports became increasingly commercially problematic
with buyers struggling to cover even their short run marginal costs, let alone the full cost of deliveries. 68
The post-2016 period has therefore exposed the problem of commercial decision-making based on
price level rather than price formation. Henry Hub prices reflect supply/demand conditions in the US
market, and it was therefore always a risk to sign long-term LNG offtake contracts for sale to markets
with different supply/demand dynamics.
Despite their current commercial difficulties, US LNG export projects made two valuable contributions
to global LNG and natural gas trade:
for the first time in many decades, Asian LNG buyers were able to purchase LNG on some
basis other than crude oil;
US LNG is sold fob i.e. the destination market is at the discretion of the buyer. The majority of
the US volumes have been purchased by `portfolio players’ – mostly the international oil and
gas companies, but also some large national buyers – who have purchased on a long term
basis but are selling on a short term basis to the markets where they can achieve the best
prices. The revolutionary aspect of portfolio player model is that there are no sales contracts
with end-users and hence no contract prices. The players take the risk that the market price –
however determined – will cover their LNG acquisition and delivery cost. 69
Short term LNG trade and JKM
In addition to their contribution to global LNG supply, the US projects made a major impact on trading
liquidity and the emergence of an Asian LNG price marker.
67
Stern and Rogers (2014). These were modified tolling contracts where Cheniere sourced the gas and delivered it to the
liquefaction plant with the buyer taking delivery at the outlet of the liquefaction plant. Other US projects included pure tolling
contracts where the buyers perform the supply and delivery functions themselves, paying the operator of the liquefaction plant
only a tolling fee.
68
Fulwood (2020a). Buyers who have signed a long term contract for US LNG supplies are contractually obliged to pay the
tolling fee ie the $2.50-3.00/MMbtu quoted above and therefore this is similar to `take-or-pay’ and is therefore `sunk cost’. If
they also own (rather than having to charter) the LNG ships they may also regard the shipping cost as sunk. Their short run
marginal cost is therefore the Henry Hub price plus the cost of getting the gas to the terminal (HH*1.15 in the example above)
plus regasification cost if applicable.
69
Rogers (2017).
13
The contents of this paper are the authors’ sole responsibility. They do not necessarily represent the views
of the Oxford Institute for Energy Studies or any of its MembersFigure 5: Spot and Short Term* Deliveries as a Share of Total LNG Trade 2010–19.
180 50
160 45
40
140
35
% spot and short term
120
30
100
Bcm
25
80
20
60
15
40
10
20 5
0 0
2010 2011 2012 2013 2014 2015 2016 2017 2018 2019
*Defined as deliveries under contracts with a duration of 4 years or less.
Source: GIIGNL (2020), p.35.
Figure 5 shows that spot LNG deliveries and short-term trading has expanded substantially in the 2010s
reaching 34% of total LNG trade in 2019. 70 In that year, around 60% of these cargoes were delivered
to Asia71, and can be assumed to be largely based on the Platts Japan-Korea Marker (JKM) price.
Figure 6: Japan/Korea Marker (JKM) Derivative Trades 2017-20
Source: Platts.
70
Note that spot and short-term contracts are those of up to 4 years which is substantially longer than traditional definitions of
spot trade. Shell (2020), p.25 shows that around 1600 spot cargos were delivered in 2019.
71
Ibid.
14
The contents of this paper are the authors’ sole responsibility. They do not necessarily represent the views
of the Oxford Institute for Energy Studies or any of its MembersFigure 6 shows that trades using JKM have expanded substantially since 2018 in terms of futures,
options and swaps. In June 2018, physical trade in cargoes began using JKM `Market on Close’
methodology and by the end of 2019 these had expanded very rapidly. 72 This rapid expansion of short-
term trade in Asia seems likely to accelerate the development of market pricing facilitated – as it was in
North America and Europe – by a prolonged supply surplus. With further significant additions to LNG
supply assured by final investment decisions on projects in 2019 73 , and uncertain gas demand
prospects due to anticipated recession due (at least in part) to the Coronavirus pandemic (but potentially
offset by low LNG prices), market pricing will continue to spread across Asian markets. Issues yet to be
resolved are:
whether JKM will be sufficient as a price marker for the entire Asian market or whether national
or regional market hubs74 will be required (as in North America and Europe);
whether regional hubs can be created in the absence of any significant liberalisation of the
major Asian gas markets and access to LNG terminals and pipelines still mostly at the discretion
of dominant national and regional players;
The collapse in Asian LNG prices in 2019 ahead of the 2020 oil price collapse raised the possibility of
a European-style tsunami of price reviews and arbitrations, with confirmation that at least some
proceedings were underway. 75 This seemed to be overtaken in 2020 by Asian buyers (led by China and
India closely followed by Japan and Korea) claiming force majeure on their LNG contracts based on a
combination of inability to take cargos (due to a collapse in demand) and logistical problems at ports
due to coronavirus.76
Is 2020 just an extreme cyclical event or an acceleration of the energy
transition?
The collapse in oil and gas prices in 2020, due to the decline in economic activity stemming from
coronavirus pandemic is leading to a debate on whether it is just an extreme version of the familiar
commodity cycle or whether it may result in a turning point for oil and gas markets, accelerating the
transition away from fossil fuels towards a low carbon era.
Just an extreme cyclical event?
Following the ‘Great Recession’ of 2008, OPEC struggled to balance the market by cutting production,
only to see its market share diminish. Price levels in excess of $100/bbl in the early 2010s attracted
new entrants into the market, leading to massive investments in production and new technologies77. In
particular, US shale production exposed OPEC’s vulnerability: member countries have a high ‘social
cost’ of production as their economies are extremely dependent on oil revenues. 78 In November 2014,
it declared a ‘price war’ on shale by increasing output. However, collapsing oil prices caused alarm
among the OPEC members threatening their revenues and, in late 2016, forced OPEC to seek help
from producers outside the Organisation, particularly from Russia the world’s second biggest oil
producer.79 This created a new forum, often referred to as ‘OPEC+’. 80
72
For details see Heather (2020).
73
Final investment decisions on new LNG projects in 2019 totalled more than 90 Bcm of capacity. Fulwood (2020b).
74
Discussion of Asian hub development can be found in: IEA (2013), Rogers and Stern (2014), Fulwood (2019), Kumar and
Stern (2020).
75
Ason (2019).
76
Ason and Meidan (2020); Stapczynski (2020).
77
Cheap money was another factor, spurring investment in the US shale, especially as fracking technology came of age.
78
See Dale and Fattouh (2018)
79
Yermakov and Henderson (2020) explain the likely short-term motives behind Russian decision to join forces with OPEC.
80
A loose alliance of 11 non-OPEC countries including Russia. The ‘Declaration of Cooperation’ was signed in December 2016
and then subsequently extended.
15
The contents of this paper are the authors’ sole responsibility. They do not necessarily represent the views
of the Oxford Institute for Energy Studies or any of its MembersBy the end of the decade, the flow of US crude increased to such an extent it flooded both European
and Asian markets. In March 2020, following an inability of OPEC+ to agree cuts in output, in the face
of the biggest collapse in global demand in recent history caused by the COVID-19 pandemic, prices
fell below $30/bbl causing widespread alarm. On April 12, with unprecedented backing from the US and
other G20 countries, ‘OPEC+’ agreed to cut almost 10 per cent of global supplies. 81 This greatest cut
ever in the history of OPEC+ was not enough to prevent a further ‘disorderly’ price collapse in the US
as WTI price went negative eight days later.82 Other benchmarks may not be so dramatically affected
because of greater storage availablity.83 Much of the volume of the ‘cut’ would have happened anyway,
forced by the lack of demand due to the pandemic, and these events clearly exposed the inability of
OPEC to balance the market unilaterally. The resulting price volatility has severely tested the
benchmarks to, and in the case of WTI beyond, their limits and additional tests lie ahead until demand
recovers.
The `glut’ of LNG supply – long anticipated by observers – finally arrived at the end of 2018, and demand
in Asia was not strong enough support prices. Although there was speculation that LNG import prices
below $6/MMbtu could create significant new demand in low income countries, this has so far not
materialised to the extent that might have been expected. 84 The collapse in regional spot gas prices
can be dated from the start of 2019 and continued throughout that year and into the following year, well
ahead of the 2020 oil price collapse. As we conclude this article, the main spot gas benchmarks are all
in the range of $1.50-2.00/MMbtu, which is unprecedented in terms of price level, and may go lower as
European storage becomes full towards the middle of the year. Even before the Coronavirus pandemic,
natural gas prices were projected to remain low for several years into the 2020s and the consequent
recession will extend this period, possibly somewhat offset by delays in projects under construction due
to logistical problems, and likely further delays for the long queue of projects waiting to take a final
investment decision.
A several year period of prices below $6/MMbtu, which is entirely likely, will accelerate the transition
from oil-linked to market pricing in Asia. There will be arguments that the collapse of oil prices has taken
the pressure off LNG buyers to make this change (because oil indexation means that long term LNG
contract prices have moved much closer to spot prices). But the exposure of LNG buyers to the volatility
of an oil market whose major decision-makers have fundamentally different interests to - and
supply/demand fundamentals which lack any significant correlation with - those of gas, has become
commercially untenable. Gas pricing will become increasingly `global’ with regional differentials
determined mainly by transportation costs. But for as long as Asian markets are not liberalised and lack
liquid national or regional trading hubs, these differentials will not adequately reflect market conditions.
In summary, 2020 is certainly an extreme cyclical event for both oil and gas, and one which could keep
prices low for several years. But it has become clear that oil and gas market dynamics have become
increasingly different over the past several decades 85; both oil and gas are in a situation of oversupply
but for different reasons. The common denominator is the US shale revolution which has significantly
impacted both markets. The start-up of new US (as well as Russian and Australian) LNG projects many
of which had been delayed, coincided with a period of lower than anticipated demand in Asia, and the
lack of any mechanism to ‘balance’ the market. Due to the OPEC+ agreement, the weakness in the oil
market post-2016 was not as apparent and the impact on prices in 2020 was therefore much more
dramatic. Similarly the fall in oil demand, because of the impact on all forms of transportation, is likely
81
This initiative, OPEC++ (as some referred to it) potentially included even more countries such as Canada, US and Norway.
The ‘cuts’ of 9.7 mbd are to be implemented for two months of May and June 2020 and then reduced for the 2H 2020 to 8 mbd
and again to 6 mbd for the 1H 2021. Numbers here are highly debateable depending on the starting point for the cuts,
exemptions etc.
82
Financial Times (2020).
83
Fattouh and Imsirovic (2020).
84
Stern (2019).
85
This does not mean there is no relationship between oil and gas prices. But gas supply and demand both globally, and in
individual markets, will be much more important determinants of gas prices.
16
The contents of this paper are the authors’ sole responsibility. They do not necessarily represent the views
of the Oxford Institute for Energy Studies or any of its MembersYou can also read