The potential market for LNG in the Caribbean and Central America
←
→
Page content transcription
If your browser does not render page correctly, please read the page content below

November 2017

                The potential market for LNG in the
                   Caribbean and Central America

OIES PAPER: NG 124      Ieda Gomes, Senior Visiting Research Fellow, OIES &
                              Martin Lambert, Senior Research Fellow, OIES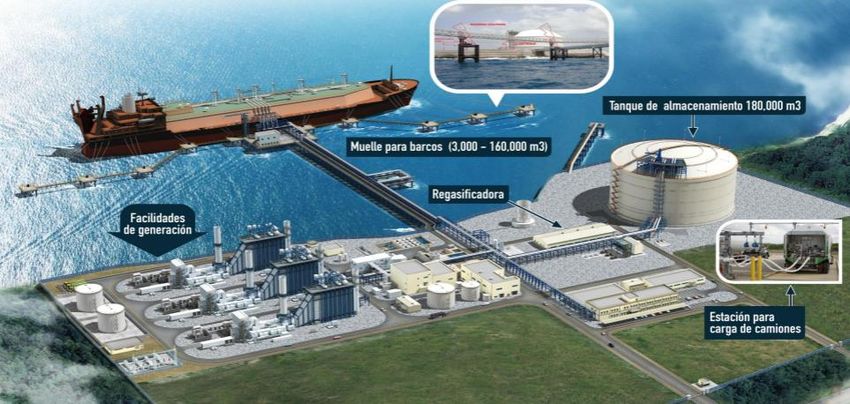
The contents of this paper are the authors’ sole responsibility. They do not
         necessarily represent the views of the Oxford Institute for Energy Studies or any of
                                            its members.

                                          Copyright © 2017
                               Oxford Institute for Energy Studies
                                  (Registered Charity, No. 286084)

This publication may be reproduced in part for educational or non-profit purposes without special
permission from the copyright holder, provided acknowledgment of the source is made. No use of this
publication may be made for resale or for any other commercial purpose whatsoever without prior
permission in writing from the Oxford Institute for Energy Studies.

                                      ISBN 978-1-78467-098-6

                           DOI: https://doi.org/10.26889/9781784670986

                                                                                                      i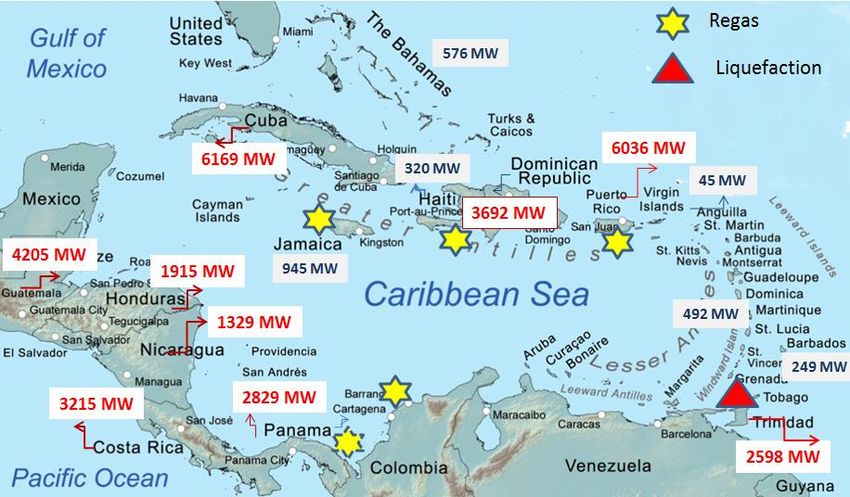
Acknowledgements
The authors would like to express their gratitude to those who provided useful insights, in particular
Tito Sanjurjo and Donald Hubbard, who provided insightful comments about small LNG projects in the
Caribbean.
We would like to thanks James Henderson, director of OIES Natural Gas Programme, for his
guidance and useful comments, as well as John Elkins and Kate Teasdale for the final review and
commenting the paper.

                                                                                                     ii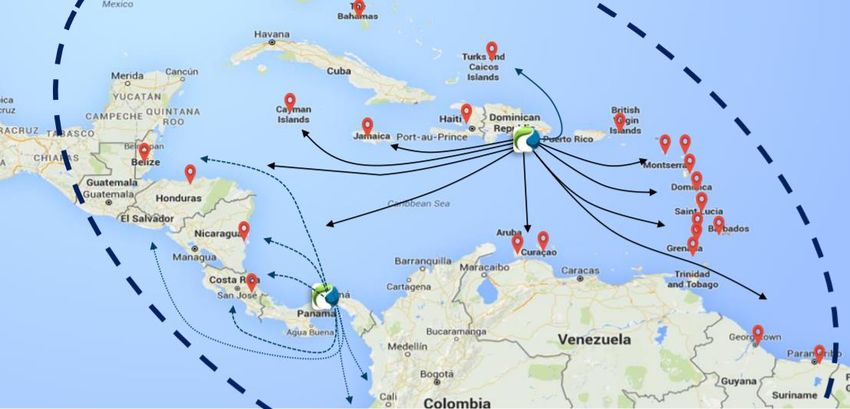
Preface
If gas is to have a secure long-term future in the global energy mix, then it is likely that the industry
will need to come up with creative and innovative ideas to develop new markets, especially in regions
where demand may never match the large volumes imported by traditional buyers such as Japan,
South Korea and Taiwan. Naturally LNG suppliers are likely to focus on large and growing markets
such as China as they seek to find markets for their new developments, but smaller markets can also
be of interest, especially if the competing fuels are relatively high cost liquids such as diesel and
heavy fuel oil.
The countries of the Caribbean provide a useful example of just such markets, and Martin Lambert
and Ieda Gomes have provided in this working paper a fascinating insight into the current and
potential role of gas in the region. They review the current role of gas in the key countries, examine
case studies of innovative business models that are being used to expand gas consumption and
analyse the competitive position of gas relative to the alternative fuels on offer, especially in the power
sector.
Importantly, the authors also draw conclusions for the broader gas industry in terms of the key issues
in developing new smaller markets, and suggest lessons that can be learned from their analysis of the
Caribbean. As such, although the markets they describe are small in themselves, the example that
they provide can offer significant scope for understanding how small markets in a number of other
regions could be developed in the coming years, potentially providing a new area of growth for the
global gas industry.

James Henderson
Director, Natural Gas Programme, OIES

                                                                                                         iii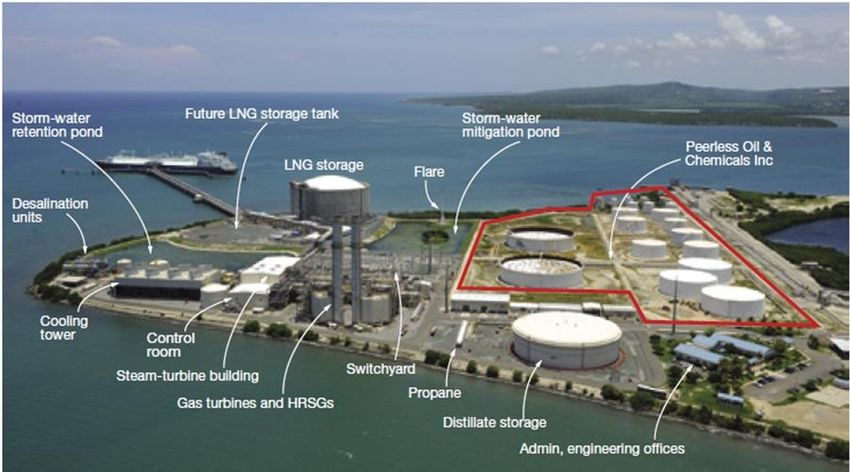
Contents
Acknowledgements .............................................................................................................................. ii
Preface .................................................................................................................................................. iii
Contents ................................................................................................................................................ iv
Figures ................................................................................................................................................... v
Tables ..................................................................................................................................................... v
Glossary ................................................................................................................................................ vi
1. Introduction and context .................................................................................................................. 1
2. Potential market for LNG in the Caribbean and Central America ................................................ 1
3. Overview of potential and existing LNG markets & projects ....................................................... 3
   3.1 Dominican Republic ...................................................................................................................... 3
     Economic and Energy Context ........................................................................................................ 3
     LNG imports ..................................................................................................................................... 5
     Outline Commercial Structure .......................................................................................................... 6
     Future developments and evolving business models ...................................................................... 7
     Other proposed LNG projects, residual demand and growth .......................................................... 7
   3.2 Puerto Rico ................................................................................................................................... 8
     Economic and Energy Context ........................................................................................................ 8
     History of LNG import and future plans ........................................................................................... 8
     LNG import physical arrangement ................................................................................................... 9
     Outline Commercial Structure ........................................................................................................ 10
     Development plans and future potential ........................................................................................ 10
   3.3 Jamaica ....................................................................................................................................... 11
     Economic and Energy Context ...................................................................................................... 11
     History of plans to import LNG ....................................................................................................... 11
     LNG import physical arrangement ................................................................................................. 12
     Outline Commercial Structure ........................................................................................................ 13
     Development plans and future potential ........................................................................................ 13
   3.4 Panama ....................................................................................................................................... 14
     Economy and Energy Context ....................................................................................................... 14
     The energy sector in Panama ........................................................................................................ 14
     LNG import project ......................................................................................................................... 16
     Outline Commercial Structure ........................................................................................................ 17
     Other proposed LNG projects ........................................................................................................ 17
   3.5 Other markets ............................................................................................................................. 18
     AES hub and spoke model ............................................................................................................ 18
     Barbados ........................................................................................................................................ 19
     Bermuda ........................................................................................................................................ 19
     Bahamas ........................................................................................................................................ 19
     Haiti ................................................................................................................................................ 19
4. Logistics, operational and commercial issues: LNG and small markets .................................. 20
5. Electricity pricing policies and regulation of the gas and electricity markets ......................... 21
   5.1 Tariffs .......................................................................................................................................... 21
   5.2 Regulation ................................................................................................................................... 22
6. Analysis of the commercial model and economics of selected projects ................................. 23
   6.1 Jamaica ....................................................................................................................................... 24
   6.2 LNG by ISO-Container (Barbados as example) ......................................................................... 26
   6.3 Panama ....................................................................................................................................... 27
7. Supportive government policies ................................................................................................... 28
8. Insights and Conclusions .............................................................................................................. 28
Appendix .............................................................................................................................................. 30

                                                                                                                                                           iv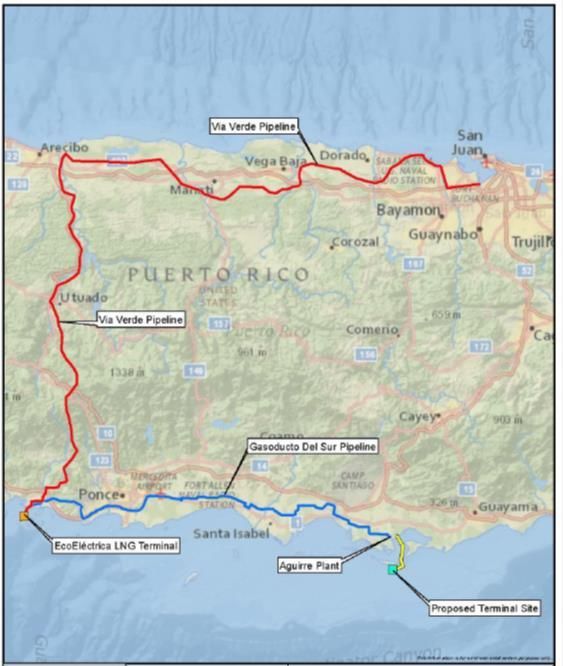
Figures
Figure 1: Central America and Caribbean: installed power generation capacity (MW) .......................... 2
Figure 2: Dominican Republic: key energy data (MTOE) - 2014 ............................................................ 4
Figure 3: Dominican Republic - AES Andres LNG terminal .................................................................... 5
Figure 4: Evolution of LNG consumption in the Dominican Republic ..................................................... 6
Figure 5: Generation mix, Puerto Rico, 2015.......................................................................................... 8
Figure 6: Puerto Rico: Peñuelas LNG import terminal in 2012 ............................................................... 9
Figure 7: Puerto Rico- Proposed Natural Gas pipelines ....................................................................... 10
Figure 8: Jamaica: Energy Consumption and Production (2015) ......................................................... 11
Figure 9: Jamaica LNG infrastructure ................................................................................................... 12
Figure 10: Panama vs Latin American and the Caribbean GDP growth (%) ........................................ 14
Figure 11: Panama: evolution of the supply of energy ......................................................................... 15
Figure 12: Panama: share of installed power capacity (2016).............................................................. 16
Figure 13: Panama: construction site of AES LNG terminal ................................................................. 17
Figure 14: Proposed Hub and Spoke LNG distribution mode for Central America and Caribbean ...... 18
Figure 15: Electricity tariffs in eight Caribbean Islands (USD/kWh) ..................................................... 21
Figure 16: Jamaica LNG Commercial Structure ................................................................................... 24
Figure 17: Barbados LNG by ISO-container commercial structure ...................................................... 26
Figure 18: Panama: Regasified LNG competitiveness vs HFO and diesel .......................................... 27

Tables
Table 1: Caribbean and Central America: addressable market for LNG for power generation .............. 3
Table 2: Dominican Republic: AES LNG payment commitment ............................................................. 7
Table 3: Cost build-up Jamaica LNG .................................................................................................... 25
Table 4: Caribbean and Central America: demographics and generation capacity ............................. 30
Table 5: Caribbean and Central America: power generation capacity and gas supply potential ......... 31
Table 6: Credit rating of select Caribbean and Central America countries ........................................... 32

                                                                                                                                         v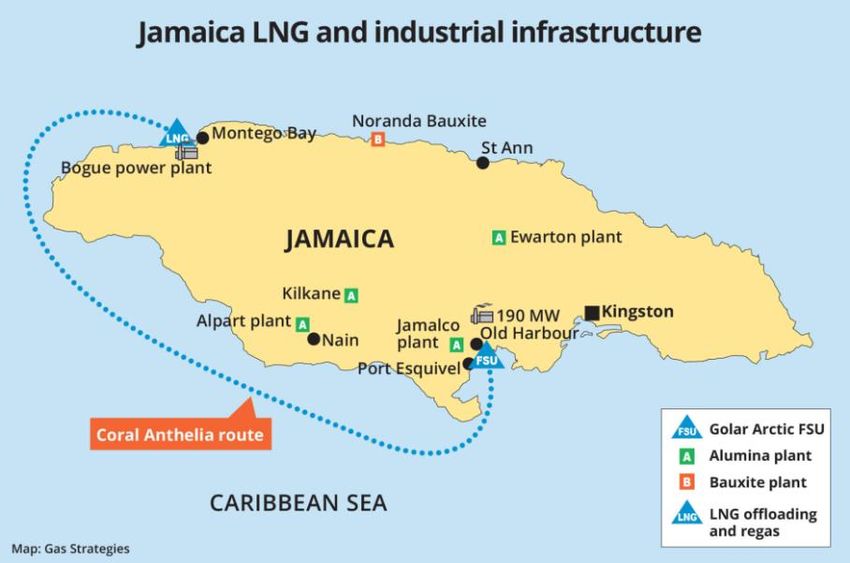
Glossary
Bcma       Billion (109) cubic metres per annum
CNE        National Energy Commission (in DR)
DR         Dominican Republic
FERC       US Federal Energy Regulatory Commission
FSU        Floating Storage Unit
GDP        Gross Domestic Product
GNF        Gas Natural Fenosa
GW         Giga Watts
HFO        Heavy Fuel Oil
JPS        Jamaica Public Service – the national power utility
LNG        Liquefied Natural Gas
m3         Cubic metres
MEM        Ministry of Energy and Mines (in DR)
mmscf      Million standard cubic feet
Mtoe       Million tonnes of oil equivalent
mtpa       Million tonnes per annum
MW         Mega Watts
MWh        Mega Watt hour
NFE        New Fortress Energy
NREL       National Renewable Energy Laboratory (US)
NYMEX      New York Mercantile Exchange
OEA        Organisation of American States
PREPA      Puerto Rico Electric Power Authority
SENI       National Integrated Energy System (in DR)
TBtu       Trillion (1012) British Thermal Units
TWh        Tera (1012) Watt hours
US CPI     Consumer Price Index in the United States of America

                                                                  vi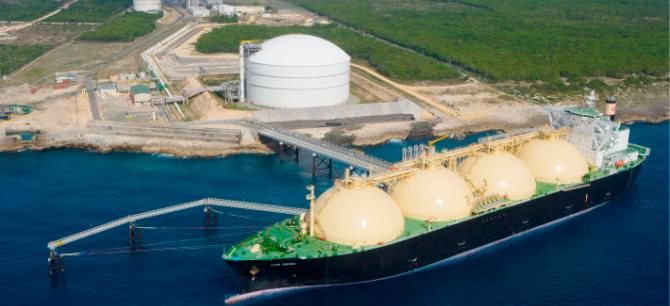
1. Introduction and context
The Caribbean has been described as a potentially ideal region for LNG imports due to its present
dependence on diesel and fuel oil for power generation, high electricity tariffs and its proximity to
regional LNG suppliers in Trinidad & Tobago and on the US Gulf Coast.
The ability to switch from liquid fuels to natural gas is being pursued as a way to lower costs and bring
environmental benefits.
In 2016 the region imported only 2.08 mtpa of LNG, circa 0.8% of the world trade. Until 2016 there
were only two LNG import terminals in the region: in the Dominican Republic and Puerto Rico.
In 2016 two more countries joined the club of LNG importers, Colombia (Cartagena LNG) and
Jamaica with Panama slated to start-up in 2019. Colombia had initially envisaged importing LNG on
the Caribbean coast and exporting LNG from the Pacific Rubiales project, but the latter has been
halted due to market conditions and its sponsor’s financial issues. While Colombia is technically part
of the Caribbean, its characteristics, with an established gas industry and a large reliance on hydro
power generation, make it rather different from other Caribbean markets, so is not considered in detail
in this paper.
The region is also of interest to the wider LNG industry, as some of the technical, commercial and
logistical innovations being developed for the Caribbean may be useful models for developing smaller
potential LNG markets elsewhere in the world (e.g. in Africa, SE Asia, Mediterranean islands). While
other parts of the world have struggled to progress LNG import plans, new projects have been
developed in the Caribbean, such as in Jamaica and Panama, both relying on supply to power plants
and alternative business models appropriate to the local markets. The small size of the markets
presents logistic and commercial challenges for the supply of LNG and for financing the projects.
This working paper provides an overview of the Caribbean markets and the potential for LNG imports
across the region. It also investigates the key commercial, logistics and regulatory challenges for the
development of a natural gas market in the region.

2. Potential market for LNG in the Caribbean and Central America
According to the World Bank1 , the Latin America and Caribbean region (LAC) “seems to have turned
the corner” after six years of economic stagnation. However, the economic impact of hurricanes Irma,
Jose and Maria, which hit the region in September 2017, is yet to be measured but certainly damaged
badly the infrastructure of several islands, which are heavily dependent on tourism.
For this paper, the Caribbean comprises the islands and the countries with Caribbean coastal regions
and islands, starting from the Bahamas in the north and following the archipelago down south to
Trinidad and Tobago. There are 13 independent island nations in addition to territories of France, the
Netherlands, the United Kingdom, and the United States of America. The independent nations are
Cuba, Jamaica, Haiti, Dominican Republic, The Bahamas, St Kitts & Nevis, Antigua & Barbuda,
Dominica, St Lucia, St Vincent and the Grenadines, Barbados, Grenada and Trinidad and Tobago.
The region also includes the territories of Curacao, Saint Maarten and Aruba (Netherlands), Puerto
Rico and US Virgin Islands (USA), Martinique and Guadeloupe (France) , British Virgin Islands,
Montserrat, and Cayman (UK). The study also covers Central American markets, which have a
Caribbean coastal area, including Panama where AES is developing and building the Costa Norte
LNG terminal. Colombia has a coastal area facing the Caribbean and commissioned an LNG import

1
    http://www.worldbank.org/en/region/lac/overview

                                                                                                       1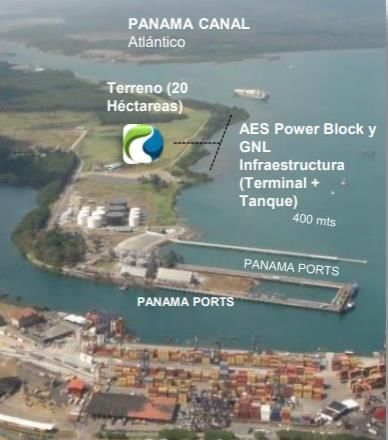
terminal in Cartagena in 2016. However due to the larger size of Colombia’s energy market and a
relatively deep natural gas market, it faces different challenges when compared to the typical
Caribbean and Central American markets. For this reason, this paper does not analyse Colombia’s
LNG market and projects. As of September 2017, the population in the Caribbean and Central
America totalled 73.7 million people with a total power generation installed capacity of 30.6 GW, of
which 15.0 GW is in the Caribbean Islands 2, and 15.5 GW GW in Central America (Appendix, Table
5).
The four largest countries in population are Cuba, Haiti, Dominican Republic and Honduras. These
countries possess a much lower level of generation capacity per inhabitant, when compared to
smaller countries such as Aruba, the Cayman Islands and the US Virgin Islands.
Natural gas is utilised in only a handful of countries: Trinidad & Tobago (LNG exporter), Dominican
Republic, Jamaica and Puerto Rico (LNG importers) and Barbados (domestic gas producer and LNG
importer3). AES is currently building a LNG import terminal in Panama, due for completion in mid-
2019.
The key common features in the region are summarised below:
Heavily dependent on fuel oil and diesel for power generation.
Small-sized electricity markets; industrial market is small and scattered
Lack of transmission and distribution infrastructure for natural gas
As can be seen in Figure 1 below, only a few countries have generation capacity in excess of 1000
MW, namely Puerto Rico, Cuba, Guatemala, Dominican Republic, Costa Rica, Trinidad & Tobago,
Honduras and Nicaragua. Another handful of countries have generation capacity between 400 MW
and 1000 MW, namely Jamaica, Guadeloupe, Bahamas and Martinique. There are 14
countries/territories with installed capacity below 100 MW: Turk & Caicos, British Virgin Islands,
Belize, Saint Maarten, Anguilla, Montserrat, Dominica, St. Kitts & Nevis, Antigua & Barbuda, Grenada,
Curacao, St. Vincent & Grenadines and Saint Lucia.
Figure 1: Central America and Caribbean: installed power generation capacity (MW)
Source: (United Nations, 2014), (Ministerio de Energia y Minas - Guatemala, 2017)
2
Except Cuba with a total installed capacity of 6.7 GW and which is not covered in this study by lack of accurate data.
3
Barbados production in 2013: 55,000 m 3/day.
http://www.indexmundi.com/energy/?country=bb&product=gas&graph=production
2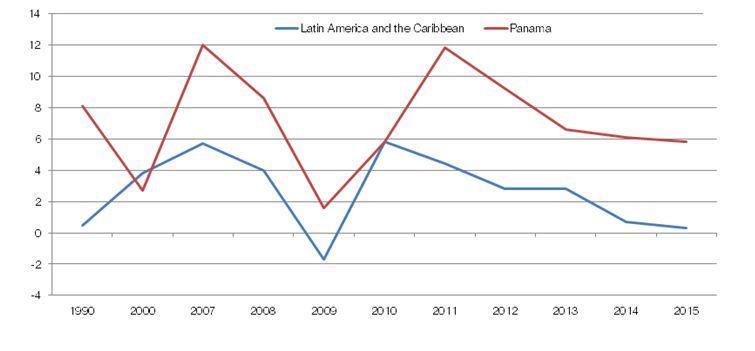
Most of the Caribbean Islands rely heavily on diesel and fuel oil for power generation, except for
Trinidad & Tobago, which uses natural gas extensively in the industrial and power sectors. Most
Central American countries similarly rely on diesel and fuel oil although a few countries such as
Guatemala, Costa Rica and Panama also have important hydro and biomass resources. The
prevailing generation technology in most Caribbean countries consists of medium-speed/low-speed
internal combustion engines running on diesel or heavy fuel oil (HFO)/bunker. These engines are very
reliable and easy to maintain; however, they have low generation efficiency, typically 30%-40%.
According to a study prepared for the Organisation of American States (OEA) , the islands of Antigua
& Barbuda, The Bahamas, Dominica, Grenada, St. Kitts & Nevis, St. Vincent and Grenadines are
signatories to PetroCaribe, a program for purchasing oil from Venezuela with preferential
payment conditions, such as low¬‐interest loans for short-term financing. Each of the above nations
individually enters a bilateral market agreement with the state oil company of Venezuela, Petróleo de
Venezuela (PDVSA), with financing agreements extending for 25 years.
Table 1 and Appendix 2 show that, after deducting existing coal and gas fired capacity in Dominican
Republic, Puerto Rico, Trinidad & Tobago and Guatemala, the generation capacity theoretically
replaceable with LNG in the region is 14.6 GW, of which 5.1 GW is in Central America and 9.5 GW in
the Caribbean Islands4. This would require a maximum theoretical gas volume of 24.2 Bcma, of which
15.7 Bcma is in the Caribbean and 8.5 Bcma in Central America.
Table 1: Caribbean and Central America: addressable market for LNG for power generation
   Region               Installed Capacity      Addressable          Potential gas/LNG
                                               potential for gas       market (Bcma)
                               (GW)
                                                    (GW)
       Caribbean                 15.1                            9.5             15.7
       Islands

       Central America           15.5                            5.1             8.5

       Total                     30.6                            14.6            24.2
Source: Authors’ estimate based on (United Nations, 2014), (Ministerio de Energia y Minas - Guatemala, 2017)

It is worth noting that approximately 550 MW of the addressable power capacity is located in countries
where the maximum substitutable market is below 100 MW and it would be very challenging to supply
natural gas on an economic basis.

3. Overview of potential and existing LNG markets & projects
3.1 Dominican Republic
Economic and Energy Context
The Dominican Republic (DR) is in the island of Hispaniola, which is shared with Haiti. As of July
2017, its population reached 10.7 million people 5 , of which approximately 3 million live in the
metropolitan area of Santo Domingo, the capital city. The 2016 GDP was USD 72.8 billion at the
official exchange rate, a GDP per capita of USD 6,722 and a GDP growth of 6.6% in 2016. For
decades the country has been an exporter of agricultural products such as sugar, coffee and tobacco,
but it has since diversified to tourism, construction, free trade zones and gold mining.
The services sector accounted for 62% of the country’s GDP in 2016. Dominican Republic is part of
the CAFTA-DR, a free trade agreement dating from 2007 between the United States and a group of

4
    Cuba and Martinique are not included.
5
    https://www.cia.gov/library/publications/the-world-factbook/geos/dr.html

                                                                                                               3
smaller countries in Central America: Costa Rica, El Salvador, Guatemala, Honduras, Nicaragua, and
Dominican Republic.6 The US is the destination for half of DR’s exports and remittances from the US
accounts for approximately 7% of the country’s GDP.
As of 2014, total primary energy supply was 7.64 MTOE, of which nearly one quarter was destined to
power generation. Electrification reached 98% of the population. The country has limited hydro
resources; locally produced biofuels and waste account for around 10% of the primary energy supply
and there is no indigenous production of natural gas, oil and coal. 7
Figure 2: Dominican Republic: key energy data (MTOE) - 2014
DR: Energy consumption by sector (2014) DR: Power generation by fuel (2014)
232 608
1920 1869
120
772
1854
1229
1765
Power Refineries Industrial Transport Res/Com Coal Nat Gas Oil Renewables
Source:
https://www.iea.org/statistics/statisticssearch/report/?year=2014&country=DOMINICANR&product=Balances
The structure of the power sector is a result of the reform process initiated in the 1990s, which
resulted in the unbundling of the power sector and enabled the participation of the private sector in
some activities. The Ministry of Energy and Mines (MEM) was formed in 2013, and is responsible for
formulating and managing energy policies. The National Energy Commission (CNE) was established
in 2001, with the task of energy policy development and national energy planning.
In 2016 the total installed capacity in the National Integrated Energy System (SENI) was 3.69 GW
with another 117 MW added through the conversion to combined cycle of the AES DPP plant. The
system is highly dependent on thermal power which accounted for circa 91% of the 15.9 GWh
generated in 2016. 35%of total generation uses Fuel Oil Fuel Oil No. 6, approximately 33% natural
gas, approximately 8% Fuel Oil No. 2 and approximately 15%. In 2016 hydraulic power represented
9.5% of energy generation and wind accounted for 2%8.
The electricity wholesale market is based on centralised economic dispatch. The centralised
Coordinating Organisation (OC)9 regulates planning and supervises the operation through the Centro
de Control de Energía, which dispatches the system on real time using a cost-based merit order.
Dispatches of electricity generation units are based on declared variable costs subject to audit by the
OC. The hydroelectric generation units’ variable cost is equal to zero, so these plants are always the
first for dispatch. The last generation unit dispatched sets the spot price, on an hourly basis, which is
always based on a fuel oil plant.
The SENI comprises 15 power generation companies, one of which is hydro, one transmission
company - ETED (Empresa de Transmisión Eléctrica Dominicana) and three state-controlled
distribution companies, Empresa Distribuidora de Electricidad del Sur (Edesur Dominicana), Empresa
6
https://ustr.gov/trade-agreements/free-trade-agreements/cafta-dr-dominican-republic-central-america-fta
7
IEA: https://www.iea.org/statistics/statisticssearch/report/?year=2014&country=DOMINICANR&product=Balances
8
https://www.one.gob.do/Estadisticas/227/energia-electrica
9
Organismo Coordinador del Sistema Eléctrico Nacional Interconectado: http://www.oc.org.do
4Distribuidora de Electricidad del Norte (Edenorte Dominicana) and Empresa Distribuidora de
Electricidad del Este (Edeeste). The Corporación Dominicana de Empresas Eléctricas Estatales
(CDEEE) is the agent for the wholesale market, which manages the energy contracts with the
independent power producers connected to the SENI.
The distribution system is characterised by large technical and non-technical losses, which amounted
to 33% in 2013 and a large amount of subsidies, which totalled USD 1.27 billion, equivalent to 2% of
the country GDP in 201310.
LNG imports
The Dominican Republic started receiving LNG in 2003 following the commissioning of the Andres
LNG import terminal by AES. The shore-based terminal is located 30 km east of Santo Domingo; it
was designed to receive cargoes of up to 145,000 m 3, with a single storage tank of 160,000 m 3 11 and
supply a newly built 319 MW power plant (Andres). In addition, the LNG terminal is connected to the
AES-owned 236 MW Los Mina DPP power pIant via a 34-km pipeline.
Figure 3: Dominican Republic - AES Andres LNG terminal
Source: http://aeslng.com/services/
Until 2010 the growth of LNG consumption in Dominican Republic was very slow, with AES achieving
contract quantities only in 2011.
In 2016 the Dominican Republic imported 0.8 mtpa of LNG (1 Bcma), 8% less than in 2015 12. The fall
in oil prices has encouraged the dispatch of less efficient oil-based power plants. Also in early 2017
AES added 114 MW to Los Mina DPP power plant by converting the open cycle units into a combined
cycle power plant, which increased the efficiency of the power plant, but will reduce gas
consumption/MWh generated. AES is nevertheless projecting a total demand of up to 42-45 TBtu for
201713 (1.2 - 1.3 Bcma), according to Figure 4.
10
(The Economist Intelligence Unit, 2015; The Economist Intelligence Unit, 2015)
11
http://www.cbi.com/getattachment/ded83ebf-ff1a-462f-adf5-7f1dea3f163e/The-Dominican-Republic-LNG-Import-Terminal-
Challe.aspx
12
GIIGNL: http://www.giignl.org/sites/default/files/PUBLIC_AREA/Publications/giignl_2017_report_0.pdf
13
(Bolinaga, 2017)
5Figure 4: Evolution of LNG consumption in the Dominican Republic
1.2 1.2 1.2
1.1 1.1
1.0 1.0
0.9
Bcma
0.6
0.6 0.6
0.4
0.3
0.1
2004 2005 2006 2007 2008 2009 2010 2011 2012 2013 2014 2015 2016 2017
Source: Adapted from (Bolinaga, 2017)
Outline Commercial Structure
In 2001 an AES subsidiary entered a 20-year, 1 Bcma (33 TBtu/year), Henry Hub indexed, LNG
supply deal with BP Amoco (subsequently BP Gas Marketing Ltd.), containing a commercial
innovation, the so called “branded LNG”, whereby the supply was not guaranteed by a single
nominated production source but by the supplier LNG portfolio. 14 This commercial innovation in 2001
is nowadays very commonplace in the LNG trade. The contract became effective in 2003. The AES
subsidiary then sells LNG to the AES owned Andres and DPP power plants, charging a USD
15,000/month fixed fee plus a variable fee of USD 1.2/MMBtu on top of the LNG purchase price15.
In 2005 AES entered into a 1-year supply agreement with a local retailer, Linea Clave, which procured
LNG at the Andres terminal to supply industrial consumers by truck 16 and subsequently AES executed
additional gas supply deals with other smaller power producers.
The gas and LNG supply contracts are denominated in U.S. dollars with an average initial duration of
three years. The LNG purchase price is passed through to AES consumers who also pay fees
adjusted annually by U.S. CPI for the use of Andres’ services, depending on the point of delivery of
the natural gas (a Terminal Fee, a Truck Loading Terminal Fee and a Transportation Fee).
AES LNG is committed to pay BP nearly USD 1Bn for the contractual amounts due for delivery until
2023, based on NYMEX (Henry Hub) as of 31 March 2017 (USD 3.13/MMBtu), as summarised in
Table 217. Both Andres and DPP power plants have PPAs with the distribution company EDE-Este,
which are also indexed to Henry Hub therefore the changes in LNG prices are passed on to the
ultimate off-taker.
14
http://www.gasandoil.com/news/ms_america/be7dfc213a41b694206965d1251d4385
15
http://aesmcac.com/aesdominicana/wp-content/uploads/2017/03/AES-Andres-BV-Estados-Financieros-Interinos-1Q-2016-
Norma-USGAAP.pdf
16
http://aesmcac.com/aesdominicana/wp-content/uploads/2017/07/FS-ANDRES-USGAAP-1Q-2017-Unaudited.pdf
17 17
http://aesmcac.com/aesdominicana/wp-content/uploads/2017/03/AES-Andres-BV-Estados-Financieros-Interinos-1Q-2016-
Norma-USGAAP.pdf
6Table 2: Dominican Republic: AES LNG payment commitment
Year Payment commitment (USD million)
2017 118.4
2018 159.4
2019 153.3
2020 145.6
2021 154.1
2022 and thereafter 194.7
Total 925.5
Source: http://aesmcac.com/aesdominicana/wp-content/uploads/2017/07/FS-ANDRES-USGAAP-1Q-2017-
Unaudited.pdf
Future developments and evolving business models
The market for natural gas in the Dominican Republic consists of small industries and hotels scattered
in the north coast, therefore it was not viable to build gas infrastructure downstream of the LNG
terminal. This has prompted the development of new business models for natural gas via “virtual
pipelines” of trucked LNG. In addition to directly supplying its two power plants, in 2009 AES installed
two truck-loading bays at the Andres terminal, each one capable of supplying two trucks/hour. There
are currently six LNG distribution companies which supply commercial, industrial and automotive
customers. As of 2016 the natural gas market consisted of 65 industrial users, 7 power plants, 32
CNG stations and 15,000 vehicles.
In 2015 AES started to reconfigure the Andres terminal to allow for LNG re-loads onto ships of
10,000-60,000 cubic metres LNG capacity. AES plans to turn the terminal into an LNG trans-shipment
and bunkering hub for the Caribbean, Central and South America. The first re-load operation took
place in February 2017. According to AES, circa 60,000 and 70,000 cubic metres of LNG was
reloaded from the Andres terminal on to the 138,826 cm capacity Cadiz Knutsen on February 11
201718. AES is also offering to supply LNG to smaller markets via ISO certified cryogenic containers
as well as use their terminals in the Dominican Republic and Panama to develop a “hub and spoke”
business model, serving the Caribbean and Central America.
AES Andres is also considering the construction of a second LNG storage tank to allow supplying an
additional 300 MW of generation capacity.
Other proposed LNG projects, residual demand and growth
Antillean Gas, Ltd is a consortium formed in 2013 by local companies Propagas, Tropigas, Vicini and
InterEnergy, together with Colombian gas distribution company Promigas and international
companies Ipson and BW Group 19 . The latter would be responsible for supplying a floating
regasification unit to the project. The consortium planned to build an LNG terminal at San Pedro de
Macoris, in the eastern region, anchored by approximately 1,000 MW of existing power plants, but the
project has not made significant progress since 2015. This is due to a combination of the restructuring
of the companies in the consortium, reduced attractiveness of LNG vis-a-vis lower oil prices, and
delays in negotiating underpinning PPAs with the government-owned power distribution companies.
In addition, the construction of 770 MW of coal-fired power plant (Punta Catalina), has posed further
challenges for the development of additional gas-fired capacity in the island. The commissioning of
the coal plant is expected to take place in two phases, in 2019 (phase 1) and 2020 (phase 2).
18
https://www.platts.com/latest-news/natural-gas/london/dominican-republics-andres-lng-terminal-completes-21892657
19
(Lluberes, 2015)
73.2 Puerto Rico
Economic and Energy Context
The population of Puerto Rico is currently estimated at around 3.4 million, having fallen from 3.8
million in 200020. GDP per capita in 2013 was estimated at USD 28,700 - up from around USD
16,000 in 200021, but real GDP growth has been negative every year since 2006. The decline in the
economy and the corresponding population decline have been attributed to the removal of tax
incentives for investment, and the higher incomes available in mainland US22. GDP composition is
split roughly 50:50 between industry and services (predominantly tourism and financial services), with
agriculture just 0.8% of GDP23.
About 80% of energy used in Puerto Rico comes from petroleum. The last refinery closed in 2009,
and all petroleum products are now imported.24
Figure 5: Generation mix, Puerto Rico, 2015
Source: Energy Transition Initiative, Puerto Rico Snapshot, 2015. https://www.nrel.gov/docs/fy15osti/62708.pdf
Total installed electricity generating capacity is around 6,000MW, with total generation of around
19.4TWh, of which (as shown in Figure 5) 72% was derived from petroleum, 18% from natural gas
and 8% from coal25. Most of the generation capacity is oil-fired, and mostly owned and operated by
Puerto Rico Electric Power Authority (PREPA), apart from a 450MW coal plant operated by AES and
a 510MW gas-fired plant operated by EcoElectrica.
History of LNG import and future plans
Puerto Rico’s first LNG import terminal in Peñuelas, in the south of the island came into operation in
2000. The combined import terminal and power plant project, initially led by Enron International,
achieved financial close in December 1997, with an estimated cost of USD 670million. 26 In 2012,
EcoElectrica expanded the regasification capacity to supply fuel to two nominal 400-MW conventional
steam units at PREPA’s Costa Sur Power Plant. This plant was retrofitted for dual fuel operation in
2011.27 The terminal imported 1.25 million tonnes of LNG in 2016. 28
Plans for a second LNG import terminal in Puerto Rico have been under discussion from as early as
2008, but have not yet reached an investment decision. The Aguirre Gasport, which would be located
about 40 miles east of Peñuelas, on the south coast of the island, is being developed by Excelerate
20
World Bank (http://data.worldbank.org/country/puerto-rico )
21
World Bank (http://data.worldbank.org/country/puerto-rico )
22
CIA World Factbook: Puerto Rico Economy. https://www.cia.gov/library/publications/the-world-factbook/geos/rq.html
23
CIA World Factbook: Puerto Rico Economy.
24
US EIA: Puerto Rico Energy Profile https://www.eia.gov/state/?sid=RQ
25
Energy Transition Initiative, Puerto Rico Snapshot, 2015. https://www.nrel.gov/docs/fy15osti/62708.pdf
26
Oil and Gas Journal, 23rd Feb 1998
27
FERC Feb 2015: Aguirre Offshore GasPort Final Environmental Impact Statement
https://energy.gov/sites/prod/files/2015/02/f20/EIS-0511-FEIS-Volume1-2015.pdf
28
GIIGNL Annual Report 2017. http://www.giignl.org/sites/default/files/PUBLIC_AREA/Publications/giignl_2017_report_0.pdf
8Energy, one of the leading providers of floating storage and regasification (FSRU) systems. In
November 2010, PREPA conducted an expression of interest / pre-qualification survey for a project to
import natural gas and convert the 1500 MW oil-fired Aguirre power station to gas-firing.29 A formal
application to the US Federal Energy Regulatory Commission (FERC) was filed in April 2013, and the
Environmental Impact Statement was approved in July 2015. 30 The project continued to make slow
progress, and in August 2017, Excelerate cancelled its contracts with PREPA as a result of the utility
filing for bankruptcy.
Thus it is at present unclear whether the second terminal will proceed. It is also possible that an
alternative plan to build a gas pipeline from the existing Peñuelas LNG import terminal to the Aguirre
power plant will be re-evaluated. 31 Hurricanes Irma, Jose and Maria caused substantial damage to
the power transmission infrastructure in Puerto Rico, from which the island has been taking a
considerable time to recover.
LNG import physical arrangement
The Peñuelas LNG import terminal has a single storage tank with a capacity of 160,000m3 and
supplies an adjacent 500 MW combined cycle power plant. Both the terminal and the power plant are
operated by EcoEléctrica, 47.5% owned by Gas Natural Fenosa. 32 The terminal was originally built
with two vaporisers each with a capacity of 93 MMscf/day, and in 2012 a further two vaporisers of the
same size were added.33 Total authorised send out was 186 MMscf/d, with two of the vaporisers as
spares, until FERC approval in August 2017 to increase send out to 279 MMscf/d. 34
Figure 6: Puerto Rico: Peñuelas LNG import terminal in 2012
Source: Combined Cycle Journal, Q4 2012 http://www.ccj-online.com/4q-2012/plant-reports-ecoelectrica-lp/
Consideration has been given to constructing natural gas pipelines. Figure 7 shows routes of the
proposed pipelines from the Peñuelas terminal to other power plants in Puerto Rico. 35 Construction of
the 42-mile long (68km) Gasoducto del Sur pipeline began in 2008, but only 10km were constructed
29
Aguirre Gasport presentation to Caribbean Energy Conference, January 2013
https://energy.gov/sites/prod/files/2015/02/f20/EIS-0511-FEIS-Volume1-2015.pdf
30
http://en.aguirreoffshoregasport.com/the-aguirre-offshore-gasport-project-overview/gasport-project-status-and-timeline/
31
http://caribbeanbusiness.com/prepa-lacks-financing-for-natural-gas-projects/
32
Gas Natural Fenosa company information
33
FERC Docket No CP13-516-000, June 2014 https://www.ferc.gov/whats-new/comm-meet/2014/061914/C-3.pdf
34
FERC Docket No CP16-492-000, August 2017 https://www.ferc.gov/CalendarFiles/20170824163443-CP16-492-000.pdf
35
FERC Aguirre Offshore Gasport Environmental Impact statement, Feb 2015
https://energy.gov/sites/prod/files/2015/02/f20/EIS-0511-FEIS-Volume1-2015.pdf
9before the project was cancelled on account of public opposition in 2009. There continues to be a
discussion regarding the relative merits of the Aguirre Offshore Gas Port or the pipeline. 36
Figure 7: Puerto Rico- Proposed Natural Gas pipelines
Source: FERC Aguirre Offshore Gasport Environmental Impact statement, Feb 2015
Outline Commercial Structure
The Peñuelas terminal and power plant is an integrated facility, owned and operated by Ecoeléctrica.
There is a 22-year power purchase and operations agreement between Ecoeléctrica and PREPA,
under which PREPA contracts for LNG directly, and Ecoeléctrica is paid a tolling fee for LNG
handling, storage, regasification and deliver of gas to Costa Sur. 37 As part of Gas Natural Fenosa’s
acquisition of the Ecoeléctrica project in 2003, it obtained a Tolling Services Agreement giving it the
exclusive rights to all the excess capacity at the terminal as well as the rights to add more capacity to
the facility.38
Development plans and future potential
In June 2014, FERC granted approval for Ecoeléctrica to supply LNG to a truck loading facility, which
Gas Natural Fenosa (GNF) was proposing to construct on land adjacent to the Peñuelas terminal. 39 In
a subsequent presentation in October 2015, GNF gave further details of its plans to construct the
truck loading facility and distribute natural gas to residences and commerce. 40
To date, the truck loading facility has not been completed, but instead Crowley, a US logistics
company is supplying LNG in ISO-containers to industrial customers in Puerto Rico. In September
2014, the first load of LNG was delivered to the Coca Cola bottling plant in Cidra, having converted
the plant to run on natural gas rather than diesel, as well as using the low temperature LNG to reduce
36
http://caribbeanbusiness.com/puerto-rico-govt-pushes-for-prepas-rsa-deal-awaits-for-boards-approval/ June 2017
37
http://www.ccj-online.com/4q-2012/plant-reports-ecoelectrica-lp/
38
http://logicenergyusa.com/presentations/TLF%20-%20Logistic%20October%202015.pdf , Oct 2015
39
FERC Docket No: CP13-516-000, June 2014 https://www.ferc.gov/whats-new/comm-meet/2014/061914/C-3.pdf
40
http://logicenergyusa.com/presentations/TLF%20-%20Logistic%20October%202015.pdf
10the demand for refrigeration. 41 Crowley also supplies LNG to other customers in Puerto Rico,
including Coca Cola’s Cayey plant, the cereal mill operated by Molinos de Puerto Rico and a major
pharmaceutical company. 42
As discussed above, there are competing proposals for supply of natural gas to the Aguirre power
plant: at this stage it is unclear whether either or neither of the Gasoducto del Sur pipeline or the
Aguirre Offshore Gas Port will go ahead.
3.3 Jamaica
Economic and Energy Context
Jamaica is a country of nearly 3 million people 43 growing at less than 0.5%/year. GDP per capita is
just under USD 5,00044, having been fairly stable around this level since the mid-1990s. Jamaica was
once a major sugar exporter, but now imports sugar and services account for more than 70% of
GDP45. 30% of GDP is estimated to be derived from tourism.46 In the early 1970s, Jamaica was the
leading bauxite producer in the world, although in 2016 it exported only 5.6 million tonnes, or around
7% of global bauxite production.
Primary Energy supply in 2014 totalled 3.2 mtoe, down from 4.6 mtoe in 2007 before the closure of
several bauxite/alumina plants in the wake of the global financial crisis. 2.6 mtoe (81%) of primary
energy supply in 2014 was from crude oil and oil product imports (4.1 mtoe or 91% in 2007) 47. The
Government of Jamaica has developed a strategy to diversify its energy supply in order to improve its
international competitiveness and reduce its dependence on imported petroleum.48
Figure 8: Jamaica: Energy Consumption and Production (2015)
Jamaica Energy Consumption by Jamaica Electricity Generation by fuel
sector 2015 2015
Industry
Transport Oil
Residential Biofuels
Commercial Hydro
Agriculture Wind
Other
Source: IEA Statistics 2015
(https://www.iea.org/statistics/statisticssearch/report/?country=Jamaica&product=balances)
Total electricity generation in 2016 was 4.35 TWh, an increase of 3.7% from 2015. 6% of generation
was from hydropower, with the remainder being from oil-fired power plants.49 Total installed capacity
41
http://www.crowley.com/content/download/26693/202269/version/3/file/LNG-Story.pdf
42
http://www.crowley.com/News-and-Media/Press-Releases/Crowley-Awarded-New-Contract-to-Supply-Commercial-LNG-to-
Molinos-de-Puerto-Rico
43
CIA World Factbook: July 2016 estimate 2.97 million
44
Trading Economics, based on World Bank 2016: USD 4796. https://tradingeconomics.com/jamaica/indicators
45
2017 Index of Economic Freedom http://www.heritage.org/index/country/jamaica
46
CIA World Factbook
47
All data from IEA Sankey diagrams.
48
Govt. of Jamaica, Bidding document for LNG, August 2011, p8 http://www.cabinet.gov.jm/files/docs/procurement/RFP-2011-
L002-LNG-Floating-Storage-Regas-Terminal-AMENDED-15-Sept-2011.pdf
49
Economic and Social Survey Jamaica 2016, Planning Institute of Jamaica.
https://webstore.pioj.gov.jm/reportyear.aspx?SectionId=4
11was 923MW, of which 634MW was operated by Jamaica Public Service (JPS), the utility also
responsible for transmission and distribution of electricity across the island, and 289MW from
Independent Power Producers.50 At end 2015, only 1.4MW of photo-voltaic systems were connected
to the grid, but this was planned to increase to nearly 70MW by end 2017. 51
History of plans to import LNG
Jamaica was considering imports of LNG as early as 2004 when an agreement was signed with
Trinidad and Tobago for LNG supply of 1.1 mtpa for 20 years starting in 2009 for use in the Jamalco
bauxite refinery and the Jamaica Public Service (JPS) power plants. 52 Subsequently, Trinidad
informed Jamaica that it did not have sufficient gas supply, and in 2007 Jamaica’s then Prime Minister
Portia Simpson Miller signed a memorandum of understanding with Venezuela’s President Hugo
Chavez. This contemplated that Venezuela would start supply of LNG to Jamaica by 2009. 53 When
these plans did not progress, the Government issued tenders for LNG Infrastructure and LNG Supply
in June 2011. Through 2012 and 2013, it was decided that LNG would be too expensive an option
given the relatively small demand. In 2013, the Government withdrew its support for LNG and
expressed support for coal as an alternative energy source. 54 Finally, in November 2015, the power
utility, JPS, signed an agreement with New Fortress Energy (NFE), a subsidiary of US-based Fortress
Investment Group, for supply of gas to the 120MW Bogue power plant. Following this agreement, the
infrastructure was completed remarkably quickly and first gas was supplied to the power plant by end
2016.55
Figure 9: Jamaica LNG infrastructure
Source: Gas Strategies blog http://www.gasstrategies.com/blogs/blazing-trail-caribbean
LNG import physical arrangement
The physical supply chain set up by NFE is relatively unusual in the LNG industry. Initially, NFE had
considered supply by ISO-containers by road and container ship from its existing facility in Florida, but
the logistics and risks of this were ultimately considered unsuitable, so the current alternative scheme
50
Energy Transition Initiative, Energy Snapshot Jamaica http://www.nrel.gov/docs/fy15osti/63945.pdf
51
https://www.pv-magazine.com/2017/04/28/jamaica-targets-300-million-renewable-energy-investments/
52
Reuters, 24 June 2009 http://www.reuters.com/article/trinidad-jamaica-lng-idUSN6O53840120090624
53
Oil&Gas Journal 13 March 2007 http://www.ogj.com/articles/2007/03/venezuela-signs-mou-for-lng-supply-to-jamaica.html
54
Jamaica Sustainable Energy Roadmap, Worldwatch Institute, Oct 2013 http://www.worldwatch.org/system/files/Jamaica-
Sustainable-Energy-Roadmap-112013.pdf
55
http://jis.gov.jm/lng-arrives-jps-bogue-power-plant/
12was adopted.56 A chartered LNG vessel, Golar Arctic (138,000 m 3) serves as a floating storage unit
(FSU), moored in a sheltered bay on the south side of Jamaica. It arrived in August 2016 with an
initial cargo loaded in Nigeria, and a second cargo was delivered by ship to ship transfer from Trinidad
in February 2017. 57
NFE has also chartered the smaller LNG vessel, Coral Anthelia (6,500 m 3) as a shuttle tanker.
Approximately once a week, this vessel lifts a cargo from the FSU, and delivers it to an LNG receiving
terminal (storage approximately 7,000 m 3) at Montego Bay on the NW coast of the island. The LNG is
vaporised in the Montego Bay terminal and the gas delivered by pipeline (approx. 2km length) to the
Bogue Power plant.
The Bogue plant, a 120 MW combined cycle gas turbine facility, had been operating entirely on diesel
since it was commissioned in 2003, and was converted by JPS to dual fuel, LNG and diesel. 58
Outline Commercial Structure
A gas supply agreement between NFE and JPS was signed in August 2015. Under this agreement,
NFE assumed responsibility for delivering gas to the burner tip, while JPS was responsible for
converting the Bogue power plant to run on gas. 59 Thus NFE is responsible for LNG procurement and
for putting the infrastructure in place (as described above). A 3-year deal has been signed by NFE
and Centrica for supply of LNG.60
The commercial terms of these deals have not been disclosed, but speaking to the Jamaica Observer
in August 2016, the CFO of JPS said that the price was based on the Henry Hub index plus an
agreed margin, and that he expected the price in September 2016 to be slightly cheaper than the cost
of the oil alternative.61 On the other hand, an article in the Jamaica Gleaner in February 2016 claimed
that the delivered cost of gas would be twice the price of fuel oil and add between USD 25 and 45
million to the cost of fuel.62 Both agreed, however, that the gas price was likely to be less volatile than
the oil price.
Development plans and future potential
In a separate transaction, the South Jamaica Power Company, a subsidiary of JPS has started
construction of a 190 MW power plant in Old Harbour Bay (see map above). Gas will also be supplied
by NFE and the power sold to JPS under a long-term power purchase agreement. This project
reached financial close in March 2017. 63 To deliver the gas, NFE will construct a berth and
regasification facility, approximate 5 km offshore to the south of the power plant. The floating storage
unit (currently anchored in the bay) will be moored at the berth, the LNG regasified on the offshore
platform, and the gas transmitted by 16” pipeline to the power plant. 64
Expanding demand for LNG further, two industrial users, the bauxite company, Jamalco, and the Red
Stripe brewery, are also reported to have signed deals with NFE to switch their fuel sourcing from oil
to gas.65
56
Power Engineering 14 Sept 2015: Risk Review leads to Alternative Plan for Jamaica Fuel Conversion http://www.power-
eng.com/articles/print/volume-119/issue-9/features/risk-review-leads-to-alternative-plan-for-jamaica-fuel-conversion.html
57
https://www.icis.com/resources/news/2017/02/23/10081759/corrected-centrica-wins-three-year-lng-supply-deal-to-jamaica/
58
http://jis.gov.jm/jps-launches-2-5-billion-bogue-gas-conversion-project/
59
http://jamaica-gleaner.com/article/business/20160506/bogue-plant-conversion-wrap-next-week
60
https://www.icis.com/resources/news/2017/02/23/10081759/corrected-centrica-wins-three-year-lng-supply-deal-to-jamaica/
61
http://www.jamaicaobserver.com/business/LNG-ushers-in-price-stability---JPS_70851
62
http://jamaica-gleaner.com/article/commentary/20160210/lng-cheap-think-again
63
http://www.km-advisorsllc.com/news/2017/3/23/old-harbour-190-mw-lng-to-power-project-reaches-financial-close
64
NFE South Holdings, Environmental Impact Assessment, Sept 2016. http://savegoatislands.org/wp-
content/uploads/2016/09/NFE_OldHarbour_EIA_Report_Sep2016.pdf
65
http://www.lngworldshipping.com/news/view,cheers-jamaicas-red-stripe-brewery-switches-to-lng_48044.htm
13NFE and the government have suggested that the floating storage unit may also become a hub for
LNG supply to other islands in the region. This appears logical, but would likely be in competition with
potential supplies from the Dominican Republic and Panama.
3.4 Panama
Economy and Energy Context
The population of Panama reached 4.1 million in 2017, with a demographic growth of 1.6% per
annum. More than 50% of the population lives in the Panama City-Colón metropolitan region. The
country's GDP growth in 2015 was 6% compared to a meagre 0.2% in Latin America. The
Government projects that the economy will grow 5.8% in 2017.
Panama is a dollarised free-market economy which relies heavily on the services industry, banking,
commerce and tourism. The expansion of the Panama Canal and investment in infrastructure
(energy, transportation, construction) have contributed to a strong economy.
The industrial sector manufactures aircraft spare parts, cements, drinks, adhesives, and textiles.
Panama’s main exports are bananas, shrimps, sugar, coffee, and clothing.
Figure 10: Panama vs Latin American and the Caribbean GDP growth (%)
Source: https://www.weforum.org/agenda/2017/04/panama-s-secret-to-economic-growth-immigrants/
The energy sector in Panama
The energy matrix in Panama is heavily dependent on oil and oil products. In 2016 Panama imported
28 MM bbls of oil products.
14Figure 11: Panama: evolution of the supply of energy
Source: Adapted from (Secretaria Nacional de Energia - Panama (b), 2015)
Panama has relied mainly on hydroelectric generation to meet its electricity needs. The government
has been encouraging a change in its energy mix due to the impact of climate change and
phenomena such as El Niño on the country’s hydro reservoirs.
In 1998 Panama restructured its electricity sector with the subsequent privatisation of its integrated
state-owned electricity company (IRHE). The government allowed private participation in generation
and distribution of electricity but retained full control of the transmission system. The National
Secretariat of Energy is responsible for planning and policy making whereas the regulation of the
electricity sector was assigned to the National Authority of Public Services (ASEP).
The Panamanian electricity system consists of over 60 generation plants, a state-owned transmission
company (ETESA) and three distribution companies (ENSA, Edemet and Edechi) in which the
government has a non-controlling participation. In 2005, ASEP granted another transmission
concession to Empresa Propietaria de la Red (EPR), which is in charge of interconnecting the Central
American electricity market under the Central American Electrical Interconnection System (SIEPAC)
treaty66.
Generators must enter the market through a concession or a licence granted by ASEP. Hydro and
geothermal generators must obtain a concession. All other technologies must obtain a licence.
Generators can sell their power through (a) power purchase agreements (PPAs) with distribution
companies awarded through auctions; (b) PPAs freely negotiated with other generators or large
unregulated consumers whose demand exceeds 100kW/month (LUCs); (c) PPAs with the large
consumer basket (LCB) which is a collection of all electricity requirements from LUCs managed by the
state-owned transmission company (ETESA); or (d) the spot market.
Distribution companies must keep open access to their grids for all generators and LUCs, subject only
to payment of tolls and connection charges.
As of December 2016, the total installed capacity was 3,369 MW, with a maximum peak demand of
1,657 MW achieved in April 201767. The system generated 10.9 GWh in 2016, with predominance of
hydro and bunker oil.
In 2016 renewable energy accounted for 63% of the total installed capacity, of which hydro
corresponded to 1,767 MW and wind accounted for 270 MW. Thermal generation capacity totalled
1,235 MW, of which 296 MW was based on fuel oil, 419 MW on diesel and 120 MW on coal (Figure).
66
(Secretaria Nacional de Energia (a), 2017; Secretaria Nacional de Energia (a), 2017)
67
http://www.energia.gob.pa/Compendio-Estadistico-Energetico
15You can also read