Enfield Borough Profile 2021 - Enfield Council
←
→
Page content transcription
If your browser does not render page correctly, please read the page content below
Enfield
Borough Profile
     2021

              1|Page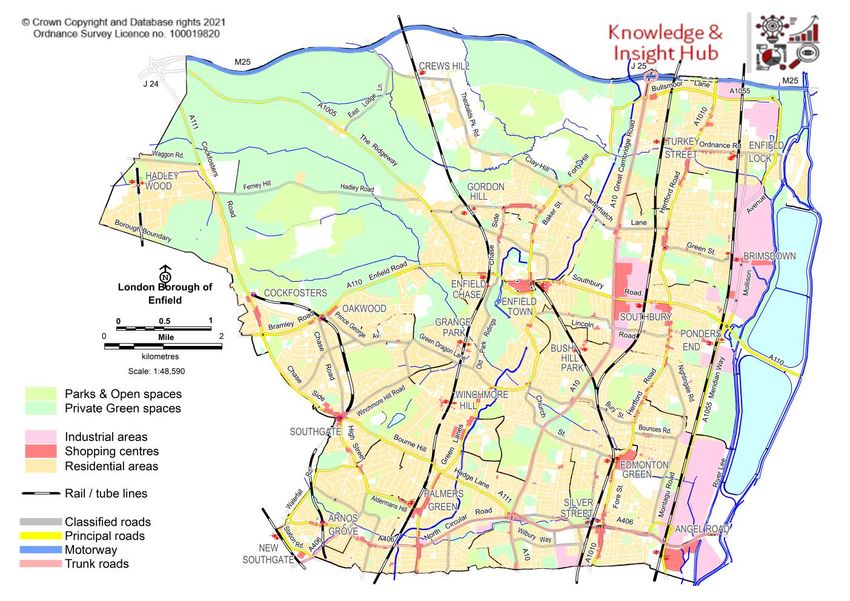
Contents
Key Facts and Statistics............................................................................................................................................. 4
Background ..................................................................................................................................................................... 5
Demography .................................................................................................................................................................. 6
Population size ............................................................................................................................................................. 6
Age Profile ..................................................................................................................................................................... 7
Country of Birth and Nationality .............................................................................................................................. 8
Residents by country of nationality ........................................................................................................................ 8
Ethnic and Cultural Diversity .................................................................................................................................... 9
Ethnicity Estimates 2019 .......................................................................................................................................... 11
Language ...................................................................................................................................................................... 13
Religion ......................................................................................................................................................................... 14
Sexual Orientation ..................................................................................................................................................... 16
Gender reassignment ............................................................................................................................................... 17
Disability ....................................................................................................................................................................... 17
Socioeconomic Factors............................................................................................................................................ 18
Deprivation................................................................................................................................................................... 18
Children in low-income households ..................................................................................................................... 21
Household Incomes................................................................................................................................................... 21
Employment Rates (Enfield residents) ................................................................................................................. 22
Worklessness / Unemployment.............................................................................................................................. 23
Crime ............................................................................................................................................................................. 24
Health ............................................................................................................................................................................ 27
Long-term Health Conditions.................................................................................................................................. 29
Lifestyle factors .......................................................................................................................................................... 30
Housing......................................................................................................................................................................... 31
Property Prices ........................................................................................................................................................... 34
Private Sector Rent averages ................................................................................................................................. 35
Education ..................................................................................................................................................................... 35
Local Economy ........................................................................................................................................................... 38
Employment (businesses located in Enfield) ..................................................................................................... 43
Environmental Factors ............................................................................................................................................. 45
Road Traffic ................................................................................................................................................................. 45
Travel to work ............................................................................................................................................................. 47
Rail Travel .................................................................................................................................................................... 47
Bus Travel .................................................................................................................................................................... 49
Healthy Streets ........................................................................................................................................................... 49
                                                                                                                                                                     2|Page
Residential refuse and recycling collections ..................................................................................................... 50
Climate Change .......................................................................................................................................................... 51
Greenness and openness ........................................................................................................................................ 52
Ward Boundary Changes ......................................................................................................................................... 53
Heritage and nature conservation ......................................................................................................................... 53
Feedback ...................................................................................................................................................................... 54
Glossary ....................................................................................................................................................................... 54

                                                                                                                                                                  3|Page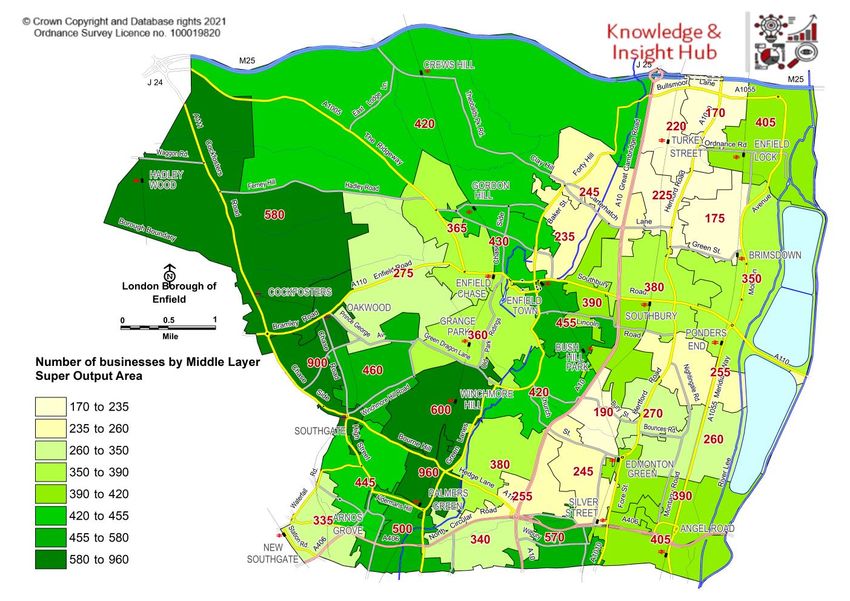
Key Facts and Statistics
Population & Demography

  •   Enfield’s population is estimated to be 333,587 as at mid-2020 – a decrease of 0.1% on the previous year
  •   Enfield has higher proportions of children and young people (up to the age of 20) than the regional and
      national averages.
  •   Women outnumber men among people aged 27 years and over, with the reverse being true for the younger
      ages.
  •   As at June 2020, 35% of Enfield residents were estimated to have been born overseas, with 11% (around
      39,000 people) having been born in a European Union country.
  •   We estimate that around 35% of Enfield residents are White British, with 26% being from Other White ethnic
      groups. Black ethnic groups account for 18%, Asian 11%, Mixed ethnicities 5.5% and 4% are of all Other
      ethnic groups.
  •   Over ninety languages were spoken as a main or only language by Enfield residents as at the 2011 Census,
      with the most widely spoken being English (77% of residents), Turkish (6%), Polish (2%) and Greek (1.6%).
      Among schoolchildren, 80% speak English as a first language although 189 languages or dialects have been
      recorded among pupil records
  •   As at 2011, Christianity was the most abundantly practised religion (54% of residents), followed by Islam
      (17%) and No Religion (16%). The proportions of people following each faith are thought to have declined in
      the intervening years, with the exception of the No Religion group, which has grown correspondingly.
  •   It is estimated that 2.6% of London residents are Gay or Lesbian, with a further 1.2% identifying as Bisexual
      and 0.7% having an ‘other’ orientation. No data are available at local authority level at present, so we have no
      estimates for Enfield
  •   Just under 48,000 Enfield residents (all ages) had a disability as at 2011. Later estimates from 2020 indicate
      that, among working-age people (aged 16-64 years), 53,000 had some level of disability – around 25% of the
      working-age population.

  Socioeconomic and health factors:
  •   Indices of Multiple Deprivation 2019 placed Enfield as the 74th most deprived borough in England, and the 9th
      most deprived in London
  •   16% of Enfield households have an annual gross household income of less than £15,000 (as at 2020)
  •   Nearly one-fifth of children aged 16 and under are in low-income families
  •   70% of working-age people are working (survey data)
  •   The unemployment rate is higher than in London and England
  •   The crime rate in Enfield is lower than the London average
  •   Both male and female life expectancies are higher than the national average, while male life expectancy is
      also higher than the average for London.
  •   Enfield’s Mortality ratio (all ages) was lower in Enfield in 2019 than in London and England overall.
  •   Diabetes prevalence in Enfield is the second highest of all London boroughs, and is above both the regional
      and national (England) average.
  •   5% of adults over 65 have been diagnosed with dementia – the highest prevalence in London, and higher
      than the rate for England.
  •   Children in Enfield are more likely to be overweight or obese than in London and England generally – the
      prevalence of children carrying excess weight in Year 6 is the third highest of the 33 London boroughs.
  •   58% of adults in Enfield are overweight or obese as of 2019/20 – above the regional (London) average of
      56%
  •   Nearly a third of Enfield’s housing stock was built in the ten years between 1930 and 1939
  •   Less than 60% of households in Enfield are owner-occupiers, while 29% of all dwellings are thought to be
      rented privately.
  •   At February 2020, the average property price in Enfield was £404,689 – a rise of 3.7% since February 2019.
  •   Average Private Rented Sector rent levels rose slightly in the year to September 2020 – they are 33% higher
      than in the year ending September 2011.
  •   7.5% of Enfield’s working-age adults are estimated to have no formal qualifications, while 46% are educated
      to NVQ Level 4 standard or above.
  •   There are 13,865 businesses registered in Enfield (as at 2020), of which 93% employ fewer than 10 people.
      Most of Enfield’s companies (93%) have a turnover of less than £1 million.
  •   Business survival rates currently stand at 87% for the first year and 39% for the first five – slightly lower than
      the UK average.

                                                                                                            4|Page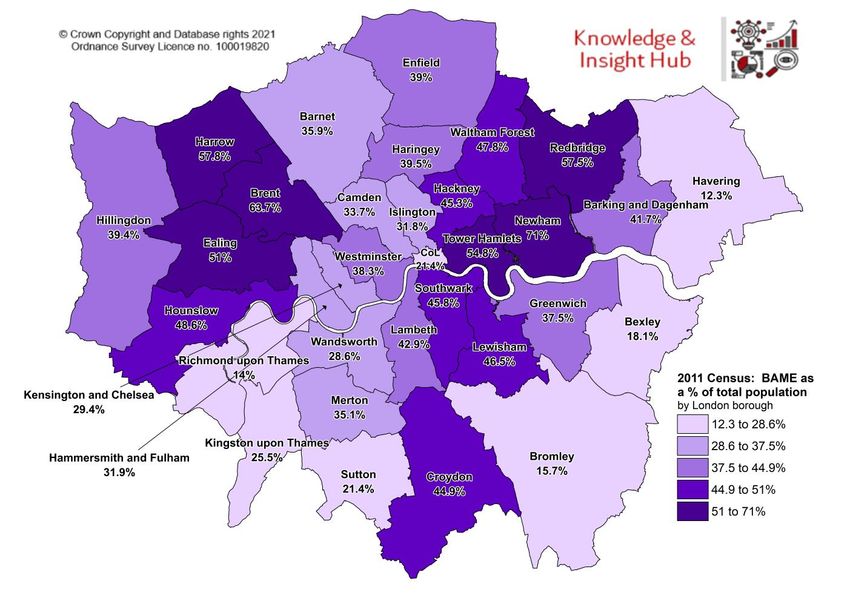
• As at 2019, around 105,000 people were employees at Enfield companies, with one fifth working in Retail and
Wholesale Trade (including Motor Vehicle repair). Large numbers are also employed in Health, Social Work
and Education.
• Altogether there are 0.62 jobs (including trainee positions) per head of the working-age population – a lower
proportion than the averages for the London area and for the UK.
Environment
• Usage of Enfield’s roads by motor vehicles fell by a fifth between 2019 and 2020
• Enfield has 18 overground and 4 underground train stations – Edmonton Green was the most heavily used
overground station in 2019/20, although overall use of the train network fell between 2018/19 and 2019/20.
• 33% of Enfield’s household waste was recycled, reused or composted in 2019/20 – comparable to the
average for London, but below the all-England average of 44%
• Greenhouse gas emissions: The borough of Enfield produced an average of 3.3 tonnes per capita of Carbon
Dioxide emissions in 2019 – a fall of 40% since 2005. This was also significantly lower than the UK average
of 5.2 tonnes per capita.
• Around 40% of the borough’s land area is designated Green Belt
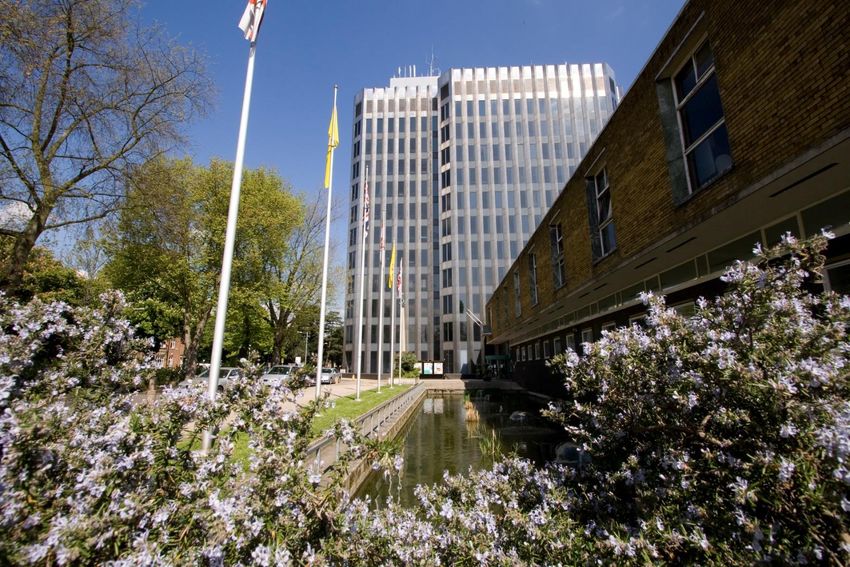
Background
Enfield is about 12 miles by road from the centre of London. It has good links to the national motorway system with the
north of the borough being bounded by the M25, accessed at junctions 24 and 25. It also has two trunk roads – the
A10 (London to Cambridge) and A406 (London’s North Circular Road).
Five train lines pass through the borough, including the Piccadilly (Underground) Line connecting to Heathrow Airport.
The other direct connections are into London Kings Cross, Moorgate and Liverpool Street, outward to Welwyn Garden
City, Hertford North, Hertford East, Letchworth and Stevenage.
The authority covers an area of 8219 hectares (82.2 square kilometres, or 31.7 square miles). The Ward with the
largest area is Chase, representing 20.96% of the total area.
5|Page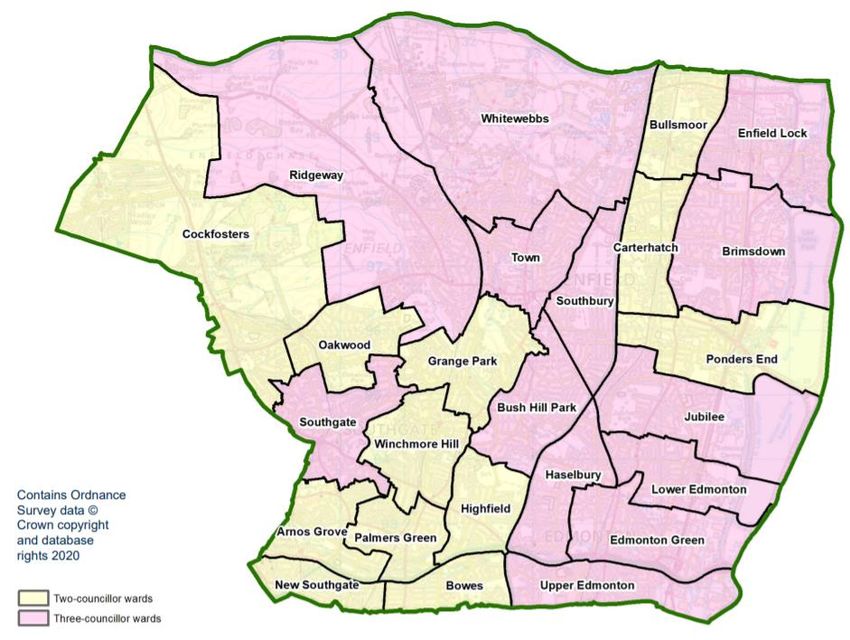
The Enfield local authority area covers the postal districts EN1, EN2 and EN3, plus parts of EN4, and small sections of
EN6, EN7, EN8 and EN9. The borough boundaries also contain the London postal districts of N9, N13, N18 and
N21, plus parts of N11, N14, N22 and E4.

The main area distinctions are between Enfield, Edmonton and Southgate (the historic pre-1965 boroughs familiar to
longstanding residents).

Enfield Council is a unitary authority, having responsibility for a wide range of services. As one of the London
boroughs it is also served by the Greater London Authority group, for transport, police and emergency services.

The Council is currently Labour Party controlled and is composed of 63 councillors representing 21 wards, although
this is due to change in mid-2022. Ward boundaries are being redrawn to create 25 wards in place of the existing 21.

The Council Tax for a Band D property in 2021/22 is £1,795.47 compared to a London average of £1,623.

Demography
Population size

2021 was a Census year, however the Office for National Statistics have indicated that most output data from the
2021 Census will not be ready for release until March 2023. In the meantime, the most robust population estimates
available are the ONS’ mid-year estimates.

According to these, Enfield’s population as at mid-2020 is estimated to be 333,587. It is estimated to have decreased
by 207 people (or 0.1%) between 2019 and 2020, while the population in London and England are thought to have
increased slightly – by 0.5% in both cases.

Population Trend from 2012 onwards

Although Enfield’s population has increased since 2012, the rate has slowed down in recent years, culminating in two
successive years of slight population decline, despite overall growth in the London region.

Enfield is the 5th largest London borough by population, after Barnet (399,007), Croydon (388,563), Newham
(355,266) and Ealing (340,341).

The future population trend is highly uncertain. The latest housing-led Greater London Authority projections suggest a
possible fall in population – to 333,350 by 2040. On the other hand, trend-based projections point to an increase to
around 380,000 by 2040. The ONS have indicated that they will produce another round of their own trend-based
population projections in the near future, with the 2021 Census estimates as the base year.

                                                                                                           6|Page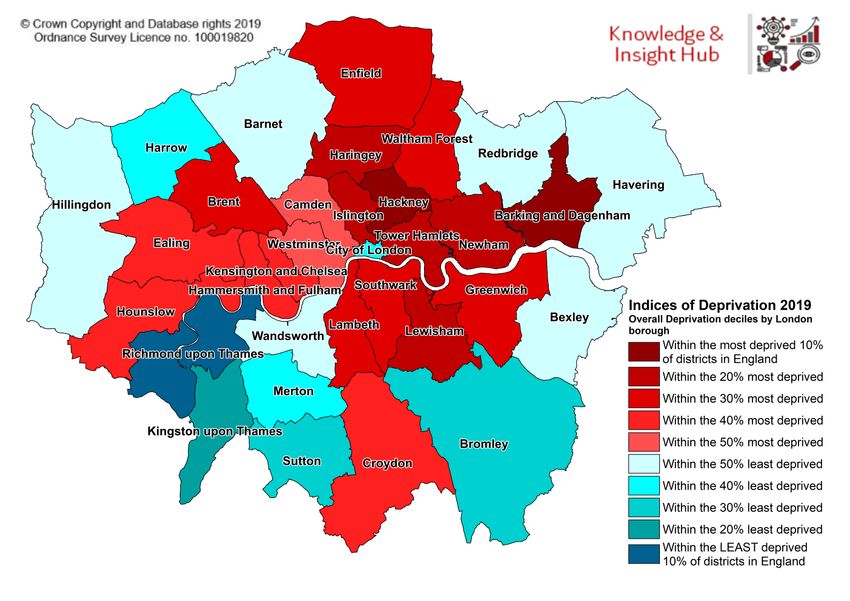
Population density

Enfield is the seventh least densely populated of the thirty-three London boroughs, with 4,127 people per square
kilometre. For comparison, Tower Hamlets has 16,790 people per sq km, while in England as a whole there are 434
– just over one tenth of the density of Enfield.

Age Profile
Enfield has relatively
high proportions of
children and young
people under the age of
twenty – higher than both
London and England
averages.

The percentage of
younger adults - aged
20 to 44 years - is also
higher than in England in
general, but below that of
London as a whole.
Both the London area
and Enfield have
proportionately fewer
older residents than the
England average.

Population by sex and age

The distribution of male and female residents by age band is shown in the pyramid chart below. Males outnumber
females in every individual year of age up to 27 years, with women outnumbering men in virtually every age thereafter.

                                                                                                           7|Page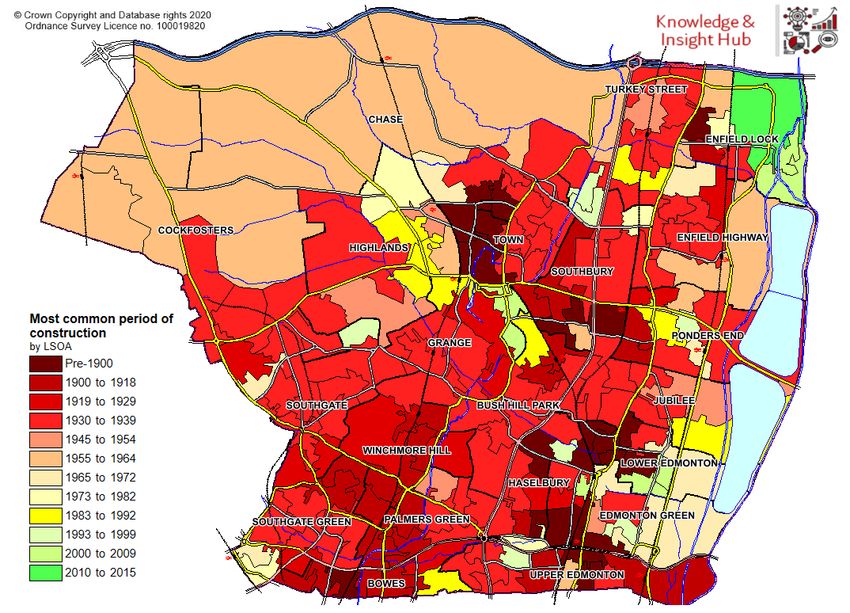
Country of Birth and Nationality

Overseas-born residents make up 35% of the borough’s population as of the year ending June 2020, according to the
Annual Population Survey, published by the Office for National Statistics. This proportion is similar to that for London
as a whole, and significantly higher than proportions of overseas-born residents in England and the UK at large.

                                                                          Country of Birth: estimates of residents of
                                                                                    non-UK origin (2020)
                                                                                     EU14                      15,000
                                                                          European EU8                           8,000
                                                                           Union     EU2                         9,000
                                                                                     EU Other                    7,000
                                                                            Non-     Non-EU Europe             13,000
                                                                          European Asia                        25,000
                                                                           Union     Rest of the World         42,000
                                                                        *Figures are rounded*

Of those residents born outside the UK, 12% were from outside Europe and Asia, with the largest group (9.1% of all
residents) being from sub-Saharan Africa. It is estimated that 39,000 (over 11%) of Enfield residents are from
European Union countries.

                           Austria, Belgium, Denmark, Finland, France, Germany, Greece, Italy, Luxembourg,
              EU14
                           Netherlands, Portugal, Republic of Ireland, Spain and Sweden
              EU8          Czech Republic, Estonia, Poland, Hungary, Latvia, Lithuania, Slovakia, Slovenia
              EU2          Bulgaria and Romania
              EU Other     Malta, Cyprus, Croatia

Residents by country of nationality

In the year to June 2020, it is estimated that 82% of Enfield residents had UK nationality – slightly higher than in the
year to June 2019 (79%). Non-UK nationals make up 18% of the population, as compared to 21% across London on
average, and 9% in England and the UK.

                                                                                                               8|Page
Of the 60,000 Enfield residents (18%
                                                                         of the total) who are non-UK
                                                                         nationals, nearly two-thirds (38,000)
                                                                         are nationals of a European Union
                                                                         country, while 22,000 (6% of the total)
                                                                         are of non-EU nationalities.

                                                                         In London as a whole, 12% of the
                                                                         population has a non-UK European
                                                                         Union nationality and 9% are of
                                                                         nations outside the EU.

                                                                         For England on average, the
                                                                         proportion of overseas nationals is
                                                                         somewhat lower, with 6% being from
                                                                         the EU and 4% from other territories.

Ethnic and Cultural Diversity

2011 Census:

The most demographically distinguishing feature about Enfield is its combination of ethnic groups as shown by the
2011 Census data. The Office for National Statistics have indicated that most output data from the 2021 Census will
not be released until March 2023.

2011 Census data reveal that, compared to the average for London boroughs, Enfield had a slightly smaller White UK
group (at 40.5% of total population), and relatively large numbers in the ‘Other White’ group (18.2%) and in Black
groups (17.2%).

The ‘Other White’ group includes Greek / Greek Cypriot and Turkish / Turkish Cypriot and Kurdish ethnicities, which
are not large enough nationally to qualify for their own ‘tick box’ categories. However, based on the numbers of
written in answers to the Census, Enfield has the highest numbers of Cypriot, Greek, Turkish and Albanian residents
in England & Wales.

                              2011 Census: Enfield's Ethnic Profile             London     England
                Ethnic Group                              Persons % of total      %          %

                                 White UK                  126,450       40.5       44.9        79.8
                                 Irish                       6,899        2.2        2.2         1.0
                    White:
                                 Traveller                     344        0.1        0.1         0.1
                                 Other White                56,947       18.2       12.6         4.6
                                 White/Black Caribbean       4,852        1.6        1.5         0.8
                                 White/Black African         2,384        0.8        0.8         0.3
                    Mixed:
                                 White/Asian                 4,189        1.3        1.2         0.6
                                 Other Mixed                 5,758        1.8        1.5         0.5
                                 Indian                     11,648        3.7        6.6         2.6
                                 Pakistani                   2,594        0.8        2.7         2.1
                     Asian:      Bangladeshi                 5,599        1.8        2.7         0.8
                                 Chinese                     2,588        0.8        1.5         0.7
                                 Other Asian                12,464        4.0        4.9         1.5
                                 African                    28,222        9.0        7.0         1.8
                     Black:      Caribbean                  17,334        5.5        4.2         1.1
                                 Other Black                 8,131        2.6        2.1         0.5
                Other Ethnic Group                          16,063        5.1        3.4         1.0

                All people                                 312,466      100.0      100.0       100.0

                                                                                                          9|Page
Black, Asian and Minority Ethnic Population proportions – Enfield and other London boroughs, 2011 Census

The highest percentages of BAME populations are represented by the dark purple areas in the map below, grading
through the colour scale to pale purple, which indicate areas with a relatively low percentage.

                                                                                                     10 | P a g e
Ethnicity Estimates 2019 (in-house estimates)
Enfield’s Ethnicity estimates are produced in-house, using data from the 2011 Censuses and the 2019 School Census
conducted by the local education authority (LEA). The School Census results indicate the changing nature of the
population as Enfield pupils recorded themselves under 102 different ethnic codes.
The estimates have been made for 22 groups by five-year age bands. Total populations have also been estimated for
further groups that make up the Council’s ethnic group classification that is used in equalities. (See table below).
One of the most striking demographic characteristics of Enfield is its rich ethnic diversity.
Based on these estimates, residents from White British backgrounds make up 35.3% of Enfield’s inhabitants with
other White groups (including White Irish) combined at 26.4%. Mixed Ethnic Groups account for 5.5%, Asian Groups
for 11.0% and Black groups for 17.9% of Enfield’s population.
Estimated
% of total
Ethnicity population
population
size
White British 118,466 35.3%
White Irish 7,309 2.2%
Greek 4,549 1.4%
Greek Cypriot 16,302 4.9%
Turkish 24,209 7.2%
Turkish Cypriot 6,432 1.9%
Kurdish 4,264 1.3%
White Other 25,381 7.6%
White & Black Caribbean 4,664 1.4%
White and Asian 4,348 1.3%
White and Black African 2,471 0.7%
Other mixed 6,890 2.1%
Indian 11,937 3.6%
Pakistani 2,829 0.8%
Bangladeshi 6,432 1.9%
Chinese 2,732 0.8%
Other Asian 12,852 3.8%
Somali 9,157 2.7%
Other Black African 24,763 7.4%
Black Caribbean 17,725 5.3%
Other Black 8,357 2.5%
Other Ethnic Group 13,354 4.0%
11 | P a g eThere is no similarly detailed profile for London or the country. However, the Office for National Statistics published
estimates in 2019 of the distribution of the ‘main’ ethnic groups used in many statistical releases: White British, All
Other White, Mixed/Multiple Ethnic Groups, Asian/Asian British, Black/African/Caribbean/Black British and Other
Ethnic Group.
The table below shows the ONS’ estimate of the proportions of the six groups in Enfield, with regional and national
comparators. The ONS estimates a higher White British, a higher ‘Other Ethnic Group’ a lower Other White and a
lower Mixed/Multiple Ethnic Group population than Enfield’s own estimates. We will, of course, have more accurate
estimates when the 2021 Census outputs are released.
Future changes in ethnic profiles
Predicting population growth by ethnicity is complex and problematic, owing to the myriad factors that can affect
trends in migration. However, for London, The Greater London Authority has produced two sets of ethnic group
projections: the 2016 GLA Housing led Trend Ethnic Group Projections and the 2016 GLA Central Led Trend Ethnic
Group projections.
These two variants have been produced based on both the 2016-based housing and central led borough-level
projections.
The BAME population in Enfield is projected to increase significantly by a combined average of 14.3% over the ten
years from 2020 to 2030. This is slightly higher than the London average increase of 13.6%. The White population is
also expected to increase in most areas. However, it should be noted that these projections have yet to be updated to
reflect the effects of the Coronavirus pandemic, and the changes in trajectory when this is achieved may be
considerable.
12 | P a g e*Aggregated averages of the GLA Housing led trend group and GLA Central led trend-based projections.
Language
The 2011 Census revealed that over 90 languages are spoken as a main or only language by Enfield residents aged
three years and over.
After English, Turkish was the most widely spoken main language at that time, followed by Polish, Greek and Somali.
% of
Main Language (2011 Census) Number residents
aged 3+
English 229,660 77.1%
Turkish 18,378 6.2%
Polish 5,837 2.0%
Greek 4,627 1.6%
Somali 3,127 1.1%
Bengali (with Sylheti and
2,594 0.9%
Chatgaya)
Gujarati 2,490 0.8%
French 2,360 0.8%
Kurdish 1,990 0.7%
Italian 1,799 0.6%
Albanian 1,742 0.6%
Bulgarian 1,721 0.6%
Persian/Farsi 1,552 0.5%
Romanian 1,508 0.5%
Tamil 1,320 0.4%
Portuguese 1,279 0.4%
Arabic 1,197 0.4%
Spanish 1,105 0.4%
Akan 1,004 0.3%
Lithuanian 765 0.3%
Source: 2011 Census
Of the 23% of residents who did not speak English as their main language, three-quarters (50,900) could speak
English well or very well, leaving one quarter (just over 17,000) who could not.
13 | P a g eThe Labour Force Survey, compiled by the ONS, reveals that in 2018 the percentage of the estimated adults who
speak English at home is 76%, a slight decrease of 1.3% since 2009 but a significant increase of 6.2% since 2015.
APS / Labour Force Survey (adults). This question is posed at three-yearly intervals.
Schools data from the Department for Education reveal that only just over half of pupils in Enfield’s state schools have
English as a first language – a lower percentage than in the London region, and significantly lower than the average
for England. Indeed, among primary school children, the majority have a first language believed to be other than
English.
The Spring 2021 School Census records 189 languages or dialects being spoken by pupils who live in Enfield.
The top ten non-English languages spoken by Enfield school pupils, at Spring 2021, were:
Top non-English languages spoken by Enfield school pupils 2021:
% of % of
Language Language
pupils pupils
Turkish 13.7% Bulgarian 2.3%
Somali 3.7% Romanian 1.9%
Albanian 2.6% Greek 1.4%
Polish 2.4% Arabic 1.3%
Bengali 2.3% Akan (Twi/Asante) 1.2%
Religion
The most reliable estimates are those from the 2011 Census; Christianity (all denominations) was the most common
religion in the borough (53.6%) at that time. 16.7% of residents were of the Muslim faith, and 15.5% hold no religion or
belief at all. Sikhs were the smallest group in the borough, composing 0.3% of the population, and people of ‘other
religion’ made up 0.6%.
14 | P a g eThere are some more up to date estimates of the religious profile of the borough, taken from the Annual Population
Survey (and analysed by the GLA), up to the end of 2018 1. Please note: these estimates do not include the
‘religion not stated’ group, so are not strictly comparable to the Census results.
According to the 2018 Annual Population Survey estimates, Enfield has a higher proportion of Christian, Muslim and
‘Other’ religions than London as a whole (where they represent 44.5%, 14.2% and 2.3% respectively).
1
Being a smaller-scale survey than the census, the confidence intervals are broad, and there are no estimates for Jewish, Buddhist
and Sikh residents for some periods, owing to very small numbers in these groups and the need for rounding.
15 | P a g eSexual Orientation
Reliable data on sexual orientation is difficult to find, particularly at local level. Historically, there has been no specific
question in the Census regarding sexual orientation, although this changed in the 2021 Census, so we would expect
some more reliable data from that to become available within the next two years.
In 2003, the UK Department of Trade and Industry estimated the size of the Lesbian, Gay and Bisexual population to
be between 5-7% of the total adult population.
More recently, the Office for National Statistics have compiled experimental statistics to estimate the numbers and
proportions of LGB people aged 16 and over as part of the Annual Population Survey 2. Data are not available at local
authority level, but estimates have been produced for regions and nations.
The estimated proportion of people over 16 in the UK who identify as heterosexual reduced from 95.3% in 2014, to
93.7% in 2019. In the same period, people identifying as Gay or Lesbian increased from 1.1% to 1.6%, Bisexual
respondents rose from 0.5% to 1.1%, and people in the ‘Other’ category from 0.3% to 0.7%. 3
In London, the percentage of Over 16s identifying as heterosexual fell from 92.5% to 88.9%, with corresponding
increases in proportions of people in the Gay/Lesbian and Bisexual categories. These are shown in the chart below,
along with the averages for England.
Nationally, as at 2019, a higher proportion of men than women identified as LGB – 2.9%, as opposed to 2.5%. Gay,
Lesbian or Bisexual identification decreases with the age group of the respondent: 6.7% of 16-24-year-olds self-
identified as LGB in 2019, contrasted with 1% of people aged 65 and over.
If we assume that the proportion of LGB people in Enfield lies somewhere between the London and England
averages, the number would be somewhere between 9,000 and 12,700. Fortunately, the 2021 Census outputs, when
they become available, should give us a much clearer picture.
2
Owing to relatively small sample sizes (around 150,000 in 2019), the confidence intervals are fairly broad, but for the London
area, and England as a whole, they are sufficiently limited to be considered acceptable for publication. For more information on
findings and methodology, go to
https://www.ons.gov.uk/peoplepopulationandcommunity/culturalidentity/sexuality/bulletins/sexualidentityuk/2019
3 The “other” category captures people who do not consider themselves to fit into the heterosexual or straight, bisexual, gay, or
lesbian categories; it might also include people who responded “other” for different reasons such as those who did not understand
the terminology or who are against categorisation.
16 | P a g eGender reassignment
Previously, gender reassignment was considered to fall under the gender equality strand, but the Equality Act 2010
recognised it as a protected characteristic. There are statistics that show the number of individuals who have
undergone gender reassignment surgery in the UK. However, numbers are very small and extrapolating from them to
indicate how many Enfield residents may have undergone a gender reassignment procedure is of limited use.
While some Trans groups have larger and more specific datasets, these are not publicly available as numbers in
some areas are such that individuals may be exposed to the risk of being personally identified.
The Trans community is not limited to individuals currently undergoing reassignment surgery, or those that have
completed gender reassignment – transgenderism frequently refers to both individuals who experience gender
dysphoria and are compelled to transition to a gender other than that with which they were born, and individuals more
broadly who identify strongly with a gender other than their birth gender and may cross-dress. Gender issues are
different from sexual orientation, that is, whether a person is sexually attracted to men, or women, or both or,
sometimes, neither. Trans people may have any of these sexual orientations.
The closest we can get to a local estimate is to work from the national estimate from the Gender Identity Research
and Education Society (GIRES).
GIRES estimates that in the UK around 650,000 people, 1% of the population, are estimated to experience some
degree of gender non-conformity. Information via the internet, stronger laws, more support groups, increasingly
responsible media reporting and improving healthcare are contributing to rapid growth in the number of gender non-
conforming people confident in being visible, especially among the young.
The growth rates of those seeking medical care are up 20% per year among adults (who currently account for the
majority of cases) and up 50% among young people. In the UK, about 26,000 individuals have so far sought medical
care; in general practice or specialist centres so far. If GIRES’ estimates are correct and the distribution among
Enfield’s population were typical of their national research, this would equate to around 3,350 individuals with some
degree of gender non-conformity.
Disability
At the 2011 Census, 47,979 Enfield residents (15.4% of the total) reported a long-term health problem or disability in
response to the question, “Are your day-to-day activities limited because of a health problem or disability which has
lasted, or is expected to last, at least 12 months?”. Respondents were invited to indicate the level to which their
activities were limited.
52.5% of people with a disability or long-term health problem were of working age (16-64 years), with 43% of the total
being aged over 65 years.
17 | P a g eThere are no more recent data on disability which cover the whole population (all age groups), however, the ONS’
Annual Population Survey does give estimates of the number and proportion of working-age adults who have self-
reported a disability.4
In the year ending December 2020, 52,700
Enfield residents aged 16-64 were estimated
to have a disability, or nearly 25% of the
working-age population.
If correct, this would represent an increase of
over 100% on the Census estimates for this
age group, although the definition of
‘disability’ is significantly different in that it
does not require an examination of the
severity of the effect of the disability upon the
individual’s daily activities.
APS estimates indicate that the rate of
disability among working-age individuals in
Enfield is higher than the regional and
national averages.
Socioeconomic Factors
Deprivation
The Department for Communities and Local Government (DCLG) released the latest round of the English Indices of
Deprivation in September 2019.
The Index of Multiple Deprivation (IMD) is an overall measure of deprivation calculated for every Lower Super Output
Area (LSOA) in England. It is made up of aggregated indices of deprivation for seven main domains or types (plus
two sub-domains), each of which is weighted in accordance with its effect upon overall poverty. The domains of
deprivation examined are:
1. Income, with two supplementary indices -
a. Income Deprivation Affecting Children Index (IDACI), and
b. Income Deprivation Affecting Older People Index (IDAOPI)
2. Employment
3. Education Skills and Training deprivation
4. Health Deprivation and Disability
5. Crime Deprivation
6. Barriers to Housing and Service
7. Living Environment
The Ministry for Housing, Communities & Local Government also produces borough-level indices of deprivation. This
is calculated from the average deprivation scores of all the LSOAs within that borough. Borough level rankings (rank
of average score) are compiled from these.
Index of Multiple Deprivation (IMD) 2019
Fortunately, Enfield’s ranking compared with the 316 other local authorities in England dropped from 2015 to 2019:
Enfield is now the 74th most deprived local authority in England overall, so still within the most deprived 25% of all
districts. Enfield’s average deprivation score has not worsened in those four years. However, Enfield has become
relatively more deprived when compared with other London boroughs. In 2015, Enfield was the 12th most deprived
borough in London, whereas in 2019 it was the 9th most deprived.
The map below shows the spread of overall deprivation among London boroughs. The very dark red areas are the
boroughs in the highest decile of deprivation nationally.
4
As defined under the Equality Act 2010: an EA Core current disability or a work-limiting disability (T02a)
18 | P a g eThe map below shows the locations of the most and least deprived Lower-layer Super Output Areas (LSOAs) in
Enfield. Dark red areas are those with the greatest deprivation levels.
19 | P a g eIndividual Domains of Deprivation – Enfield and other London boroughs
The chart below shows the levels of deprivation for each of the individual domains for Enfield and other London
boroughs. Decile numbers show how deprived a borough is on each measure, with decile 1 being within the 10%
most deprived boroughs in England, and decile 9 being within the least deprived 10%.
Enfield is within the most deprived half of English districts in all domains except that of Health and Disability.
In the UK as a whole, the proportion of children in relative low-income families is 19%. Enfield’s proportion is similar
to the London average and is the 15th highest of the 33 London boroughs.
The DWP also measure the number and proportion of children in Absolute low-income households. This means the
family has an income below 60% of the UK median as it stood in the financial year ending 2011. According to the
data, 15% of Enfield’s children aged under sixteen live in families with Absolute low income – the same as the
proportion for London as a whole, but slightly lower than that for the UK (16%).
Average Deprivation Deciles of London boroughs by Deprivation Domains
(1= within most deprived 10% of districts, 10= within least deprived 10% )
INCOME (including Income Barriers
t
t
Deprivation affecting
men
en
to
on
Local Authority District
Env ing
ym
Children (IDACI) and Older
ati
IMD Health Crime Housing
iron
Liv
name (2019)
plo
uc
People (IDAOPI)
&
Ed
Em
Services
Income IDACI IDAOPI
City of London 7 9 10 9 10 10 9 10 1 1
Barking and Dagenham 1 1 1 1 3 4 4 1 1 2
Barnet 6 5 7 3 7 10 10 4 1 3
Bexley 6 6 5 6 7 6 8 5 2 5
Brent 3 3 4 1 4 8 7 2 1 2
Bromley 8 7 6 7 8 9 9 5 2 6
Camden 5 3 3 1 5 9 8 3 5 2
Croydon 4 4 3 3 5 7 6 3 1 3
Ealing 4 3 4 1 5 8 6 3 1 2
Enfield 3 2 2 2 4 5 8 3 1 3
Greenwich 3 2 2 1 4 7 5 2 1 3
Hackney 1 1 1 1 3 8 3 1 1 1
Hammersmith and Fulham 4 3 3 1 5 10 5 2 2 1
Haringey 2 2 2 1 3 6 5 1 1 1
Harrow 7 5 7 3 8 10 10 6 1 5
Havering 6 6 5 5 6 4 8 4 5 6
Hillingdon 6 5 5 4 7 7 7 3 1 5
Hounslow 4 4 4 2 6 8 6 2 1 2
Islington 2 2 1 1 3 9 3 1 2 1
Kensington and Chelsea 4 5 6 2 6 10 10 3 1 1
Kingston upon Thames 9 8 9 5 9 10 10 7 3 3
Lambeth 3 3 2 1 5 9 4 1 1 1
Lewisham 2 2 2 1 4 8 4 2 1 1
Merton 7 6 6 3 8 10 8 5 5 2
Newham 2 2 3 1 5 6 5 2 1 2
Redbridge 6 5 6 2 7 9 9 3 2 3
Richmond upon Thames 10 9 10 8 10 10 10 5 8 3
Southwark 3 2 1 1 4 9 4 2 1 1
Sutton 8 7 7 6 7 9 8 6 5 4
Tower Hamlets 2 1 1 1 4 7 4 2 1 2
Waltham Forest 3 3 3 1 5 7 6 2 1 2
Wandsworth 6 6 5 2 8 10 7 4 2 2
Westminster 5 4 4 1 6 10 9 4 5 1
20 | P a g eChildren in low-income households
According to official (but provisional) Department for Work and Pensions (DWP) statistics 5, as of 2019/20 (the latest
date for which this particular information is available), 13,987, or 18%, of all children under 16 in Enfield were in
Relative Low-Income families – an small increase on the 2018/19 figure of 13,670 (17%). The definition of ‘relative
low income’ in this case is receiving 60% or less of the currently UK median household income. These measures
include families where parents are working, as well as those in receipt of out of work benefits alone.
Household Incomes
Estimates supplied by CACI Ltd for 2021 indicate that the mean gross household income in the borough was around
£43,000. This is higher than the UK average of £40,000, but somewhat lower than the London mean of £46,000 (all
figures have been rounded).
Enfield’s median household income (arguably, a more meaningful statistical measure of the average) is £35,300,
which is the 9th lowest of the 33 London boroughs and lower than the London average. Within the borough, there are
clear differences in household income between the western and eastern parts. Median incomes in the most affluent
neighbourhoods are twice those of the least affluent.
• 15.4% of households in Enfield have an annual gross income under £15,000. This is higher than the London
average of 13.5%, and the 8th highest proportion of all 33 London boroughs.
• 42.1% of Enfield households have less than £30,000 per annum – again, higher than the London average, and
9th highest proportion in London.
5
This is a new measure of child poverty, which replaces the Children in low-income households measure used prior to 2018. It
measures children in households with equivalised low-income before housing costs. The new statistics only count children under
16 years, owing to the difficulty in identifying 16-19 year-olds who are still classed as dependents.
21 | P a g eHousing Benefit and Universal
Credit
As of February 2021, there were 48,562
resident households in the borough
(around 37%) receiving state help with
their housing rental costs:
• 23,618 were on Housing Benefit
• 24,944 were claiming the Housing
element of Universal Credit, currently
being rolled out to replace Housing
Benefit
64% of all benefits for Housing costs are
paid to households living in the Private
Rented Sector.
The number of households receiving
Housing costs support increased by
nearly a quarter (23%) between February
2020 and February 2021.
Employment Rates (Enfield residents)
In the year to December 2020, the employment rate of working-age people in the borough (ie those aged between 16
and 64 years) was estimated to be 69.8% (representing around 154,700 people) 6. 12% of 16-64-year-olds are
estimated to be self-employed (around 26,500 people).
The employment rate in Enfield was in decline from 2016 to 2019, and remains below that of London and the UK,
despite the rise after September 2019. It has fallen and risen roughly in line with the proportion of economically
active adults (people aged 16-64 years who are either working or unemployed and ready to commence work).
6
Office for National Statistics - Annual Population Survey: Survey-based estimates of economic activity, employment rates and
unemployment rates
22 | P a g eConversely, the proportion of economically inactive7 people has drifted upwards of a quarter of the working-age
population, and stood at 26% at December 2020.
Worklessness / Unemployment
At March 2021, Enfield’s Claimant Count was 20,625. This represents the number of Enfield residents claiming
unemployment benefits in the form of Job Seekers Allowance or Universal Credit (with a job-seeking conditionality
regime).
This represents a 67% increase in the number of unemployed adults in the year from March 2020 with the greatest
rise occurring between March and May 2020, at the start of the global pandemic.
The Claimant Count percentage rate (ie the number of unemployed claimants as a percentage of all residents aged
16-64) rose more than threefold from 3.6% to 9.7% in the same period, as is higher than the average rates for both
London and England. See chart below.
7
Economically inactive individuals includes full-time students, people with caring responsibilities, early retirees, the long-term
sick, and any other group of people that has voluntarily removed itself from the labour market.
23 | P a g eNB Not all non-working people are eligible to claim JSA or Universal Credit 8. Other household circumstances affect a
person’s eligibility, such as household income and the existence of other family resources. Furthermore, people who
are economically inactive, having removed themselves from the labour market owing to caring responsibilities, being
full-time students or early retirees, are not included in the Claimant Count.
Coronavirus Job Retention (Furlough) Scheme
Since the start of the pandemic, 61,300 jobs held by Enfield workers have been furloughed at one time or another,
representing over 42% of all eligible jobs in the borough. As at the end of April 2021, 21,700 were furloughed,
representing 15% of all employments – higher than both the London and England averages (14% and 11%
respectively).
Crime
According to official crime summary data published by the Metropolitan Police, the number of notifiable offences
committed in Enfield between January and December 2020 was 28,781 9 – a decrease of 6% on the previous 12-
month period. Across London, the number of offences actually rose by 1.7% in the period. Enfield’s official Met Police
crime rate10 for this period was 84.71 offences per 1000 residents per year. The London-wide crime rate for the same
12-month period was 87.92 per 1000 people.
In Enfield, the three most common types of recorded crime were Violence Against the Person (not including sexual
offences), Vehicle Offences and Theft.
The largest percentage increase in crime by type of offence was in Drug Offences, which grew by 37% between 2019
and 2020.
By contrast the incidence of Robbery fell by 36%, with a huge decrease in Robbery of personal property from March
2020 onwards - indicative of the collapse in numbers of people spending time in public places during the year.
8
Universal Credit is also paid to working people to supplement low pay. These claimants are not included in the claimant count
figure.
9
Provisional data – may be subject to revision
10
The official Met Police crime rate is calculated as number of offences in the year per 1000 residents (using the GLA 2016-based
central trend population projections as the denominator, rather than the ONS mid-year population estimate).
24 | P a g eIndeed, as can be
seen in the chart
(right), overall
numbers of offences
during the months of
the national
lockdowns in 2020,
were lower than the
equivalent months in
the previous year.
The most recent crime statistics are available on the Metropolitan Police’s Crime Mapping Service website. Other
police and crime statistics can be viewed via the GLA’s London Datastore pages on crime.
Enfield had a lower crime rate (per 1,000 residents) than the London average (87.92) and the 15 th lowest crime rate of
the 33 London boroughs.
25 | P a g eIn 2020, there were 2,792 sanctioned detections (ie where offences are resolved through a formal sanction such as a
charge or a caution) – a significant increase on 2019. The Sanction Detection rate represents the number of Sanction
Detections as a percentage of all notifiable offences. In Enfield, the Sanction Detection rate for 2020 was 9.7%, but
there was a large divergence between offence types – nearly 85% for Possession of Weapons, against 1% for vehicle
offences.
Antisocial Behaviour
There were 16,973 recorded Antisocial Behaviour incidents in 2020 – a significant increase on 2019. The breakdown
is shown below.
26 | P a g eIn a year in which many of the usual opportunities for human association were curtailed, Rowdy or Inconsiderate
Behaviour incidents rose by 108% on the previous period, while Nuisance Neighbour and Noise complaints increased
by 96% and 38% respectively. Reports of littering/drugs paraphernalia also shot up by 48%.
Health
Life Expectancy and Causes of Death
Life expectancy summarises the mortality pattern across all age groups and therefore reflects the overall mortality
level of a population. It can be defined as the average number of years a person would live, if he/she experienced a
particular area’s mortality rates throughout his or her life.
The latest available local estimates from the ONS (Life Expectancy at Birth 2017-2019) suggest that life expectancy at
birth for males born in this period in Enfield is 81.0 years, which is slightly above the averages for London (80.9 years)
and England (79.8 years).
Female life expectancy in Enfield fell marginally to 84.7 years, while the London and England averages are 84.7 years
and 83.4 years respectively. The chart below shows comparisons between the 32 London boroughs11 and the
national (England) averages. The range between boroughs is considerable – life expectancy Barking and Dagenham
is 5 to 6 years lower than in Westminster.
11
No data are available for the City of London, so only 32 boroughs are shown.
27 | P a g eLocal Authority abbreviations:
B&D: Barking and Dagenham Kingston u-T: Kingston-upon-Thames
H&F: Hammersmith and Fulham Richmond u-T: Richmond-upon-Thames
K&C: Kensington and Chelsea
Source: Public Health England
Average Life expectancies for all areas have been on an upward trend since the turn of the century, but it is notable
that longevity appears to be improving for people in London (including Enfield) at a faster rate than for the rest of the
country. See chart below.
28 | P a g eThe Infant Mortality Rate12 concerns the number of deaths of live born babies within the first year of life. In Enfield,
the infant mortality rate for 2019 was 5.1 per 1,000 live births, which was higher than both the London-wide mortality
rate of 3.5 per thousand and the England average of 4.0. These numbers can fluctuate quite widely from one year to
another owing to the relatively small numbers of deaths among this age group.
The deaths of 2,012 Enfield residents (of all ages) were registered in 2019, giving an Age-Standardised Mortality Rate
(ASMR)13 of 808.1 per 100,000 population – a decrease on the previous year (844.0 per 100,000). As usual, the
ASMR for women – 675.3 – was lower than that for men – 983.6.
We have crude deaths data for 2020, but as yet no statistical mortality rates or ratios. The number of overall deaths in
2020 rose by 28% to 2,575, with 18% of these (464) having Covid-19 mentioned on the death certificate14. However,
importantly, the number of deaths occurring within 28 days of a positive Covid test was only 33015, or 13% of the
total16.
The Standardised Mortality Ratio (SMR) is a measure of the number of deaths observed in an area over a particular
period, as a proportion of the number of deaths that would be expected in a standard population with the same age
profile. An area with a base SMR of 100 has the same number of deaths as would be expected for an area with that
age distribution. The SMR for England and Wales therefore is 100.
For Enfield, the SMR for 2019 was 87, meaning that
numbers of deaths were statistically lower than the Standardised mortality ratios 2019
nationally expected level, and the same as in London Area Persons Males Females
overall.
Enfield 87 91 85
The Standardised Mortality Ratio for Enfield’s men, London 87 88 86
however, was higher than the London average. England & Wales 100 100 100
Long-term Health Conditions
Around 15 million people in England have a long-term condition (LTC)17: a condition that cannot be cured, but can be
controlled by medication and/or other therapies. Public Health England publish Health Profiles for all NHS areas in
England.
One of the most common LTCs is hypertension, which often presents no symptoms but is a major risk factor for
stroke, cardiovascular disease, kidney disease and dementia. In 2019/20, 56,201 people in Enfield had been
recorded as having hypertension – a prevalence of 16%, and a big rise on the previous period (45,551, or 13.2%),
although this may be because of better detection of health issues. Nonetheless, this is the highest prevalence of the
33 London boroughs, and is higher than the London (11%) and England averages (14%). It is likely that there are
other residents with hypertension that has not been diagnosed, owing to its being largely symptomless.
In 2019/20, 26,914 adults (aged 17 and over) were recorded as having diabetes in Enfield. This constitutes a
prevalence of 10%, which is the second highest in London after Harrow. Furthermore, it is higher than both the
London average of 6.8% and the England average of 7.1%. Prevalence in Enfield and England rose between 2018/19
and 2019/20, although it fell slightly in the London area.
12
Office for National Statistics: Deaths registered by area of usual residence
13
The age-standardized mortality rate is a weighted average of the age-specific mortality rates per 100 000 persons, where the
weights are the proportions of persons in the corresponding age groups of the standard population.
14
Office for National Statistics: Weekly provisional figures on deaths occurring and registered in England and Wales by Local
Authority. Here, ‘Covid-19 related’ deaths is ‘based on any mention of Covid-19 on the death certificate’
15
https://coronavirus.data.gov.uk/details/deaths?areaType=ltla&areaName=Enfield
17
According to The King’s Fund
29 | P a g eLung Conditions
• At 2019/20, 21,586 people in Enfield (of all ages) had asthma 18, representing a prevalence of 6.2%, and a
large jump on the previous year (16,372, or 4.8%). This is the highest rate in London.
• In 2018/19, 3,938 people in Enfield suffered from Chronic Pulmonary Obstructive Disease (COPD)– a
prevalence of 1.1%, which was lower than the England-wide average of 1.9%. Prevalence within London
ranges between 0.8% in Brent to 1.8% in Havering, with a region-wide average of 1.1%19
Dementia
There were 1,708 recorded cases of dementia among people aged 65 and over in Enfield in 2020. This represents a
prevalence of 5.3% - the highest of the London boroughs (by contrast, Newham has the lowest prevalence – 3.3%).
This compares with 4.2% for the London region and 3.97% for England. Among the Under 65s, there were only 46
recorded cases of dementia – a prevalence of 2%, which was lower than the London and England averages (2.2%
and 3.0% respectively).
Enfield’s high dementia prevalence is possibly related to better diagnosis rates. The estimated Dementia Diagnosis
Rate in Enfield in 2020 was the best in London at 88.4%, compared with a London regional average of 71.3% and a
National (England) average of 67.4%.
To find out more about differences in healthy life expectancy between communities, go to the Public Health Outcomes
Framework tool.
Lifestyle factors
It is well documented that being overweight or obese increases the risk of a number of health conditions, such as
cardiovascular disease, diabetes, stroke and certain cancers.
Obesity in childhood is a global and national cause for concern. Data from Public Health England’s annual National
Child Measurement Programme for the school year 2018/19 estimated that in Enfield:
• 963 (23.9% of the total) Reception age children and 1,885 (42.6%) Year 6 children were either overweight or
obese.
• These percentages were higher than both the London and England averages.
• Enfield had the ninth highest prevalence of overweight or obese Reception children within the London
boroughs, and the third highest for Year 6 children.
• Unfortunately, the data for 2019/20 are incomplete. Public Health England have estimated that 42.5% of Year
6 children are either overweight or obese, however, this figure has been imputed and should be used with
18
QOF prevalence, Public Health England
19
As at June 2021, PHE had not published data for 2019/20.
30 | P a g eextreme caution. However, this still places Enfield in the position of having the third worst obesity/overweight
rate in London. No data at all have been published for Reception children in Enfield for this period.
Excess weight in adults is a another public health concern, and is accepted as a factor in lower life expectancy:
Public Health England’s health profile for Enfield estimates that, as at 2019/20, the proportion of adults who are
overweight or obese is 58.2% - which is lower than the England average (62.8%), but higher than in London as a
whole (55.7%).
One of the costs of obesity can be found in the number of Bariatric Incidents undertaken by the London Fire Brigade –
ie where they are employed to assist other emergency services in moving larger patients. Across London, there were
100 bariatric incidents between April 2019 and March 2020, and 146 in 2020/21. In Enfield, in 2019/20, there were
two such incidents, rising to ten in the 2020/21 period. This was the fourth largest number per borough, behind
Croydon, Haringey and Greenwich.
Smoking is the biggest preventable cause of death in the UK and is a risk factor in over 50 serious health conditions
including cancer, heart disease, stroke and COPD. The prevalence of smoking among Enfield’s adults as at 2019
was estimated to be 15.8%20 - a sizeable increase on 2018 (13.7%)21, bucking the general downward trend of the
previous eight years, and higher than the average prevalence for England (13.9%) and London (12.9%).
For detailed information about health and wellbeing in Enfield please see the Joint Strategic Needs Assessment.
Housing
Enfield contains a variety of housing styles – Victorian terraced houses, 1930s semi-detached houses, council flat
blocks and modern houses and flats. The borough has a relatively small number of detached houses (7% of total
homes) and terraced houses make up nearly one third and flats nearly two-fifths of homes.
The data below are taken from the 2011 Census:
2011 Census: Enfield Housing Stock
Dwelling type Proportion
Flats 38.3%
Terraced houses 31.1%
Semi-detached houses 23.5%
Detached houses 7.0%
20
Annual Population Survey data
21
although the 95% confidence limits are between 11.5% and 20%, so it is not necessarily statistically significant
31 | P a g eYou can also read