CURRENT CONDITIONS Draft July 7, 2020 - Cuyahoga County Planning Commission
←
→
Page content transcription
If your browser does not render page correctly, please read the page content below
Draft July 7, 2020

CURRENT CONDITIONS
ACKNOWLEDGMENTS

        CUYAHOGA COUNTY PLANNING COMMISSION
        2079 East 9th Street                                         www.CountyPlanning.us
        Suite 5-300                                                  www.facebook.com/CountyPlanning
        Cleveland, OH 44115                                          www.twitter.com/CountyPlanning
        216.443.3700

        PLANNING TEAM
        Patrick Hewitt, AICP, Interim Executive Director             James Sonnhalter, Manager, Planning Services
        Kevin Leeson, Planner                                        Micah Stryker, AICP, Planner, Project Lead
        Dan Meaney, GISP, Manager, Information and Research          Robin Watkins, Geographic Information Specialist
        Rachel Novak, Planner, Project Lead                          Blake Woodruff, Planning Intern
        Bryson Odum, Planning Intern

        COUNTY PLANNING
        Our mission is to inform and provide services in support of the short and long term comprehensive planning, quality of
        life, environment, and economic development of Cuyahoga County and its cities, villages and townships.

2   CURRENT CONDITIONS | DRAFT July 7, 2020
CITY OF MIDDLEBURG HEIGHTS
Matthew J. Castelli, Mayor
15700 Bagley Road
Middleburg Heights, Ohio
440.234.8811
www.middleburgheights.com

PROJECT TEAM
Matthew J. Castelli, Mayor                          Santo Incorvaia, Law Director
Charles Bichara, Director of Economic Development   Bill Meany, Council Member
Robert Downey, Mayor Executive Assistant            Jeff Minch, Recreation Director
Briant Galgas, Fire Chief                           Jason Stewart, Finance Director
James Herron, Service Director                      Ed Tomba, Police Chief
Norm Herwerden, Building Commissioner

2020 CITY OF MIDDLEBURG HEIGHTS COUNCIL MEMBERS
David Bortolotto, Council President                 Matthew G. McGregor, Council Member
Mary Ann Meola, Council Clerk                       Bill Meany, Council Member
Tim Ali, Council Member                             Dan Sage, Council Member
Michael Ference, Council Member
John Grech, Council Member

                                                                              CITY OF MIDDLEBURG HEIGHTS MASTER PLAN   3
This page intentionally left blank.

4   CURRENT CONDITIONS | DRAFT July 7, 2020
TABLE OF CONTENTS

INTRODUCTION��������������������������������������������������������������������������������������������������������������������������6
         1.1 HISTORY OF MIDDLEBURG HEIGHTS��������������������������������������������������������������������������������������������������������� 8
         1.2 PAST PLANNING & CURRENT STUDIES���������������������������������������������������������������������������������������������������10

DISCOVERING MIDDLEBURG HEIGHTS��������������������������������������������������������������������������������� 14
         2.1 WHAT'S TRENDING?�����������������������������������������������������������������������������������������������������������������������������������16
              LIVING HERE. . . . . . . . . . . . . . . . . . . . . . . . . . . . . . . . . . . . . . . . . . . . . . . . . . . . . . . . . . . . . . . . . . . . . . . 18
              WORKING HERE. . . . . . . . . . . . . . . . . . . . . . . . . . . . . . . . . . . . . . . . . . . . . . . . . . . . . . . . . . . . . . . . . . . . 32
              TRAVELING HERE. . . . . . . . . . . . . . . . . . . . . . . . . . . . . . . . . . . . . . . . . . . . . . . . . . . . . . . . . . . . . . . . . . . 40

ZONING REGULATIONS & LAND USE ����������������������������������������������������������������������������������� 48
         3.1 DISTRICTS & CONTEXT�������������������������������������������������������������������������������������������������������������������������������50
         3.2 JUST BEYOND THE BOUNDARY ���������������������������������������������������������������������������������������������������������������56

                                                                                                                           CITY OF MIDDLEBURG HEIGHTS MASTER PLAN           5
Source: City of Middleburg Heights, City Hall

                                              Section 1
                                              INTRODUCTION
                                              The City of Middleburg Heights has           official founding in 1928 to present
                                              a long and deeply rooted history of          day planning efforts and studies. This
                                              hardworking residents in an ideally          section will focus on the City's 1971
                                              located community along the I-71             Comprehensive Master Plan, a 2014
                                              corridor. Described as “A City for all       Bagley Road Mixed-Use Development
                                              Seasons,” Middleburg Heights provides        Study, and a 2015 Pearl Road
                                              a wealth of opportunities to conduct         Redevelopment Initiative.
                                              business, to find a home at any stage
                                              of life, and to enjoy the outdoors. With
                                              excellent access to all northeast Ohio has
                                              to offer, a business-friendly community
        DID YOU KNOW?                         with a diverse economic base, and plans
                                              for further enhancing community life,
        Approximately three miles             now is a great time to be a Middleburg
        of US 42 (Pearl Road)                 Heights resident.
        runs through the center of
        Middleburg Heights.                   This section examines where Middleburg
                                              Heights has been and provides a concise
        It was the first red-bricked          glimpse at the community's historic
        highway in the nation                 past. This helps lay the foundation for
        during the 1890's.                    understanding the advancements made
                                              within the community since the City's

6   CURRENT CONDITIONS | DRAFT July 7, 2020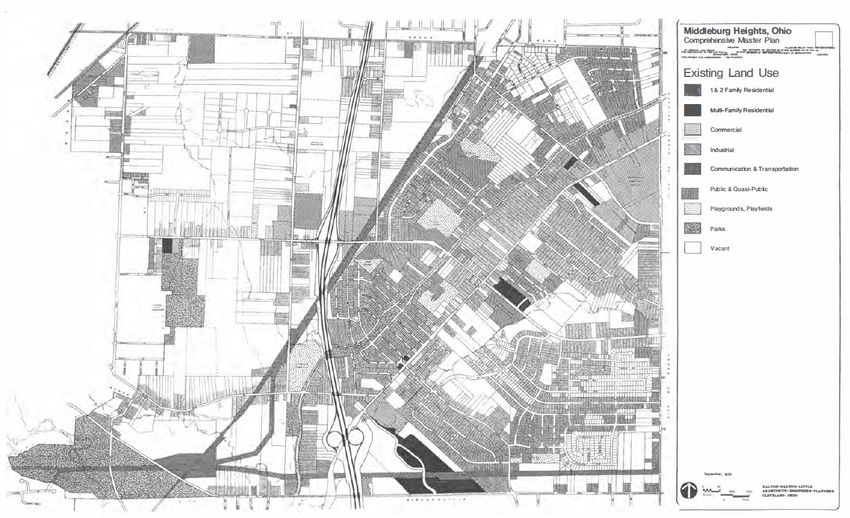
JUST THE FACTS                                                        WHAT'S IN THIS SECTION?
                                                                      This section takes a close look at the history of
                                                                      Middleburg Heights, in addition to recent planning
                                                                      initiatives and studies.

NEWEST                                                                •   History of Middleburg Heights, page 8
community and incorporated city.
                                                                      •   Past Planning & Current Studies, page 10
          Founding Year                       Incorporated as City

 1928     Middleburg Heights         1961     Middleburg Heights
 1914     Brook Park                 1961     Brook Park
 1911     Parma Heights              1961     North Royalton
 1836     Berea                      1960     Strongsville
 1818     Strongsville               1956     Parma Heights
 1818     North Royalton             1931     Parma
 1816     Parma                      1930     Berea

OLDEST                               SMALLEST
for median age of                    for total population.
residents.

          Median Age*                         Total Population

 46.5     Middleburg Heights         79,559     Parma
 46.1     Strongsville               44,752     Strongsville
 44.1     Brook Park                 30,322     North Royalton
 43.4     North Royalton             20,162     Parma Heights
 42.3     Parma                      18,859     Berea
 42.1     Parma Heights              18,721     Brook Park
 37.9     Berea                      15,670     Middleburg Heights

* Median Age in Years

Source: US Census, ACS 5-Year Estimates 2018 (Community Profile);
City of Middleburg Heights; City of Berea; City of Brook Park; City
of North Royalton; City of Parma; City of Parma Heights; City of
Strongsville

                                                                                               CITY OF MIDDLEBURG HEIGHTS MASTER PLAN   7
1.1 HISTORY OF MIDDLEBURG HEIGHTS
            KEY EVENTS & PIVOTAL MOMENTS

              In 1809, the first settlers
              moved into the Middleburg
              Heights area and arrived just
              as the Shawnee Indian Chief
              Tecumseh was organizing
              various tribes in the region to              In 1850, Berea officially
              protect Indian lands.                        becomes a Village.

              Source: Middleburgh Heights Historical
              Society

        1800                                            1850                                                1900

           In 1820, settlers vote to                       In 1850, Woodvale Cemetery
        incorporate the township                           opens.
       as "Middleburgh" in honor
       of the previous town many
         of them originated from:
                Middleburgh, N.Y.

                                                           Source: Ohio History Connections
                  In 1836, Berea broke away
                     and Middleburg Heights
                      then became known as
                 East Middleburg Township,
                   a farming community and
               "Onion Capitol of the World."
                                                                                              In 1914, Brook Park officially
                                                                                                        becomes a Village.

               Source: Middleburgh Heights Historical
               Society

8   CURRENT CONDITIONS | DRAFT July 7, 2020
Middleburg Heights was incorporated as a village in 1928 and officially as a city in 1961. The community occupies
     eight square miles and is located thirteen miles southwest of Cleveland, bounded by Brook Park to the north, Parma
     and Parma Heights to the east, Strongsville and North Royalton to the south, and Berea to the west. Middleburg
     Heights has a long, and deeply-rooted history of perseverance and hardworking people. For more information
     about the history of City of Middleburg Heights, please visit: www.middleburgheights.com/history

In 1928, about 600 township
residents met in the Little
Red Schoolhouse near
Sheldon and Fry Roads                             In 1960, Council confirms the                           In 2013, MetroHealth
and voted to offically form                       growing custom of spelling                              Middleburg Heights Family
the Village of Middleburg                         Middleburg without an "h."                              Center opens.
Heights.
                                                      In 1961, Middleburg Heights                            In 2014, Southwest General
                                                      officially becomes a city.                             Health Center expands again.

                                                        In 1971, the City adopts its first
                                                        Comprehensive Master Plan.

                                                         In 1975, Southwest General
                                                         Hospital moves from Berea and the
Source: Middleburgh Heights Historical                   Polaris Vocational Center opens.
Society

                1950                                                           2000                                     PRESENT

                                                                    In 1982, Southwest General
                                                                    Hospital expands.

                                                       In 1969, the local branch of
                                                       the Cuyahoga County Public
                                                       Library opens.

                                                In 1959, the construction of                         In 2009, the Lake to Lake
                                                Interstate 71 with exits on                          Trail is completed, linking
                                                Pearl Road and Bagley Road,                          Lake Isaac and Lake Abram.
                                                accelerated the transition
                                                to a more residential
                                                community.

                      In 1950, the Southland
                      Shopping Center Opens.

                      Source: Middleburgh Heights Historical
                      Society

                                                                                                 CITY OF MIDDLEBURG HEIGHTS MASTER PLAN   9
1.2 PAST PLANNING & CURRENT STUDIES
             SIGNIFICANT PROJECTS & PLANS

                                               1971 COMPREHENSIVE MASTER PLAN
                                               The late 1960s and early 1970s were an important point in Middleburg Heights' growth
                                               and development. The City had experienced a boom in post-World War II growth, but
                                               still had room for expansion. The 1971 Master Plan recognized that the City's proximity
                                               to Cleveland, access provided by I-71, I-80, and Pearl Road, and valuable untouched land
                                               would continue to put development pressures on the City and that the City must have a
                                               plan to guide that expected growth.

                                               The 1971 Master Plan developed objectives and recommendations for three sectors of
                                               the community: The Residential Community, the Business Community, and Industry. In
         DID YOU KNOW?                         developing these objectives, the Master Plan followed three basic guidelines:
                                                   ▪ Residentially, as a well-organized community continually on alert to the
         During the 1971 Master                      need for careful coordination of street arrangement and the provision of a
         Plan, more than 80%                         full complement of municipal facilities so that pleasing and safe residential
         of vacant land was                          environments are achieved;
         being used or had been                    ▪ Commercially, as an up-to-date trade and service center supplying the
         previously used for                         community's and the region's shopping and convenience needs in organized,
         agricultural uses.                          attractive and well-located business centers; and
                                                   ▪ Industrially, as a desirable location for manufacturing and research activities
         Today, the City has no land                 through the careful organization and control of areas related to the residential
         currently being used for                    components of the city.
         agricultural uses, nor is
         any land zoned as such.               RESIDENTIAL COMMUNITY OBJECTIVES

                                               Middleburg Heights recognized the immense development potential, and pressure, that
                                               the City would be facing in the coming decades. They projected a potential build out
                                               population of 37,000 people and split the community into eight regions to determine the
                                               total capacity for residential, and other types of development. If these projections would
                                               prove to be correct, the City would need additional housing, as well as services and jobs
                                               to support such growth.

                                               The residential objectives include:
                                                  ▪ New subdivisions will be encouraged to create a pleasant environment by
                                                     recognizing areas of natural beauty and by creating interest through the use of
                                                     curvilinear streets, landscaped entrances and medians, and by aesthetic housing
                                                     arrangements of varying building types;
                                                  ▪ The design of new streets will be controlled to ensure safety and privacy yet
                                                     be arranged to provide easy access to shopping, educational and recreational
                                                     facilities;
                                                  ▪ Recreation areas will be determined and reserved in advance so that every
                                                     neighborhood will be provided adequate space for this fundamental activity in
                                                     the very best location possible; and
                                                  ▪ New neighborhoods will be oriented in such a way as to assure protection against
                                                     the hazards of through traffic and encroachment by business, industrial, and any
                                                     other incompatible land use.

10   CURRENT CONDITIONS | DRAFT July 7, 2020
BUSINESS COMMUNITY OBJECTIVES
The City recognized that with significant projected residential growth, they would
need to provide for commercial development (retail, services, offices, etc.) to serve the
increased population. Data also showed that, at the time, they were a significant regional
retail area. The presence of Southland Mall and two interstate exits would also continue
to drive commercial development. The City also wanted to discourage so called "strip"
business development along the City's major corridors to prevent over-development of
areas in and near neighborhoods. These combined issues highlight theme major theme
developed in the Master Plan; Support growth and expansion to support increased DID YOU KNOW?
population, but direct that growth into appropriate locations.
In 1967, the City of
The business objectives include: Middleburg Heights had
▪ Planning a reasonable degree of business expansion related to the well- the eighth highest retail
established business centers; sales in Cuyahoga County
at $81,556,000.
▪ Improvement of pedestrian and vehicular access to and circulation within the
regional shopping area and the refurbishing of existing establishments; and
This accounted for 2.76%
▪ Urban beautification activities by the city including landscaping, street furniture. of total retail sales in the
and pedestrian oriented facilities. County.
INDUSTRY COMMUNITY OBJECTIVES
The 1971 Master Plan wanted to assure that there was land dedicated to development
that would produce jobs. The City knew that with the access provided by interstates,
the proximity to Hopkins airport, and proximity to other industrial centers, would put
Middleburg Heights in a great position to capitalize on industrial development, as long
as they created the space for it and provided the services and utilities necessary. The
fruits of this planning can be seen even today, 50 years later, as industrial development
continues in well-focused parts of the City.
The industry objectives include:
▪ Ultimate industrial areas have been identified and will be reserved even though
actual development may not take place in the immediate future;
▪ Required utilities will be planned and constructed for the logical development of
industrial areas; and
▪ Potential conflicts between residential and nonresidential segments of the
community will be held to a minimum by careful regulation of the location,
arrangement and intensity of nonresidential uses.
LOOKING AHEAD
Reflecting on a 50 year old Master Plan, it is difficult to accurately judge its efficacy. In
many ways, the 1971 Master Plan contained contemporary ideas and standards for
development: avoid strip malls, cluster apartments near commercial developments,
stress the importance and benefits of parks and greenspace, and balance development
types. While successes can be seen in some areas, regional and national trends have
also changed dramatically in those 50 years. The 1971 Plan noted that 45% of land in
Middleburg Heights was considered “Vacant” or “Agricultural," which accounted for over
2,300 acres of land in total; this represented a significant amount of land to absorb new
growth. Although the Cleveland area began losing population and jobs with an outward
migration to the suburbs there was limited impact to Middleburg Heights growing from
approximately 12,000 residents to just over 16,000; with the peak of new housing growth
ending in the 1970s. Additionally, the community had focused on its regional strengths
as a core job hub, instead of solely a bedroom community.
In hindsight the forces that shifted the development patterns of Middleburg Heights
can be easily seen. Residential development jumped even further into the suburbs with
cheaper land, larger developments, and bigger lots. With Southland Mall, recognized in
CITY OF MIDDLEBURG HEIGHTS MASTER PLAN 111.2 PAST PLANNING & CURRENT STUDIES
SIGNIFICANT PROJECTS & PLANS
1971 as a significant regional retail center, Middleburg Heights ranked 8th in the region
in total retail sales and was experiencing growth with the development of a new Sears.
Now the Sears building sits empty and online shopping continues to replace the need
for physical storefronts. With so much existing retail in and around the City, commercial
centers often struggle to remain viable in the face of these pressures.
DID YOU KNOW?
The 1971 Master Plan shows both the importance of planning, and the importance of
Total online grocery sales maintaining current planning goals and objectives. Middleburg Heights was successful
are expected to rise from in limiting strip malls on major corridors, while maintaining a strong commercial
$17.5 billion in 2018 to business sector. The City set aside land for future industrial growth and has even seen
$30 billion in 2021. recent industrial developments come to fruition. However, the population growth
projected from the 1971 Master Plan never happened, the retail market has become
over-saturated, and housing and entertainment preferences have changed as existing
generations aged and new one emerged. The 1971 Master Plan became outdated
and could not address 20, 30, or 40 years of development pressures and shifting
preferences.
While ther 1971 Master Plan was successful in many ways, it is now time for a new
Master Plan process to guide redevelopment over the next ten years. This Master
Plan update will capture the current and projected attitudes and desires of residents,
embrace and address the economic changes of the past fifty years, and incorporate the
future of sustainable and inclusive development practices to fuel the City of Middleburg
Heights over the next decade.
2014 BAGLEY ROAD MIXED-USE DEVELOPMENT STUDY
This study, performed by City Architecture, focused on a 50 acre site located on the
north side of Bagley Road immediately adjacent to I-71. It included the former Ernst &
Young training center and other parcels of undeveloped land. While most of the parcels
were under single ownership, the study area included several zoning designations. The
study recommended creating a mixed-use overlay district to accommodate any of the
recommended development scenarios discussed within the study.
The study identified several “Development Directives” to drive any planning concepts:
▪ Take advantage of view corridors
▪ Create a new gateway along I-71
▪ Direct and capture traffic from Bagley Road
▪ Preserve the natural landscape
▪ Repurpose valuable buildings if feasible
▪ Create a through street to Fry Road that is designed as a “road” rather than a
“driveway”
The study ultimately created four development scenarios:
▪ Concept A: This option retained the existing buildings and split land to create a
new “corporate headquarters” style development with buildings grouped around
a new Bagley road entrance and along the I-71 on-ramp.
▪ Concept B: Expanded the residential development by placing new office and
12 CURRENT CONDITIONS | DRAFT July 7, 2020commercial uses along Bagley Road with a large apartment development located DID YOU KNOW?
near the Fry Road entrance. This alternative also conserved much of the existing
wooded areas as parks and greenspace. The conceptual
▪ Concept C: Proposed a complete “Corporate Headquarters” redevelopment. It plans estimated that
is similar to “Concept A” but replaced the existing Ernst & Young building and redevelopment of this site
extends into the adjacent Colombia Gas property. It still placed development could create over 1,800
along Bagley Road and the I-71 on-ramp, and provided a natural buffer to the new jobs.
adjacent neighborhood, while expanding the overall development potential of the
site.
▪ Concept D: This option created an “Office and Medical Campus”. This is option
provided the densest development of the four, focusing 3 to 5 story buildings
along the I-71 on ramp and buffering the residential uses along Fry Road. This
option was intended to supplement the City's strong medical sector presence and
serve as a significant job creation project.
2015 PEARL ROAD REDEVELOPMENT INITIATIVE
Middleburg Heights again engaged City Architecture to complete a similar focus area
study for a group of residential properties along the north side of Pearl Road between
Bagley Road and West 130th Street. While Pearl Road has kept strip mall developments to
a minimum through their 1971 Master Plan, the single-family residential developments
along Pearl Road had become under-utilized and no longer matched the surrounding
land uses.
The redevelopment study area comprised over 29 individual properties and 40 acres
total. The westernmost properties were zoned “General Business” while the rest of the DID YOU KNOW?
properties were zoned “Multi-Family” along their Pearl Road frontage and “Single-Family”
on the rear portions of the property. The study presented four development scenarios
The proposed
for the area, which all included a mix of uses including residential, commercial, and
redevelopment site was
office.
39.8 acres in size and
had 29 individual parcels
These development options included: with 21 separate property
▪ Option 1A would create almost 200 units of cluster housing with openspace and owners for land within the
connections to Big Creek Parkway. The eastern third of the development would study area.
contain over 40,000 square feet of office and commercial space.
▪ Option 1B incorporates additional acreage from properties residential properties
abutting the rear of the focus area. This would increase the site to 45 acres and
allow an additional 28 cluster units while maintaining the same commercial and
office footprint.
▪ Option 2A would develop the western “General Business” zoned parcels into an
approximately 52,000 square foot commercial center. A small, 50 unit cluster
home development would occupy the middle-third of the development. The
eastern-third of the development would consist of an additional 18,000 square
feet of commercial space along with 35,000 square feet of office space. All the
developments would have frontage along Pearl Road with parking behind.
Greenspace and connection to Big Creek Parkway is also included in this scenario.
▪ Option 2B divides the development into two halves. The western half would
consist of 91,000 square feet of commercial space divided between building.
The main entrance to the development would be through boulevard between
commercial buildings. The eastern half of the development would consist of
approximately134 units of cluster homes. Greenspace and Big Creek connections
remain.
All of these options would pull commercial buildings up to Pearl Road and put parking
behind or in-between buildings. The various options seek to include shared openspace
and trail connections to the Big Creek Parkway, located just to the north of the site.
CITY OF MIDDLEBURG HEIGHTS MASTER PLAN 13Source: Cleveland Metroparks, Big Creek Reservation
Section 2
DISCOVERING
MIDDLEBURG HEIGHTS
The City of Middleburg Heights This is beneficial to begin identifying
shares a number of trends with other where policy, development, or other
communities in the region, yet also has decisions may need to be addressed to
its own unique challenges. The City has project the best outcome for the City in
numerous amenities, world class medical the future.
facilities and services, diverse residential
housing options, and a business-friendly
atmosphere; combined, these factors
DID YOU KNOW? make it an ideal place to both call home
and conduct business. PEER COMMUNNITIES
The City of Middleburg
Heights has the smallest Throughout this section, comparisons City of Brecksville
population out of all of its will be made to both Cuyahoga County
neighboring communities, as a whole and "Peer Communities." Peer City of Independence
though not the smallest Communities are regional cities that are
geographic area. similar in residential, economic, or other City of Strongsville
characteristics, but also indicate local
aspirations defined by each community. City Westlake
These comparisons are helpful to
understand the areas where Middleburg
Heights is excelling in the region, but also
where the City may be lagging behind.
14 CURRENT CONDITIONS | DRAFT July 7, 2020JUST THE FACTS WHAT'S IN THIS SECTION?
This section takes a close look at living, working,
and getting around the City of Middleburg Heights.
These analyses include specific data points within the
LOWEST community, and also regional trends and how the City
compares to Peer Communities within Cuyahoga County.
Poverty and employment rates.
• Living Here, page 18
Poverty Rates* Employment Rates
• Working Here, page 32
11.4% Brook Park 65.2% North Royalton
10.4% Berea 63.8% Strongsville • Traveling Here, page 40
9.4% Parma Heights 62.4% Parma
9.0% Parma 61.9% Parma Heights
4.9% North Royalton 61.0% Berea
4.8% Strongsville 60.1% Brook Park
4.5% Middleburg Heights 56.7% Middleburg Heights
* The US Census Bureau measures poverty by using a set of money income
thresholds that vary by family size and composition to determine who is in
poverty. If a family's total income is less than the family's threshold, then that
family and every individual in it is considered in poverty.
WHY DOES THE CITY HAVE LOW EMPLOYMENT RATES?
Low employment rates can happen for a number of reasons,
but a primary factor is the number of residents that are out
of the workforce. The City of Middleburg Heights has a higher
percentage of seniors than the County median and has a large
group of those nearing the end of their working careers that
will likely hit retirement at the same time over the next decade.
In general, once people move to Middleburg Heights they tend
to stay in their homes for a long period of time. As a result, it is
likely the employment rates will continue decline as more and
more groups of the workforce approach retirement in large
quantities.
MODERATE
Land area and median household income.
Median Household
Land Area*
Income
24.6 Strongsville $87,264 Strongsville
21.3 North Royalton $70,429 North Royalton
20.0 Parma $61,709 Middleburg Heights
8.1 Middleburg Heights $59,229 Berea
7.5 Brook Park $55,536 Parma
5.7 Berea $51,626 Brook Park
4.2 Parma Heights $49,326 Parma Heights
* Total land area in square miles
Source: US Census, ACS 5-Year Estimates 2018 (Community Profile)
CITY OF MIDDLEBURG HEIGHTS MASTER PLAN 152.1 WHAT'S TRENDING?
UNFOLDING THE STORY
MIDDLEBURG
HEIGHTS TODAY
The City of Middleburg Heights last took Additionally, each of these profiles is
a comprehensive look at the community then divided into three subsections.
during it's 1971 Comprehensive Master These include:
Plan. Much has changed over the last ▪ Regional Trends: which takes a look
50 years and the Middleburg Heights of at trends that are happening within
today is quite different than it was when Cuyahoga County and beyond and
the 1971 Plan was completed. how those might affect the City of
Middleburg Heights;
This section takes a deep dive into the ▪ Local Findings: which takes a look at
DID YOU KNOW? Middleburg Heights community and Middleburg Heights specific data as it
compares regional and local trends to its exists today and/or comparing that to
Peer Communities and the County as a historical trends; and
The median age of
whole. As seen in the images on the next
residents in the City of ▪ Comparing the City: which takes a
page, the "Middleburg Heights Today"
Middleburg Heights is 46.5 look at how the City of Middleburg
section outlines a current snapshot of
years old. Heights compares to the trends and
the community as it is today. This will
data of its Peer Communities and the
focus on three main components of the
County as a whole.
community:
▪ The Living Here profile will focus on All of these components together tell the
what life is like for residents today; story of Middleburg Heights as it is today,
▪ The Working Here profile will focus compared to how the community has
on what it is like working within the changed over time.
community; and
▪ The Traveling Here profile will focus
on what is like to move within and
around the City.
This Existing Land Use map from the 1971
Master Plan outlines how land was utilized
within the community fifty years ago.
Much of the land was vacant, indicated
in white in the map to the left, which
accounted for 45.5% of the City's total
land area. Today, vacant land accounts for
9.0% of all land within the community.
Source:1971 Comprehensive Master Plan,
Existing Land Use Map, pg 16
16 CURRENT CONDITIONS | DRAFT July 7, 2020LIVING HERE
The "Living Here" profile will take a closer look at what life is like
for residents who call Middleburg Heights home. This includes
demographic data, housing trends, and amenities and services.
WORKING HERE
The "Working Here" profile will take a closer look at the
business climate of Middleburg Heights. This includes labor
force, employment concentrations and product output, and job
sectors.
TRAVELING HERE
The "Traveling Here" profile will take a closer look at how
residents and commuters get to and how they navigate the City.
This includes commute times, inflow and outflow of vehicles, and
transportation choices.
CITY OF MIDDLEBURG HEIGHTS MASTER PLAN 172.1 WHAT'S TRENDING?
UNFOLDING THE STORY
LIVING HERE
Living in a community is more than just gross domestic product. Knowing this,
commuting from home to work and back. land is one of the most important pieces
It's a place to call home. This analysis for any community to leverage. There
includes a number of factors, such as are five main factors that effect the real
services and amenities, population shifts, estate market:
demographic age gaps, and real estate. 1) Supply and demand;
2) Median home prices;
The City of Middleburg Heights has
seen many changes since its 1971 3) New construction;
DID YOU KNOW? Comprehensive Master Plan. The Plan 4) Mortgage rates; and
originally estimated a population of 5) Economy.
The City of Middleburg 37,000 residents and 12,500 dwelling
Heights has a combined units at full build-out, which was
5,233 parcels used for The economy has seen enormous shifts
expected to happen within 20 years, in recent years, largely due to the Great
single-family homes, or by 1990. However, the residential
duplexes, and multi-family Recession. The Great Recession began
population has remained steady at in 2008 and led to some of the highest
units. around 15,000 residents since 1990, recorded rates of unemployment and
at nearly 7,586 dwelling units in 2010. home foreclosures in the U.S. since the
The community had diverged from Great Depression.
this projected residential capacity and
focused on its regional strengths as a
Between the years 2005 and 2007 almost
core job hub, instead of solely a bedroom
half of home loans issued in the U.S.
community.
were sub-prime. These high interest
rate loans were issued to homebuyers
The City's ideal location and proximity with a greater risk of defaulting on the
to both Cleveland and Akron continue repayment, which during this time many
to draw numerous employers to the did. This was the main catalyst to the
area, but also provides a convenient Great Recession that followed. However,
place to call home. Middleburg Heights over time new securities were put in
has a diverse housing stock and options place by the Federal Government and
at various price-points for both those housing markets slowly began to recover.
wishing to purchase a home or those Since the end of the Great Recession in
looking to rent. 2009, the housing market in the City of
Middleburg Heights has fully recovered
THE IMPORTANCE OF REAL ESTATE and the median sale price for a single-
family home is 20% over those from
Real estate plays an enormous role in 2009. However, national lifestyle and
both the national and local economies. preference shifts towards rental units
In 2018, real estate construction and smaller dwellings is something that
contributed $1.15 trillion to the nation's should continue to be monitored.
economic output. That's 6.2% of U.S.
Sources: The Blanace; Amadeo, Kimberly (Real Estate's Impact on the US Economy, February 2020)
18 CURRENT CONDITIONS | DRAFT July 7, 2020REGIONAL TRENDS
3.5m
Historic Projected
REGIONAL POPULATION IS
SHRINKING.
3�00m
3.0m 2�83m 2�84m
8.9% 2�76m 2�78m 2�72m 2�68m 2�64m 2�63m
11.1% 14.2%
13.9% 14.9%
2.5m 18.6%
22.3% 21.6% 20.4% Historically, the population in the Northeast Ohio region
33.2%
32.7%
peaked in 1970 with just over three million people. That
2.0m
34.7% 39.1%
41.5%
number fell to a low in 1990 before a slight uptick in
38.5%
35.5% 36.2% 36.5% 2000. Based on 2010 population totals and changes, the
1.5m
19.7% population in the Northeast Ohio region is projected to
24.9%
23.6% 18.9%
continue to decline slightly over the next four decades
1.0m 17.8%
19.5% 19.1% 18.4% 19.4% from 2.78 million in 2010 to 2.63 million in 2050. This
38.2%
equates to a 5.3% loss in population in the coming
0.5m
31.3%
27.8% 27.8% 25.8%
decades.
23.4% 23.2% 23.7% 23.8%
0m
1970 1980 1990 2000 2010 2020 2030 2040 2050
Seniors young Adults
Working Age Adults Children
HOUSEHOLD SIZES ARE ALSO
From 1970 SHRINKING IN OUR REGION.
to 2017,
households
have shrunk The U.S. Census defines a Household as any person
from an or group of people living together in a residence
average of 3.2
regardless of relationship. Historically, household
persons per
household to sizes have consisted, on average, of at least 3 persons
2.4 persons per household prior to the year 1980. Since that time,
per household household sizes have continued to decrease from 2.7 in
(a decrease of
over 30%)
1980, 2.6 in 1990, 2.5 in 2000, and 2.4 in both 2010 and
2017; which equates to households, on average, being a
third smaller than they were fifty years ago.
2017: 2.4 1970: 3.2
Persons per Persons per
Household Household
Sources: National Historic GIS (NHGIS, 1970-2010), Ohio Development Services Agency (2020-2050); US Census (2017)
CITY OF MIDDLEBURG HEIGHTS MASTER PLAN 19LIVING HERE | LOCAL FINDINGS
2.1 WHAT'S TRENDING?
UNFOLDING THE STORY
85 and over 2.7% 4.7% IN 2018, NEARLY A QUARTER OF
80 to 84 2.3% 3.4% THE CITY'S POPULATION WAS AGE
75 to 79 2.8% 4.5% 65 YEARS OR OLDER.
70 to 74 3.5% 5.9%
65 to 69 4.8% 5.2% The City of Middleburg Heights has a higher percentage
of residents age 65 years or older (23.7%) than that
60 to 64 6.5% 7.4%
found within the County (16.1%) as a whole. Additionally,
55 to 59 7.4% 7.9% the City has about 7% fewer residents under the age of
25 (23.4%) than that of the County (30.1%). However, the
50 to 54 7.6% 6.1%
City also has 15.3% of its population between the ages
45 to 49 6.7% 6.1% 55 to 64, which are pre-retirement. These groups will
40 to 44
all age together and likely retire around the same time,
6.1% 5.6%
potentially having adverse effects on revenues, services,
35 to 39 5.7% 6.8% infrastructure, and housing.
30 to 34 6.3% 7.5%
A higher concentration of seniors and smaller
25 to 29 6.6% 5.6% concentrations of children and young adults poses
20 to 24 6.5% 3.9% unique challenges. Seniors may need specialized care
or are more frequent users of emergency calls than
15 to 19 6.2% 4.7%
younger residents, potentially straining services within
10 to 14 6.0% 4.9% the community. Similarly, smaller concentrations of
children and young adults could have adverse affects
5 to 9 5.6% 4.9%
on the school district enrollment, tax revenues, and the
Under 5 5.8% 5.0% ability to maintain high quality facilities and services.
Cuyahoga County Middleburg Heights
1950 2,299 THE CITY'S TOTAL POPULATION
HAS REMAINED RELATIVELY STABLE
1960 7,282
SINCE THE EARLY 2000S.
1970 12,367
The City's total population saw dramatic increases from
the 1950s to the 1980s, but generally plateaued after
1980 16,218 1980. Since the 1980s, the City of Middleburg Heights'
population has seen relatively small increases and
1990 14,702 decreases, but over time has remained stable.
The significant growth predicted in the 1971 Master Plan
2000 15,542
(a population of over 30,000) never came to fruition.
From 1980 to 1990, the City saw its largest decrease in
2010 15,946 total population (1,516 residents). Then, in both 2000
and 2010, the City saw modest increases in population.
2018 However, in 2018 it was estimated that the City lost a
15,540
(estimated) very small amount of population, approximately 406
total residents.
Sources: US Census, ACS 5-Year Estimates 2018 (Age); Historic Population
20 CURRENT CONDITIONS | DRAFT July 7, 20200�1%
0�4% 5�2% IN 2018, THE CITY HAD
8�3%
5�2%
PROPORTIONALLY HIGHER
White Two or More Races ASIAN RESIDENTS THAN ITS PEER
Black Other COMMUNITIES.
82�7%
Asian Hispanic
The racial and ethnic composition of an area can help to
inform policy and program decisions for a community.
Middleburg Heights While the City of Middleburg Heights is more racially
diverse than its Peer communities, the City was still
0�4% 2�7% 0�3% 3�9% 0�5% mostly homogeneous in 2018, with 82.7% of residents
5�2%
2�4%
2�9%
4�7% 2�9% 3�9%
2�6%
3�3%
identifying as White.
3�1%
When comparing the City to it Peers and the County as a
29�3% 59�2% whole, the City of Middleburg Heights has a much higher
86�2% 87�8% percentage of those who identify as Asian at 8.3%. This
is almost three times higher than the County as a whole.
Cuyahoga County Westlake Strongsville Additionally, the City has a higher percentage of those
who identify as Hispanic at 5.2%. This is slightly less than
0�9%
2�6% 1�4% the 5.8% in the County, but higher than all of its Peer
0�2%
4�2% 1�6% 1�7%
Communities.
92�1% 95�2%
Brecksville Independence
THE MAJORITY OF RESIDENTS LIVE
EAST OF I-71.
The City of Middleburg Heights has high concentrations
of industry within the community. Most of the City's
heavier uses are located to the west of I-71, while the
majority of residential dwellings and units are located to
71
the east of I-71. As seen in the map to the left, the darker
colors indicated higher concentrations of residents,
while the lighter colors mean lower concentrations
of residents. The highest concentrations of residents
are located in the southeast corner of the community.
This area has a number of senior care homes,
apartment buildings, and densely organized residential
neighborhoods, making for higher residential density.
Higher Density of Population Lower Density of Population
Sources: US Census, ACS 5-Year Estimates 2018 (Race & Ethnicity); County Planning
CITY OF MIDDLEBURG HEIGHTS MASTER PLAN 21LIVING HERE | LOCAL FINDINGS
2.1 WHAT'S TRENDING?
UNFOLDING THE STORY
1939 or Earlier 30.0% 3.1%
OVER 67% OF HOMES IN THE CITY
1940 to 1949 9.5% 3.3% WERE BUILT FROM 1950 TO 1979.
1950 to 1959 20.0% 14.6%
1960 to 1969 13.9% 21.4%
The City's housing stock was largely built as a post WWII
1970 to 1979 10.0% 31.4% boom in the 1950s with a large increase from the 1960s
1980 to 1989 5.4% 6.7% through the 1970s. This is opposite of the housing stock
1990 to 1999 5.9% 10.9% in the County as whole, which was primarily built prior
2000 to 2009 4.2% 7.7% to 1960. However, after the 1970s the City saw a sharp
2010 or later 1.1% 0.9% decline in new construction and continues to see very
few new homes being built. This could be due to the City
approaching full build-out capacity.
Cuyahoga County Middleburg Heights
Middleburg 39.3% FROM 2013 TO 2018, THERE WAS
Heights 42.8%
AN INCREASE OF RENTAL UNITS.
Cuyahoga 64.3%
County 71.1%
As housing trends and demands continue to change,
17.6%
Brecksville rental units have become an attractive option for active
18.4%
seniors and millennials. From 2013 to 2018, the City of
Independence
7.3% Middleburg Heights (+3.5%), its Peer Communities, and
7.5% Cuyahoga County (+6.8%) all saw an increase in rental
23.9% units, with the exception of Strongsville who saw a slight
Strongsville
22.9% reduction (-1.0%) of rental units.
35.4%
Westlake
36.6%
% Rental Units 2013 % Rental Units 2018
Middleburg
5.7%
29.5% 30.1% 34.7%
THE CITY HAS RENTAL UNITS AT
Heights
DIVERSE PRICE POINTS.
Cuyahoga
23.3% 28.1% 21.9% 26.7%
County
1.3% 8.3%
The City of Middleburg Heights has a more diverse and
Brecksville 12.9% 77.5%
affordable rental stock than the majority of its Peer
0.0%
Communities. Over 65% of the City's rental units are
Independence 27.3% 15.6% 57.0%
priced under $1,000 per month. The City of Strongsville
3.6%
Strongsville 24.9% 22.0% 49.4%
has the next highest concentration of rental units under
3.8%
$1,000 per month at just over 50% of its total units.
Westlake 10.8% 17.1% 68.3%
When compared to its Peer Communities, Middleburg
Heights has the closest distribution of rental unit prices
to those found within the County as a whole. This makes
Rent Under $600 Rent $600 to $799
Middleburg Heights a more affordable option than its
Rent $800 to $999 Rent Over $1,000 Peer communities.
Sources: US Census, ACS 5-Year Estimates 2018 (Housing Units by Year Built, Cash Rent); US Census, ACS 5-Year Estimates 2013 & 2018 (Cash Rent)
22 CURRENT CONDITIONS | DRAFT July 7, 2020OVER THE LAST DECADE, THE CITY HAS ISSUED OVER 1,000 RESIDENTIAL
BUILDING PERMITS.
The City of Middleburg Heights continues to develop As seen in the map below, larger dots indicate higher
and has seen many changes over the years. Since 2010, project valuations, while smaller dots are for lower
the City has issued nearly 1,900 building permits (1,879), project valuations. In general, tightly clustered, larger
of which 1,323 (just over 70%) were for residential blue residential dots can indicate newer subdivisions or
purposes. These numbers represent more than just neighborhoods, while scattered, smaller blue dots can
new construction, as permits can also be issued for indicate small-scaled residential projects.
structural additions, accessory buildings such as sheds,
or a remodel.
Commercial Permits Residential Permits
NEWTON ROAD
SM
IT CANTERBURY DRIVE
H
ENGLE ROAD
VILLAGE COURT RO
AD
DEER RUN DRIVE
ST ANDREWS COURT
WEXFORD COURT
AD
BAGLEY ROAD
RO
L
AR
PE
71
W. 130TH STREET
TRENTON TRAIL
2010-2019 RESIDENTIAL COMMERCIAL
PERMITS ISSUED 1003 826
TOTAL VALUE $25,126,476 $255,070,657
AVERAGE VALUE $25,051 $473,229.42
MEDIAN VALUE $5,000.00 $43,000.00
Larger Dots = Higher Price Valuation Smaller Dots = Lower Price Valuation
Sources: County Planning, City of Middleburg Heights, Building Permits & Valuations, January 2010 - February 2020
CITY OF MIDDLEBURG HEIGHTS MASTER PLAN 23LIVING HERE | LOCAL FINDINGS
2.1 WHAT'S TRENDING?
UNFOLDING THE STORY
MEDIAN SALES PRICE FOR SINGLE-
$178,000
FAMILY HOMES CONTINUE TO RISE
$160,000
$160,000
$152,500
$147,200
$146,370
IN THE CITY.
$142,000
$139,000
$138,000
$135,000
$135,000
The Great Recession largely ended in 2009, but the
housing market took more time to rebound than other
sectors of the economy. In the City of Middleburg
Heights the median sales price for a single-family home
has been steadily climbing since 2014. In 2014, the
median sales price for a single-family home within the
City was $146,370. This has continued to climb and in
2019, the median sales price for a single-family home
2011
was $178,000. This indicates stronger home values and
2009
2010
2012
2013
2015
2016
2017
2018
2019
2014
reinvestment within the community since the recession.
IN 2019, THE MEDIAN SALES PRICE FOR A SINGLE-FAMILY HOME WAS
NEARY 21% HIGHER THAN IN 2009.
The City of Middleburg Heights housing market saw median sales price was 4.0% above that of 2009. The
a decline in its median sales price for a single-family market has continued to gain traction and in 2019 the
home following the end of the Great Recession in 2009. median sales price for a single-family home within the
Between the years 2011 and 2012, the City's median City was 20.9% above what it was in 2009. This indicates
sales price was 8.0% below what is was in 2009. The a strengthening housing market and one that has fully
market continued to slowly rebound and in 2016, the recovered from the Great Recession.
Middleburg Heights Cuyahoga County Strongsville Brecksville Independence Westlake
30%
25%
20% 20.9%
15%
10%
9.0% 9.0%
5%
4.0%
0%
0% -1.0%
-5% -4.0%
-6.0% -6.0%
-10% -8.0% -8.0%
-15%
2009 2010 2011 2012 2013 2014 2015 2016 2017 2018 2019
Sources: Northern Ohio Data and Information Service (NODIS), Median Sales Price & Annual Housing Sales, 2009-2019
24 CURRENT CONDITIONS | DRAFT July 7, 2020BASED ON CURRENT CITY PERMITTING DATA, SINGLE-FAMILY PROPERTY
INVESTMENTS ARE DISTRIBUTED EVENLY THROUGHOUT THE COMMUNITY.
The City of Middleburg Heights is a slightly older maintains a detailed record of the appraisal on each
suburb of Cleveland, and is older than other outer-ring parcel in Cuyahoga County and conducts a reappraisal
suburban communities in the County. The City's oldest every six years, an update every three years, and an
homes are generally located closer to the center of the annual valuation of improvements based on City-issued
community, near I-71. As the City continued to grow, building permits. As seen in the map below, lighter
residential development followed and slowly grew to blues indicated lower single-family property valuations,
the boundaries seen today. By state law, the Cuyahoga while darker shades of blue indicate higher single-family
County Fiscal Officer is responsible for ensuring that property valuations. In general property valuations are
every parcel of land and the buildings upon them spread evenly throughout the community, indicating
are fairly and uniformly appraised and assessed for residential infill, reinvestment in older homes, and
real property tax purposes. The County Fiscal Officer limited opportunities for expanded growth.
SM
IT
H
ENGLE ROAD
RO
AD
AD
BAGLEY ROAD
RO
L
AR
PE
71
W. 130TH STREET
Higher Single-Family Property Valuations Lower Single-Family Property Valuations
Sources: County Planning; Cuyahoga County Fiscal Office, Single-Family Home Property Valuations, 2020
CITY OF MIDDLEBURG HEIGHTS MASTER PLAN 25LIVING HERE | LOCAL FINDINGS
2.1 WHAT'S TRENDING?
UNFOLDING THE STORY
THE CITY SHARES THE BEREA CITY SCHOOL DISTRICT WITH THREE OTHER
COMMUNITIES.
The City of Middleburg Heights is served by the Berea available to adults. The Polaris Career Center is largely
City School District (BCSD). With around 6,000 total divided into three main sections:
students, BCSD provides public education to four
communities including Berea, Middleburg Heights, Polaris High School Programs
Brookpark, and a portion of Olmsted Falls. BCSD is fairly ▪ Serves 11th and 12th graders from Berea-Midpark,
diverse with over 25% of students coming from minority Brooklyn, Fairview, North Olmsted, Olmsted Falls and
backgrounds. Strongsville High Schools
▪ Number of career-technical programs – 18
The Ohio School Report Card is an annual grade given to
▪ 2019-2020 high school enrollment (Middleburg
school districts based on six key components, of which
Heights campus) – 814
BCSD has improved its grade in multiple categories
for the 2019 school year. These components include:
Achievement, Progress, Gap Closing, Graduation Rate, High School & Satellite Programs (Grades 7-12)
Improved at Risk K-3 Readers, and Prepared for Success. ▪ Serves 7th through 12th graders in all six associate high
The District’s progress component showed significant schools plus Brooklyn, Lewis F. Mayer, Strongsville
growth. The progress component looks closely at the and Olmsted Falls Middle Schools and Middleburg
growth that all students are making based on their Heights Junior High
past performance. The progress component focuses ▪ Number of programs that currently provide students
on gifted, the lowest ranked 20% in achievement, and access to college credit – 18
students with disabilities. In 2019, BCSD received a C ▪ 2018-2019 satellite (high school/middle school)
in the progress component. This grade is a significant program enrollment – over 3,700
improvement from 2018 when the district received an F.
Adult Education
In regards to funding, BCSD spent $12,888 per pupil ▪ Serves students from all over Greater Cleveland
in 2019. When comparing this number to neighboring
school districts, BCSD is towards the middle of the list ▪ 12 Adult Job & Career Training Programs
with North Olmsted spending the most and Olmsted ▪ Number of adults served on average – over 6,000
Falls spending the least. For each dollar the BCSD spent, students
67% went to instruction and pupil support,14% went to
administration,16% went to building operations and 4% HIGHER EDUCATION
went to staff support. This budget is made up of 63%
local funds, 27% state funds, 7% other non-tax funds, Middleburg Heights residents also have immediate
and 3% federal funds. Currently, the Berea City School access to Baldwin Wallace University in Berea and the
District is constructing two new schools (Brook Park Tri-C Western Campus in Parma. Baldwin Wallace is a
Elementary and Berea-Midpark High School). The Berea private university with roughly 3,500 enrolled students as
City School District expects that both schools should be of Fall 2019. It offers a number of degree programs and
completed this year. athletic facilities, which can be utilized by the public for a
fee. Tri-C has numerous locations throughout the region
VOCATIONAL OPTIONS and has nearly 30,000 students enrolled in classes. The
College has numerous degree, certificate, and adult
The Polaris Career Center has served both students and education classes available, in addition to facilities open
adults since its founding in 1975. The sprawling 47 acre to the public.
campus includes a 257,000 square foot building that
houses numerous vocational programs. Students can
choose among the choice of career-technical programs,
and hundreds of open-enrollment courses that are also
26 CURRENT CONDITIONS | DRAFT July 7, 2020THE CITY HAS AMPLE ACCESS TO REGIONAL RECREATION OPPORTUNITIES,
LOCAL AMENITIES & EDUCATIONAL INSTITUTIONS.
The City not only has immediate access to schools and Creek Reservation located within the community. This
higher educational institutions, its residents also have includes the Big Creek Parkway, which offers a refreshing
great access to nearby recreational amenities. Local alternative to the standard suburban commuter routes
attractions, such as the Middleburg Heights Community to Cleveland. A main attraction of the reservation is the
Playground and Community Center, are located at Lake to Lake Trail, a 2.4 mile universally accessible all
the City's municipal campus near the intersection of purpose trail that connects Lake Abram to Lake Isaac.
Bagley and Pearl Roads. Other regional amenities, such Additionally, there are several opportunities to connect
as Coe Lake Park and Wallace Lake Park, are located into the planned, county-wide Cuyahoga Greenways trail
just to the west in the City of Berea. The City has a network.
significant portion of the Cleveland Metroparks Big
LAKE ABRAM METROPOLITAN RESERVATION
SM
IT
H
ENGLE ROAD
RO
AD
EDUCATION
MIDDLEBURG HEIGHTS
COMMUNITY PLAYGROUND
EDUCATION
AD
EDUCATION BAGLEY ROAD
RO
FIRE
L
AR
CUYAHOGA COUNTY FAIRGROUNDS
PE
EDUCATION
EDUCATION
FIRE
71 EDUCATION
COE LAKE PARK
EDUCATION
EDUCATION
LAKE TO LAKE TRAIL
W. 130TH STREET
WALLACE LAKE PARK
BIG CREEK RESERVATION
EDUCATION Schools K-12 Rec Center Police Park/Trail Access Park Space Cuyahoga Greenways: Route Types
Higher Education Public Libraries FIRE
Fire Existing Trails 1/2 Mile from Park Off-Street Future On-Street Future
Sources: County Planning, City of Middleburg Heights, 2020
CITY OF MIDDLEBURG HEIGHTS MASTER PLAN 27LIVING HERE | LOCAL FINDINGS
2.1 WHAT'S TRENDING?
UNFOLDING THE STORY
FROM 2011 TO 2017, THE CITY SAW A 9% LOSS OF TREE CANOPY.
The City of Middleburg Heights has a number of large, seen in the map below, pink areas indicate sections of
protected environmental areas, such as the Big Creek tree canopy loss between the years of 2011 and 2017.
Reservation. However, there still remains some well- In general, all of Cuyahoga County's 59 communities
treed sections of the community that are vacant and lost tree canopy coverage from 2011 to 2017, except
available for development. Much of this land is located the cities of Euclid and Cuyahoga Heights. These
along the I-71 corridor and in the industrialized areas communities saw minor gains of roughly 2.5%.
of the City. As a result, the City experienced a loss of
277 acres of tree canopy or about 9%. In 2017, the City
had roughly 30% tree canopy coverage, which is below
the County's overall canopy coverage of 34.7%. As
LAKE ABRAM METROPOLITAN RESERVATION
SM
IT
H
ENGLE ROAD
RO
AD
BAGLEY ROAD
AD
RO
CUYAHOGA COUNTY FAIRGROUNDS
L
AR
PE
71
COE LAKE PARK W. 130TH STREET
WALLACE LAKE PARK
BIG CREEK RESERVATION
No Change in Tree Canopy Gain in Tree Canopy Loss of Tree Canopy
Sources: County Planning, Urban Tree Canopy Assessment, 2011 & 2017
28 CURRENT CONDITIONS | DRAFT July 7, 2020IN 2017, OVER 32% OF THE CITY'S LAND AREA WAS COVERED BY
IMPERVIOUS SURFACES.
While the City of Middleburg Heights has tremendous light or dark grey are impervious pavement and dark
environmental assets, the community also has extensive reds indicate physical structures and buildings. The
industrial and commercial spaces that have expansive largest portions of impervious surfaces are concentrated
impervious surfaces, such as rooftops and parking just to the west of the I-71 corridor in the City's industrial
lots. In 2017, the City's total tree canopy coverage, or core, at Southland Shopping Center near the eastern
the amount of ground covered by leaves when viewed boundary, and along Pearl Road. Runoff from these
from above, was 30%, an additional 36% was grass and areas in particular will flow quickly during heavy rain
shrubs, and only 2% was bare soil and waterways. The events and can impact sensitive water features, such as
remaining 32% of land area within the City was covered Baldwin Creek, which is part of the much larger Rocky
by impervious surfaces, such as roads, railroads, and River Watershed and drains into Lake Erie's Central
buildings. As seen in the map below, areas identified in Basin.
LAKE ABRAM METROPOLITAN RESERVATION
SM
IT
H
ENGLE ROAD
RO
AD
SOUTHLAND SHOPPING CENTER
AD
BAGLEY ROAD
RO
CUYAHOGA COUNTY FAIRGROUNDS
L
AR
PE
BALDWIN CREEK
71
COE LAKE PARK
W. 130TH STREET
WALLACE LAKE PARK
BIG CREEK RESERVATION
Bare Soil Waterways Grass/Shrubs Tree Canopy Roads/Railroads Other Pavement Buildings/Structures
Sources: County Planning, Urban Tree Canopy Assessment, Land Cover, 2017
CITY OF MIDDLEBURG HEIGHTS MASTER PLAN 29LIVING HERE | COMPARING THE CITY
2.1 WHAT'S TRENDING?
UNFOLDING THE STORY
Decrease Increase
FROM 2013 TO 2018, THE CITY
-4.0% EXPERIENCED SIMILAR AGE SHIFTS
-6.7%
AS ITS PEER COMMUNITIES AND
Under 18
3.6%
-5.8%
SAW A MODERATE LOSS IN YOUNG
-8.6% ADULTS.
-5.4%
From 2013 to 2018 the City of Middleburg Heights
-11.6% saw an overall loss of population (-1.2%). However,
3.7% some age groups did see growth, while other age
groups saw proportionally larger losses. The City, its
18 to 34
2.2%
22.9% Peer communities, and the County as a whole all saw
reductions of children under the age of 18; with the
6.3%
exception of Brecksville, which saw an increase of 3.6%.
10.6%
When compared to its Peer Communities and the County
1.7% as a whole, the City of Middleburg Heights was the only
municipality to lose residents from the "young adult" or
-5.2%
18 to 34 age group (-11.6%). All other Peer communities
35 to 64
-6.5%
and the County each saw increases within this age group.
-4.4% Conversely, out of all of its Peer communities and the
-5.4% County as a whole, the City of Middleburg Heights was
-11.6% the only municipality to see an increase of those aged 35
to 64 (+1.7%).
5.3% Additionally, Cuyahoga County and the entire Northeast
8.6% Ohio Region are seeing drastic increases in seniors
8.0% over the age of 65. From 2013 to 2018, the City of
65+
6.1% Middleburg Heights saw a much smaller increase in
20.8%
seniors than the County as a whole or any of its Peer
Communities. The City saw a 5.3% increase of seniors,
22.1%
while the communities of Strongsville and Westlake
each saw increases in seniors of over 20%. Such drastic
-1.2% shifts in population could be due to these Cities'
-1.5%
larger populations and age groups shifting brackets
simultaneously. This could indicate that the City of
-0.3%
Middleburg Heights has not reached a threshold where
Total
0.5% large numbers of people are reaching retirement age
0.2% at the same time, potentially giving the City more time
-0.5% to prepare for large age shifts in the coming decade.
However, if seniors are not able to comfortably age in
place, they may choose to leave the community.
Middleburg Heights Brecksville Strongsville
Cuyahoga County Independence Westlake
Sources: US Census, ACS 5-Year Estimates 2013 & 2018 (Population by Age Group)
30 CURRENT CONDITIONS | DRAFT July 7, 2020You can also read


