Impact of Land Management on Water Resources, a South African Context - MDPI
←
→
Page content transcription
If your browser does not render page correctly, please read the page content below
sustainability

Review
Impact of Land Management on Water Resources, a South
African Context
Mary Nkosi *, Fhumulani I. Mathivha                      and John O. Odiyo

                                           Department of Hydrology and Water Resources, University of Venda, Thohoyandou 0950, South Africa;
                                           fhumulani.mathivha@univen.ac.za (F.I.M.); john.odiyo@univen.ac.za (J.O.O.)
                                           * Correspondence: marymshado@gmail.com; Tel.: +015-962-8459

                                           Abstract: Globally, the changes exerted on the land cover have shown greater impacts on the quality
                                           and quantity of water resources and thus affecting catchment’s hydrological response (i.e., runoff,
                                           evapotranspiration, infiltration, amongst others). South Africa is a water-scarce country faced with
                                           domestic water supply challenges. A systematic review was conducted on the overview impacts
                                           of land use/land cover changes on water resources. Despite the country’s best efforts in ensuring
                                           the protection and sustainable use of water resources, the review indicated that water quality has
                                           been compromised in most parts of the country thus affecting water availability. The increase in
                                           water demand with development presents the need for better integrated strategic approaches and
                                           a change in behaviour towards water resource and land management. Thus, the review suggested
                                           a few possible solutions that will promote sustainable development, while protecting and preserving
                                           the integrity of South African water resources.

                                           Keywords: hydrological response; land cover/land use; land management; water quality;
                                           water resources; water resource management


                                           1. Introduction
Citation: Nkosi, M.; Mathivha, F.I.;
                                                 Demographic, economic, and technological trends have led to the modification of
Odiyo, J.O. Impact of Land
                                           the natural environment throughout the world. Cosgrove et al. [1] reported that humans
Management on Water Resources, a
South African Context. Sustainability
                                           have become the primary drivers of environmental modifications that have significant
2021, 13, 701. https://doi.org/
                                           impacts on the temporal distribution of precipitation in catchments and timing of runoff.
10.3390/su13020701                         These changes coupled with landscape changes due to increased food demand, energy
                                           production, and urbanisation, have compromised the quantity and quality of freshwater
Received: 3 November 2020                  resources [1–3]. Economic development, human settlement patterns, and population dis-
Accepted: 4 January 2021                   tribution are linked to water sources, therefore increasing the vulnerability of freshwater
Published: 13 January 2021                 resources as development progresses [4]. Soko and Gyedu-Ababio [5] mentioned that
                                           environmental pollution started with the emergence of towns and built-up areas in the
Publisher’s Note: MDPI stays neu-          19th century. The interaction of hydrological systems with land use and weather patterns
tral with regard to jurisdictional clai-   (rainfall, temperature) has a “cause and effect” relationship [6,7]. Studies have linked popu-
ms in published maps and institutio-       lation growth with changes in Land use/ Land cover (LU/LC) and estimated modification
nal affiliations.                          of about 39 to 50% around the world [8–11].
                                                 The impact of land management is highly visible on water resources since catchment
                                           hydrology is sensitive to land use dynamic changes [4,12,13]. Some studies have described
Copyright: © 2021 by the authors. Li-
                                           the likely impacts of LU/LC changes on streamflow, sediment yield, and on the availability
censee MDPI, Basel, Switzerland.
                                           and quality of water for both ecosystem and human use [3,14]. Issaka and Ashraf [15]
This article is an open access article
                                           further stated that this has also given rise to other environmental problems such as soil
distributed under the terms and con-       erosion and sedimentation. Due to the direct link between LU/LC and the hydrological
ditions of the Creative Commons At-        response, Kumar et al. [3] emphasised the need to urgently integrate water resources
tribution (CC BY) license (https://        management and land management. Sustainable management of the earth’s surface
creativecommons.org/licenses/by/           includes sustainable management of the land. Kumar et al. [3] further indicated that these
4.0/).                                     processes also play a significant role in the surface and groundwater budget.

Sustainability 2021, 13, 701. https://doi.org/10.3390/su13020701                                     https://www.mdpi.com/journal/sustainability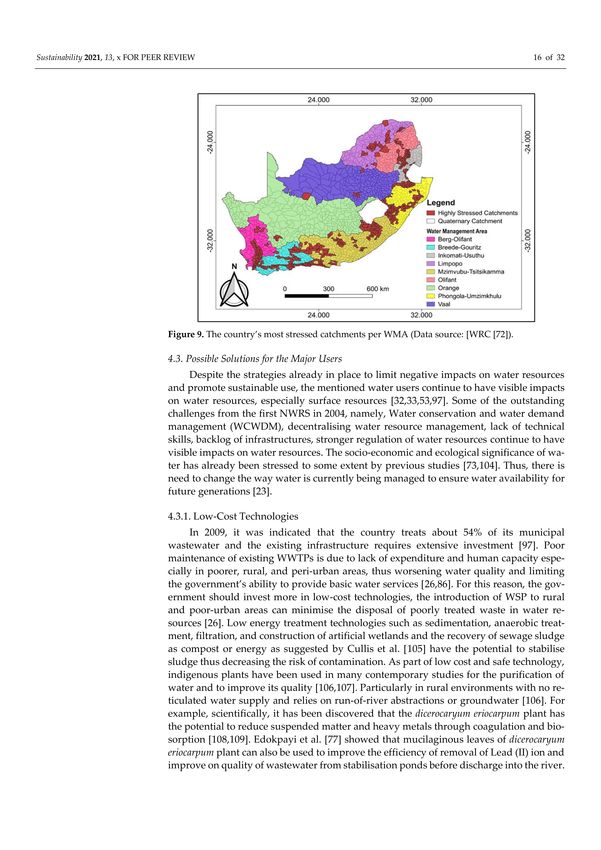
Sustainability 2021, 13, 701                                                                                              2 of 32

                                    Different LU/LC factors responsible for the modification of runoff, evapotranspira-
                               tion, sediment transport, and groundwater recharge may sometimes lead to land degra-
                               dation [3,16,17]. There have been studies linking LU/LC changes with natural disasters,
                               Calder and Aylward [18] and Cui et al. [19] reported a significant increase in the worldwide
                               annual river discharge of approximately 50% since 1900. Sauka [4] linked deforestation with
                               the erosion of riverbeds and decreased infiltration thereby promoting runoff. The expansion
                               of agriculture, urbanisation, deforestation, and daily human activities can temporally and
                               spatially change river flow path [14]. A study by Zhou et al. [20] reported an increase in sur-
                               face runoff and a reduction in baseflow in Yangtze River Delta region. Converting forests
                               to grazing lands and agricultural land has resulted in reduced soil infiltration and reduced
                               groundwater recharge in Amazon’s lowlands and Kenya’s rift Valley, respectively [21,22].
                                    An increase in population leads to new land developments, hence an increase in water
                               demand and water users [23]. LU/LC changes need to be sustainable to maintain water
                               quantity and water quality and thus sustaining water availability. Water plays a major
                               role in the ecological and socio-economic wellbeing of a country. It has been noted by
                               WWF-SA [24] that South Africa is still facing challenges when it comes to domestic water
                               supply and water service delivery. Some of the noted major contributing factors were
                               inadequate water resource availability to meet the demand, underdeveloped infrastructure
                               for water storage, abstraction, distribution and treatment [25]. It has also been highlighted
                               that some people in developing countries still turn to open rivers for basic water supply
                               while some opt for groundwater resources [26,27]. For this reason, there is a need to ensure
                               that land development is not at the cost of the integrity of water resources. Since LU/LC
                               interacts with water at different scales and times [6,28], this article aims to provide a holistic
                               overview of the impact it has on water resources in South Africa, both quality and quantity
                               included. The review presents the theoretical background of South Africa’s land and water
                               resources management. It further collates, analyses and discusses the impacts of LU/LC on
                               water resources and finally recommends possible mitigation approaches and/or strategies.

                               1.1. Theoretical Background
                               1.1.1. Overview of South Africa’s Water Resources
                                    Water availability and water resources management are the key aspects of envi-
                               ronmental and socio-economic systems [29,30]. South Africa has been declared water-
                               stressed with highly seasonal and variable rainfall, water availability was estimated to
                               be about 1100 m3 /person/annum in 2005, and in 2017 it was estimated to be about
                               905 m3 /person/annum (see Appendix A) [29–31]. It was mentioned to be the 29th driest
                               country out of the 193 driest countries in 2005 (Appendix A) and ranked 30th driest country
                               in the world [28,32,33], with an average rainfall of about 450 mm per annum, which is
                               about 52% less than the world’s average [30]. Mukheibir and Sparks [29] reported that
                               only a small part of the country receives rainfall amount of more than 750 mm per annum,
                               mostly in the south-eastern coastlines while the western part is arid to semi-arid. Further-
                               more, about 65% of the country receives less than 500 mm of rainfall per year. Climate
                               and River regimes display inter-annual and intra-annual variability in both timescales
                               and streamflow is reported to be very low for most of the year [34]. Shulze [35] indicated
                               that South Africa has a low conversion of rainfall to runoff. Approximately 9% of the
                               rainfall in wetter regions of the country makes its way to the river in a form of runoff and
                               is considered the lowest in the world [32].
                                    Freshwater resources are classified into three sources, namely, surface water (77%),
                               return flow (14%), and groundwater (9%) [36]. Water requirements are influenced by
                               population, economic activities, mining, industries, irrigation, and afforestation. Kahinda
                               and Boroto [36] reported that South Africa mostly use surface water resources to meet
                               urban, industrial and irrigation needs. Figure 1 presents some of the major rivers and
                               dams in South Africa [37–40]. It was reported that surface water resources are highly
                               developed with approximately 320 major dams with a supply capacity exceeding 1 million
                               m3 and more than 500 state-owned dams storing an estimated amount of 37 million m3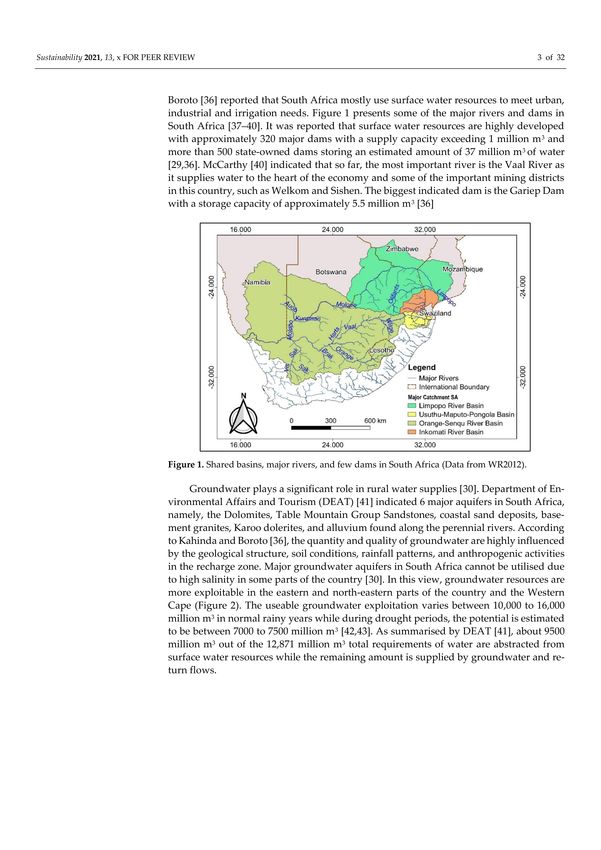
Sustainability 2021, 13, 701                                                                                             3 of 32

                               of water [29,36]. McCarthy [40] indicated that so far, the most important river is the Vaal
                               River as it supplies water to the heart of the economy and some of the important mining
                               districts in this country, such as Welkom and Sishen. The biggest indicated dam is the
                               Gariep Dam with a storage capacity of approximately 5.5 million m3 [36]

                               Figure 1. Shared basins, major rivers, and few dams in South Africa (Data from WR2012).

                                    Groundwater plays a significant role in rural water supplies [30]. Department of
                               Environmental Affairs and Tourism (DEAT) [41] indicated 6 major aquifers in South Africa,
                               namely, the Dolomites, Table Mountain Group Sandstones, coastal sand deposits, basement
                               granites, Karoo dolerites, and alluvium found along the perennial rivers. According to
                               Kahinda and Boroto [36], the quantity and quality of groundwater are highly influenced
                               by the geological structure, soil conditions, rainfall patterns, and anthropogenic activities
                               in the recharge zone. Major groundwater aquifers in South Africa cannot be utilised due to
                               high salinity in some parts of the country [30]. In this view, groundwater resources are more
                               exploitable in the eastern and north-eastern parts of the country and the Western Cape
                               (Figure 2). The useable groundwater exploitation varies between 10,000 to 16,000 million
                               m3 in normal rainy years while during drought periods, the potential is estimated to be
                               between 7000 to 7500 million m3 [42,43]. As summarised by DEAT [41], about 9500 million
                               m3 out of the 12,871 million m3 total requirements of water are abstracted from surface
                               water resources while the remaining amount is supplied by groundwater and return flows.

                               Figure 2. Exploitation potential for utilisable groundwater (Data from WR2012).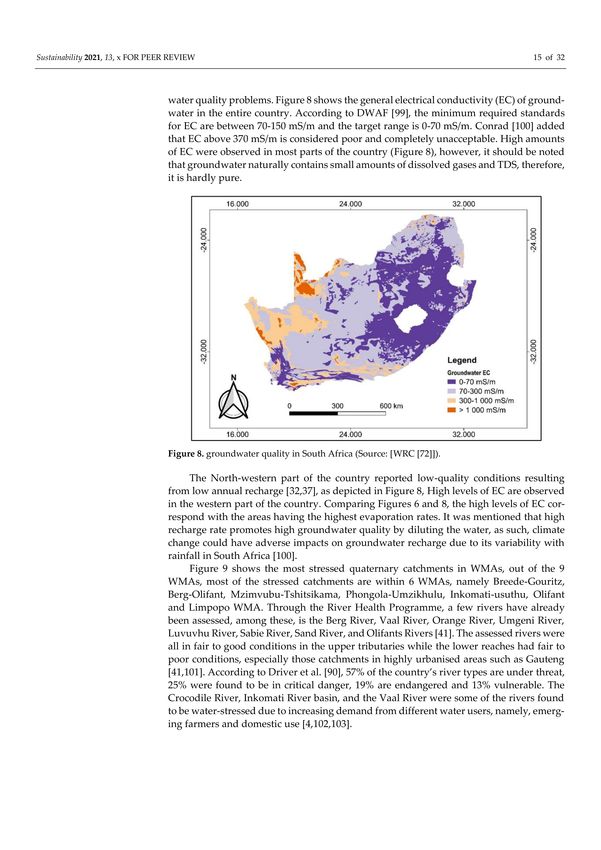
Sustainability 2021, 13, 701                                                                                           4 of 32

                               1.1.2. Water Resource Management in South Africa
                                     Water resource management implies the planning of water use in such a way that
                               it remains sustainable in terms of the hydrological cycle and water availability [44].
                               Water management involves both quality and quantity. South Africa’s water policies
                               and legislations are based on the principles of the Integrated Water Resources Management
                               (IWRM) approach [45]. The IWRM approach integrates the management of land, environ-
                               ment and water to ensure sustainability of water resources [45,46]. Sustainable water use is
                               realised when the rate of resource withdrawal, consumption, or depletion does not exceed
                               the rate of replenishment. The approach also promotes the need to balance the protection
                               of water resource with the need to use water for socio-economic development [45].
                                     The main driving forces to South Africa’s freshwater environment [4,33,47] include:
                               •    The natural conditions (soil and rock type, landforms, and topology), ecosystem,
                                    the combined impacts of climatic changes affecting the availability of run-off.
                               •    Population increase and the need for economic development leading to increased
                                    water demand and increased pollution of available water resources.
                               •    Water resource management policies governing relevant authorities in managing
                                    water resources.
                                     The National Water Act (NWA) of 1998 and the Water Service Act (WSA) of 1997 offer
                               a holistic legal framework for the governance of water resources with emphasis on the
                               management of the entire catchment and optimal use of freshwater without negatively af-
                               fecting the aquatic ecosystem [30,44,48]. Under the National Water Act, the National Water
                               Resource Strategy (NWRS) and the Catchment management strategy were implemented
                               to provide information on water resources and to facilitate and promote the efficient use,
                               management, development, protection, and control of water resources. The first NWRS
                               was established in 2004 which served as the blueprint for the management, protection,
                               development, conservation, and control of South African Water Resources [49]. The second
                               NWRS was published in 2013 and it builds on the first NWRS and continue to ensure the
                               management of national water resources towards achieving the growth, development and
                               socio-economic priorities in an equitable manner for the next 5 to 10 years [45]. Through
                               the NWRS, the Catchment Management Strategies were established, and they go as far
                               as creating the framework for water allocation to both existing and potential users while
                               considering the factors affecting the management, proper use, and development of water
                               resources. The National Groundwater Strategy was developed later in 2010 to increase the
                               knowledge and use of groundwater and therefore, ensuring sustainable management of
                               groundwater resources [30].
                                     There are two major water resource protection strategies developed under the NWA
                               and NWRS, namely, Resource-directed Measures and Source-directed Controls. Resource-
                               directed Measures deal with the quality of water resources as they reflect the overall health
                               or condition of the resource and they also measure the ecological status [50]. Resource
                               quality refers to the quality and quantity of water, character, and condition of the in-stream
                               and riparian habitats. They set objectives for the required level of protection of each
                               resource. The objectives ensure that each aspect of the Reserve is not damaged beyond
                               repair. The source-directed controls, control water use activities, the sources of impact,
                               include tools such as standards, incentives, and situation-specific conditions ensuring that
                               the protection objectives are achieved [50]. According to the White Paper on National
                               Water Policy [51], actions that affect resource quality can be controlled by changing the
                               ways of water-and land-users.

                               1.1.3. Land Use and Land Management in South Africa
                                    Land cover is defined as the biophysical or vesical cover (i.e., vegetation or crop) that
                               can be detected by remote sensing [6], while [52,53] defined land use as an arrangement
                               or activities undertaken by humans in land cover to produce, modify or maintain the
                               land. Unlike land cover, land use cannot be mapped easily, its data can be obtained
                               indirectly from the agricultural census and determined through socio-economic market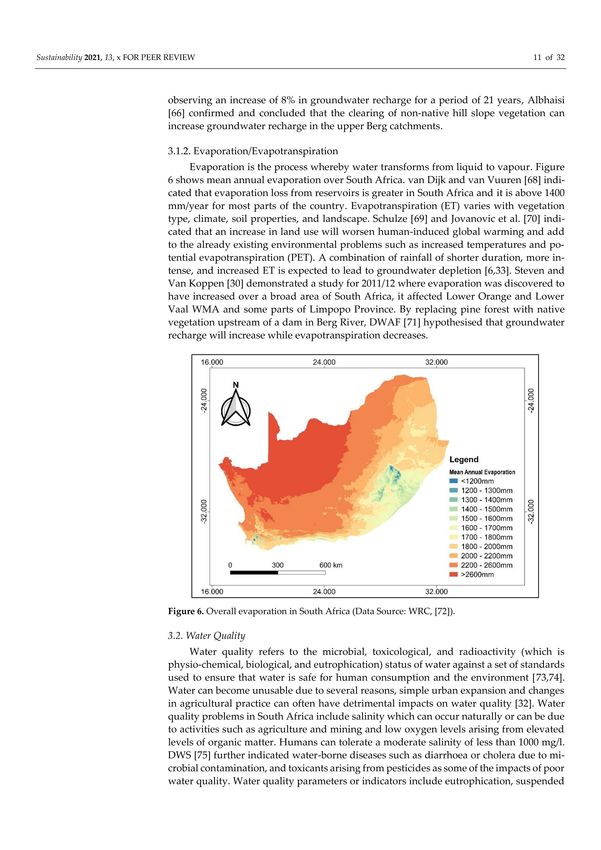
Sustainability 2021, 13, 701                                                                                            5 of 32

                               forces [53]. South Africa covers an area of approximately between 121.9–34 million ha,
                               and of this, over 80% (100 million ha) is used for agriculture [54,55]; with about 3%
                               owned by smallholders or irrigation schemes. In 1990, 12.3% of the land was classified as
                               degraded. Ngcofe et al. [54] assessed land cover changes between 2013/14 and 2017/18
                               and on comparison with the 2000 landcover changes, there was a decrease in natural
                               woodland of 9.29%, and bare and degraded areas increased by approximately 6.09% [55].
                               There is a need to optimise the use of land in South Africa to ensure livelihood support
                               and improve environmental conditions.
                                     Land Use Management (LUM) is part of a land governance system that establishes
                               the framework to regulate access to land, land rights, land use, and land development [56].
                               This can be viewed as part of land management, which is a much broader concept that
                               considers the policies and regulations that govern and regulate land. Access to land
                               is one of the most socially and politically sensitive issues in South Africa and requires
                               an integrated and holistic programme to achieve its sustainability [56,57]. Historically,
                               the LUM system was used in the service of racial and spatial segregation [58]. Charlton [56]
                               further explained that this was adapted from the British town planning activities which
                               were initially developed to respond to the impact of the industrial revolution and promote
                               the health and safety of urban residents only. Currently, LUM has been experiencing
                               a shift in policy from the “restrictive, control-oriented approach to a more comprehensive,
                               facilitative approach” [57]. Some of the laws and policies shaping current land management
                               include the 1995 Development Facilitation Act 67, 2001 White Paper on Spatial Planning
                               and Land Use Management, 1998 National Environmental Management Act (NEMA) 107,
                               and legislations such as IDPs, strategic plans, and zoning schemes [56,57,59].

                               2. Methodology
                                    This article is a literature review of the impact of land management on water resources.
                               The search methodology was adapted from Feil et al. [60]. The aim is to collate, analyse
                               and discuss pertinent information sitting in different publications and governmental re-
                               ports to provide a holistic overview of the impact of LU/LC on water resources in South
                               Africa and how they have been managed, both in terms of quality and quantity, and
                               infer/suggest other appropriate management strategies and/or approaches. The review
                               made use of previous articles and secondary data. The article selection process is further
                               explained in the ensuing section. The selected articles were further analysed and organised
                               according to their years of publication. Secondary data was used to depict the long-term
                               impacts of LU/LC on water resources (see Table 1). The study used freshwater withdrawal
                               data covering a period of 27 years (1990–2017) and the changes were compared with the
                               corresponding land use cover.

                               Table 1. Internet databases.

                                         Database                     Data Retrieved                 Date Accessed
                                         WR2012                    Spatial data (shapefiles)           15 July 2020
                                                                  South African freshwater        15 July 2020, revised 5
                                    FAO-AQUASTATS
                                                                      withdrawal data                 December 2020
                                           FAO                Global total water renewable data        15 July 2020

                               2.1. Article Selection
                                    Articles were selected systematically, the process for selection is depicted in Figure 3.
                               The string of keywords used to search for the articles were “Water resource Management in
                               South Africa”, “the effects of land use/land cover on water quantity”, “the effects of land
                               use/land cover on water quality”, “the effects of land use/land cover on water quantity in
                               South Africa”, “the effects of land use/land cover on water quality in South Africa”, “Land
                               use management in South Africa”, “surface water and groundwater resource management
                               in South Africa”. The strings of keywords were typed on the Google search bar and Google
                               Scholar. Only publications published in English were considered.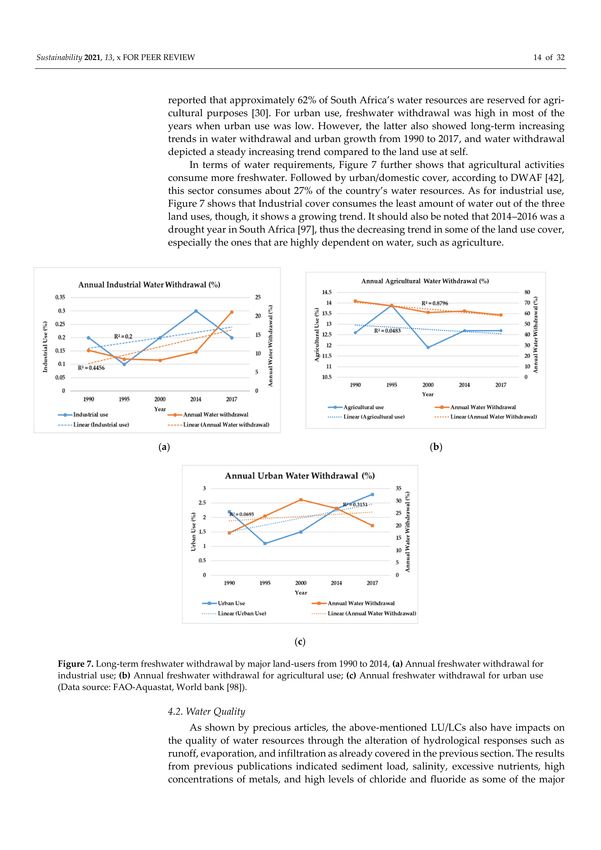
Sustainability 2021, 13, 701                                                                                           6 of 32

                                 Figure 3. Article selection process.

                                       A total of 118 publications were chosen and reviewed to populate the full paper.
                                 From the 118 publications, 55 were publications covering the impact of land use on water
                                 resources and presenting the state of water resources in South Africa, however, only 39 pub-
                                 lications were selected for analysis based on quantifiable information.

                                 2.2. Data Extraction
                                      In order to provide a more holistic overview, this review included governmental
                                 reports. Figure 4 and Appendix B presents information on the chosen publications.
                                 Appendix B presents the data extracted from each article and the location in which the
                                 study was conducted, the appendix further indicated the aspect of the study in which the
                                 publication focused. The appendix also indicates the type of land use and the impacts.
                                 About 19 publications covered the whole country, while the remaining covered certain
                                 catchments, Catchment Management Areas (CMAs) or Water Management Areas (WMAs)
                                 and provinces (see Appendix B). The results section narrates the impact of LU/LC on
                                 surface and groundwater quality and quantity as covered by the selected publications.

                               Figure 4. The yearly distribution of the articles used for extracting data.
Sustainability 2021, 13, 701 7 of 32
3. Results
After data selection and extraction (see Appendix B), the data was analysed using
thematic analysis. Thematic analysis is useful in summarising key features of a large
data set, it assists in producing a clear and organised final report [61]. The data was then
organised into three major land use themes, namely, urban, industrial and agricultural use
as shown in Figure 5. The three major themes form the foundation of the discussion.
3.1. Water Quantity
In South Africa, about one-third of the precipitation becomes runoff, and two-thirds
is evaporated, transpires, or infiltrates, as further indicated by Muller et al. [32], approxi-
mately 66% of the Mean Annual Runoff (MAR) in the country is found in the rivers. From
the total MAR of 49,040 million m3 p.a., total requirements make up only 20% while 8% is
lost through evaporation from storage and conveyance along rivers, and 6% is lost through
land use [32,41]. Mukheibir and Sparks [29] indicated that only about 5400 million m3 of
water is obtained in the groundwater sources per year.
3.1.1. Runoff and Infiltration
Schulze [35] stated that runoff patterns reflect rainfall and soil characteristics. Drainage,
vegetation, land use, and soil types have impacts on the amount of runoff generated in
a catchment. Schulze [35] indicated that the production of the forest is a major concern
because it consumes more water than the natural vegetation, therefore they were declared
“stream flow activity”. Forest plantations were calculated to have used an additional
of 922 million m3 of water which was estimated to be 1.8% of South Africa’s MAR [35].
A rapid development of irrigation farming resulted in large-scale deforestation in the
Crocodile River rising from the Witwatersrand, Johannesburg and only the riverbanks
remained vastly covered with invasive syringa trees and reeds [62]. Parsons [63] mentioned
alien plants to be another major concern in catchments, it was indicated that streamflow in
South Africa was reduced by 10% due to this vegetation. The latter author further stated
that alien plant removal in Limpopo and North-west Provinces resulted in a 20 m rise
in the water table over a period of 30 years. DWA [64] also reported that invasive alien
plants were found to be one of the factors that affected runoff in Crocodile and Sabie River
Catchments under the Inkomati-Usuthu WMA. A reduction in streamflow was reported in
the latter catchments due to exotic plantations such as Pine, Eucalyptus, and wattles [64].
In addition, activities such as irrigation, domestic water use, and mining were reported to
have reduced streamflow in the Olifants River in Mpumalanga, thus negatively affecting
the aquatic ecosystem of this river [10]. Construction of dams, weirs, and diversion of rivers
contributed to the alteration of hydrological patterns in catchments. Dabrowski et al. [6]
reported a decrease in flow volumes in the uMngeni river due to small dam constructions.
The Crocodile River (West) is the largest and most important river in the previous Marico
Water Management Area, currently called the Limpopo WMA. It is also one of the major
rivers influenced by human activities in South Africa. The river has limited surface and
groundwater resources, most of the water resources in this catchment are for urban and
industrial purposes. The natural flow of many tributaries has been highly altered due to
a large quantity of return flow [29,65]. Basson and Rossow [65] indicated that urban return
flow has compromised 30% of the Crocodile River (West) water availability and estimated
that by 2030, the total urban flow will be 486 million m3 /a with average water demand
management measures.Sustainability 2021, 13, 701 8 of 32
Figure 5. Thematic presentation of the extracted land use and respective impacts on water resources.Sustainability 2021, 13, 701 9 of 32
Groundwater provides an important source of water supply in rural and semi-arid
places, especially during drought [66]. However, these sources are at risk of being
depleted [67]. DEAT [41] indicated that over-abstraction of groundwater resources is
a problem in most parts of South Africa. Stevens and van Koppen [30] reported a long-
term decrease in aquifer saturation level in some places in the Limpopo region, namely,
the Limpopo, Luvuvhu, and Letaba (currently known as Limpopo WMA) and the Olifants
CMA currently called the Olifant WMA. It was further indicated that towards the west of
the Limpopo province, the groundwater level decreased from 0.2 to 5 m p.a. More cases of
over-abstraction of groundwater were reported in places such as North-west and Witwa-
tersrand [29,30]. Land use/land cover changes have an impact on the infiltration process
consequently affecting the groundwater recharge [66,67]. Parsons [62] indicated cases
where runoff volumes had been altered and decreased groundwater recharge, while in
some cases, leaking pipes and water tanks have created new sources of recharge. After ob-
serving an increase of 8% in groundwater recharge for a period of 21 years, Albhaisi [66]
confirmed and concluded that the clearing of non-native hill slope vegetation can increase
groundwater recharge in the upper Berg catchments.
3.1.2. Evaporation/Evapotranspiration
Evaporation is the process whereby water transforms from liquid to vapour. Figure 6
shows mean annual evaporation over South Africa. van Dijk and van Vuuren [68] in-
dicated that evaporation loss from reservoirs is greater in South Africa and it is above
1400 mm/year for most parts of the country. Evapotranspiration (ET) varies with vege-
tation type, climate, soil properties, and landscape. Schulze [69] and Jovanovic et al. [70]
indicated that an increase in land use will worsen human-induced global warming and
add to the already existing environmental problems such as increased temperatures and
potential evapotranspiration (PET). A combination of rainfall of shorter duration, more in-
tense, and increased ET is expected to lead to groundwater depletion [6,33]. Steven and
Van Koppen [30] demonstrated a study for 2011/12 where evaporation was discovered
to have increased over a broad area of South Africa, it affected Lower Orange and Lower
Vaal WMA and some parts of Limpopo Province. By replacing pine forest with native
vegetation upstream of a dam in Berg River, DWAF [71] hypothesised that groundwater
recharge will increase while evapotranspiration decreases.
Figure 6. Overall evaporation in South Africa (Data Source: WRC, [72]).Sustainability 2021, 13, 701 10 of 32
3.2. Water Quality
Water quality refers to the microbial, toxicological, and radioactivity (which is physio-
chemical, biological, and eutrophication) status of water against a set of standards used to
ensure that water is safe for human consumption and the environment [73,74].
Water can become unusable due to several reasons, simple urban expansion and changes in
agricultural practice can often have detrimental impacts on water quality [32]. Water qual-
ity problems in South Africa include salinity which can occur naturally or can be due to
activities such as agriculture and mining and low oxygen levels arising from elevated
levels of organic matter. Humans can tolerate a moderate salinity of less than 1000 mg/L.
DWS [75] further indicated water-borne diseases such as diarrhoea or cholera due to mi-
crobial contamination, and toxicants arising from pesticides as some of the impacts of poor
water quality. Water quality parameters or indicators include eutrophication, suspended
solids, hydrocarbons from petrochemicals, acidification due to low pH, littering, herbicides,
and pesticides [33]. Schulze [35] stated that poor water quality in South Africa has resulted
in major health concerns, ecosystems threats and exacerbated the issue of water security
in this country, thus placing the country’s water resources under a lot of pressure. Muller
et al. [32] indicated that, once water quality is compromised, it can be a challenge and
expensive to reverse the changes, especially for groundwater sources.
There are programmes the government has put in place to monitor water quality and
protect water resources, namely, the River Health Program (RHP), the development of
water resource classification, and wastewater risk management plans such as the Green
Drop [75]. The RHP was established to assess the quality of river systems, ensure a bet-
ter understanding of these systems and indicate the extent of human use impact [5,41].
The function of the Green Drop certification is to reduce pollution to the environment due
to municipal wastewater treatment works and identify priority ecosystems for conservation
and programmes that monitor and manage the river health system [75].
3.2.1. Surface Water Quality
The lack of proper sanitation in rural areas and unmanaged sanitation services in urban
areas have negative impacts on water resources [33]. Mema [76] stated that population
growth has put a lot of pressure on wastewater treatment plants (WWTP), thus affecting the
effectiveness of these plants in treating water. Edokpayi et al. [77] found that the WWTP at
Thohoyandou is inefficient in its treatment of wastewater due to overloading from increased
population and socio-economic activities. It was reported that sewerage system failures
have led to toxic cyanobacteria identified in all the WMAs in the country [32,78]. According
to DWAF [79], of all the WSAs in the country, only 46% reported that they monitor the
volume of discharge of their waterworks. Most South African WWTPs obtained low green
drop scores, for example, the Makhado and Musina WWTPs in Limpopo Province and the
Kingstonvale and Kabokweni WWTPs in Mpumalanga [64,80].
Other quality problems as mentioned by Dabrowski et al. [6] were overgrazing and
misusing the land, which resulted in increased sediment load in river systems, which nega-
tively affects water flows and degrades the ecosystem. Manufacturing and mining compa-
nies also continue to have significant impacts on water quality, studies indicated that water
quality was deteriorating in the Crocodile River due to agricultural run-offs, industrial and
sewage effluent, and mining seepage from the Kaap River tributary [5,71]. Compromised
water quality was further reported in the upper Olifants River in Mpumalanga due to
agricultural activities and industrial works [81,82]. The “cocktail” of pollution on the
upper Olifants catchments resulted in compromised ecological and human health concerns
downstream of the catchment with Loskop dam being the most affected [83]. Van der
Laan et al. [73] indicated high levels of salinity, chloride, and phosphate especially in
winter, and high levels of magnesium in summer in the middle reaches of the Olifants
catchment. The Upper Vaal WMA, currently known as the Vaal WMA, is highly developed
and impacted upon by human activities [84], Nel and Driver [37] reported elevated levelsSustainability 2021, 13, 701 11 of 32
of Total Dissolved Solids (TDS). Return flows and urban wash-off have resulted in high
eutrophication which led to poor quality of the Hartbeespoort and Roodeplaat Dams [30].
3.2.2. Groundwater Quality
Groundwater quality varies from place to place. Groundwater is very vulnerable to
pollution especially in highly populated areas; and locations with concentrated economic
activities [37]. In Lower Orange WMA, currently known as the Orange WMA, groundwater
quality was reported to be deteriorating at an alarming rate in boreholes due to salinity
changes from 1996 to 2012 that led to increased electrical conductivity from 220 mS/m to
approximately 435 mS/m. McCarthy [40] indicated that acid mine drainage (AMD) is one
of the major water quality challenges due to mining activities. The water seeping from
abandoned mine dumps, open pits, and mine shafts is highly acidic. The most affected
catchments include the gold mines in the Western Basin (Krugersdorp area), Central
basin (Roodepoort to Boksburg area), and Eastern basin (Brakpan, Springs, and Nigel
areas of the Witwatersrand) [37]. Pit latrines have been associated with chemical and
microbial contamination of groundwater [85,86]. Holland [87] highlighted numerous water
supply boreholes in villages sited next to pit latrines to have been affected by microbial
contamination. In some areas of Sabie River catchment, pit latrines were found to be
the cause of poor groundwater quality [88]. While the disposal of paper mill effluents in
Ngodwana, Mpumalanga were the main reason for the decrease in water quality, especially
in the Elands River [88]. High levels of chlorine, fluoride, nitrates, calcium and magnesium
were highlighted as major groundwater quality problems within South Africa [45,87,89–92].
Odiyo and Makungo [91] indicated fluoride concentrations of 5.1, 5.6 and 1.7 mg/L in all
the sampled boreholes in Siloam Village and these are higher than the 1 mg/l indicated as
acceptable for domestic use by the DWAF.
4. Discussions and Suggestions
Water plays a significant role, not only in sustaining lives but also in the socio-
economic wellbeing of a country [32]. Nel and Driver [37] reported that most of South
Africa’s rivers are classified as upper or lower foothill rivers and extensive cultivation
takes place in the fertile floodplains. Water resources go beyond domestic purposes and
agriculture and play an important role in the removal and purification of wastes, naviga-
tion, ecotourism and recreational opportunities through the maintenance of habitats [51].
While water is renewable, it cannot be substituted, it is a finite resource. Mukheibir and
Sparks [34] emphasised that, water is an integral part of the ecosystem, a natural resource
of social and economic good whose quantity and quality determine the nature of its ap-
plication. The results from the collected studies indicated that industrial, agricultural and
urban use had the most impact on water resources, both in terms of quality and quantity.
4.1. Water Quantity
According to DEAT [41], the country was covered by almost 10.46% cultivation, 1.51%
urban land use and 1.41 forestry by 2002. Land cover assessment from 1995-2005 shows that
forest plantation, urban and mining increased by 1.1% collectively, and Schoeman et al. [93]
showed a decline in cultivated land from 12.4% to 11.9% (see Table 2).
Table 2. Long term changes in the 3 major land use cover from 1990 to 2018.
Land-Cover Category 1990 (%) [94] 1994/1995 (%) [93,95] 2000 (%) [41] 2005 (%) [93] 2013/14 (%) [95] 2017/18 (%) [96]
Cultivated areas 11.1 12.4 10.5 11.9 11.2 11.0
Forest plantations 1.5 1.5 1.4 1.6 1.5 1.7
Total Agriculture use 12.6 13.9 11.9 13.5 12.7 12.7
Mines 0.2 0.1 0.2 0.2 0.3 0.2
Urban areas 2.2 1.1 1.5 2 2.3 2.8
Total Land use 15 15.1 13.6 15.7 15.3 15.7
The bold indicates the total land use for each category which is the data used.Sustainability 2021, 13, 701 12 of 32
Furthermore, Figure 7 presents the annual abstraction of freshwater by the above-
mentioned land uses. Freshwater abstraction for industrial use for 1995 coincides with the
decrease in land use cover but generally, there is an increasing trend in both industrial use
and water withdrawal. Both agricultural use and freshwater withdrawals show a long-term
decreasing trend from 1990 to 2017, which is the opposite of agricultural use. However,
it should be noted that agriculture remains the highest water user, as it has been reported
that approximately 62% of South Africa’s water resources are reserved for agricultural
purposes [30]. For urban use, freshwater withdrawal was high in most of the years when
urban use was low. However, the latter also showed long-term increasing trends in water
withdrawal and urban growth from 1990 to 2017, and water withdrawal depicted a steady
increasing trend compared to the land use at self.
In terms of water requirements, Figure 7 further shows that agricultural activities
consume more freshwater. Followed by urban/domestic cover, according to DWAF [42],
this sector consumes about 27% of the country’s water resources. As for industrial use,
Figure 7 shows that Industrial cover consumes the least amount of water out of the three
land uses, though, it shows a growing trend. It should also be noted that 2014–2016 was
a drought year in South Africa [97], thus the decreasing trend in some of the land use cover,
especially the ones that are highly dependent on water, such as agriculture.
Figure 7. Long-term freshwater withdrawal by major land-users from 1990 to 2014, (a) Annual freshwater withdrawal for
industrial use; (b) Annual freshwater withdrawal for agricultural use; (c) Annual freshwater withdrawal for urban use
(Data source: FAO-Aquastat, World bank [98]).Sustainability 2021, 13, 701 13 of 32
4.2. Water Quality
As shown by precious articles, the above-mentioned LU/LCs also have impacts on
the quality of water resources through the alteration of hydrological responses such as
runoff, evaporation, and infiltration as already covered in the previous section. The results
from previous publications indicated sediment load, salinity, excessive nutrients, high con-
centrations of metals, and high levels of chloride and fluoride as some of the major water
quality problems. Figure 8 shows the general electrical conductivity (EC) of groundwater
in the entire country. According to DWAF [99], the minimum required standards for EC
are between 70–150 mS/m and the target range is 0–70 mS/m. Conrad [100] added that EC
above 370 mS/m is considered poor and completely unacceptable. High amounts of EC
were observed in most parts of the country (Figure 8), however, it should be noted that
groundwater naturally contains small amounts of dissolved gases and TDS, therefore, it is
hardly pure.
Figure 8. Groundwater quality in South Africa (Source: [WRC [72]]).
The North-western part of the country reported low-quality conditions resulting from
low annual recharge [32,37], as depicted in Figure 8, High levels of EC are observed in the
western part of the country. Comparing Figures 6 and 8, the high levels of EC correspond
with the areas having the highest evaporation rates. It was mentioned that high recharge
rate promotes high groundwater quality by diluting the water, as such, climate change
could have adverse impacts on groundwater recharge due to its variability with rainfall in
South Africa [100].
Figure 9 shows the most stressed quaternary catchments in WMAs, out of the 9 WMAs,
most of the stressed catchments are within 6 WMAs, namely Breede-Gouritz, Berg-Olifant,
Mzimvubu-Tshitsikama, Phongola-Umzikhulu, Inkomati-usuthu, Olifant and Limpopo
WMA. Through the River Health Programme, a few rivers have already been assessed,
among these, is the Berg River, Vaal River, Orange River, Umgeni River, Luvuvhu River,
Sabie River, Sand River, and Olifants Rivers [41]. The assessed rivers were all in fair to good
conditions in the upper tributaries while the lower reaches had fair to poor conditions,
especially those catchments in highly urbanised areas such as Gauteng [41,101]. According
to Driver et al. [90], 57% of the country’s river types are under threat, 25% were found to be
in critical danger, 19% are endangered and 13% vulnerable. The Crocodile River, Inkomati
River basin, and the Vaal River were some of the rivers found to be water-stressed due to
increasing demand from different water users, namely, emerging farmers and domestic
use [4,102,103].Sustainability 2021, 13, 701 14 of 32
Figure 9. The country’s most stressed catchments per WMA (Data source: [WRC [72]).
4.3. Possible Solutions for the Major Users
Despite the strategies already in place to limit negative impacts on water resources
and promote sustainable use, the mentioned water users continue to have visible impacts
on water resources, especially surface resources [32,33,53,97]. Some of the outstanding
challenges from the first NWRS in 2004, namely, Water conservation and water demand
management (WCWDM), decentralising water resource management, lack of technical
skills, backlog of infrastructures, stronger regulation of water resources continue to have
visible impacts on water resources. The socio-economic and ecological significance of water
has already been stressed to some extent by previous studies [73,104]. Thus, there is need
to change the way water is currently being managed to ensure water availability for future
generations [23].
4.3.1. Low-Cost Technologies
In 2009, it was indicated that the country treats about 54% of its municipal wastewater
and the existing infrastructure requires extensive investment [97]. Poor maintenance of
existing WWTPs is due to lack of expenditure and human capacity especially in poorer,
rural, and peri-urban areas, thus worsening water quality and limiting the government’s
ability to provide basic water services [26,86]. For this reason, the government should
invest more in low-cost technologies, the introduction of WSP to rural and poor-urban
areas can minimise the disposal of poorly treated waste in water resources [26]. Low energy
treatment technologies such as sedimentation, anaerobic treatment, filtration, and con-
struction of artificial wetlands and the recovery of sewage sludge as compost or energy as
suggested by Cullis et al. [105] have the potential to stabilise sludge thus decreasing the
risk of contamination. As part of low cost and safe technology, indigenous plants have
been used in many contemporary studies for the purification of water and to improve
its quality [106,107]. Particularly in rural environments with no reticulated water supply
and relies on run-of-river abstractions or groundwater [106]. For example, scientifically,
it has been discovered that the dicerocaryum eriocarpum plant has the potential to reduce
suspended matter and heavy metals through coagulation and biosorption [108,109]. Edok-
payi et al. [77] showed that mucilaginous leaves of dicerocaryum eriocarpum plant can also
be used to improve the efficiency of removal of Lead (II) ion and improve on quality of
wastewater from stabilisation ponds before discharge into the river.
Furthermore, water users such as industries and mining should ensure that their
wastewater is treated before being disposed back to water sources to minimise the costs of
purifying it. According to Edokpayi et al. [26], pollutants such as heavy metals, nutrients,
radionuclides, pharmaceutical, and personal care not only reduce water supply but canSustainability 2021, 13, 701 15 of 32
increase the cost of purification. Other alternative sources of water such as rainwater
harvesting should be encouraged for urban, rural settlement, industrial, and agricultural
use to reduce the withdrawal of freshwater resources. Masindi and Duncker [25] noted
that the amount of rainfall to be collected is not usually the limit of rainwater harvesting
but rather is the size of the storage that sustainably supply water throughout a period of
little or no rainfall. Ndiritu et al. [110] has shown rainwater harvesting as a reliable source
of water supply to rural communities, particularly when combined with other sources of
water supply.
4.3.2. Amendments of Policies and Programs
Africa is projected to be the fastest urbanisation region during 2020–2050 [111], there-
fore programmes and policies should be in alignment with the current social and en-
vironmental issues. Most programmes and strategies such as the demand mitigation
strategy implemented by DWS are not effective as water demand continues to increase (see
Figure 7) [112]. For example, the Water Conservation and Water Demand Management
(WCWDM) pricing strategy is by far the most important element in ensuring stability in
the water sector [97]. However, owing to the country’s apartheid history and the structural
inequalities, precautions need to be taken when pricing water.
Land reform policies should be integrated with water management legislations to
achieve a holistic approach towards water management and planning. Molobele and
Sinah [28] argued that the management of water in the catchment should be guided
by the existing water resources in that basin. Land planning and land development
should be built around the existing water resources, with more focus on water demand
than water supply. According to Donnenfeld et al. [97], a great number of proposed
solutions are oriented towards increasing the levels of surface water resources through
large infrastructure projects and new dams.
There should be guidelines specifically for each water user or use. “Policy instruments
that are effective and efficient solutions to water quality problems must consider the pollu-
tion impact based on the pollution and the context characteristics” [105]. Understanding
the risk that is associated with the land-use activity is important in supporting investments
that are oriented towards the management of water resources. Van der Merwe-Botha [113]
indicated the importance of valuing water not only as an available resource, but also as
an increasingly scarce resource, for that reason, costs should be inclusive of downstream
quality impacts. The Green drop is a good initiative to monitor and regulate the efficiency
of WWTPs, therefore frequent monitoring should be encouraged, and the report should
be updated more regularly. As reported in a study by Edokpayi et al. [26], the frequent
monitoring program is recommended to most WWTPs. The strict implementation of buffer
zones should also be stressed, according to Norris [114], buffer zones are very effective
against filtering pollutants from runoff water and can improve the quality of water sources
to some extent. Mayer et al. [115] noted that protecting existing buffer zones is less costly
than creating new ones and restoring degraded one, however, the necessity of restoring
degraded buffers has been emphasised in protecting the quality of a catchment.
4.3.3. Public Participation and Capacity Building at All Levels
One of the major challenges contributing to the failure of most WWTPs is the lack of
human capacity, especially in rural areas. In this view, better planning, and investments
towards improving the capacity of responsible personnel is encouraged, especially in poor
rural areas. Muller et al. [32] pointed the need to improve the capacity of local government
to ensure water supply and water efficiency and prevent pollution. The public should
be informed on the issues of water resources despite their background and their level of
education, this will encourage public participation in the management of water resources.
In South Africa, the policy and legal frameworks for community consultation, involvement
and participation are clearly spelt out in the constitution [116]. However, despite the atten-
tion public participation has received, Kahinda and Boroto [36] indicated that the countrySustainability 2021, 13, 701 16 of 32
is yet to have in place a “comprehensive and functional approach to public engagement
at all level of water management area”. In this view, better communication platforms
that will allow communities to ask questions should be encouraged for both officials and
community members, especially in the poorest parts of the country. The importance of
transparency in building public trust was noted in a study by Rodda et al. [31]. Muller
et al. [32] also indicated the need to have effective institutional arrangements when it comes
to developing and managing water resource infrastructure. Land development proposals
must include proposed strategies for water resource planning, and it must be approved by
all relevant departments. For example, with regards to groundwater, DWA [45] stated that
land use planners must take the necessary steps to guarantee that groundwater resources
as well as their recharge mechanism are sustainable and well protected.
5. Conclusions
Land management continues to have adverse impacts on the quality and quantity of
water resources. Land use activities such as urban use, industrial use and agriculture use are
the key drivers affecting catchment and groundwater hydrology in South Africa [4,117,118].
As water quality problems continue to spike due to the disposal of untreated water into
the rivers from acid drainage, industrial effluent, urban/settlements wastewater drainages
and agricultural runoff; more lives are put in danger, especially in poor communities
whose livelihoods are dependent on those water sources [26]. Although the country has
several programs for improved supply, management and protection of water resources [23],
current water challenges such as resource constraints, financial instability, political impacts,
environmental degradation and inequalities between water users inhibit the effectiveness of
those programs and policies in managing and protecting water resources [33]. Considering
that South Africa is still developing, water use can be expected to increase, as depicted
in Figure 7, thus, exacerbating the impacts of LU/LC on water resources. This coupled
with the variability of rainfall and increasing temperatures, makes the country’s water
resources vulnerable and sensitive to changes in land cover and climate. Henceforth,
a review and/or effective implementation of legislation and an introduction of low cost
and safe water treatment technologies at the community level or point of use are some
of the solutions recommended in this study. In addition, alternative sources that increase
access to water such as rainwater harvesting, and strict implementation of the buffer zones
are recommended. From the White Paper on National Water Policy [51], it was stated
that “Planning must be based on the water catchment rather than political borders since
each activity taking place on the land has some effect on water resources”. A new strict
approach that accounts for LU/LC and climate change is needed to ensure the management,
sustainable use, and protection of water resources.
Author Contributions: Conceptualization, M.N., and F.I.M.; methodology, M.N.; formal analysis,
M.N., and F.I.M.; investigation, M.N.; writing—original draft preparation, M.N.; writing—review
and editing, F.I.M. and J.O.O.; supervision, F.I.M., and J.O.O. All authors have read and agreed to the
published version of the manuscript.
Funding: This research received no external funding.
Institutional Review Board Statement: Not applicable.
Informed Consent Statement: Not applicable.
Data Availability Statement: Data available in a publicly accessible repository that does not issue
DOIs. Publicly available datasets were analysed in this study. This data can be found here: [https://
waterresourceswr2012.co.za/resource-centre/ and http://www.fao.org/nr/water/aquastat/data/
query/index.html;jsessionid=34E5F6E7C6727E14389128F54BD6CF6F].
Acknowledgments: The authors also acknowledge the Dean of the School of Environmental Sciences
(University of Venda), J.O. Odiyo for organising the writing workshops that assisted in the reshaping
of this paper.
Conflicts of Interest: The authors declare no conflict of interest.Sustainability 2021, 13, 701 17 of 32
Appendix A. List of the Driest Countries [98,119].
Table A1. Water availability per country.
TOTAL ANNUAL
TOTAL RENEWABLE
TOTAL AREA POP 2017 (X 1000 PRECIPITATION RENEWABLE WATER
COUNTRY POP 2005 WATER RESOURCES PER
(1000 HA) INHABITATS) (MM/YR) RESOURCES PER CAPITA
CAPITA 2017 (M3 /YR)
2005 (M3 /YR)
1. Kuwait 1782 2595 4137 100 8 5
2. Gaza Strip 1376 300 41
3. United Arab Emirates 8360 3051 9400 100 49 16
4. Bahamas 1388 317 395 1300 63 1770
5. Qatar 1161 619 2639 100 86 22
6. Maldives 30 328 436 2000 91 69
7. Saudi Arabia 214,969 24,919 32,938 100 96 73
8. Libyan Arab Jamahiriya 175,954 5659 6375 100 106 109,8
9. Malta 32 396 431 400 130 117
10. Singapore 72 4315 5709 2500 139 105
11. Bahrain 78 739 1493 100 157 78
12. Jordan 8932 5614 9702 100 160 97
13. Yemen 52,797 20,733 28,250 200 198 74
14. Israel 2207 6560 8322 400 250 214
15. Barbados 43 271 286 2100 296 280
16. Oman 30,950 2935 4636 100 340 302
17. Djibouti 2320 712 957 200 420 314
18. Algeria 238,174 32,339 41,318 100 440 282
19. Tunisia 16,361 9937 11,532 300 460 400
20. Saint Kitts And Nevis 26 42 55 2100 560 434
21. Rwanda 2634 8481 12,208 1200 610 1089
22. Cabo Verde 403 473 546 400 630 549Sustainability 2021, 13, 701 18 of 32
Table A1. Cont.
TOTAL ANNUAL
TOTAL RENEWABLE
TOTAL AREA POP 2017 (X 1000 PRECIPITATION RENEWABLE WATER
COUNTRY POP 2005 WATER RESOURCES PER
(1000 HA) INHABITATS) (MM/YR) RESOURCES PER CAPITA
CAPITA 2017 (M3 /YR)
2005 (M3 /YR)
23. Antigua And Barbuda 44 73 102 2400 710 510
24. Egypt 100,145 73,390 97,552 100 790 589
25. Kenya 58,037 32,420 49,700 700 930 618
26. Burkina Faso 27,422 13,393 19,193 700 930 703
27. Morocco 44,655 31,064 35,740 300 930 811
28. Cyprus 925 808 1180 500 970 661
29. South Africa 121,909 45,214 56,717 500 1110 905
30. Denmark 4292 5375 5734 700 1120 1046
31. Lebanon 1045 3708 6082 700 1190 740
32. Czech Rep 7887 10,226 10,618 700 1290 1238
33. Somalia 63,766 10,312 14,743 300 1380 997
34. Malawi 11,848 12,337 18,622 1200 1400 928
35. Pakistan 79,610 157,315 197,016 300 1420 1253
36. Syrian Arab Rep. 18,518 18,223 18,270 300 1440 920
37. Korea, Rep. 10,034 47,951 50,982 1100 1450 1367
38. Eritrea 11,760 4297 5069 400 1470 1443
39. Comoros 186 790 814 1800 1520 1474
40. Zimbabwe 39,076 12,932 16,530 700 1550 1210
41. Poland 31,268 38,551 38,171 600 1600 1585
42. Haiti 2775 8437 10,981 1400 1660 1278
43. Ethiopia 110,430 72,420 104,957 800 1680 1162
44. Lesotho 3036 1800 2233 800 1680 1353
45. India 328,726 1,081,229 1,339,180 1100 1750 1427
46. Belgium 3053 10,340 11,429 800 1770 1601Sustainability 2021, 13, 701 19 of 32
Table A1. Cont.
TOTAL ANNUAL
TOTAL RENEWABLE
TOTAL AREA POP 2017 (X 1000 PRECIPITATION RENEWABLE WATER
COUNTRY POP 2005 WATER RESOURCES PER
(1000 HA) INHABITATS) (MM/YR) RESOURCES PER CAPITA
CAPITA 2017 (M3 /YR)
2005 (M3 /YR)
47. Puerto Rico 887 3898 3663 2100 1820 1938
48. Germany 35,758 82,526 82,114 700 1870 1875
49. Sudan 64,433 34,333 12,576 400 1880 3936
50. Uzbekistan 44,740 26,479 31,911 200 1900 1531
51. Iran, Islamic Rep. 174,515 69,788 81,163 200 1970 1688
52. China 960,001 1,320,892 1,441,131 600 2140 1971
53. Burundi 2783 7068 10,864 1200 2190 1154
54. Mauritius 204 1233 1265 2000 2230 2175
55. Nigeria 92,377 127,117 190,886 1200 2250 1499
56. Dominican Republic 4867 8872 10,767 1400 2370 2183
57. Tanzania 94,730 37,671 57,310 1100 2420 1680
58. United Kingdom 24,361 59,648 66,182 1200 2460 2221
59. Uganda 24,155 26,699 42,863 1200 2470 1402
60. Ghana 23,854 21,377 28,834 1200 2490 1949
61. Tajikistan 14,138 6,298 8,921 500 2540 2456
62. Sri Lanka 6561 19,218 20,877 1700 2600 2529
63. Niger 126,700 12,415 21,447 200 2710 1585
64. Spain 50,594 41,128 46,354 600 2710 2405
65. Bulgaria 11,100 7829 7085 600 2720 3006
66. Moldova, Rep. 3385 4263 4051 600 2730 3029
67. Ukraine 60,355 48,151 44,223 600 2900 3964
68. Iraq 43,505 25,856 38,275 200 2920 2348
69. Togo 5679 5017 7798 1200 2930 1885
70. China, Taiwan Prov. 22,894 2400 2930Sustainability 2021, 13, 701 20 of 32
Table A1. Cont.
TOTAL ANNUAL
TOTAL RENEWABLE
TOTAL AREA POP 2017 (X 1000 PRECIPITATION RENEWABLE WATER
COUNTRY POP 2005 WATER RESOURCES PER
(1000 HA) INHABITATS) (MM/YR) RESOURCES PER CAPITA
CAPITA 2017 (M3 /YR)
2005 (M3 /YR)
71. Trinidad And Tobago 513 1307 1369 1800 2940 2805
72. Turkey 78,535 72,320 80,745 600 2950 2621
73. Macedonia, Fr Yugoslav Rep. 2571 2066 2083 600 3100 3072
74. Italy 30,134 57,346 59,360 800 3340 3223
75. Japan 37,797 127,800 127,484 1700 3360 3373
76. France 54,909 60,434 64,980 900 3370 3247
77. Cuba 10,988 11,328 11,485 1300 3370 3319
78. Korea, Dem. People’s Rep. 12,054 22,776 25,491 1400 3390 3027
79. Armenia 2974 3052 2930 600 3450 2652
80. Jamaica 1099 2676 2890 2100 3510 3744
81. Azerbaijan 8660 8447 9829 400 3580 3529
82. Senegal 19,671 10,339 15,851 700 3810 2459
83. El Salvador 2104 6614 6378 1700 3810 4119
84. Benin 11,476 6918 11,176 1000 3820 2361
85. Mauritania 103,070 2980 4420 100 3830 2579
86. Kyrgyzstan 19,995 5208 6045 400 3950 3907
87. Eswatini 1736 1083 1367 800 4160 3299
88. Mexico 196,438 104,931 129,163 800 4360 3576
89. Côte D’lvoire 32,246 16,897 24,295 1300 4790 3463
90. Chad 128,400 8854 14,900 300 4860 3067
91. Turkmenistan 48,810 4940 5758 200 5000 4302
92. Gambia 1130 1462 2101 800 5470 3808Sustainability 2021, 13, 701 21 of 32
Table A1. Cont.
TOTAL ANNUAL
TOTAL RENEWABLE
TOTAL AREA POP 2017 (X 1000 PRECIPITATION RENEWABLE WATER
COUNTRY POP 2005 WATER RESOURCES PER
(1000 HA) INHABITATS) (MM/YR) RESOURCES PER CAPITA
CAPITA 2017 (M3 /YR)
2005 (M3 /YR)
93. Netherlands 4154 16,227 17,036 800 5610 5342
94. Philippines 30,000 81,408 104,918 2300 5880 4565
95. Belarus 20,760 9852 9468 600 5890 6115
96. Thailand 51,312 63,465 69,038 1600 6460 6353
97. Reunion 767 2100 6520
98. Luxemburg 259 459 584 900 6750 5998
99. Greece 13,196 10,977 11,160 700 6760 6129
100. Botswana 58,173 1795 2292 400 6820 5340
101. Portugal 9223 10,072 10,330 900 6820 7493
102. Kazakhstan 272,490 15,403 18,204 200 7120 5955
103. Lithuania 6529 3422 2890 700 7280 8478
104. Mali 124,019 13,409 18,542 300 7460 6472
105. Switzerland 4129 7164 8476 1500 7470 6312
106. Bangladesh 14,763 149,664 164,670 2700 8090 7451
107. Nepal 14,718 25,725 29,305 1300 8170 7173
108. Guatemala 10,889 12,661 16,914 2700 8790 7562
109. Namibia 82,429 2011 2534 300 8810 15,750
110. Bosnia And Herzegoniva 5121 4186 3507 1000 8960 10,693
111. Slovakia 4903 5407 5448 800 9270 9196
112. Romania 2384 22,280 19,679 600 9510 10,773
113. Austria 8388 8120 8735 1100 9570 8895
114. Zambia 75,261 10,924 17,094 1000 9630 6131
115. Estonia 4534 1308 1310 600 9790 9779
116. United State Of America 983,151 297,043 324,459 700 10,270 9459You can also read