GLOBAL 100 GREENHOUSE GAS PERFORMANCE - NEW PATHWAYS FOR GROWTH AND LEADERSHIP BY DAVID LUBIN, JOHN MOORHEAD AND TIM NIXON - BSD ...
←
→
Page content transcription
If your browser does not render page correctly, please read the page content below
A THOMSON REUTERS FINANCIAL AND RISK WHITE PAPER

GLOBAL 100 GREENHOUSE GAS
PERFORMANCE
NEW PATHWAYS FOR GROWTH AND LEADERSHIP
BY DAVID LUBIN, JOHN MOORHEAD AND TIM NIXON

MAY 2017

A THOMSON REUTERS FINANCIAL AND RISK WHITE PAPER

              CONTENTS
              Introduction........................................................................................................................................................................................... 2
              A Growing Signal from Investors......................................................................................................................................................... 3
              Performance: The Global 100 and our Planet.....................................................................................................................................4
                  State of the Climate 2016 – Climate Change by the Numbers.....................................................................................................5
              What Does Leadership Look Like?.......................................................................................................................................................6
                  Commentary on the Role of the Boards of Directors from the Global 100................................................................................... 7
              How to Become a Leader: The Sustainability Premium.....................................................................................................................8
              Innovation for a Sustainability Premium.............................................................................................................................................9
              Indications of a “Sustainability Premium”..........................................................................................................................................14
                  Correlation between CO2 Change Rate and Total Return to Investors........................................................................................14
                  Correlation between CO2 Change Rate and P/E Ratio.................................................................................................................15
              Conclusion............................................................................................................................................................................................16

The authors would like to acknowledge the important contributions of State Street Global Exchange, KPMG, Baker & McKenzie, CDP, the European
Space Agency, Fordham Law School’s Sustainability Initiative, CECP’s Strategic Investor Initiative and Minnesota Public Radio. Important data and
analytics support was provided by Frank Schilder, Thomson Reuters Research & Development, Adam Baron from Thomson Reuters Content Analytics,
Elena Philipova from Thomson Reuters ESG and Ian van der Vlugt from CDP.

INTRODUCTION
A relatively small number of global companies will make a big                                                               journey, and doing it now will bring maximum benefit over all time
difference in fighting climate change. The greenhouse gas (GHG)                                                             horizons for a business and its stakeholders. Not doing so now risks
emissions from the 100 largest emitting companies of the world1                                                             losing the opportunity altogether and incurring considerable risks as
(including their value chains) account for approximately a quarter of                                                       climate change worsens, sea levels rise and populations are displaced.
global annual emissions.2 At a time when the geopolitical winds are
                                                                                                                            This analysis is not about naming and shaming into action. Many of
shifting on climate change, this report presents a global invitation to
                                                                                                                            the largest emitters have brought badly needed energy, infrastructure,
these top emitters of GHG to become transformative leaders.3
                                                                                                                            housing and food to people throughout the world. This is about
In doing so, they would join the ranks of companies such as Enel, NRG                                                       a closer look at the scale of climate impact of the Global 100 and
and Xcel Energy, who, among others, are executing on strategies to                                                          the progress some have made embracing the new business logic
diversify and decarbonize their business models in heavily carbon-                                                          of decarbonization. It is core to their strategies for financial success
intensive industries. Their plans, begun a decade or more ago, have                                                         and responsible growth on our increasingly fragile and resource-
proven results and provide a pathway to a clean energy future that                                                          constrained planet. It’s also about the urgent need to reduce our
stretches to 2050. Any carbon-intensive business can start on this                                                          warming impact on our atmosphere while there is still time to do so.

1
     his report builds on and supports the Global 100 CalPERS initiative based on the PRI
    T                                                                                                                       and 3) adjusted for double counting of 55% which is equivalent to the total energy companies'
    Montreal Pledge.Only publicly traded companies are included in this analysis; the 100 firms                             emissions of 15.7 Gigatons being double counted.
    listed in this report are part of a larger group of carbon-intensive companies that have an
    extraordinary opportunity to lead on climate and grow their businesses over the long term.                          	This is detailed later in the report, but leadership is primarily about diversifying risk away from
                                                                                                                        3

    These companies primarily come from the fossil fuel energy, utility, infrastructure, consumer                         carbon-intensive business models in a step-by-step, strategic transformation spread out over
    goods, mining, cement, steel, automobile and aviation sectors.                                                        the next 35 years. Less than 10% of the Global 100 is currently demonstrating leadership on
2
    	This is measured against total anthropogenic emissions, including land use of approximately                         transparency and decarbonization.
      52 gigatons CO2e. This number includes direct, indirect and value chain emissions (scopes 1, 2

                                                                                                                    2
A THOMSON REUTERS FINANCIAL AND RISK WHITE PAPER

                                                                                                                                                                          Reuters/Issel Kato

A GROWING SIGNAL FROM INVESTORS
                                                                                                  An investor’s perspective on carbon-intensive business models
The 100 companies4 named in this report have a unique                                             Mark McDivitt, Managing Director, Head of ESG Solutions, State Street
opportunity to lead and keep the world within 2 degrees C of                                      Global Exchange, part of a firm with $28 trillion in assets under custody and
warming. These companies are particularly important because                                       administration and $2.5 trillion in assets under management, offers the following
                                                                                                  observations from an investor perspective on carbon-intensive business models:
the Paris climate treaty is unlikely to provide a viable solution to
climate change without their leadership.5 Non-state actors are                                    • The Paris Agreement, unlike Copenhagen, Kyoto and other COP gatherings,
                                                                                                    drove home the point that the private sector, partnered with individual country
crucially important.                                                                                INDCs, will be the impetus needed to start to limit overall global warming to
                                                                                                    less than 2°C.
And there is growing upside for leadership. Today, investors
and policy makers better understand the climate risk imposed                                      • The global investor community will not be limited to “playing defense” with
                                                                                                    negative screening and divestiture strategies designed to limit exposure to
by individual companies. Increasingly, investors see the value                                      carbon-intensive assets, particularly those not positioned to decarbonize in
creation potential from companies that are transparent on their                                     line with scientific and policy guidance. Right now, many leading owners, asset
emissions and offer product portfolios designed to compete in                                       managers, endowments, insurance companies and hedge funds are “playing
                                                                                                    offense,” investing in innovative leaders in carbon-intensive business sectors
the emerging low-carbon economy. It’s no accident that some of                                      who are delivering sustainable solutions and above-market returns.
the largest investors in the world are part of the authorship of this
                                                                                                  • In addition, there is increasing evidence that investors and managers may
report, as we see in the following observation from State Street                                    be able to outperform their benchmarks by integrating more broad-based
Global Exchange.6                                                                                   environmental, social and governance (ESG) factors, beyond climate, into their
                                                                                                    investment strategy and decision-making process. This growing base of ESG
                                                                                                    integrators has seen a rapid inflow of capital to these strategies in the past two years.
                                                                                                  • The investor community knows that business operations are responsible for
                                                                                                    the vast majority of addressable GHG emissions, and it is these same business
                                                                                                    operators and their owners, among other stakeholders, who will experience
                                                                                                    results of climate change.
                                                                                                  For global financial players of all stripes, it’s time to answer the question ...
                                                                                                  Are you in the game of integrating climate impacts into investment
                                                                                                  strategies or still on the bench?

                                                                                               This report is an urgent invitation. It’s an invitation to leadership on behalf
4
     hese “Global 100” vary and depend on the transparency of the companies. Thomson
    T
                                                                                               of the investors, policy makers, consumers and billions of inhabitants of
    Reuters and CDP have collaborated on this report to bring together the latest data from    our fragile world. It’s an invitation to “play offense” on climate change,
    companies that do report and the latest estimates for those that do not. The finance
                                                                                               as McDivitt says above, by finding the right equilibrium between risk,
    sector was excluded, as there are insufficient estimates on their Scope 3.
	Even if all Intended Nationally Determined Contributions (INDCs) were fully implemented
5                                                                                              opportunity and responsibility to your ecosystem of stakeholders.
  from the COP21 agreement, warming would be about 3 degrees C, according to UNEP.
6
    	State Street was founded in 1792 and is the second-oldest financial institution in the
      U.S. It has approximately $28 trillion in assets under custody and administration and
      $2.5 trillion in assets under management.
BUTHOMSON
    A  NAME REUTERS FINANCIAL AND RISK WHITE PAPER

PERFORMANCE: THE GLOBAL 1007 AND OUR PLANET

As mentioned earlier, the Global 100 emitters matter because they                                  a new norm emerges. Leadership is then expected as part of core
represent a large portion of annual GHG emissions, and they can                                    business strategy.”
immediately influence their marketplaces and policy makers to drive
                                                                                                   Looking at the performance of this group of companies (see appendix
significant but manageable reductions of at least 2% per year in line
                                                                                                   1 for complete list), we see in Figure 1 the top 30 emitters among the
with the latest policy guidance from the scientific community.8 Lance
                                                                                                   largest publicly traded companies of the world, across all scopes. On
Pierce, President of CDP North America, remarks, “It’s important to
                                                                                                   the next page, we have included the “State of the Climate,” with the
remember the catalyzing effect that can occur from leadership at
                                                                                                   latest trends in global climate conditions as the actual measurement
the top of these carbon-intensive industries. With enough momentum
                                                                                                   for our progress on climate change.
from the largest industry players, we can reach a tipping point whereby

Figure 1: Top 30 of Global 100 Emitters of GHG

                                                                                                                                                                 Decoupling
                                                             GHG emissions Tons CO2e Scope 1+2+3          GHG Index*                 Revenues USD                  Index*
                                                                                                            Baseline                                              Baseline
    Source GHG        Company Name                                  2015                    2014           2014 =100          2015                  2014         2014 =100
    CDP               Coal India                               2,014,693,250            1,850,080,574         109        11,903,683,242        11,770,273,584       93
    CDP               PJSC Gazprom                              1,247,624,306           1,264,855,340         99         83,315,971,620        95,924,596,230       88
    CDP               ExxonMobil Corporation                    1,096,498,615           1,145,083,349         96        259,488,000,000       394,105,000,000       69
    CDP               China Petroleum & Chemical Corp           873,898,581             902,075,103           97        310,968,548,490       455,452,559,380       70
    CDP               Rosneft OAO                               835,887,091              833,148,361         100         70,606,500,000        94,816,690,000        74
    CDP               PETROCHINA Company Limited                730,914,625              693,615,195          105        265,767,674,840      367,944,985,540       69
    Thomson Reuters   Rio Tinto Ltd                             663,900,000             628,700,000           106        34,829,000,000       47,664,000,000        69
    CDP               China Shenhua Energy                      643,810,940             728,365,957           88         27,273,938,070        40,789,064,770       76
    Thomson Reuters   Royal Dutch Shell PLC                     641,000,000             686,000,000           93        264,960,000,000       421,105,000,000       67
    CDP               Petróleo Brasileiro SA - Petrobras         629,174,567            634,294,435           99        96,468,000,000        143,657,000,000       68
    Thomson Reuters   Total SA                                  575,800,000             598,400,000           96        143,421,000,000       212,018,000,000       70
    CDP               United Technologies Corporation           530,627,775             530,627,775          100        56,098,000,000        57,900,000,000        97
    CDP               BHP Billiton PLC                          474,376,663             436,331,000           109        30,912,000,000       44,636,000,000        64
    Thomson Reuters   Eni SpA                                    466,131,372            450,838,037           103        73,565,665,012        112,728,482,429      63
    Thomson Reuters   BP PLC                                    457,800,000             461,400,000           99        222,894,000,000       353,568,000,000       64
    CDP               Valero Energy Corporation                 438,076,129             448,800,949           98         87,804,000,000       130,844,000,000       69
    Thomson Reuters   Chevron Corp                              428,000,000             414,000,000           103       129,648,000,000       199,941,000,000       63
    Thomson Reuters   Korea Electric Power Corp                 399,984,300             443,325,000           90         50,178,919,954        52,589,333,882       106
    CDP               Peabody Energy Corporation                397,079,232              433,138,945          92         5,609,200,000         6,792,200,000        90
    CDP               Toyota Motor Corporation                  377,020,000             383,198,000           98        226,863,559,930       248,954,617,590       93
    CDP               YTL Corp                                  372,995,902              393,967,914          95          4,441,845,410        6,003,908,864        78
    Thomson Reuters   General Motors Co                         359,381,663             333,986,186           108       152,356,000,000       155,929,000,000        91
    CDP               Phillips 66                                331,341,051            323,169,655           103        98,975,000,000       161,212,000,000       60
    CDP               Volkswagen AG                             328,330,937             336,875,378           97        236,618,000,000       268,484,000,000       90
    CDP               ENGIE                                      319,709,310            350,307,803           91         77,526,000,000       99,043,000,000        86
    Thomson Reuters   Statoil ASA                               313,800,000             304,600,000           103        57,900,000,000       96,708,000,000        58
    CDP               Exor S.p.A.                               295,542,540             234,989,334           126       148,086,960,000       145,287,389,400        81
    Thomson Reuters   Glencore PLC                              290,714,000             312,923,000           93        170,497,000,000       221,073,000,000       83
    Thomson Reuters   Honda Motor Co Ltd                        284,160,000             279,007,000           102        129,718,825,515       110,956,535,132      115
    CDP               Marathon Petroleum                        279,703,599              260,251,261          107        72,251,000,000       98,081,000,000        69
                      Global 30                                17,097,976,448       17,096,355,551           100       3,600,946,292,084     4,855,978,636,801      74
                      Global 100                              28,407,556,866        28,453,074,124           100        6,345,922,512,313    7,938,498,561,200      80

* A GHG Index over 100 indicates growing emissions, and a Decoupling Index over 100 indicates revenues increasing faster than emissions.9

7
    S
     ee footnote 82.
8
     his is the guidance from the latest analysis from the IPCC and UNEP gap report.
    T
9
    GHG Index = (GHG emissions 2015/GHG emissions 2014)*100Revenue Index = (Revenues
     2015/ Revenues 2014)*100. Decoupling index = Revenues Index/GHG Index.

                                                                                             4
A THOMSON REUTERS FINANCIAL AND RISK WHITE PAPER

The Global 100 were responsible directly and through their value
chains for 28.4 gigatons CO2e of emissions in 2015 (unadjusted
for double counting). They accounted for about one-fourth of total
annual anthropogenic emissions of 52.2 gigatons CO2e (assuming
55% of Global 100 emissions were double counted, which equals
all Global 100 Energy sector emissions or 15.6 gigatons). Coal
India was the biggest emitter, with over 2 gigatons CO2e (includes
value chain), followed by Gazprom and ExxonMobil, all three major
suppliers of fossil fuels, respectively coal, natural gas and oil.
Total emissions were flat for the Global 100 from 2014 to 2015
(when they should have been decreasing), and revenues decreased
by 20% (26% for the Global 30), largely due to volitility in exchange
rates and energy prices. Some companies stood out by reducing
emissions faster than their revenues grew from 2014 to 2015,
for example, Duke Energy, Ingersoll-Rand Co. Ltd. and BASF. It
is critically important that this data is used to launch a deeper
                                                                                     STATE OF THE CLIMATE 2016
discussion into the latest emissions figures and company plans for                   CLIMATE CHANGE BY THE NUMBERS
decarbonization. The Global 100 companies themselves may have                        An unprecedented third “warmest year on record” globally. Record
more up-to-date information than is currently available through                      Arctic warmth. Live coverage of the latest extreme weather event.
public sources or expert estimate, and their input is welcome.                       There are many ways we observe and experience climate change.
It is difficult to see how these planetary trends change without                     Climate change impacts becomes more real and hit closer to home
leadership from this top group of emitters, even if thousands                        every year. What is the current state of earth’s climate by the numbers?
of smaller companies and millions of households continue to                          16 of 17 warmest years on record globally have occurred since 2000
demonstrate leadership themselves. This long tail of cities,                         1 in 27 million odds that string of hottest years globally since 2000
companies, households and individuals is valiant and important,                      occurred naturally
but we will need leadership in the next five years and beyond across                 1.48 C – global average temperature change from early industrial
the Global 100 to stay within 2 degrees C warming.                                   levels most likely for the whole of 2016 scientificamerican.com/
                                                                                     article/earth-flirts-with-a-1-5-degree-celsius-global-warming-
                                                                                     threshold1/
                                                                                     2016 - unprecedented third consecutive ”warmest year on record”
                                                                                     globally ncdc.noaa.gov/sotc/global/201613
                                                                                     2015 – second straight warmest year on record globally since 1880
                                                                                     2014 – previous warmest year on record globally since 1880
                                                                                     410 ppm – atmospheric CO2 likely to reach unprecedented level in 2017
                                                                                     scripps.ucsd.edu/programs/keelingcurve/wp-content/plugins/sio-
                                                                                     bluemoon/graphs/mlo_one_year.png
                                                                                     22 to 44 cm – IPCC projected sea level rise by 2100
                                                                                     1 trillion tons – cumulative ice loss in Greenland between 2011 and 2014
                                                                                     independent.co.uk/environment/climate-change-global-warming-
                                                                                     greenland-ice-melting-rate-sea-levels-rise-a7147846.html
                                                                                     12% per decade – rate of Arctic Sea ice decline twitter.com/ZLabe/
                                                                                     status/844573790138916865
                                                                                     Contributed by Minnesota Public Radio Chief Meteorologist Paul
                                                                                     Huttner, theguardian.com/environment/climate-consensus-97-per-
                                                                                     cent/2014/aug/21/scientist-in-focus-meteorologist-paul-huttner

                                                                                 Time is simply running out on climate change, and these firms matter
                                                                                 most. As they delay reducing total emissions, they exacerbate the
                                                                                 problem, with more drastic, disruptive and expensive reductions
                                                                                 necessary later to stay within 2 degrees C.10 Unless we start to change
                                                                                 now, as these firms have the unique opportunity to do, we are unlikely
                                                                                 to change enough and in time to matter.
10
     voxeu.org/article/cost-delaying-action-stem-climate-change-meta-analysis

                                                                                 5
A THOMSON REUTERS FINANCIAL AND RISK WHITE PAPER
WHAT DOES LEADERSHIP LOOK LIKE?
It’s very important to note that some of these companies are already baseline for a 2-degree C pathway, and 2.1% for a 1.5-degree
demonstrating leadership. These include companies such as Enel pathway, typically by decoupling growth from emissions. From
and others just outside of Global 100, such as Xcel, Iberdrola and a 2016 baseline, because of the general failure to reduce global
PG&E, all of which are top emitters. emissions from 2010, firms will need to reduce GHG by at least
2% per year to stay within 2 degrees C.13
But what do we mean by leadership? A few basic things:
3. Leaders have the confidence to challenge their organizations
1. Leaders are transparent. Currently over 50% of companies of
with publicly announced long-term GHG goals from the 2020s
the Global 100 report on their emissions from their operations,
out to 2050, even when the solutions are still unknown. This
purchase of energy and value chains.11 Interestingly, this level
typically means setting transparent plans for getting to major
of transparency will be improving dramatically in the next few
milestones within a decade and aspirational goals to drive
years due to improvements in satellite measuring, which will
the reach for longer-term decarbonization. Note that even if a
allow for verification of existing, point source GHG reporting and
company has not been demonstrating past reductions, it can still
new measurement where there is currently no transparency. The
qualify as a “climate leader” by transparently planning on more
European Space Agency has provided Figure 2 for inclusion in
aggressive decarbonization from today forward.
the report, and they are leading this part of the effort. Note the
“Future Mission” section. 4) Leaders are using their influence to encourage leadership from
policy makers and their peers. These top firms have significant
2. Alongside transparency, leaders are also reducing their
influence on regulatory direction in their economies,14 and
emissions in line with IPCC guidance.12 This means reducing
leadership is about promoting manageable decarbonization to
Work
GHG Work
emissionsinatin
progress
progress
least towards
1.4% per year towards
starting from aa2010
a
future
future
anthropogenic
anthropogenic
achieve 2050 goals. CO CO 2 2
Emission
Emission Monitoring
Monitoring Sentinel
Sentinel Constellation
Constellation
Spatial
Figure Spatial
2: Resolution
Resolution
Work in progress andand
towards a future Coverage
Coverage
anthropogenic CO Emission Monitoring 2
Sentinel Constellation Spatial Resolution and Coverage
Future
Future
Mission
Mission
Future Mission OCO-2 GOSAT SCIMACHY
2 x222xkm
km
22km
2 2 2.3 x 1.3 km2 10 km 30 x 60 km2
IMPROVED SPATIAL RESOLUTION AND COVERAGE ENABLES NEW IMPORTANT APPLICATION AREAS: ANTHROPOGENIC C02
Improved
Improved
spatial
spatial
resolution
resolution
and
andcoverage
coverage enables
enables newnew important
important
(AND CH4) EMISSION MEASUREMENTS FROM POINT SOURCES.
application
application
areas:
areas:
anthropogenic
anthropogenicCOCO(and
2 2 (and
CHCH )
4 4 emission
) emission measurements
measurements from
from
point
point
sources
sources
Source: Institute of Environmental Physics, University of Bremen, Germany
Figure:
Figure:
Institute
Institute
of Environmental
of Environmental
Physics,
Physics,
University
University
of Bremen,
of Bremen,
Germany
Germany
11
The Greenhouse Gas Protocol is the most widely used emissions measurement and prior report at thomsonreuters.com/content/dam/openweb/documents/pdf/corporate/
reporting standard. Reports/global-500-greenhouse-gases-performance-trends-2010-2013.pdf page 4).
12
Over 260 firms have publicly committed to Science-Based Targets, a joint initiative of 14
As a policy instrument, an internal carbon price – sometimes referred to as a shadow price –
CDP, UN Global Compact, World Resources Institute and World Wildlife Fund. The initiative bakes the consequences of carbon pollution into a firm’s internal accounting and capital
provides practical guidance and methodologies for target-setting as well as a free quality budgeting processes, helping to incentivize low-carbon investments. There are multiple ways
check service for submitted targets. to design a carbon pricing scheme, but as this executive guide to carbon pricing explains, it
13
And a 3% reduction for CO2 (as previously described in a private sector emissions report) does not need to be complicated. Nearly 80 firms have already committed to carbon pricing
See carbonbrief.org/analysis-four-years-left-one-point-five-carbon-budget and the through the We Mean Business coalition.
6
A THOMSON REUTERS FINANCIAL AND RISK WHITE PAPER

These aspects of leadership are made possible by good governance.
Given the emerging regulatory, reputational and operational risks                                      Commentary from Eccles and Youmans on the role of the boards
                                                                                                       of directors from the Global 100
with carbon-intensive business models, boards of directors from
these companies have a fiduciary duty to these corporations to                                         • Leadership on climate in these carbon giants is about the fiduciary duty
                                                                                                         owed by boards of directors to their corporations and what this means to the
consider these aspects carefully, and investors and stakeholders                                         company’s relationship with its shareholders and other key stakeholders.
generally will applaud and encourage that process. Professors
                                                                                                       • Leadership must begin with the board of directors; otherwise, top
Bob Eccles and Tim Youmans summarize their recent work15 (see                                            executives will be held hostage by short-term shareholders.
text at right) on the fiduciary duty owed by boards of directors to
                                                                                                       • A key way the board can communicate this leadership is to publish an
corporations, which includes considering the material regulatory and                                     annual one-page “Statement of Significant Audiences and Materiality (The
legal risks as atmospheric concentrations of CO2 continue to rise.                                       Statement).”
                                                                                                       • For the Global 100, a Statement is where the board publicly states its
David Hackett, partner at the global law firm Baker & McKenzie,
                                                                                                         position on addressing climate change.
summarizes that “greater marketplace and legal scrutiny lies
                                                                                                       • Such a Statement also specifies which stakeholders are material for the
ahead for major emitters of greenhouse gases, and as the climate                                         corporation and the time frames for assessing progress.
leaders accelerate their emission reduction efforts, others will
                                                                                                       • In publishing and acting on a Statement, boards of carbon-intensive
find their positions increasingly untenable accompanied by the                                           emitters can provide critical leadership on mitigating emerging regulatory,
growing potential for expanded risk and liability. Charged with                                          reputational and operational risks.
the responsibility for assessing material risk, corporate boards of
directors will find this duty more demanding and significant in light
of the emerging trends and risks associated with climate change
considerations.”

15
      or more on the statement, see Eccles’ and Youmans’ survey of the fiduciary duty owed by
     F
     boards of directors to corporations, to shareholders and to other stakeholders: Materiality
     in Corporate Governance: The Statement of Significant Audiences and Materiality –
     Journal of Applied Corporate Finance. Also: The Board That Embraced Stakeholders
     Beyond Shareholders – MIT Sloan Management Review, Why Boards Must Look Beyond
     Shareholders – MIT Sloan Management Review, Why It’s Time For Boards To Take A Stand
     On Sustainability – Forbes.com

                                                                                                   7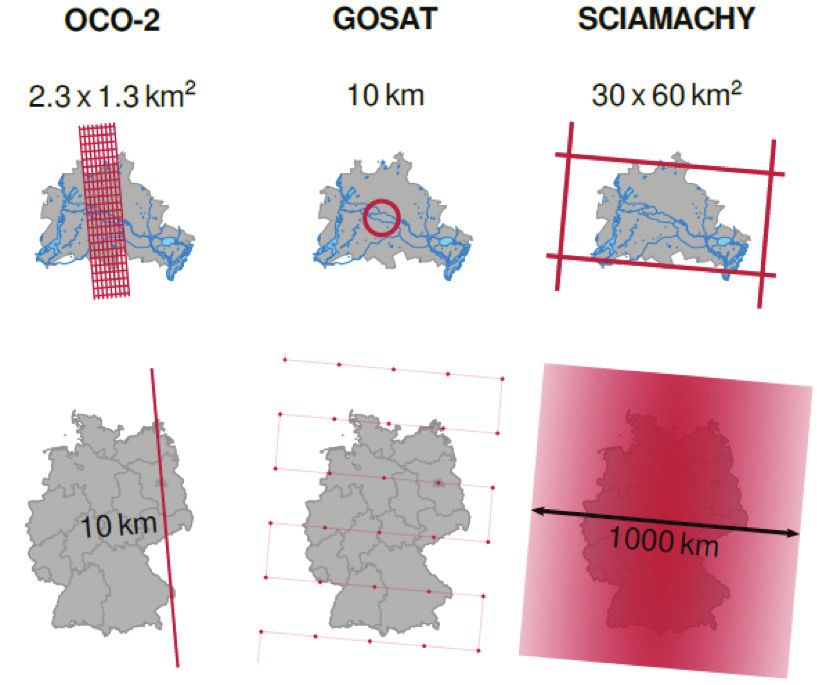
A THOMSON REUTERS FINANCIAL AND RISK WHITE PAPER

HOW TO BECOME A LEADER: THE SUSTAINABILITY PREMIUM
Few climate leaders have achieved their position by “bet the                                      Xcel Energy’s energy mix and are seen as “a cost-effective hedge
company” radical transformations. Instead, with a new appreciation                                against more volatile fuel prices.” Xcel Energy has begun to focus on
of how increasing constraints posed by climate impacts drive deep                                 capturing efficiency gains for itself and its customers by rolling out
and persistent change in customer needs and wants, they build their                               energy-saving programs that have the added benefit of enabling
case for change and mobilize their organizations. Climate leaders                                 better demand management. The capacity and economics of
develop a new value creation vision and a business case for evolving                              renewable initiatives is being actively tested.
their company’s capabilities over time. This vision propels progress
                                                                                                  Stage 2: Doing New Things in New Ways
on a decade-long pathway or maturity curve that closely resembles
                                                                                                  Now with greater confidence, companies begin to evolve their
the stages described below.
                                                                                                  operations and products, proving the market for innovations that
As an example, let’s follow Xcel Energy’s journey. In 2004, the                                   meet customer needs while simultaneously delivering benefits on
company issued its first carbon management plan. Then, in 2005,                                   the climate challenge. As new models are proven, change in
Richard Kelly was appointed Chairman and CEO, and the company                                     products, processes and whole systems becomes widespread.
issued its first Triple Bottom Line Report stating that “comprehensive
                                                                                                  Continuing the example,18 in 2010, Xcel Energy reported expanded
action is needed to address climate change today, including greatly
                                                                                                  energy efficiency programs saving customers 987 GWh of power.
increasing our use of resources that produce lower or no CO2 emissions,
                                                                                                  Overall efforts to implement Xcel Energy’s clean energy vision
increasing our energy conservation opportunities for customers, and
                                                                                                  reduced CO2 emissions from 2005 by 10%, with a 2020 goal set at a
participating in research and development on carbon sequestration …
                                                                                                  20% reduction. Xcel Energy‘s Solar*Rewards® program to encourage
regardless of regulation our company is implementing voluntary carbon
                                                                                                  solar usage grew from 300 customers in 2006 to 7300 in 2010, and
management targets ...”16 This story continues below, explained in a
                                                                                                  Xcel Energy became a founding member of the Solar Technology
four-stage framework applicable to all carbon-intensive companies.17
                                                                                                  Acceleration Center to build and share knowledge.
Stage 1: Doing Old Things in New Ways
                                                                                                  Stage 3: Transforming the Core
First, companies capture early wins from operational improvements
                                                                                                  As vision becomes reality, eco-advantaged innovations drive durable
that typically reduce costs, as well as regulatory, financial and
                                                                                                  and material sources of new revenues and profits. Often the growth
reputational risks. Emissions reduction is a by-product of improved
                                                                                                  of these new eco-advantaged portfolios far exceeds the rate of
operational efficiency and risk management. Continuing the example
                                                                                                  overall revenue growth. Old business lines give way to the new.
with Xcel Energy, in 2005, renewables account for about 9% of

16
      x celenergy.com/staticfiles/xe/Corporate/Corporate%20PDFs/2005_Xcel_Energy_               18
                                                                                                      ral.ucar.edu/solutions/bringing-the-wind-to-the-grid
       Triple_Bottom_Line.pdf
17
     Adapted from The Sustainability Imperative, David A Lubin and Daniel C Esty. Harvard
      Business Review, May, 2010.

                                                                                             8
A THOMSON REUTERS FINANCIAL AND RISK WHITE PAPER

Continuing our example,19 Xcel Energy maintained its commitment                                      INNOVATION FOR A SUSTAINABILITY PREMIUM
to clean energy through a leadership change in 2011 to its new CEO                                   Climbing this sustainable value curve requires innovation. The GHG-
and chairman, Ben Fowke. By 2015, Xcel Energy was recognized                                         intensive industry sectors profiled below are significant contributors
by the EPA as a climate leader. Emissions have declined 24% from                                     to global emissions.
2005 levels, well ahead of targets, and the company produces 34%
of its total energy from renewables with a goal of 43% by 2020. Xcel                                 Carbon dioxide (CO2) accounts for 76% of GHG emissions (65% from
Energy introduced Renewable* Connect® in Minnesota and Colorado,                                     fossil fuels and industrial processes, 11% from forestry and other land
a new way for consumers to set the dial on purchasing renewable                                      use).22 Of the fossil fuels, coal is responsible for the most (24.8%)
energy for home or business all the way up to 100%.                                                  GHG emissions, followed by oil (20%) and natural gas (18.5%) for a
                                                                                                     total of 63.3%.23 In other words, ending the use of fossil fuels would
Stage 4: New Business Model Creation and Differentiation                                             constitute a nearly 2/3 direct decrease in GHG emissions. However,
At the top of the curve, firms fully exploit the climate and                                         fossil fuels power and have powered the world economy since
environment megatrend as a source of differentiation in business                                     the industrial revolution. The challenge is how to decarbonize the
model, brand, employee engagement and other intangibles,                                             economy to achieve the low-carbon and ultimately net-zero status in
fundamentally repositioning the company and redefining its strategy                                  the time needed to minimize climate impacts, ranging from serious
for competitive advantage.                                                                           disruptions to potential catastrophe.
Finishing the example, Xcel Energy’s 2017 investor presentation20                                    For this innovation has a critical role to play in the fossil fuel
opened with an assertion that its business strategy enables earnings                                 producing industries as well as the carbon-intensive sectors. In each,
growth without bill increases to its customers, resulting from key                                   leaders have the potential to create their own sustainability premium
factors including reduced fuel, operating and maintenance costs                                      as they gain market share and increase their productivity with
from its renewables-heavy portfolio. Xcel Energy positions its brand                                 innovative solutions for a low-carbon future. These sector competitors
with investors, consumers and employees as the leading clean energy                                  are moving across a broad base of technologies and approaches.
provider, with a goal to add another 4000 MW from wind and solar                                     Making good strategic choices can be expected to pay big dividends
by 2021, pushing its CO2 reductions to 45% below 2005 by that year.                                  as the constraints of climate change tighten. Let’s take a closer look
Xcel Energy has climbed the maturity curve, and in prior three- and                                  at existing and future pathways and see what is happening in some
five-year comparisons has produced total returns that significantly                                  key sectors.
outperform their EEI Index peer group.21
                                                                                                     The industries mentioned below are reviewed in terms of the
How to Become a Leader Summary                                                                       decarbonization pathways they will likely follow (to stay within
The pathway to the top is not an easy climb. It takes years, and in                                  2 degrees C warming) and some of the innovations, whether
many cases a decade or more, of hard work. Not all firms have the                                    technological or in terms of business models, likely to get them there.
scope of vision to see the opportunity. For some, it may not exist
without radical transformation. Others may start strong but stop                                     Fossil Fuel Energy
along the way as management changes shift priorities. Some CEOs                                      • Natural Gas – While natural gas is the least carbon-intensive
prefer to wait to see if the demand is real.                                                           of the fossil fuels and provides a current economically viable
                                                                                                       alternative to more carbon-intensive fuels, deep decarbonization24
For such companies the risks are great. Catching up may be hard or                                     requires natural gas to be progressively replaced by hydrogen25,
impossible – think of digital photography and Kodak. And even among                                    bio natural gas26, treated bio gas27 and Bio-SNG.28 All these
those that see the opportunity, not all can build the capacity to execute                              natural gas substitutes can be produced locally using waste
successfully – remember BP’s initial effort to get ”Beyond Petroleum”?                                 and natural sources for both transport and heating purposes.
Companies at the top of the curve are delivering a Sustainability                                      Bio-SNG is produced by gasification of cellulosic materials (e.g.,
Premium to their shareholders. Firms not yet there, but maintaining                                    forestry residues, energy crops), whereas “biogas” is produced by
strong momentum as they climb the curve, have a significant                                            a biological process – anaerobic digestion of organic materials
sustainability premium potential. Understanding how to spot                                            (e.g., manure, organic waste).29 Taking these technologies to scale
companies as they are rising may be an important insight for                                           remains a significant challenge. Companies such as Gazprom can
investors seeking an opportunity to outperform.                                                        play a key role in this progressive substitution.30

19
     perrytonwind.com/quote_of_the_day_ben_fowke_xcel_energy_ceo                                   26
                                                                                                         e on.com/en/business-areas/renewable-energy-source/bio-energy/bio-natural-gas/
20
     Xcel Energy Morgan Stanley Investor Presentation Mar. 2, 2017, Xcel Doc No. 1001220683              from-biogas-to-bio-natural-gas.html
21
     Ibid.
                                                                                                    27
                                                                                                         environbusiness.com/eeae/biogas
22
     epa.gov/ghgemissions/global-greenhouse-gas-emissions-data
                                                                                                    28
                                                                                                         biofuelstp.eu/bio-sng.html
23
      e cofys.com/files/files/world-ghg-emission-flow-chart-2012_v9-c-asn-ecofys-2016_02.pdf
                                                                                                    29
                                                                                                         Ibid.
24
       project-syndicate.org/commentary/paris-climate-talks-deep-decarbonization-by-
                                                                                                    30
                                                                                                          dsmbiogas.com/en-us/News/Gazprom-to-Prepare-Investment-Plan-for-Producing-
        jeffrey-d-sachs-et-al-2015-12                                                                      Exporting-Green-Gas-Russia
25
     ukerc.ac.uk/network/network-news/guest-blog-decarbonising-heat-by-replacing-
      natural-gas-with-hydrogen.html

                                                                                                9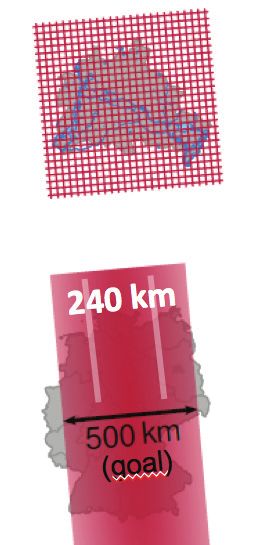
A THOMSON REUTERS FINANCIAL AND RISK WHITE PAPER
• Oil and Gas – The most viable innovation pathway for oil and Transport
gas is business model transformation and diversification. This is • Aviation – Current projections estimate that airlines will purchase
exemplified by Total with their Renewable Energy & Infrastructure31 approximately 39,000 new aircraft valued at $5.9T between 2016
program (solar and battery/storage), and Statoil (offshore wind).32 and 2035.37 Similarly, the 3.4B passengers and 34.5M tonnes of
Another pathway is the progressive switch to natural gas away freight airlines carry annually will grow at 4.6% per year during
from oil, for example at Eni.33 Making fossil fuel extraction less this period.38
carbon-intensive by reductions in methane emissions and gas
The aviation pathway to a low-carbon future took a major step
flaring and electrically powered platforms also has a material role
forward with the introduction of the Boeing Dreamliner, a carbon
to play. However, oil in a deep decarbonization model requires
fiber aircraft with a new generation of super-efficient engines,
progressive substitution by renewable alternative fuels, such
together reducing fuel consumption by approximately 20-30%.
as biodiesel, bio alcohol (methanol, ethanol, butanol), refuse-
The success of the Dreamliner, which recently became Boeing’s
derived fuel, chemically stored electricity (batteries and fuel cells),
top-selling wide-body jet,39 has inspired other R & D efforts that
hydrogen, non-fossil methane, non-fossil natural gas, vegetable oil,
will drive gains across the emerging super-efficient fleet.40
propane and other biomass sources.34
Another area ripe for innovation that will result in fuel savings
and reduced GHGs is flight management systems. Big data analytic
tools and services are now being sold from vendors such as Rolls
Royce and Honeywell to optimize how aircraft are flown, from takeoff
to landing. Predictive analytics are optimizing fuel efficiency and the
emissions reductions from climb to cruise to descent and taxiing.
While currently yielding only 2-3% gains,41 that’s off a very big base.
The shift to biofuels is the third leg in the aviation pathway. The
Commercial Aviation Alternative Fuels Initiative (CAAFI), formed in
2006 with more than 400 members, is well on its way to meeting
the goal of 1 billion gallons of biofuel in use by 2018, yielding a
30-80% GHG reduction over conventional jet aviation fuel (over 67
billion gallons of aviation jet fuel were consumed in 2013).42 These
innovations hold the potential for net neutral growth in emissions
from commercial aircraft in the 2020s. Ultimately, if we fully
progress on the biofuels pathway, CO2 emissions can be reduced
to 0.2GT by 2050, (50% of the 2005 levels) as opposed to 2.1 GT
projected in the business-as-usual case.43
• Coal – Increasing regulatory scrutiny, unsolved technological Finally, electric-powered flight is the biggest leap into the low-
challenges and growing pressure from lower-cost alternatives, carbon aviation future, and both Airbus and Boeing are in. Zunum
have largely closed the pathways for lower-emission coal- Aero, the three-year-old electric commercial airplane startup
fired energy.35 Even best practice supercritical (SC) and ultra- now partnered with Boeing and Jet Blue, hopes to dominate the
supercritical (USC) coal-fired power plants that produce 35% regional travel market in the 2030s with 10- to 50-passenger
fewer emissions than conventional coal plants still produce ultra-efficient hybrid electric craft now in development.44 Airbus,
more emissions per KWh than natural gas,36 thus attracting too, is serious enough about electric flight to put the E-Fan (electric
more regulatory scrutiny than the alternatives. Carbon Capture powered jet engine) into production as a pilot-training aircraft. It
and Storage (CCS) is an important innovation that can reduce will go on sale towards the end of 2017, to be followed by a four-
emissions by 90%, but this makes coal significantly more expensive seat version.45 The battery versus fuel weight trade-off appears to
in an environment of steadily decreasing costs from renewables be workable, especially for the short-haul regional travel market.
and alternatives.
31
CDP In the Pipeline by Tarek Soliman, Luke Fletcher and Charles Fruitiere – November 38
airbus.com/company/market/forecast/
2016 – Which oil and gas companies are preparing for the future? 39
izjournals.com/wichita/news/2017/02/24/boeings-787-dreamliner-hits-an-order-
b
32
Ibid. book.html
33
Ibid. 40
Build Something Cleaner, Boeing Environmental Report, 2015_environment_report.pdf
34
en.wikipedia.org/wiki/Alternative_fuel 41
Going Beyond Fuel Management to Holistic Fuel Efficiency Service Solutions. Aviation Week
35
Subsidized coal (due to lack of meaningful carbon pricing globally) is undoing much of Network, Nov 30, 2015
the work being done to decarbonize the economy wri.org/publication/global-coal-risk- 42
According to indexmundi.com/energy/?product=jet-fuel, at least 5,000,000 barrels of jet
assessment fuel were consumed per day in 2013 X 365 days X 36 gallons/barrel = 65.7 Bio gallons/year
36
glencore.com/assets/sustainability/doc/GLEN-Sustainable-Development- 43
c aafi.org/resources/pdf/Government_Partners_Activities_Update_Panel.pdf
Presentation-20160613.pdf 44
fortune.com/2017/04/05/zunum-aero-boeing-jetblue-electric-planes/
37
boeing.com/resources/boeingdotcom/commercial/about-our-market/assets/ 45
economist.com/news/science-and-technology/21664944-using-electric-and-hybrid-
downloads/cmo_print_2016_final_updated.pdf
forms-propulsion-very-different-looking-aircraft
10A THOMSON REUTERS FINANCIAL AND RISK WHITE PAPER
These advances hold great promise for increasing the Mining
interconnectedness of the world’s people, itself an important Mining is highly energy-intensive as it goes deeper in more remote
stabilizing force, while reducing the burden on our atmosphere. locations for poorer grade ores that require more processing and
transportation. Mined thermal coal (for electricity generation) and
• Automobiles – Automobile manufacturers’ biggest impact
coking coal (for steel production) are the most carbon-intensive due
on climate change is through the cars they sell, as 79% of
to their combustion. Others, such as iron ore (for steel), bauxite (for
manufacturers’ emissions comes from fleet emissions.46 Renault,
aluminum) and limestone, are carbon-intensive due to the energy
Nissan, BMW, Toyota and specialists like Tesla are leading the
intensity of their processing and, in the case of cement, additional
way in decarbonizing fleet emissions by increasingly selling cars
release of CO2 during production. Mining companies have, with
that are battery electric vehicles (BEVs), plug-in hybrid electric
few exceptions, opposed low-carbon regulations, and none have
vehicles (PHEVs) and fuel cell vehicles (FCVs) rather than internal
both absolute and intensity emission targets.55 Their emissions are
combustion engines (ICE).47 From a resource use perspective, ICE
generally increasing when they should be decreasing.
cars are highly inefficient, with only 14% of energy reaching the
wheels.48 Part of the answer lies in renewables (solar and wind) powering
mining, as is the case, particularly, in remote locations in India, Africa
Beyond repowering, the industry is ripe for business model
and Chile, with the surplus electricity being sold locally.56 Coal mining
innovation, as ride-sharing businesses have demonstrated. Cars
will be increasingly unviable due to cost, regulatory change and
are not used most of the time (a car is parked 96% of its lifetime).49
competition from renewable energy sources for electricity generation
New car-sharing business models mean that 4 to 1050 and even
(e.g., solar) and steel manufacture (e.g., hydrogen). This will only
up to 15 cars could be replaced by one shared car.51 Other usage
happen if developing countries also make the leap to renewables
patterns can also have huge impacts, with a factor of 9.3 reduction
rather than build coal-fired plants that damage health and cause
in energy consumed by commuting one time per week versus the
the climate change that is expected to affect them most. The
typical five times per week.52 Similarly, switching from cars to rapid
transformation of existing coal mines to components of a renewable
transit buses can reduce emissions by a factor of five.53
energy infrastructure can be made complete by converting them,
Pricing parking according to market forces and maximum for example, to geothermal power sources57 or as giant batteries for
limits (The Shard in London has 48 parking places for its 96 renewable energy storage.58
storeys) instead of being free or subsidized can bring significant
Cement
economic benefits (€190 million for Amsterdam in revenues
Cement manufacturing is highly carbon-intensive, estimated to be
alone), encourage car sharing and public transport use, and stop
3.8% of global emissions.59 Beginning as early as 2002, the Cement
subsidizing those that drive to work alone (76% of Americans in
Sustainability Initiative (CSI) started the search for solutions to the
2014).54 Even Apple’s new 318,000-square-meter HQ, planned to
GHG challenge posed by and potentially imposed on the cement
be one of the most resource-efficient buildings in the world, still
industry. With 23 major cement companies operating in 100 countries
must allocate 325,000 square meters to parking, due in large part
producing approximately 30% of global volume, these firms are
to limited mass transit options.
committed to keeping cement a viable product well into the 21st
As more and more demand comes from the developing world’s century. Through the work of the CSI, companies are reducing GHGs
booming middle class, cars will need to be much cleaner, shared, and other toxins in their value chain. From 1990 to 2010, cement
and ultimately smart and driverless, which means safer and production grew globally by 61% while GHG emissions increased by
healthier for all, with less congestion and air pollution. There 39%, showing evidence of meaningful reductions in intensity.
is great potential on the automobile pathway if we continue
Still, getting on a 2-degree pathway requires aggressively decreasing
developing low-impact products and strategies.
absolute emissions from current levels. For this scenario to occur, the
cement industry will need to step up its use of low GHG materials and
kiln operators will need to shift to cleaner sources of energy.
46
mission impossible: Which car makers are driving into trouble? Chloe Chan, Pedro
E 53
ricities.org/
w
Carqueija and James Magness, CDP, March 2016 54
Briefing: Parking, The Economist, April 17th, 2017
47
Ibid. 55
Making the grade: Are some miners chasing fool’s Gold? CDP, November 2015
48
Reinventing Fire: Bold Business Solutions for the New Energy Era, Amory B. Lovins and the 56
wbcsdcement.org/index.php/key-issues/climate-protection/sectoral-market-
Rocky Mountain Institute mechanisms/modeling-results-sectoral-approach?id=116
49
Ibid. 57
c leantechnica.com/2012/05/03/mining-old-coal-mines-for-instant-geothermal-
50
MOMO (2010). The state of European car-sharing. Final Report D 2.4 Work Package energy/
2.MOSES (2005). Mobility Services for Urban Sustainability. Moses deliverable 6.2. 58
independent.co.uk/news/world/europe/germany-coal-mine-convert-renewable-
51
The future of driving: Seeing the back of the car, The Economist battery-hydroelectric-prosper-haniel-north-rhine-westphalia-a7648841.html
52
cta.tech/CTA/media/policyImages/Telecommuting-e-Commerce-Study.pdf analysis of 59
epa.gov/ghgemissions/global-greenhouse-gas-emissions-data#Sector
page 33 table
11A THOMSON REUTERS FINANCIAL AND RISK WHITE PAPER
Given the demand projections for cement in the rapidly urbanizing almost all the process emissions of steelmaking. It is aiming for
global economy, absolute increases are expected through the a working demonstration plant around 2025, with potential for
2020s. However, if the potential of these advances are adopted by commercialization envisaged a further one to two decades later.
2030, absolute emissions could be approximately 2110 MT of CO2, • Thyssenkrupp’s intensity is the lowest of companies focused on
down from their expected peak in the 2020s and back near to levels the blast furnace steelmaking route – only Hyundai Steel and
reported in 2010.60 SSAB with significant electric arc furnace operations have lower
Additionally, developers also may diversify and switch to more emissions intensities. Thyssenkrupp is pursuing a CCU project,
sustainable building materials (such as bamboo, lumber and Carbon2Chems, seeking to create usable chemicals from CO and
dimension stone)61 combined with modular construction (67% less CO2 waste gases from steelmaking.
energy in construction, 80% less energy consumed during use, 100 % Given the required 70% reduction in GHG required for the steel
recyclable)62 to manage a more sustainable overall demand for cement. sector to stay within 2 degrees C by 2050,65 and the early stages
Steel of decarbonization technologies, much more needs to happen,
With global steel demand, emissions and energy intensity increasing in especially by preserving steel, which can be endlessly recycled.
recent years, emerging technologies have still to prove their potential.63 In addition to substitution by carbon fiber (e.g., in aviation and
Combined with a highly competitive and recently oversupplied automobiles), polymers, wood, alloys, etc., steel can be produced as
market, three steel manufacturers stand out as leading in technology high-strength steel, which is 25-40% lighter with the consequent
investment needed for a sustainable future: POSCO, SSAB and drops in energy use and emissions produced.66
Thyssenkrupp. Following is an extract from CDP’s report on Steel:64 Finished products with high steel content (e.g., cars), can be designed
• POSCO’s FINEX technology provides incremental emissions for much longer life-spans and shared (e.g., five 2,000-cycle washing
reductions from steelmaking by eliminating sintering and coke oven machines can be replaced by one 10,000-cycle washing machine).67
processes that can be combined with Carbon Capture and Storage Over 50% of steel is used in long-life buildings and infrastructure,
CCS. POSCO is in the early stages of hydrogen-based steelmaking. trains and ships. With flexible building design, the life of buildings
can be extended to 200 years and automobiles to 300,000 miles.68
• SSAB emissions intensity is low, driven by significant electric
Maersk is using the design phase of its container ships (that are made
arc furnace (EAF) operations and Europe-based blast furnace-
up of 98% steel) to improve their recovery and recyclability through
basic oxygen furnace (BF-BOF) plants, that it states benchmark
its cradle-to-cradle passport program; existing ships can also benefit
as among the most carbon efficient globally. It recently
from such documentation for up to 70% of their materials.69 Finally
announced a long-term breakthrough emissions reduction
recycling of steel reduces energy use by 70%, and each 1 ton of steel
project, HYBRIT, working toward a hydrogen-based steelmaking
recycled avoids extraction of 1.4 tons of iron ore, burning 720 kg of
process using renewable energy that envisages elimination of
coal and 120 kg of limestone.70
60
bcsdcement.org/index.php/key-issues/climate-protection/sectoral-market-
w 65
Ibid.
mechanisms/modeling-results-sectoral-approach?id=116 66
circulareconomy-worldsteel.org/
61
sustainabilityworkshop.autodesk.com/buildings/green-building-materials; 67
ellenmacarthurfoundation.org/circular-economy/interactive-diagram/in-depth-
en.wikipedia.org/wiki/Green_building washing-machines
62
constructionglobal.com/majorprojects/492/3-reasons-why-modular-construction-is- 68
lcmp.eng.cam.ac.uk/wp-content/uploads/allwood-and-cullen-r09-davos.pdf
more-sustainable-than-traditional-methodology 69
ellenmacarthurfoundation.org/case-studies/using-product-passports-to-improve-the-
63
Nerves of Steel: Who’s ready to get tough on emissions? Drew Fryer, Chloe Chan and Tom recovery-and-reuse-of-shipping-steel
Crocker, CDP, October 2016 70
c irculareconomy-worldsteel.org/
64
Ibid.
12A THOMSON REUTERS FINANCIAL AND RISK WHITE PAPER
Buildings Innovation Summary
Globally, buildings account for nearly 16% of the total GHG emissions Of course, these are just examples of what is driving decarbonization
and consume approximately 40% of electricity production in the U.S.71 in these different sectors. In each, innovative research and
development is producing advances that create the potential
Many studies and research reports from experts in the field of
for leading companies to expand products and markets, while
sustainable buildings report that trillions of dollars in energy costs
simultaneously significantly reducing their (and their customers’)
could be saved with currently available technologies. The widely
GHG emissions.
referenced retrofit of the iconic Empire State Building has reduced
energy consumption by 38% and produced annual cost savings of Utilities sit at the crucial intersection of most of these sectors.
approximately $4 million.72 The net-zero pathway for both residential Electricity is a common denominator. The emerging experience with
and commercial is still in its early stages. Design strategies and solar photovoltaic (PV) cells will likely have parallels in other sectors.
life cycle ownership cost comparisons are being tested, but cost The risks and costs associated with coal are rising, with little potential
differentials are falling. Major innovations in building technologies for decline, while the risks and cost of clean energy alternatives such
from companies such as UTC, Ingersoll-Rand, Johnson Controls and as PV cells continue to fall. According to Swanson’s Law,75 the price of
others will enable both near-term high-efficiency gains and the path solar photovoltaic panels will drop in the future, as it has in the past,
to net-zero. roughly 20 percent for every doubling of cumulative shipped volume.
At present rates, costs halve about every 10 years,76 and will continue
However, there are two pieces of research that, if more widely
to do so, as the volume continues to grow.
understood, could significantly influence the flow of capital to “green
buildings,“ especially as our urban populations rapidly grow, along If the anticipated global infrastructure investment in utilities77 follows
with investments in new commercial construction. the pathway shown by climate leaders such as Excel Energy, rather
than a heavy reliance on fossil fuels, then upward volumes will
First, a 2015 report from the U.S. Department of Energy presents a
continue to drive lower prices. If clean energy PV cell prices keep
review of prior research studies on LEED and Energy Star–certified
falling, then achievement of the 2050 target for energy sector global
buildings. The report offers some powerful conclusions reflecting
GHG emissions is a manageable challenge.78
the business logic of sustainable design. LEED and Energy Star
buildings have higher rental rates, a premium of approximately 16 Innovations across many of the sectors discussed will need to find
and 8 percent, respectively, compared to similar properties. Likewise and follow their own versions of Swanson’s Law. Companies will
they have higher occupancy rates (on average 17 and 10 percent), allocate capital to research and development that should help them
and a sales prices per square foot increase of approximately 20 and compete in a not-too-distant future that will likely be very different
8 percent. All while reducing utility bills and incurring only a small from the present. If those innovations follow the types of pathways
construction cost premium of approximately 2 percent.73 described here, then competitive low-carbon solutions may become
economically feasible and scale up. If supply of and demand for
The second 2015 report from Harvard University’s Chan School
innovative solutions fails to fully materialize, then hard-to-recover
of Public Health cites an even more startling finding. People who
ground will be lost.
work in green buildings have higher levels of cognitive functioning
and make better decisions than their peers in non–green buildings, We cannot and should not rely on last-minute solutions to make
where ventilation, air quality and other environmental factors up for lost time on climate change and emissions.79 There are no
adversely affect cognitive functioning. Professor Joseph Allen, the quick fixes to getting global scale innovations in place. The climate
report’s author, suggests that ”even modest improvements on indoor trend is not in line with scientific guidance and needs to be reversed
environmental quality may have profound impact on the decision by following key sector pathways like those described above. To do
making performance of workers.”74 otherwise is to push even more risk onto future generations.
Taken together, these findings on the business logic of decarbonizing
our homes and offices should inform the flows of capital toward a
new low-carbon future.
71
eia.gov/tools/faqs/faq.php?id=86&t=1 76
Ibid.
72
e sbnyc.com/esb-sustainability 77
w
eb.stanford.edu/group/efmh/jacobson/Articles/I/CountriesWWS.pdf
73
Energy Efficiency & Financial Performance: A Review of Studies in the Market. U.S 78
Ibid.
Department of Energy, December 2015 79
Ibid.
74
green.harvard.edu/tools-resources/research-highlight/impact-green-buildings-
cognitive-function
75
en.wikipedia.org/wiki/Swanson%27s_law
13You can also read