Closing the 2020 emissions gap: Issues, options and strategies - Climate Analytics
←
→
Page content transcription
If your browser does not render page correctly, please read the page content below
Closing the 2020
emissions gap:
Issues, options and
strategies
Closing the 2020 emissions gap: Issues, options and strategies

Closing the 2020 emissions gap:
Issues, options and strategies

Authors:


Bill
  Hare,
  Michiel
  Schaeffer,
  Marcia
  Rocha,
  Joeri
  Rogelj
  (Climate
  Analytics)


Niklas
  Höhne,
  Kornelis
  Blok,
  Kees
  van
  der
  Leun,
  Nicholas
  Harrison (Ecofys)


Date:
  03
  August
  2012


Acknowledgments: This document has been funded by the Children’s Investment Fund Foundation
(CIFF) to catalyze thinking among governments, businesses and civil society about issues, options
and strategies that might contribute to closing the emissions gap. The authors wish to thank CIFF, in
particular, Kate Hampton, Sophie Pullan and Farhana Yamin, for their support for this work. The
authors also acknowledge the useful comments and reviews on previous drafts from Mark Roberts,
Marion Vieweg, Farhana Yamin, Durwood Zaelke and one anonymous reviewer. The current draft
remains open for further comments and reviews, which should be sent to Nicholas Harrison
(n.harrison@ecofys.com). The views expressed and information contained in this draft are those of
the authors and are not necessarily those of, or endorsed by CIFF, which can accept no responsibility
for such views or information or for any reliance placed on them.
Authorship note: All authors contributed to chapters 1 and 4. Climate Analytics authors were
responsible for the content of chapter 2 while Ecofys authors were responsible for chapter 3.

                                                                                          2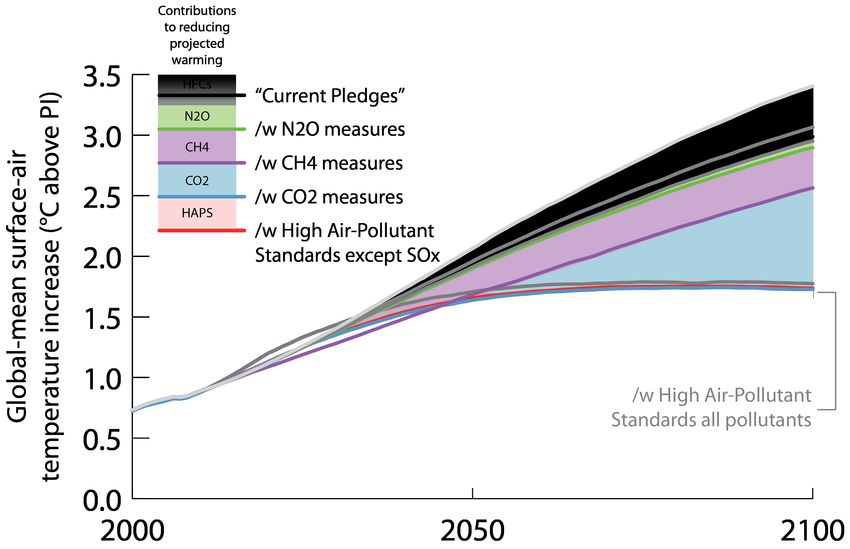
Closing the 2020 emissions gap: Issues, options and strategies

Summary
Without further and accelerated action it appears very likely that global greenhouse-gas (GHG)
emissions levels in 2020 will be far above those that are consistent with agreed international warming
goals. This gap between where emissions are headed and where they need to be exists due to the
inadequacy of current mitigation pledges, which, if fully implemented, will lead to warming of 3-3.6°C
by 2100. The gap is now widely acknowledged by the international community and at the United
Nations Framework Convention on Climate Change (UNFCCC) COP17 in Durban a work plan on
enhancing mitigation ambition was launched to explore options for strengthening efforts by all
Parties.
In this context, this briefing paper explores a range of issues, options and strategies for urgently
bridging the 2020 emissions gap. We begin by reviewing some of the recent science in relation to
limiting warming to the agreed warming goals, and the relative role of different GHGs and other
climate forcing agents. The scientific analysis in this paper is new in that it integrates insights from
the recent reports published by the United Nations Environment Programme (UNEP) relating to air
pollution, methane and hydrofluorocarbon (HFC) emissions reductions in the context of efforts to limit
warming to below 2°C, and ultimately to 1.5°C.
Another innovative feature of this briefing paper is a practical analysis of a range of initiatives that,
taken together, could have the potential to reduce emissions from present projected levels to those
that are consistent with a 2°C warming limit and assist national governments in implementing and
strengthening their emissions reduction pledges. We provide an overview of such initiatives – often
led by players other than national governments and in many cases driven by concerns broader than
climate change. Together, these initiatives could have the potential to bridge the emissions gap.
Finally we highlight further work needed to elaborate on the scientific issues, mitigation options and
barriers to their achievement in order to realize the possibilities outlined in the paper.
HFC, CH4 and N20 reductions are necessary but not sufficient to meet the warming goals.
To meet the warming goals of 1.5 or 2°C, deep reductions are needed in emissions of all the main
GHGs, including carbon dioxide (CO2), methane (CH4) and HFCs. Reductions in air pollutants that
affect the climate, including black carbon, sulphur oxides and tropospheric ozone precursors are also
needed.
Action to limit HFCs can reduce projected warming by 0.05-0.5oC, depending upon the assumed
future growth of emissions of these gases. Nitrous oxide (N2O) reductions play a relatively small
role, reducing warming by about 0.1oC. Reductions in CH4 emissions are very important, and lower
projected warming by about 0.3°C by 2100. Apart from the direct effect of lower methane levels,
decreased methane emissions also reduce tropospheric ozone concentration.
With reductions in emissions of these non-CO2 gases only, global warming would produce a
temperature increase of approximately 2.6°C by 2100, still far above the warming limits.
Deep CO2 reductions are required to meet warming goals.
The largest contribution to lowering projected warming is achieved by deep reductions in CO2
emissions. This would further reduce the projected warming by about 0.9-1.0oC. In other words,
without strong CO2 reductions the 1.5 and 2°C warming goals cannot be achieved.
Reducing air pollutants is also an important part of a comprehensive mitigation strategy.
Reducing black carbon emissions, particularly from fossil-fuel sources, will decrease the net radiative
forcing of the Earth and lead to slower or lower short-term warming. Reductions in these and other
pollutants have major benefits for air quality (including sulphur (SOx)) and significant regional
climatic consequences. Most of the pollutant reductions that can be achieved from air-quality
measures will also be achieved in the energy-system transformation required to achieve low CO2
emissions levels. This is due to decreased activity in the high-pollutant fossil-fuel energy supply.
There are large air-pollutant reduction benefits from the energy-system transformation required to
reach a low-carbon development pathway.

                                                     3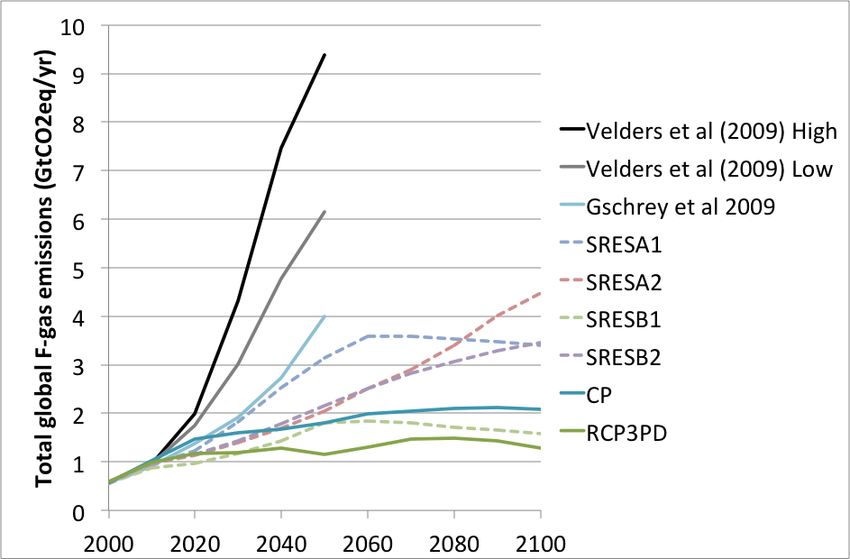
Closing the 2020 emissions gap: Issues, options and strategies

It is likely only in a scenario where CO2 measures are not reduced below current pledges and where
air-quality measures exclude SOx, that accelerated action on black carbon and other air-quality
measures can lead to a slower rate of warming for a few decades in a continuously warming world.
Non-CO2 measures cannot be used as a means to “buy time” to enable reductions in CO2 emissions
to be achieved later. A ten-year delay in starting CO2 emissions reductions more than doubles the
probability of exceeding 2°C of warming in the 21st century from 20% to 50%. After such a delay,
energy-related CO2 reduction rates until 2050 would need to be on average 2.4% (of 2010 levels) per
year, rather than the 1.5% per year in the absence of a delay.
A comprehensive and effective mitigation strategy requires deep CO2 reduction and non-CO2
measures to work side-by-side to provide the most technically and economically feasible package.
This is important to bear in mind as in some cases there is confusion about the role of non-CO2 gases
in maintaining a 2°C or lower pathway. The most promising perspective from a climate policy context
would be to combine deep reductions of CO2 and other long-lived GHGs with accelerated action on air
pollutants. Without strong CO2 reductions the warming goals considered here cannot be achieved.
The gap can be narrowed substantially by scaling up and combining initiatives in a green
growth approach to international action on climate change.
With the “Wedging the Gap” approach, Ecofys has identified twenty-one initiatives that together have
substantial potential to narrow the emissions gap, supporting and going beyond what national
governments have pledged.
Working with initiatives of actors that are intrinsically motivated to act is a fundamentally different
approach from attempting to secure agreement among countries that are to some extent resistant to
action.
We estimate that the combined effect of the scaled-up initiatives could be in the order of 10 GtCO2e
reductions below business-as-usual (BAU) levels in 2020 plus the effect of enhanced reductions in
methane and air-pollutant emissions (excluding sulphur). Roughly half the effect goes beyond what
national governments have pledged.
The selection of only a few of these initiatives would not result in sufficient reductions. Every effort
has to be made to scale up as many of these initiatives as possible to realize a significant effect.
Because the gap is large, it overlaps with pledges by national governments, and some initiatives may
fail along the way.
For each area of possible reduction, initiatives are already underway by parties other than national
governments and are often driven by interests beyond climate change. Many represent a green
growth approach to global action on climate change and some have already gained significant
political momentum. However, most of these initiatives currently lack clear quantified commitments
or targets.
Many initiatives can be implemented independently of direct national government intervention while
for some, success may depend to an extent on intervention to remove barriers, reduce risk or provide
other support. For example, national governments would have to regulate the access of renewable
electricity generation to the electricity grid (where this is a barrier), but would not necessarily have to
provide financial incentives. In this case some administrative but no direct financial burden is put on
national governments, which may be particularly relevant for developing country governments.
Some initiatives are further advanced than others. Consequently a varying degree of effort and
resources will be needed to enhance action enough to fully exploit the available mitigation potential in
each case. An assessment of feasibility often depends on viewpoint and this report provides further
information as a basis for such an assessment.
We propose building a coalition or coalitions formed from scaled-up initiatives as a green growth
approach to global action on climate change. Working together on a coalition of such initiatives could
serve as a catalyst, greatly enhancing the willingness of non-state actors to engage in activity that
reduces global greenhouse-gas emissions and supports the implementation and strengthening of the
pledges for which national governments remain responsible.

                                                     4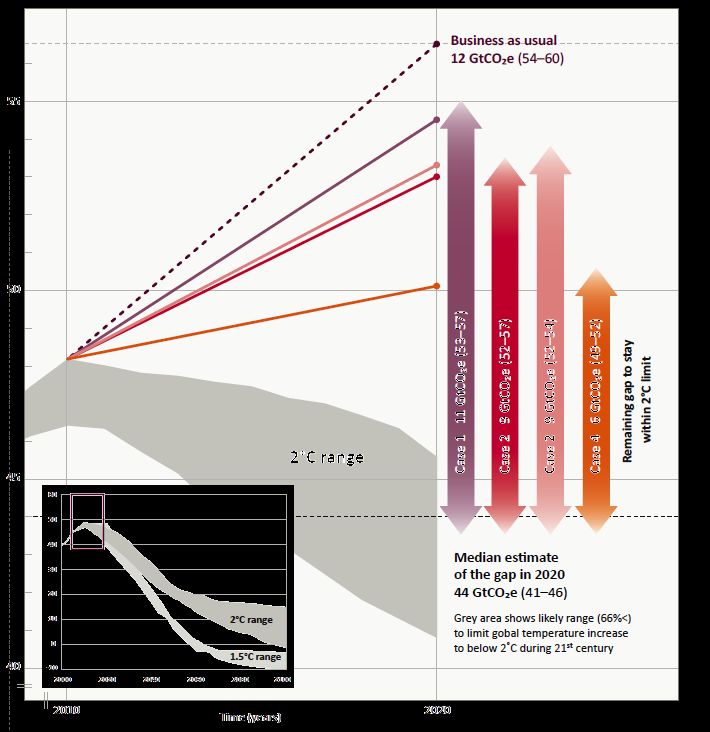
Closing the 2020 emissions gap: Issues, options and strategies

The successes of the coalition of initiatives have to be fed back into the UNFCCC process and must
have an impact on national government pledges. Otherwise national governments may feel that they
are released from the necessity to implement and strengthen their pledges as they can rely on the
success of action elsewhere. This feedback can be achieved by inviting the coalition of initiatives to
communicate with the UNFCCC process on a regular basis and a clear mandate to countries to revise
their pledges in light of the new information.

Next steps
We propose the following next steps:
   -   Systematic assessment of uncertainties in relation to air pollutants and climate
       policy: A substantial scientific issue in relation to air pollutants and climate change policy is
       that of uncertainty in aerosol properties and in different sources of precursors such as fossil-
       fuel and biofuel black carbon, biomass black carbon and SOx.
   -   Deeper evaluation and quantification of measures: There is a need to quantify and
       evaluate the feasibility of measures identified and to place them within an integrated
       framework in order to assess their efficacy in meeting climate and sustainable development
       goals.
   -   Identification of a convener or conveners of a coalition of initiatives: We have shown
       how initiatives can contribute significantly to closing the gap and that these initiatives would
       benefit from being part of a global coalition. Such initiatives could be brought together by one
       convener (e.g. UNEP or an individual), or could be a loose coalition of initiatives with a
       secretariat.
   -   Seeking commitments from the sectors and associations involved: As a next step,
       existing associations have to be effectively engaged, to bring them together into a coalition.
   -   Presenting an overall agreement in December 2012: If the process is successful, a
       coalition of initiatives could be presented in December 2012 at the margins of the UNFCCC
       COP.

                                                   5
Closing the 2020 emissions gap: Issues, options and strategies
Table of contents
1
Introduction 1
1.1
Background 1
1.2
Objective of this paper 1
2
Feasibility of limiting warming below 2°C and reducing it to below 1.5°C 3
2.1
Science of the pathways towards 2°C and 1.5°C 3
2.2
Where are emissions headed? 6
2.3
What is the 2020 emissions gap? 8
2.4
Slowing the rate of warming and limiting absolute temperature increase 10
2.4.1
Methane 13
2.4.2
F-gases 15
2.4.3
Air pollutants 17
2.4.4
Potential total climate effect of non-CO2 measures 22
2.5
o o
Is it still possible to meet the 2 C and 1.5 C limits? 25
3
Scaling up of existing initiatives can significantly narrow the 2020 gap 26
3.1
The “Wedging the Gap” approach 27
3.2
Which initiatives could realize mitigation potential? 28
3.3
By how much could emissions be reduced in 2020? 32
4
Next steps 35
References 36
Appendix A: Supplementary Figures 39
Appendix B: Details of the quantification of impacts of, and overlaps between, initiatives 40
6Closing the 2020 emissions gap: Issues, options and strategies
1 Introduction
1.1 Background
All 194 Parties to the UNFCCC agreed in Copenhagen and reaffirmed in Cancun that they would work
together to maintain the global average temperature increase below 2°C above pre-industrial levels
and to consider a lower goal of 1.5°C in a review process to be conducted from 2013 to 2015. Since
Copenhagen, 90 governments have put forward pledges to control their emissions of GHGs (see
Rogelj et al. 2009; Rogelj et al. 2010a; Rogelj et al. 2010b; UNFCCC 2011c; UNFCCC 2011a; UNFCCC
2011b).
Several independent scientific analyses indicate that current pledges by governments to date to
reduce emissions by 2020 are not consistent with a scientifically evaluated global emissions pathway
to either maintain warming below 2°C, or reduce it to 1.5°C by the end of the 21st century. Instead,
the pledges put forward to date are consistent with a warming of over 3°C above pre-industrial levels
by 2100 (Rogelj et al. 2010a).
Exacerbating this situation is the growing evidence that present emission trends are not consistent
with meeting of the pledges (UNEP 2010; Höhne et al. 2011; UNEP 2011a). Without further and
accelerated action it appears very likely that emissions levels in 2020 will be far higher than those
consistent with the agreed warming goals implied by the pledges.
Only six months ago governments came together in Durban and agreed on a historic package of next
steps. They agreed on the Durban Platform for Enhanced Action (DPEA) and set up a new ad hoc
group (DPA) to begin negotiations on a new international legal agreement to be adopted by 2015 that
will cover all 194 Parties to the UNFCCC. This agreement will take effect from 2020. Emission
commitments made under the new agreement would therefore only be in effect from 2020 onwards,
in other words at the earliest for the period 2020 to 2025.
Given the present trend in emissions and scientific analyses of required reductions, action needs to
be taken urgently to increase the level of mitigation action so that emissions peak before 2020. This
is necessary to ensure that emissions levels by 2020 are consistent with mid- to long-term
technologically and economically feasible pathways to hold warming below 2°C, and ultimately leave
open the option of limiting warming to 1.5° in the longer term. Unless urgent action is taken prior to
2015 to change present emission trends it is very unlikely that the new legal agreement to be agreed
upon in 2015 will be able to include emission commitments and actions for the post-2020 period that
are consistent with the agreed long-term warming goals.
For these reasons, the Durban package agreed that the negotiations under ADP would “launch a work
plan on enhancing mitigation ambition to identify and to explore options for a range of actions that
can close the ambition gap with a view to ensuring the highest possible mitigation efforts by all
Parties.”
1.2 Objective of this paper
This briefing paper is designed to help countries, businesses and civil society address key choices
relevant to increasing ambition pre-2020. It does so by clarifying a number of issues relating to the
science of emissions pathways to limit global mean warming below 2°C. It explains:
• Where emissions are currently heading
• The size of the resulting pre-2020 emissions gap
• The role of different gases in slowing the rate of warming and absolute temperature increase
• Whether it is still feasible to meet the 2°C and 1.5° limits
1Closing the 2020 emissions gap: Issues, options and strategies
The scientific analysis in section 2 of this paper is new in that it integrates within a single model
insights from the new reports published by the UNEP, relating to HFC emissions (UNEP 2011b), action
on methane and action to reduce air pollution (UNEP 2011d; UNEP 2011c), in the context of efforts to
reduce GHG emissions to levels consistent with holding warming to below 2°C, and ultimately to
1.5°C (UNEP 2010; UNEP 2011a). It takes into account the large literature on the co-benefits of air
pollution policy and climate change mitigation, in particular the synergies between GHG emissions
reductions and reduced air pollution levels and costs (Rafaj et al. 2010; Amann et al. 2011; Heyes et
al. 2011; McCollum et al. 2011; Rafaj et al. 2011; McCollum et al. 2012). Reducing air pollution in
the context of also achieving large GHG emissions reductions produces substantial co-benefits,
reducing human health damages and agricultural costs.
An innovative feature of this briefing paper is the practical analysis of various possible initiatives that
have the potential to reduce emissions from present projected levels to those that are consistent with
1.5 and 2°C warming limit (chapter 3). In this respect the paper builds on the “Wedging the Gap”
approach by Ecofys (Blok et al. 2012). The analysis of the initiatives in this briefing is only an initial
review. We recognize that more detailed analytical work is needed to further identify key issues and
options raised by these initiatives, including in particular, how these relate to reductions already
covered by pledges made under UNFCCC processes. A second area of additional analysis is how the
various initiatives could be implemented in a timely way and specifically what kind of coalition
building is necessary among and between governments, businesses and civil society to advance them
within UNFCCC processes and outside these. As a first step in catalyzing the discussion we set out
some key organizations and players that might take the lead responsibility.
2Closing the 2020 emissions gap: Issues, options and strategies
2 Feasibility of limiting warming below 2°C and
reducing it to below 1.5°C
In this section we review some of the recent science in relation to limiting warming to the agreed
warming goals, and the relative role of different GHGs and other climate forcing agents. For clarity
our analysis is based on two broad scenarios. The first “Current Pledges” (CP) scenario assumes that
the Copenhagen and Cancun pledges made by 90 governments1 are fully implemented.
Unfortunately, the resultant emissions still produce a warming of over 3°C2 above pre-industrial
levels by 2100 (see Figure 1). In the absence of these assumed policies implementing pledges in full,
warming might be higher and exceed 3.5°C by 2100. The second scenario follows the emissions from Sophie
the lowest emissions scenario of the Fifth Assessment Report of the Intergovernmental Panel on Gelösch
Climate Change (IPCC AR5), RCP3PD3 (van Vuuren et al. 2011). The RCP3PD scenario assumes that
the world has at least a 66% chance of succeeding in getting onto a low-emissions pathway
consistent with limiting warming to 2°C or lower.
These two published and scientifically reviewed scenarios serve as a reference point for the
assessment in this briefing. However, a number of additional issues are considered, including
different scenarios for HFC emissions, different methane reduction policies and a comparison of action
on air pollutants that affect climate change.
This paper takes into account a large literature on the co-benefits of air pollution policy and climate
change mitigation, in particular the synergies between GHG emissions reductions and reduced air
pollution levels and costs (Rafaj et al. 2010; Amann et al. 2011; Heyes et al. 2011; Rafaj et al.
2011). Reducing air pollution in the context of achieving large GHG emissions reductions produces
substantial co-benefits, reducing human health and ecosystem damage and agricultural costs.
2.1 Science of the pathways towards 2°C and 1.5°C
The science of climate change remains complex but the four IPCC assessment reports undertaken
between 1990 and 2007, and numerous special reports during that period and since, have
established a solid basis of evidence indicating that urgent mitigation action is needed to avoid
irreparable and significant negative impacts for ecosystems and human societies. Global climate
change already shows observable effects worldwide. These include, for example, impacts on water
availability and food security. In northern African countries, water resources have been affected such
that the frequency of extreme events such as floods or extended droughts has increased (Agoumi
2003). A direct consequence is crop loss, causing starvation of human populations or livestock, if
alternative food sources are not available. In contrast, in Mediterranean Africa, a decrease in
precipitation of up to 40% is expected with a 2°C increase in temperature. A recent study showed
that by mid-century, aggregate production changes in Sub-Sahelian Africa will amount to -22, -17, -
17, -18 and -8% for maize, sorghum, millet, groundnut and cassava (Lobell et al. 2008). Moreover,
increased temperatures (such as those seen in the year 2010) are usually accompanied by extreme
climate events and associated impacts, including flooding, drought, forest fires and coral bleaching.
1
Including the 27 member states of the EU. See (UNFCCC 2011a; UNFCCC 2011b)
2 All warming levels mentioned in this report refer to median estimates, i.e. the level achieved in 50% of the cases in a
probabilistic carbon-cycle/climate model run with 600 individual realizations. The uncertainty in warming projections by 2100 is
considerable, with a ± 1 standard deviation level at about 0.5°C below and above the median. See e.g. Meinshausen et al (2009).
3
The Representative Concentration Pathway (RCP) RCP3PD is the lowest scenario assessed by all three IPCC working groups for
the IPCC AR5.
3Closing the 2020 emissions gap: Issues, options and strategies
There are many uncertainties in our scientific understanding of the climate system. These include the
sensitivity of the climate to increasing GHG emissions and concentrations, uncertainty about the
effect of different forcing agents – particularly aerosols – on the climate system, the response of the
carbon cycle to warming and the rate of ocean heat uptake. As a consequence, in recent years
scientists have attempted to create methodologies and approaches that provide a probabilistic
estimate of warming given future emissions pathways (Meinshausen et al. 2009). These estimates
typically put together all of the known uncertainties in the climate system and of the properties and
effects of different GHGs and forcing agents within a model that then provides a range of warming
rather than a single number for a given emissions pathway. With these approaches it is possible to
estimate whether or not a given warming limit will be exceeded, and with what probability, given a
future emissions pathway.
Limiting warming to levels such as 1.5°C or 2°C also requires knowledge about whether or not
emissions pathways that maintain warming within these limits are technically and economically
feasible. One of the main approaches taken here is to rely upon published integrated assessment
model scenarios and to evaluate which of these meets certain warming levels. These kinds of models
encode our present knowledge about plausible developments in technology and economic activity in
the future, and therefore represent pathways that can be considered technically and economically
feasible.
Figure 1 illustrates some of the results of recent science relating to expected warming under present
proposals and the consequences of low-emissions pathways for global mean warming against the 2°C Sophie
and 1.5°C warming limits. Gelösch
Figure 1: Warming projections from Hare et al (2011) and Schaeffer et al (2012). The CP scenario
leads to warming exceeding 3°C by 2100 (orange), slightly below the level of warming that would
result from the business-as-usual emission assumptions (red). The lowest IPCC AR5 scenario
(RCP3PD - blue) produces a median estimate of warming below 2°C, but with about a 60% chance of
exceeding 1.5°C. A stylized low-emissions scenario (green) with negative carbon-dioxide emissions at
a scale consistent with the upper half of the literature range for these technologies in the 2nd half of
the 21st century brings warming back below 1.5°C by 2100. A hypothetical scenario where global
emissions cease in 2016 (black dotted), also limits warming below 1.5°C, showing the effects of
geophysical inertia due to the operation of the carbon cycle and slow uptake of heat by the global
oceans. The role of aerosol in masking some of the warming that could otherwise have been expected
from increased GHG emissions and concentrations in this scenario from the initial rise of temperature
before warming declines – reduced emissions of all aerosol precursors have an immediate net effect of
4Closing the 2020 emissions gap: Issues, options and strategies
“unmasking” part of GHG warming, while the concentration and therefore warming effect of GHGs
takes a longer time to dissipate.
Very deep reductions of carbon dioxide, the main GHG, are needed to limit warming to 2°C and/or
1.5°C by 2100 (Rogelj et al. 2011a). Carbon dioxide emissions (see Figure 2 below) must approach
zero or net-negative levels by 2100 in the scenarios that limit warming below 2°C with a likely or Sophie
higher probability (at least 66%). Likewise, to bring warming back to 1.5°C or below by 2100 Gelösch
necessarily involves significant net-negative carbon dioxide emissions by 2100. Negative emissions
(i.e. net removal of CO2 from the atmosphere) are achieved in the integrated assessment models at
present principally through the application of modern biomass energy combined with carbon capture
and storage technologies (BECCS) and to a much smaller extent by enhanced terrestrial carbon sinks,
for example due to reforestation and afforestation efforts. Such scenarios imply a negligible chance of
exceeding 3°C warming, compared to a 50% chance for the CP scenario.
Recent work has evaluated the available set of integrated assessment model results for a wide range
of scenarios, including those that limit warming below 2°C (Rogelj et al. 2011b) (UNEP 2010; UNEP
2011a). These pathways include air pollutants and aerosols that affect the climate system, and the
probabilities of exceeding warming levels take these fully into account, insofar as the relevant
processes are included in the reduced complexity climate model used for these calculations. Figure 3
below shows a systematic relationship between emissions levels in 2020 and associated maximum Sophie
warming levels over the 21st century. The emissions levels corresponding to warming levels below Gelösch
2°C, on the left-hand side of this figure, are those that are consistent with limiting warming to the
agreed global goals. If emissions in 2020 are above this range, then there is no as yet published
integrated assessment model that manages to produce a technologically and economically feasible
post-2020 pathway that compensates sufficiently for excessive pre-2020 emissions in order to
ultimately limit warming below 2°C (See Appendix, Figure A1, for an graphic illustration of the full
emissions pathways). This does not mean that it is impossible to limit warming below 2°C, but it does
mean that the emissions reduction rates required after 2020 are larger than those typically emerging
as feasible in integrated assessment models. Note that “allowed” levels in 2020 for 1.5 and 2°C are
below today’s emissions, which implies that the economically feasible scenarios in the literature lead
to global emissions stabilizing and declining within this decade. The options to achieve this are
discussed in sections 2.3 and 2.4.
5Closing the 2020 emissions gap: Issues, options and strategies
Figure 2: Technologically feasible pathways for maintaining warming below 2°C require zero or net-
negative CO2 emissions by 2100, whereas pathways that return warming below 1.5°C require the
deployment of negative CO2 technologies, achieving net-negative emissions by the 2060s.
.
Figure 3: Emissions in 2020 corresponding to IAM results for different levels of warming (Rogelj et al.
2011b).
2.2 Where are emissions headed?
Since the 2009 Copenhagen Accord and the 2010 Cancun Agreements, 85 Parties have put forward
pledges to reduce their GHG emissions. Of these, 38 are developed countries and 47 are developing
countries. These pledges cover 83% of global GHG emissions. The effect of these pledges can be
quantified and compared to a both typical and illustrative mitigation pathway from the integrated
assessment modeling (IAM) literature that keeps global temperature increase to below 2°C relative to
pre-industrial values4.
Fehler! Verweisquelle konnte nicht gefunden werden. shows the global emissions levels in
2010, 2020 and 2100 of a pathway that takes into account the current pledges made by Parties (from Sophie
Climate Analytics et al. 2011, see also Figure 4), and of RCP3-PD, a mitigation scenario that stays Gelösch
below 2°C with at least a 66% chance and which is used in IPCC inter-comparison studies (van found.
Vuuren et al. 2011). From this information it becomes clear that in a typical 2°C-consistent scenario, Sophie
emissions from long-lived GHGs (for example, carbon dioxide) must be reduced significantly more
Gelösch
than would be the case in the CP scenario.
In 2020, total carbon dioxide emissions are 5.8 GtCO2/yr lower in the 2°C-consistent pathway than in
the CP scenario. This difference amounts to more than 20% of global emissions levels in 1990.
Looking at all well-mixed GHGs (Total WMGHG), the CP scenario results in emissions that are 10
4
Not all of the pledges are in a form that allows a straightforward quantification. The emissions of countries whose pledges are
analyzed in this report account for 81.5% of global emissions (excl. LULUCF) in 2010, i.e. a somewhat smaller fraction than the
total emissions of countries that have made 2020 pledges (83% of global). Interpretation of even those pledges that are analyzed
here is contested and uncertainty remains, as explained at length in the UNEP Gap Reports.
6Closing the 2020 emissions gap: Issues, options and strategies
GtCO2e/yr higher in 2020 than a typical low emissions pathway like RCP3PD. This simplified
comparison already indicates that current pledges are very far from bringing global emissions to
levels consistent with reaching the warming limits agreed upon. In the CP pathway emissions peak at
around 2040, with CO2 remaining by far the largest contributor to total CO2-equivalent GHG
emissions (Figure 4).
Table 1 Emissions of GHGs and other forcing agents from a scenario based on CP and a typical GHG Sophie
mitigation scenario which limits warming to below 2°C (RCP3-PD). Gelösch
Gas
Unit
2010
2020
2100
CP
CP
RCP3-‐PD
CP
RCP3-‐PD
rel.
to
rel.
to
rel.
to
rel.
to
abs.
abs.
abs.
abs.
abs.
1990
1990
1990
1990
Carbon
dioxide
GtCO2
34.9
43.5
58%
37.7
37%
35.5
29%
-‐1.5
-‐106%
Methane
GtCO2eq
7.0
8.9
24%
5.4
-‐25%
7.6
7%
3.0
-‐58%
Nitrous
oxide
GtCO2eq
3.8
4.6
24%
3.6
-‐3%
3.8
4%
2.6
-‐30%
F-‐gases
GtCO2eq
0.9
1.3
322%
1.0
222%
1.9
506%
1.1
250%
Total
WMGHG
GtCO2eq
46.6
58.2
51%
47.6
23%
48.8
26%
5.1
-‐87%
Air
pollutants
SOx
MtS
52.6
34.2
-‐47%
18.7
-‐71%
10.4
-‐84%
4.6
-‐93%
Black
carbon
Mt
7.7
5.5
-‐31%
4.2
-‐47%
2.1
-‐73%
1.6
-‐80%
Organic
carbon
Mt
33.5
28.8
-‐22%
26.3
-‐28%
13.1
-‐64%
12.5
-‐66%
NOx
MtN
38.1
32.5
-‐14%
24.5
-‐35%
12.0
-‐68%
10.1
-‐73%
7Closing the 2020 emissions gap: Issues, options and strategies
Figure 4: Estimated global WMGHG emissions based on the current pledges proposed by Parties
(Climate Analytics et al. 2011).
The pledges of individual countries give an estimation of how the national or regional contributions to
global GHG emissions could change from 2010 to 2020. In 2010 Non-Annex I accounted roughly for
two-thirds of global energy and industry-related GHG emissions. Under the current pledges, by 2020
Non-Annex I emissions would significantly increase from 2010 to 2020, whereas emissions from
Annex I countries are estimated to stay roughly constant or to decline slightly5. The share of Non-
Annex I energy and industry-related emissions would therefore further increase by 2020.
2.3 What is the 2020 emissions gap?
The 2020 emissions gap can be roughly defined as the gap between where estimated emissions are
heading in 2020 and where they need to be in order to place us on a global emissions path consistent
with 1.5 and 2°C warming. The size of the gap depends primarily on the countries’ pledges and in
particular on their levels of ambition. In addition, for developed countries the main unknown consists
of the accounting rules, for example on how to deal with surplus emissions allowances at the end of a
accounting period, and the rules for accounting for emissions from land use, land-use change and
forestry (LULUCF). For developing countries the main issue is the projection of BAU emissions, or
baseline, emissions into the future, as their pledges are mostly expressed as deviations from baseline
development, and the higher level of uncertainty in emissions inventories.
To a lesser extent the size of the gap depends on the assumptions used in calculating the global
emissions pathway consistent with 1.5 and 2°C. Importantly, the emissions gap refers to the gap
between pledged emissions and required levels of gases covered by the Kyoto Protocol. The 1.5 and
2°C-consistent pathways, however, by necessity need to take into account the emissions of air
pollutants, ozone depleting substances, or other anthropogenic influences on climate, such as the
large-scale changes in land use that impact Earth surface energy balance through changes in fluxes
of radiation, heat and moisture (other than the GHG emissions and uptake associated with these
changes, which are included in the country pledges and/or accounting). A difference in emissions in
5
Note that deforestation-related emissions are also important in Non-Annex I countries and are estimated to decline significantly
under the current pledges as evaluated in this paper.
8Closing the 2020 emissions gap: Issues, options and strategies
these non-Kyoto substances might lead to a somewhat smaller or larger gap. The extent to which
such non-Kyoto substances can help in closing the gap is partly analyzed in section 2.4.
A recent review led by the UNEP (the “Bridging the Emissions Gap” – or BTG – report (UNEP 2011a)),
provided a comparative study of emissions estimates based on the current pledges of countries under
the UNFCCC together with a re-analysis of the GHG mitigation scenario literature.
The size of the gap depends on how the pledges are interpreted (for graphic illustration see Appendix
Figure A2). The median emissions gap estimates range between 6 to 11 GtCO2e/yr in 2020. The
largest estimate of 11 GtCO2e /yr is obtained if one assumes that the low-ambition range of the
country pledges will be implemented and are combined with lenient international rules for GHG
accounting. This gap could be reduced to 6 GtCO2e/yr in 2020 if the high-ambition end of the country
pledges were to be implemented in combination with stringent accounting rules that, for example,
significantly limit the use of surplus credits available for developed countries.
The BTG report highlighted the availability of a wide portfolio of technically and economically viable
measures, which make it feasible to implement the more ambitious “conditional” pledges and move
significantly beyond these, as well as minimize the need for “lenient” LULUCF accounting options and
surplus emissions allowances. In the most lenient case of rules for emissions credits, for example,
surplus allowances from the first Kyoto commitment period can be saved for use and trading in
subsequent commitment periods, hence allowing for higher emissions. Current climate negotiations
are trying to solve the problem that an enormous amount of such surplus allowances are present in
the current system and, if unrestricted, will deteriorate effective emissions targets in the next
decades. Some Parties have proposed forfeiting such surplus allowances for future use and/or not
buying surplus units from other Parties unless real and new emissions reductions are achieved to
generate these surpluses. However, other Parties are looking for options available outside emissions
trading schemes to allow the trading of units generated inside the Kyoto system, possibly keeping
surplus emissions allowances from the first Kyoto commitment period and using these for compliance
to achieve future emissions targets, even without signing up for a second commitment period of the
Kyoto Protocol. There is large uncertainty in estimates of the effect of surplus credits on effective
future emissions targets, providing room for improvement on the current situation, but on the other
hand possibly allowing the use of surplus emissions credits outside of the system under which these
were created.
The BTG report shows effective reductions in 2020 can be significantly improved by:
• Moving to the more ambitious, conditional pledges, both in Annex I and non-Annex I (2-3
GtCO2e)
• Minimizing emissions credits for Annex-I countries from LULUCF accounting and the carry-
over of surplus allowances (2-3 GtCO2e)
• Avoiding double-counting of Clean Development Mechanism(CDM) credits, which will prevent
the gap from increasing to 2 GtCO2e
Policies and measures to enhance mitigation ambition include, but are not limited to:
• Increasing the global share of renewables in the energy supply,
• Shifting the mix of fossil fuels used in energy production,
• Reducing emissions from international aviation and shipping,
• Significantly reducing subsidies for fossil fuels,
• Intensifying energy efficiency improvements, and
• Strong action to reduce emissions from non-CO2 gases, such as methane and HFCs.
9Closing the 2020 emissions gap: Issues, options and strategies
Importantly, the emissions gap refers to pledged and required levels of Kyoto GHG emissions only,
not to emissions of air pollutants.6 However, the potential mitigation contribution of such non-Kyoto
gas emissions is included in the assumptions of the scenarios discussed in section 2.1. Therefore any
assumed change in these assumptions affects the identified gap, since these changes need to be
compensated for by GHG trajectories to achieve an equal probability of staying below 2°C.
For example, strong mitigation action on black carbon was already assumed in the calculations of the
emissions gap through the underlying emissions scenarios consistent with the warming goals.
Implementing these actions will not therefore reduce the size of the emissions gap. However, not
implementing these actions will widen the gap, since the lack of action will need to be compensated
for by enhanced measures in the Kyoto GHGs that the gap refers to explicitly (see section 2.4).
The general implications of reductions in CO2, non-CO2 GHGs and aerosols will be assessed in the
remainder of this briefing, for both the short (2020) and longer term (2050 to 2100). In section 3
these and more measures will be further analyzed in the context of actual initiatives to achieve broad
implementation.
2.4 Slowing the rate of warming and limiting absolute temperature
increase
Different GHGs and other climate relevant agents affect the energy balance of the Earth (see Table 2)
and act on the climate system over a wide range of timescales. These timescales are quite important
in determining the level of long-term warming and in the short term the rate of warming resulting
from a basket of GHG and forcing agent emissions. The longer the lifetime of a GHG in the
atmosphere, the larger its long-term effect on the warming of the planet, and the slower its
concentration declines after deep reductions are made. GHGs or climate forcing agents with short
lifetimes respond quickly to emission changes.
Carbon dioxide has a relatively long lifetime in the atmosphere, although this is quite complicated
(Archer 2005). A deep reduction in carbon dioxide emissions will only slowly be reflected in a
declining atmospheric concentration of carbon dioxide. Carbon dioxide emissions are first taken up
relatively quickly by the ocean surface and terrestrial biosphere, however a large fraction of these
emissions takes many centuries to thousands of years to be removed from the atmosphere. Nitrous
oxide (114 year lifetime) or a HFCs such as HFC143a (52 year lifetime), also responds relatively
slowly to reductions. Perfluorcarbons and sulphur hexafluoride often have multi-thousand year
lifetimes, and hence the concentrations, low as they are, are not affected quickly by even a complete
elimination of emissions, but go on warming the planet for thousands of years after emissions have
ceased.
On the other hand, deep reductions in emissions of a relatively short-lived gas such as methane,
which has a lifetime of about 12 years, or a HFC such as HFC-134a (14 year lifetime) will quickly lead
to a reduction in concentration and consequent warming. Therefore, generally speaking, reductions in
short-lifetime GHG emissions are effective in reducing warming shortly before the target year in
which warming needs to be limited, such as in the 2070s when warming peaks in most 1.5 and 2°C
scenarios, including RCP3PD. By contrast, early reductions in longer-lifetime GHGs like CO2 are
crucial even long before the target year, given the build-up in the atmosphere and the limited options
for later compensation for emissions that are too high early on.
6
In this paper we speak of “air pollutants” to group together emissions of sulphur (SOx), black carbon (BC), organic carbon (OC),
which lead to aerosol formation, and tropospheric ozone pre-cursors carbon monoxide (CO), nitrogen oxides (NOx), non-methane
volatile organic compounds (NMVOC) and ammonia (NH3), which are involved in atmospheric chemistry processes that lead to
tropospheric ozone formation, together with methane. Methane will be analyzed separately as a well-mixed GHG, albeit with a
relatively short lifetime. See section 2.4.
10Closing the 2020 emissions gap: Issues, options and strategies
There are also climate relevant air pollutants and some GHGs that have very short lifetimes in the
atmosphere once emitted - significantly less than a year. Prominent amongst these are sulphur
(SOx), black carbon (BC) and organic carbon (OC) emissions, which lead to aerosol formation.
Sulphate aerosols, whose main source is fossil-fuel combustion, have an overall cooling effect on the
climate system, as they are reflective, masking a significant fraction of the radiative forcing effect of
the long-lived GHGs. Black carbon, which is emitted from fossil-fuel combustion and biomass burning,
has a warming effect, as it absorbs solar radiation in the atmosphere (direct aerosol effect), may
impact cloud cover (the semi-direct aerosol effect), and leads to additional solar energy absorption
when deposited on snow and ice, as it reduces the reflectivity of these surfaces. Organic carbon
emissions, which come from biomass burning and which are often associated with black carbon
emissions from the same source, appear to have a negative effect, however when taken together
with black carbon emissions from the same source there appears to be a local net-positive radiative
forcing effect, in particular from fossil-fuel sources (Kopp and Mauzerall 2010) (Myhre et al. 2011).
In a complex atmospheric chemistry process that involves methane as well, there are other
pollutants with very short lifetimes such as carbon monoxide (CO), nitrogen oxides (NOx) and non-
methane volatile organics (NMVOC). These are precursors to tropospheric ozone formation, which is a
powerful radiative forcing agent in the lower atmosphere. Decreasing carbon monoxide and
hydrocarbon emissions decreases tropospheric ozone, and also reduces the lifetime of methane in the
atmosphere by improving its oxidizing capacity. Reductions in methane emissions reduce
tropospheric ozone, and improve the oxidizing capacity of the atmosphere. Hence methane has both
a direct warming effect through its own radiative forcing, and an indirect effect by influencing
atmospheric chemistry and enhancing tropospheric ozone formation. A reduction in methane
emissions will reduce both effects.
The climate forcing effect of the WMGHGs – CO2, CH4, N2O and F-gases7 – is relatively well known
and these gases all have a relatively uniform effect on the global climate (due to being “well mixed”
in the atmosphere). Much less certain are the effects of the other agents, such as aerosol or ozone
precursors, and often their effects are quite complex and regionally differentiated. The total climate
forcing and regional climatic effects of aerosols deriving from SOx, BC, OC emissions on warming and
precipitation are less certain, and these are major air pollutants, affecting human health and
agriculture. Tropospheric ozone precursors are also air pollutants that indirectly affect the lifetime of
chemically active GHGs (such as CH4).
Reducing sulphur emissions from present levels will quickly increase the net radiative forcing of the
Earth, reducing the masking effect of historical sulphur dioxide emissions and leading to higher short-
term warming (Hansen et al. 1980) (Wigley 1991). Due to the tight coupling of sulphur emissions
with fossil-fuel combustions, strong mitigation in a 2/1.5°C scenario (RCP3PD) can lead to a higher
radiative forcing in the very short term, which might produce a small initial warming above the CP
scenario by the 2020s. We will come back to this later.
7
We follow the IPCC approach, which in its Fourth Assessment Report defined F-gases as the
hydrofluorocarbons, perfluorocarbons, and sulphurhexafluoride which are covered under the Kyoto
Protocol; see http://www.ipcc.ch/pdf/assessment-report/ar4/syr/ar4_syr_appendix.pdf.
11Closing the 2020 emissions gap: Issues, options and strategies
Table 2 Radiative forcing contributions (in W.m-2, differences in %). For individual aerosols only the
direct effect is provided. The semi-direct and indirect effects are calculated in the model as a
combined total effect.
2010
2020
2100
RCP3PD
RCP3PD
compared
compared
CP
RCP3PD
to
CP
CP
RCP3PD
to
CP
Carbon dioxide +1.86 +2.21 +2.18 -1% +4.63 +2.44 -47%
Methane +0.49 +0.54 +0.47 -13% +0.56 +0.27 -52%
Nitrous oxide +0.18 +0.20 +0.20 0% +0.33 +0.24 -27%
F-gases +0.03 +0.06 +0.05 -17% +0.19 +0.14 -26%
Total Kyoto GHGs +2.55 +3.01 +2.90 -4% +5.71 +3.09 -46%
SOx -0.51 -0.39 -0.24 -38% -0.15 -0.10 -33%
BC +0.48 +0.40 +0.32 -20% +0.18 +0.16 -11%
BC on snows/ice +0.11 +0.08 +0.06 -25% +0.03 +0.02 -33%
OC -0.11 -0.10 -0.08 -20% -0.04 -0.04 0%
Total aerosol semi-indirect effects
-0.75 -0.63 -0.51 -19% -0.31 -0.24 -23%
(clouds)
Total aerosols -0.78 -0.64 -0.45 -30% -0.29 -0.20 -31%
Tropospheric Ozone +0.44 +0.42 +0.35 -17% +0.28 +0.18 -36%
Total +2.21 +2.79 +2.80 0% +5.70 +3.07 -46%
CO2 concentration (ppm) 390 420 420 660 440
Total RF expressed in equivalent
400 450 450 760 460
CO2 concentration (ppm CO2eq)
Warming above pre-industrial (°C) 0.9 1.2 1.2 3.2 1.7
The scenarios discussed here – the CP scenario and the 2°C/1.5°C RCP3PD scenario – include policies
and measures and actions that would reduce all of these GHGs and other forcing agents. The CP
scenario includes the likely emissions pathways of emissions of sulphur, black carbon, organic carbon
and other air pollutants based on integrated assessment model studies of GHG emissions in a similar
range. RCP3PD also includes substantial action on air pollution, not only including the reductions in
sulphur, black carbon and other air pollutants linked to fossil-fuel use and production, but also
embedding assumptions that society in the future as it grows wealthier will invest in further air
pollution controls. We test sensitivity to this assumption in the sections below, looking at examples of
likely future air pollution emissions adjusted for energy-system transformations, consistent with the
low-carbon scenario RCP3PD, and compare these with more advanced air-pollution policies such as
those proposed in recent UNEP assessments on methane and black carbon (UNEP 2011d; UNEP
2011c). By disentangling the interactions of climate policy and air-quality measures, we hope to shed
light on the mutual co-benefits of measures within these two policy realms.
For this exercise, we need to first exclude the effects of strong new air quality policy from our climate
policy scenarios, since by default this is already assumed in the baseline scenarios – the CP and the
low-carbon scenario RCP3PD. Excluding new air quality policies from our climate policy scenarios
leads to higher projected future emissions of air pollutants, but because of the net global cooling
effect of aerosols, these higher emissions lead to a net cooling in both scenarios: warming is
12Closing the 2020 emissions gap: Issues, options and strategies
decreased by 0.2°C in the CP scenario and by 0.05°C in RCP3PD. These scenario variants will be
tagged LAPS (Low Air-Pollutant Standards), as opposed to the original HAPS (High Air-Pollutant
Standards) variants. Emissions of air pollutants in these 2x2 scenario variants rely on the recent work
of McCollum (2011; 2012), who explicitly explored the co-benefits of climate and air quality measures
in an innovative multi-criteria analysis framework.
The scientific literature over the last 15 years (Alcamo 2002; Alcamo et al. 2002; van Vuuren et al.
2003; Rao et al. 2005 ; Changhong et al. 2006; van Vuuren et al. 2006; Haines et al. 2007; Williams
2007; Markandya et al. 2009; Wilkinson et al. 2009; Shrestha and Pradhan 2010) (including the work
of McCollum et al. 2011; McCollum et al. 2012) shows quite clearly that combining significant GHG
reductions with air pollution policy has large co-benefits, substantially reducing both the cost of
reducing air-pollution and the damages due to air pollution. One of the main reasons for this is that a
low-carbon pathway leads to transformations in the primary-energy supply sector, like reduced
deployment of high-pollution fossil-fuel technologies and reduced activity in sectors that are
associated with infrastructure and production of fossil-fuel sources. In other words, adopting low
carbon strategies produces substantial benefits in terms of reduced air pollution, and significantly
reduces the cost of achieving air quality goals8.
The large reductions in air pollutants that can be expected from deep GHG mitigation scenarios will
have both warming and cooling effects. Reduced SOx emissions will lead to warming in the short
term as the global warming masking effects of sulphate aerosols is reduced. On the other hand,
reduced BC, OC and tropospheric ozone precursor emissions will have a short-term cooling effect.
In this work we assume that sulphur emissions are reduced substantially, consistent with the
assumptions of the IAM models, and that there is no slow-down due to climate policy in these
reductions. An alternative assumption could be made to the effect that there is a deliberate exclusion
of sulphur controls from the larger portfolio of air quality measures and that countries, principally in
the developing world, would accept the very large health, agriculture and ecosystem damage that
would result. This alternative assumption seems implausible, but is the unintended implication of the
assumptions in the recent UNEP reports (UNEP 2011d; UNEP 2011c). In these reports, air quality
measures single out ozone precursors and black carbon producing activities and do not address
sulphur emissions. For illustrative purposes we will include this assumption in sections 2.4.3 and
2.4.4.
2.4.1 Methane
Methane (CH4) is one of the global WMGHGs, but has a relatively short lifetime of about 12 years
(IPCC 2007). In a deep GHG reduction pathway, such as RCP3PD, methane emissions are already
being reduced to, and beyond, the extent assessed by the above-mentioned UNEP report (UNEP
2011c) (see Figure 5). Hence, existing low-carbon pathways from IAM scenarios confirm that strong
CH4 measures identified in the UNEP report form part of the total package of mitigation efforts
required. Since these IAM scenarios form the backbone of the “required” 2020 emissions level as
part of the estimated emissions gap, strong CH4 measures are assumed and must be implemented
rapidly, along the lines as assumed in the RCP3PD scenario and UNEP report (UNEP 2011c). A lack of
such measures would widen the emissions gap and would need to be compensated for by increased
reductions in, for example, CO2. As identified in the UNEP report, many of these CH4 measures
require specific action in sectors beyond energy.
8
http://gains.iiasa.ac.at/index.php/gains-asia/298-p10
13Closing the 2020 emissions gap: Issues, options and strategies
Figure 5: Methane (CH4) emissions projections. The red lines show emissions for the high and low cases
in the recent UNEP report “Integrated Assessment of Black Carbon and Tropospheric Ozone” (UNEP
2011c).
In the absence of a move towards deep GHG reductions, reducing global methane emissions from
levels in the CP scenario by the full potential identified in RCP3PD, i.e. slightly more than assessed in
the recent UNEP report (UNEP 2011d), would result in a global mean temperature increase of about
0.3°C lower than the 3.0°C otherwise projected9 in the period 2050 to 2100 (see Figure 6).
Sophie
Gelösch
9
Besides the direct radiative forcing effect, methane emissions also influence the oxidizing capacity of the troposphere. The
presence, and possible subsequent reduction, of methane emissions will therefore also influence the lifetime of other species in the
atmosphere. Some of these interactions are covered in a simplified manner, but not those with, for example, sulphates.
Interactions not included in our model setup are not likely to change the general picture.
14You can also read