Slipping to the Extreme: A Mixed Method to Explain How Extreme Opinions Infiltrate Online Discussions
←
→
Page content transcription
If your browser does not render page correctly, please read the page content below
Slipping to the Extreme: A Mixed Method to Explain How Extreme Opinions
                                                                    Infiltrate Online Discussions
                                               Quyu Kong,1,2 Emily Booth,2 Francesco Bailo,2 Amelia Johns,2 Marian-Andrei Rizoiu1,2
                                                                                                1
                                                                                     Australian National University
                                                                                            2
                                                                                    University of Technology Sydney
                                                   quyu.kong@anu.edu.au, emily.booth@uts.edu.au, francesco.bailo@uts.edu.au, amelia.johns@uts.edu.au,
                                                                                   marian-andrei.rizoiu@uts.edu.au

                                                                    Abstract                                 and Vraga 2018) being recorded in the literature. To date,
arXiv:2109.00302v1 [cs.SI] 1 Sep 2021

                                                                                                             there exist three primary types of methods for address-
                                          Qualitative research provides methodological guidelines for        ing problematic information. The first type concentrated on
                                          observing and studying communities and cultures on online
                                          social media platforms. However, such methods demand con-
                                                                                                             large-scale monitoring of social media datasets to detect in-
                                          siderable manual effort from researchers and may be overly         authentic accounts (bots and trolls) (Ram, Kong, and Ri-
                                          focused and narrowed to certain online groups. In this work,       zoiu 2021) and coordinated disinformation campaigns (Ri-
                                          we propose a complete solution to accelerate qualitative anal-     zoiu et al. 2018). The second group aims to understand
                                          ysis of problematic online speech — with a specific focus on       which platforms, users, and networks contribute to the “in-
                                          opinions emerging from online communities — by leverag-            fodemic” (Smith and Graham 2019; Bruns, Harrington, and
                                          ing machine learning algorithms. First, we employ qualita-         Hurcombe 2020; Colley and Moore 2020). The third group
                                          tive methods of deep observation for understanding problem-        uses computational modeling to predict future pathways
                                          atic online speech. This initial qualitative study constructs an   and how the information will spread (Molina et al. 2019).
                                          ontology of problematic speech, which contains social media        These studies provide valuable insights into understanding
                                          postings annotated with their underlying opinions. The qual-
                                          itative study also dynamically constructs the set of opinions,
                                                                                                             how problematic information spreads and detecting which
                                          simultaneous with labeling the postings. Next, we collect a        sources are reshared frequently and by which accounts.
                                          large dataset from three online social media platforms (Face-      Though the first and third research approaches offer breadth
                                          book, Twitter and Youtube) using keywords. Finally, we in-         of knowledge and understanding, there are limitations —
                                          troduce an iterative data exploration procedure to augment the     they often have less to say about why certain opinions and
                                          dataset. It alternates between a data sampler, which balances      views gain traction with vulnerable groups and online com-
                                          exploration and exploitation of unlabeled data, the automatic      munities.
                                          labeling of the sampled data, the manual inspection by the            Qualitative research methods are well placed to address
                                          qualitative mapping team and, finally, the retraining of the
                                          automatic opinion classifier. We present both qualitative and
                                                                                                             this gap. They provide rich, contextual insights into the
                                          quantitative results. First, we present detailed case studies of   social beliefs, values, and practices of online communi-
                                          the dynamics of problematic speech in a far-right Facebook         ties, which shape how information is shared and how opin-
                                          group, exemplifying its mutation from conservative to ex-          ions are formed (Glaeser and Sunstein 2009; Boyd 2010;
                                          treme. Next, we show that our method succesfully learns from       Baym 2015; Johns 2020). This is also fundamental to un-
                                          the initial qualitatively labeled and narrowly focused dataset,    derstanding how and why certain opinions and information
                                          and constructs a larger dataset. Using the latter, we exam-        sources scale to encompass large segments of the online so-
                                          ine the dynamics of opinion emergence and co-occurrence,           ciety (Bailo 2020; Bruns, Harrington, and Hurcombe 2020).
                                          and we hint at some of the pathways through which extreme          However, a common criticism of qualitative research is that
                                          opinions creep into the mainstream online discourse.               the in-depth knowledge comes at the expense of generat-
                                                                                                             ing insights of limited representativeness and weak robust-
                                                             1     Introduction                              ness of the findings. Therefore, there is a gap between the
                                                                                                             depth of insight gained from ethnographic and qualitative
                                        In 2020, the COVID-19 pandemic alerted the world to com-             approaches and the breadth of knowledge gained from com-
                                        plex issues that arise from social media platforms circulating       putational methods from data science.
                                        user-generated misinformation, hate speech, and conspiracy
                                        theories (Posetti and Bontcheva 2020). Such forms of prob-              This paper aims to fill this gap by proposing a mixed-
                                        lematic information (Jack 2017) have been studied before,            method approach that brings together qualitative insights,
                                        with the influence of disinformation campaigns on elec-              large-scale data collection, and human-in-the-loop machine
                                        tions (Kim et al. 2019), disaster management (Rajdev and             learning approaches. We apply our method to map both in-
                                        Lee 2015) and other global public health promotions (Bode            depth and in-breadth the problematic information around
                                                                                                             four topics: 2019-20 Australian bushfire season, Climate
                                        Copyright © 2021, Association for the Advancement of Artificial      change, COVID-19, and Vaccination on three social me-
                                        Intelligence (www.aaai.org). All rights reserved.                    dia platforms (Facebook, Twitter and Youtube). Specifically,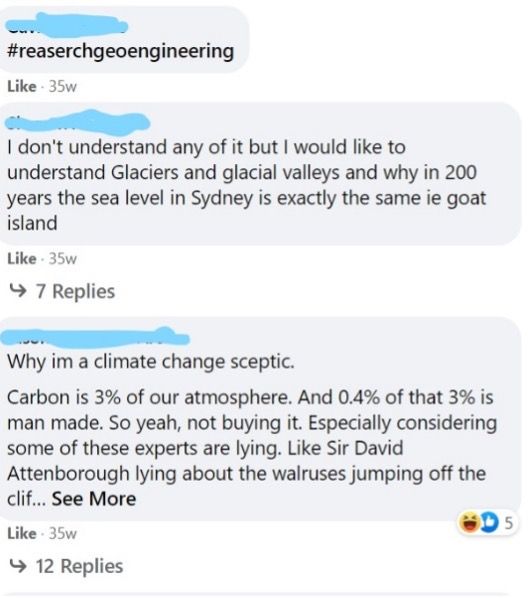
this work addresses three open questions concerning apply-       Deep qualitative study

ing machine learning and qualitative research in analyzing         Social Media Platforms         Qualitative             Wikibase
problematic online speech.                                                                        Researchers
                                                                                                                    Postings            Opinions

   The first research question emerges naturally from the                                                                      Topics
gap: can we leverage both qualitative and quantitative
analysis for studying problematic online speech? To ad-
dress this challenge, we present a complete solution that                     Data
                                                                        Collection Tools
bridges and facilitates both analyses (shown in Figure 1).                                        Data to label

We first build a platform based on an open-source tool, Wik-
ibase, where qualitative and quantitative analysis is con-
                                                                                                     Data                  Trained
ducted. It enables constructing an ontology of problematic                                         Sampler                Classifiers
online speech by performing the qualitative study, which la-            Unlabeled Data

bels data by topics and builds the vocabulary of opinions
simultaneously. We then collect large-scale raw data using       Unlabeled data collection                        Dataset augmentation
the uncovered vocabulary. Next, we employ machine learn-
ing algorithms to augment the data labeling process with a       Figure 1: The pipeline of machine learning accelerated qual-
human-in-the-loop setting. Finally, we show both a sample        itative research where the human-in-the-loop machine learn-
thematic and discourse analysis from the qualitative study       ing algorithms are employed for dataset augmentation.
focused on two examples of Facebook posts and comments
from a far-right public Facebook group, and the quantitative
outcome with measurements and statistics of the produced         the unavoidable selection bias of the deep qualitative study.
vocabulary.                                                      It also offers critical information for opinion mapping; we
   The second question concerns the scaling of the qualita-      study the opinion cross-occurrence network, making several
tive approaches. Such approaches require the team to ob-         observations. First, we find stable central opinions such as
serve, record and collect online discussions. One needs to       “Mainstream media cannot be trusted”, we uncover the im-
manually identify online communities where problematic           portance of conspiracy theories in debates, and we detect a
speech occurs and annotate pieces of texts with their un-        significant increase in the betweenness centrality for opin-
derlying opinions. Therefore, this in-depth exploration faces    ions questioning vaccines. Next, we observe the emergence
two challenges — a significant amount of effort from re-         of opinions over time (e.g., “2019-20 Australian bushfires
searchers and the introduction of human bias in the pro-         were caused by random arsonists”), popularized by embrac-
cess of collecting information (Dixon, Liu, and Setchi 2016).    ing core opinions (e.g., “Climate change crisis isn’t real”).
While machine learning is known to help data exploration at         The main contributions of this work include:
scale (Lin and Kolcz 2012), a question remains: can we ac-
                                                                  • A mixed-method solution for bridging qualitative and
celerate qualitative research and observations of online
                                                                    quantitative analysis, including the hosting platform
behavior with machine learning algorithms? We tackle
                                                                    (Wikibase), the initial qualitative study, the unlabeled data
this challenge by adopting the state-of-the-art text classifi-
                                                                    collection and the dataset augmentation with machine
cation algorithm, RoBERTa (Vaswani et al. 2017; Liu et al.
                                                                    learning algorithms.
2019), with a human-in-the-loop learning setting. We first
train the classifiers to identify problematic speech on post-     • A dataset augmentation procedure that merges qualita-
ings annotated by the qualitative researchers. Next, we de-         tive approaches with machine-learning-based human-in-
ploy three strategies to select unlabeled data. The active          the-loop data augmentation methods.
learning (Settles 2012) strategy selects the data for which       • Case studies of the evolution of problematic online speech
the classifiers are most uncertain. The top-confidence strat-       in an Australian far-right Facebook group.
egy selects data that classifiers are most certain about. The     • Analysis of problematic opinions emergence and co-
third strategy — the random strategy — randomly samples             occurrence by applying quantitative methods on the col-
from unlabeled data. The qualitative researchers then label         lected raw data.
the sampled data, we introduce the newly labeled data in the
ontology, and repeat the procedure iteratively until the pre-
dictive performance converges.                                                               2   Methods
   The last research question relates to applying the qualita-   This section details our methodology, which includes three
tive mapping at scale and analyzing the dynamics of prob-        distinct phases implemented sequentially in our study
lematic opinions. The question is can we track the dynam-        (shown schematically in Figure 1): the deep qualitative study
ics of problematic opinions from online discussions us-          (Section 2.1), the unlabeled data collection (Section 2.2),
ing unlabeled data? To answer this question, we leverage         and the dataset augmentation using machine learning (Sec-
the opinion classifiers that we build on the augmented la-       tion 2.3).
beled set. First, we machine-label the opinions in a large
set of postings spanning over a long time period. This al-       2.1    Qualitative Study
lows us to apply the qualitative-defined coding schema to        The data entry point of the deep qualitative study was
a significantly larger sample of postings, therefore reducing    known far-right community pages, after which we let our-
selves guided by users’ posting and linking, and recom-             major online social media platforms, Facebook, Twitter,
mendation algorithms. We employed unobtrusive observa-              and Youtube, selected due to their large volume of dis-
tion approaches to observe internet places where problem-           cussion around the four chosen topics. During the period
atic speech occurs, create field notes of rich, qualitative data,   of December 2019 - January 2021, one team member un-
construct a vocabulary of opinions to describe it, and gather       dertook unobtrusive observation of discussions, collected
and label data.                                                     field notes and digital artifacts (screenshots, linked data,
                                                                    photos, memes).Next, the qualitative researcher labeled the
Deep qualitative studies. The team was initially commit-            data with topics and opinions that she inferred from the
ted to using digital ethnography as the methodological en-          content. Finally, the collected data was double-coded by a
try point for studying problematic online content. Ethnog-          second-team member. Specifically, the second-team mem-
raphy allows the object of the study to “emerge through             ber first coded the data independently. Then the coded data
fieldwork, as the significant identities and locations un-          was reviewed, and disagreements were resolved through dis-
fold” (Hine 2015), rather than predefining a set of users,          cussions between the two. We note that an 81.0% inter-
sites, or keywords to construct the dataset. We set out to          annotated agreement was reported from the double-coding
use a multi-sited ethnography approach, where we explored           process.
multiple social media platforms and groups to understand               The first step of the qualitative study was to select the
and map the emergence of discussions. This would allow the          Internet places for conducting fieldwork — Internet place
team to understand these objects by connection and move-            is a generic term denoting where online discussions happen,
ment rather than stasis (Marcus 1995; Walker 2010; Hine             e.g., Facebook groups or Youtube video comment sections.
2015). Nonetheless, given the nature of the field and the           In this study, we concentrate solely on publicly accessible
communities studied in this project, where intrusion or par-        places and identify relevant places using four approaches:
ticipation of the researcher in community fora may have
an undue influence on online discussions, we opted to un-           • News stories identification. We use the search engines
dertake unobtrusive observations of conversations in public           of news content aggregators (e.g., Factiva, Media Cloud,
pages, forums, groups, and sites. In this sense, our approach         LexisNexis) to identify news stories containing keywords
can be considered a deep qualitative study rather than an             related to chosen topics in the titles. Next, we observe
ethnographic analysis, which usually requires visibility and          the user comments on the articles. Finally, we search so-
participation of the researcher (participant observation) in          cial media for postings that mention the news articles.
the community being studied (Baym and Markham 2009).                  The keyword terms were constantly updated in these early
However, the rest of the methodology introduced in this pa-           stages of data collection and during iterative processes of
per would work just as well with a proper ethnographic ap-            coding the data, until a consolidated list was composed
proach.                                                               (shown in Table 1).
                                                                    • Page monitoring. We actively monitor particular users,
Problematic speech Problematic speech is online inter-                pages, and Facebook groups found in the previous step.
actions, speech, and artifacts that are inaccurate, mislead-          We show the analysis of two such groups in Section 4.
ing, inappropriately attributed, or altogether fabricated (Jack
2017). The concept is intentionally broad enough to en-             • Cross-page discussion tracking. We follow links in post-
compass concepts like misinformation, disinformation, and             ings to discussions around the same topics on different
hate speech. Misinformation is a type of communication                Internet places, which we add to the list for tracking.
where falsehoods are unintentionally shared by users (Jack          • Exploiting recommendations. We explore social me-
2017, p. 2). Disinformation is information that is “deliber-          dia pages and accounts recommended by the platforms’
ately false and misleading” (Jack 2017, p. 3) and intended            recommender systems. While this introduces algorithmic
to manipulate users to a particular opinion or worldview.             bias in the sampling, this has been applied in prior lit-
Finally, hate speech refers to “any form of communica-                erature (Woolley and Howard 2016, 2018) to construct
tion in which others are attacked, denigrated, or intimi-             prospective pathways connecting like-minded users.
dated based on religion, ethnicity, gender, national origin,
or another group-based trait” (Warner and Hirschberg 2012;          An ontology to map online problematic speech. We col-
Hameleers, van der Meer, and Vliegenthart 2021). Prior lit-         lect and store information about four types of entities: topics,
erature suggests an intertwining of these forms of problem-         postings, Internet places and opinions. The topics are prede-
atic speech as efforts to denigrate outgroups are common to         termined, while the latter three emerge from the qualitative
online disinformation campaigns. Hameleers, van der Meer,           study. Note that the postings and Internet places are data
and Vliegenthart (2021) argue that “politically motivated,          discovered using the methodology described above, and the
partisan or ideological utterances in false information, such       opinions are the vocabulary describing the data. Opinions
as hate speech and incivility, may be an indicator of disin-        are defined as ideas expressed by a user in a posting. We
formation”.                                                         construct new opinions during the qualitative study and the
                                                                    data augmentation phase and alter old opinions through
Study design. Our qualitative study concentrates on dis-            merging or splitting. As a result, we obtain the opinions si-
courses and conversations about four topics manually se-            multaneously as the data is collected and labeled.
lected apriori: 2019-20 Australian bushfire season, Climate            Both the data (postings and Internet places) and the vo-
change, COVID-19, and Vaccination. We focus on three                cabulary (topics and opinions) are stored in an ontology, in
Table 1: Selected keywords for topics
1e+05
#postings (log)
Topics Selected keywords
bushfire, australian fires, arson, scottyfrommarketing, 1e+03
2019-20 Australian liarfromtheshiar, australiaburns, australiaburning, Overall
bushfire season, itsthegreensfault, backburning, back burning, Facebook
Climate change climate change, climate mergency, climate hoax, 1e+01 Twitter
climate crisis, climate action now
Youtube
covid, coronavirus, covid-19, pandemic,
n− 20
ct 19
ct 20
p− 19
−2 9
n− 19
p− 20
r− 20
− 0
b 20
l− 0
9
− 0
0
g− 19
g− 20
ec 1
ar 2
Ju 202
ov 1
ay 2
02
Covid-19, world health organization, vaccine, social distancing,
Ju 20
O 20
O 20
Se 20
D −20
Ja 0
Se 20
Ap 20
M −20
Fe 20
N 20
M 20
Au 20
Au 20
−2
−
l−
Vaccination quarantine, plandemic, chinavirus, wuhan, stayhome,
Ju
MadeinChina, ChinaLiedPeopleDied, 5G, chinacentric
Figure 2: Weekly volumes of collected postings overall
(dashed) and from Facebook, Twitter and Youtube (solid).
Resource Description Framework (RDF) format (Brickley,
Guha, and Layman 1999). Each entry is a triplet linking two
entities — e.g., a posting contains an opinion, or an opinion
is linked to a topic. If, for example, a posting contains more UN wants to make Opinion classifier of
Opinion: “Climate
change is a UN
Australia an Topic: topic “COVID-19”
than one opinion, we use multiple triplets, one for each rela- experimental state for COVID-19 hoax”
tion. We use Wikibase1 as the project’s collaborative appli- climate change. We the
people must NOT accept
this bullshit anymore
cation for data input and exploration. Wikibase offers a user from them or our
government. Period!
interface to enter new information and connect to existing Opinion: “Climate
Opinion classifier of
data (e.g., a new posting expressing an existing opinion); a Topic: “Climate
change”
topic ”Climate
change”
change crisis isn't
real”
navigational tool to explore the links connecting the data;
and an API to search and access the data based on SPARQL
…
…
…
queries.
Postings Topic classifiers Opinion classifiers Opinion labels
2.2 Unlabeled Data Collection Figure 3: An example of the classification of unlabeled post-
One of the shortcomings of the deep qualitative study is ings with the topic classifiers and opinion classifiers.
the limited representativeness of the gathered data. This sec-
tion describes the collection of postings at scale via keyword
search. we want to leverage the previously collected unlabeled data
For each of the four topics, the qualitative study identi- to create a labeled dataset with better diversity compared to
fied a set of keywords (shown in Table 1). The keywords the data issued from the qualitative study. Second, given the
were selected manually based on their frequencies and im- size of our unlabeled dataset, we want to maintain the man-
portances in qualitative studies. Due to the overlap in the ual labeling effort as limited as possible. We opt to enrich
messaging between Australian bushfires and climate change the dataset iteratively by involving annotation experts and
on one side, and Covid-19 and vaccination on the other side, machine classifiers. We denote the labeled and unlabeled
we present them in two groups. We use these keywords to datasets as Li and Ui , respectively, where i indicates the it-
search and crawl postings and comments from Facebook eration number and i = 0 is the initial dataset labeled via
(using Crowdtangle2 ) and Twitter (using the Twitter com- qualitative analysis.
mercial APIs). We further use a customized crawler to gather Two levels of classifiers. Our schema has two levels of
comments from specific public Facebook pages and groups. connections: a posting is associated with one or more opin-
Finally, we use the YouTube API to obtain comments from ions, and opinions are connected to topics, where the opin-
the Youtube videos mentioned in the Facebook postings. ions are constructed via qualitative studies in Section 2.1.
We obtained a total of 13, 321, 813 postings — 11, 437, 009 Given this hierarchical structure between opinion and topic
Facebook postings, 1, 793, 927 tweets and 90, 877 Youtube labels, we deploy two levels of binary classifiers
comments. Our dataset extends from July 2019 until October
2020, and Figure 2 shows the weekly volumes of collected • At the first level, for a posting x we construct the topic
postings. Note that, for Twitter, we acquired data relating to x) (yˆt ∈ {0, 1}) which determine
classifiers yˆt = ft,i (x
two time periods: Dec. 2019 – Feb. 2020 (during the 2019- whether the posting x is about the topic t, with the clas-
2020 Australian bushfire season) and March-May 2020 (the sifier trained on Li . Note that we build one classifier for
starting phase of Covid-19). each topic, and a posting can be associated with multiple
topics. It can also have no topic when yˆt = 0, ∀t = 1..4.
2.3 Dataset Augmentation These are off-topic postings.
Here, we describe the process of augmenting the labeled • At the second level, we construct a multi-label opinion
dataset. The augmentation process has two mandates. First, classifier for each topic trained with only the opinions as-
sociated with a given topic. We note that the opinoin clas-
1
https://wikiba.se/ sifiers are only trained and applied for quantitative analy-
2
https://www.crowdtangle.com/ sis in Section 5.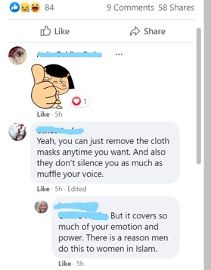
We present a classification example in Figure 3 where an             Table 2: Cross-validation performance comparison of differ-
unlabeled posting is first determined to be about Climate            ent classification models on labeled data L0 . Macro accuracy
change by the topic classifiers and is then tagged with the          and F1 scores are averaged over all topics.
opinion Climate change is a UN hoax. We argue that the pro-
posed scheme with two levels of classifiers is more robust to                                        Random Forest          SVM        XGBoost               RoBERTa
offtopic postings, as the multi-label opinion classifier is pre-      Macro Accuracy                             0.791      0.775              0.779             0.800
sented only with relevant postings. Furthermore, a posting                  Macro F1                             0.782      0.768              0.768             0.800
can be associated with multiple topics and opinions.
Unlabeled data sampling. The process of retraining clas-             Table 3: Statistics of the labeled datasets L0 and L7 in topics
sifiers takes non-trivial times, especially for deep learning        and opinions.
based classifiers, whereas it is desired to maintain continu-                        Aus. Bushfire   Climate change   Covid-19   Vaccination    Off-topic     Total unique
ous labeling time windows for the coders. Therefore, at each                   L0             189              387        263           220             0             614

                                                                      #posts
iteration, we select a batch of unlabeled postings for manual                  L7             287              592        477           335            480           1381
annotation to augment the labeled data. Within each post-                      L0              16               31         29            22              /             65

                                                                      #opin.
ing batch, we aim to balance the exploitation of previously                    L7              16               33         34            26              /             71
labeled data (i.e., the classifiers trained at the previous itera-
tion) and the exploration of unlabeled data. We employ three
strategies to select postings at the current iteration, Xi
                                                                     Iterations and convergence. We obtain a set of newly an-
 • Active learning strategy selects for labeling the post-           notated postings at the end of each complete iteration that
   ings of which the classifiers are least certain of. It im-        includes data sampling, expert annotation, and re-training
   proves classification performance by selecting unlabeled          the classifiers. For each iteration, we compute the expected
   data around the decision boundary of the learned clas-            generalization error via cross-validation, and we evaluate the
   sifier (Settles 2012). Specifically, we adopt uncertainty         test error on a dedicated test dataset. We note that the test
   sampling in our experiments where uncertainty is defined          dataset was randomly sampled from the same unlabeled data
   as (Tran, Ong, and Wolf 2018):                                    and annotated before the dataset augmentation. It is kept
                      x) = 1 − p(ŷ | x ; ft,i )
                    u(x                                       (1)    fixed across iterations and never used in training. We then re-
                                                                     peat the dataset augmentation process for several iterations
  where ŷ is the predicted label of the candidate x under           until the convergence of two indicators:
  classifier ft,i . We choose candidates with the highest un-
                                                                     • The first indicator is the difference between cross-
  certainty values and denote this set as XiA .                        validation error and test set error. An increasingly smaller
• Top confidence strategy chooses from unlabeled data                  error indicates that the classifiers are more representative
  where trained classifiers produce the highest confidence             of the larger, unlabeled dataset.
  scores, i.e., p(ŷ | x ; ft,i ). This strategy enriches our
                                                                     • The second indicator is the gain of performance on the
  dataset with data related to the chosen topics, allowing
                                                                       test set between two iterations.A decreasing gain between
  us to deepen the qualitative study. We denote this subset
                                                                       iterations shows that the marginal utility of new annota-
  as XiT .
                                                                       tions is increasingly smaller.
• Random sampling strategy favors a completely random
  exploration by uniformly selecting a set of postings from          The iterative process stops when an insignificant gain is
  the unlabeled data. Although there is a high likelihood of         made between two consecutive iterations.
  selecting off-topic postings, the strategy allows uncover-
  ing discussions of interest that may lie far from the initial                       3      Dataset Augmentation Results
  qualitative analysis. Similar ideas have been employed in          This section presents the prediction setup and the results ob-
  other fields — e.g., in reinforcement learning, a probabil-        tained for our proposed human-in-the-loop dataset augmen-
  ity of  is usually reserved for the Q-learning algorithm          tation.
  to explore random actions (Mnih et al. 2013). We denote
  this subset as XiR .                                               3.1            Experimental Setups
Expert annotation. At each iteration, the same team                  Textual classifier selection. We predict the topics and
members, who performed the qualitative analysis, label the           opinions of postings using textual classifiers. We test four
postings returned by the sampling process (Section 2.3). The         such classifiers. The first is the state-of-the-art deep learn-
predicted labels from the classifiers are hidden during man-         ing method, RoBERTa (Vaswani et al. 2017; Liu et al.
ual labeling. This ensures that the human decisions are not          2019), which achieves the best performance. The other three
affected by the algorithmic predictions. The human experts           are traditional classifiers — including Random Forest (RF)
inspect both the text and original contexts of given post-           (Breiman 2001), Support Vector Machine (SVM) (Chang
ings — such as the complete discussions and other meta-              and Lin 2011) and XGBoost (Chen and Guestrin 2016) —
data (e.g., the videos from Youtube) — before choosing an            which use an n-gram-based vectorial representation, where
existing opinion (or constructing a new opinion) to label a          features are weighted with Term Frequency Inverse Docu-
posting as described in Section 2.1.                                 ment Frequency (TF-IDF) (Rajaraman and Ullman 2011).
Accuracy F1
We use the implementation of these algorithms from the 1.0
●
●
●
●
●
●
●
●
● ● ●
●
● ● ●
Python libraries scikit-learn (Pedregosa et al. 2011) and 0.9 ●
● ● ● ●
●
● ●
0.6 ●
●
●
●
●
● ● ●
● ●
● ● ● ● ● ● ● ● ●
0.8 ● ●
transformers (Wolf et al. 2020). 0.7
● ●
● ●
●
2019−20 Australian bushfire season
climate change
0.4
●
●
●
● ● ●
● ●
We compare the prediction performance of these models 0.6 ●
●
●
●
Covid−19
vaccination
0.2 ● ●
on the L0 labeled dataset (issued from the qualitative study). 0 1 2 3 4 5 6 7 0 1 2 3 4 5 6 7
We show in Table 2 the macro accuracy and F1 scores ob-
Batch No.
tained via 5-fold cross-validations. The hyper-parameters
are selected via the nested 5-fold cross-validation and ran- (a)
Macro Accuracy Macro F1
dom search. Visibly, RoBERTa outperforms all other models ● ● ● 0.8 ● ● ●
0.9 ● ●
●
● ●
●
● ●
in both macro accuracy and macro F1 scores. Therefore, in ●
●
●
●
●
● ●
●
●
●
●
0.7
● ● ● ●
0.8 ●
● ● 0.6 ●
the rest of this paper, we employ RoBERTa for classifying ●
● ● Cross−validation evaluation
● Evaluated on testset 0.5 ● ●
● ●
and sampling unlabeled data. 0.7
●
HITL ML strategies
random postings
0.4 ●
●
●
● ●
●
0 1 2 3 4 5 6 7 0 1 2 3 4 5 6 7
Iteration setups. The test dataset Xtest used for evalua-
tion contains 114 labeled Facebook postings. Xtest is only Batch No.
used in the convergence evaluation and is kept fixed between
(b)
iterations. To keep bounded the human annotation effort, we
limit each iteration to 100 postings. Specifically, topic clas- Figure 4: Convergence of topic classifier performances over
sifiers are used for sampling unlabeled data where, for each seven iterations. (a) Evaluation by topics on test set and (b)
of the four topic, we sample |Xi | = |XiA | + |XiT | + |XiR | = macro-aggregated over all topics on test set and via cross-
10 + 10 + 5 = 25 posts from Ui−1 . Note that XiA , XiT validation.
and XiR are the sets of samples selected at iteration i using
the three strategies introduces in Section 2.3. Also note that
identical postings may be selected multiple times for differ- in the left panel, and F1 score on the right panel), over iter-
ent topics. ations 0 to 7. The solid lines in Figure 4b show the perfor-
In total, we conduct 7 iterations of augmentation until we mance indicators macro-averaged over topics, together with
observe convergence in classification performance on Xtest the cross-validation generalization error (see the iterations
(see convergence analysis in Section 3.2). The first 4 itera- and convergence discussion in Section 2.3).
tions sampled only Facebook postings as this is the promi-
All indicators show that prediction performance improves
nent source in our dataset and most used social media in
over subsequent iterations, with the topic 2019-20 Aus-
Australia (Newman et al. 2020). After the 5th iteration, we
tralian bushfire season demonstrating the fastest growth.
introduced the other two data sources, Twitter and Youtube.
Both accuracy and F1 scores on the test data converge fast
3.2 Augmentation Results in the first 3 − 4 iterations, while improvements from the
subsequent iterations are limited. This suggests a reduced
Augmented dataset statistics. We compare in Table 3 the marginal utility of the later iterations. Notably, the perfor-
number of postings and opinions between the dataset con- mance gain is null between iterations 6 and 7, suggesting
structed by the qualitative analysis (L0 ) and the final labeled that the procedure has converged. Consequently, we stopped
dataset after the seventh iteration (L7 ). L7 contains 1, 381 the data augmentation process after the seventh iteration.
postings and 71 opinions, which is more than double those In particular, the cross-validation performance is stable
of L0 (614 postings and 65 opinions). We note that Climate across iterations. This is expected, as the classifiers learn
change is the most prevalent topic in the dataset (592 post- from the same data on which the generalization is estimated
ings in L7 ) while Austalian bushfire is the least (287 post- — i.e., the classifiers are representative for the data they
ings). were trained on. However, the difference between the test
Emergence of new opinions. During the data augmen- set performance and cross-validation performance is indica-
tation process, the experts continuously evolved the opin- tive of the representativity over the entire dataset. The cross-
ion set in addition to labeling new data. For example, opin- validation accuracy is consistently lower than the test set ac-
ions such as “Covid-19 is a plague sent by God” were de- curacy because the test data is more imbalanced than labeled
tected and reinforced by the data sampling strategies. Simi- data. The cross-validation F1 is more optimistic than the test
larly, the data sampled uncovered a longer duration of opin- set F1. Finally, the difference between the two stabilizes for
ions than the range explored by the experts in the qualita- the later iterations, further suggesting the convergence.
tive study. These provided the qualitative researchers with
a long-term perspective about how opinions emerge tempo- Baseline comparison. In addition, we compare the dis-
rally (see more detailed analysis in Section 5). Overall, Ta- cussed sampling strategies with a baseline scenario where
ble 3 shows that 6 new opinions have emerged between L0 we code an equal amount of postings that were all randomly
and L7 . We refer to Appendix A for a complete list of opin- sampled. We then fit classifiers with these random post-
ions and their numbers at L0 and L7 . ings in iterations and present the prediction performance on
the same test set as a dotted line in Figure 4b. The macro
Convergence analysis. Figure 4a shows the prediction accuracy and F1 scores show gaps between the proposed
performance on the test set Xtest , for each topic (accuracy method and the baseline labeling scenario, indicating the ad-vantage of applying the chosen data augmentation strategies, of these comments. The language used was similar to com-
especially the active learning strategy (Tran, Ong, and Wolf ments that we observed on numerous far-right nationalist
2018). pages at the time of the bushfires. These comments are usu-
ally text-based, employing emojis to denote emotions, and
4 Case Studies sometimes being mocking or provocative in tone. Notewor-
thy for this commenting thread is the 50/50 split in the num-
In this section, we present a case study of Facebook posts
ber of members posting in favor of action on climate change
from an Australian public page. The page shifts between
(on one side) and those who posted anti-Greens and anti-
early 2020 (2019-2020 Australian bushfire season) and late
climate change science posts and memes (on the other side).
2020 (COVID-19 crises) from being a moderate-right group
The two sides aligned strongly with political partisanship
for discussion around climate change to a far-right extremist
— either with Liberal/National coalition (climate change
group for conspiracy theories.
deniers) or Labor/Green (climate change believers) parties.
We focus on a targeted sample of 2 postings and com- This is rather unusual for pages classified as far-right.
menting threads from one Australian Facebook page we
classified as “far-right” based on the content on the page. We observed trolling practices between the climate
We have anonymized the users in Figure 5 to avoid re- change deniers and believers, which often descend into
identification. The first posting and comment thread (see flame wars — i.e., online “firefights that take place
Figure 5a) was collected on Jan 10, 2020, and responded between disembodied combatants on electronic bulletin
to the Australian bushfire crisis that began in late 2019 and boards” (Bukatman et al. 1994). The result is a boosted en-
was still ongoing in January 2020. It contains an ambivalent gagement on the post but also the frustration and confusion
text-based provocation that references disputes in the com- of community members and lurkers who came to the discus-
munity regarding the validity of climate change and climate sions to become informed or debate rationally on key differ-
science. ences between the two positions. They often even become
targeted, victimized, and baited by trolls on both sides of the
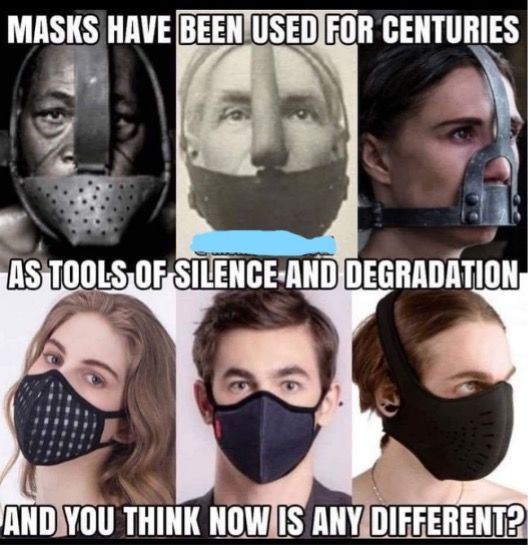
The second posting and comment thread (see Figure 5c)
partisan divide. The opinions expressed by deniers in com-
was collected from the same page in September 2020,
menting sections range from skepticism regarding climate
months after the bushfire crisis had abated. At that time,
change science to plain denial. Deniers also regard a range
a new crisis was energizing and connecting the far-right
of targets as embroiled in a climate change conspiracy to de-
groups in our dataset — i.e., the COVID-19 pandemic and
ceive the public, such as The Greens and their environmental
the government interventions to curb the spread of the virus.
policy, in some cases the government, the United Nations,
The post is different in style compared to the first. It is
and climate change celebrities like David Attenborough and
image-based instead of text-based and highly emotive, with
Greta Thunberg. These figures are blamed for either exag-
a photo collage bringing together images of prison inmates
gerating risks of climate change or creating a climate change
with iron masks on their faces (top row) juxtaposed to people
hoax to increase the influence of the UN on domestic gov-
wearing face masks during COVID-19 (bottom row). The
ernments or to increase domestic governments’ social con-
image references the public health orders issued during Mel-
trol over citizens.
bourne’s second lockdown and suggests that being ordered
to wear masks is an infringement of citizen rights and free- Both coders noted that flame wars between these oppos-
doms, similar to dehumanizing restraints used on prisoners. ing personas contained very few links to external media.
To analyze reactions to the posts, two researchers used Where links were added, they often seemed disconnected
a deductive analytical approach to separately code and to from the rest of the conversation and were from users whose
analyze the commenting threads — see Figure 5b for com- profiles suggested they believed in more radical conspir-
ments of the first posting, and Figures 5d and 5e for com- acy theories. One such example is “geo-engineering” (see
ments on the second posting. Conversations were also induc- Fig. 5b). Its adherents believe that solar geo-engineering
tively coded for emerging themes. During the analysis, we programs designed to combat climate change are secretly
observed qualitative differences in the types of content users used by a global elite to depopulate the world through ster-
posted, interactions between commenters, tone and language ilization or to control and weaponize the weather.
of debate, linked media shared in the commenting thread, Nonetheless, apart from the random comments that hi-
and the opinions expressed. The rest of this section further jack the thread, redirecting users to external “alternative”
details these differences. To ensure this was not a random oc- news sites and Twitter, and the trolls who seem to delight in
currence, we tested the exemplar threads against field notes victimizing unsuspecting victims, the discussion was pretty
collected on the group during the entire study. We also used healthy. There are many questions, rational inquiries, and
Facebook’s search function within pages to find a sample debates between users of different political persuasion and
of posts from the same period and which dealt with similar views on climate change. This, however, changes in the span
topics. After this analysis, we can confidently say that key of only a couple of months.
changes occured in the group between the bushfire crisis and
COVID-19, that we detail next. Exemplar 2 — posting and commenting thread. We ob-
serve a shift in the comment section of the post collected
Exemplar 1 — climate change skepticism. To explore during the second wave of the COVID pandemic (Figure 5c)
this transformation in more depth, we analyzed comments — which coincided with government laws mandating the
scraped on the first posting — Fig. 5b shows a small sample public to wear masks and stay at home in Victoria, Aus-(a)
(c) (d) (e)
(b)
Figure 5: Examples of postings and comment threads from a public Facebook page from two periods of time early 2020 (a) and
late 2020 (b)-(e), which show a shift from climate change debates to extremist and far-right messaging.
tralia. There emerges much more extreme far-right content well-established antisemitic blood libel conspiracy theories,
that converges with anti-vaccination opinions and content. which foster beliefs that a powerful global elite is controlling
We also note a much higher prevalence of conspiracy theo- the decisions of organizations such as WHO and are respon-
ries often implicating racialized targets. This is exemplified sible for the vaccine rollout and public health orders related
in the comments on the second post (Figures 5d and 5e) to the pandemic. The QAnon conspiracy is also influenced
where Islamophobia and antisemitism are confidently as- by Bill Gates’ Microchips conspiracy theory, i.e., the theory
serted alongside anti-mask rhetoric. These comments con- that the WHO and the Bill Gates Foundation global vaccine
sider face masks similar to the religious head coverings worn programs are used to inject tracking microchips into people.
by some Muslim women, which users describe as “oppres- These conspiracy theories have, since COVID-19, con-
sive” and “silencing”. In this way, anti-maskers cast women nected formerly separate communities and discourses, unit-
as a distinct, sympathetic marginalized demographic. How- ing existing anti-vaxxer communities, older demographics
ever, this is enacted alongside the racialization and demo- who are mistrustful of technology, far-right communities
nization of Islam as an oppressive religion. suspicious of global and national left-wing agendas, com-
Given the extreme racialization of anti-mask rhetoric, munities protesting against 5G mobile networks (for fear
some commenters contest these positions, arguing that the that they will brainwash, control, or harm people), as well
page is becoming less an anti-Scott Morrison page (Aus- as generating its own followers out of those anxious during
tralia’s Prime Minister at the time) and changing into a page the 2020 onset of the COVID-19 pandemic. We detect and
that harbors “far-right dickheads”. This questioning is ac- describe some of these opinion dynamics in the next section.
tively challenged by far-right commenters and conspiracy
theorists on the page, who regarded pro-mask users and the 5 Opinion Analysis
Scott Morrison government as “puppets” being manipulated This section first examines the relative importance of opin-
by higher forces (see Figure 5e). ions in online discussions, obtained from a large sample of
This indicates a significant change on the page’s member- machine-labeled postings. This allows the application of the
ship towards the extreme-right, who employs more extreme qualitative-defined coding schema to a significantly larger
forms of racialized imagery, with more extreme opinion be- sample of postings, reducing the unavoidable selection bias
ing shared. Conspiracy theorists become more active and of the deep qualitative study. Next, we study the dynamics
vocal, and they consistently challenge the opinions of both of opinion co-occurrences. We note that, due to large over-
center conservative and left-leaning users. This is evident in laps in posting times and similarities in topics, the analy-
the final two comments in Figure 5e, which reflect QAnon sis of opinions in this section is conducted on two topic
style conspiracy theories and language. Public health orders groups: 2019-20 Australian bushfire season, climate change,
to wear masks are being connected to a conspiracy that all and Covid-19, vaccination (also shown in Table 1).
of these decisions are directed by a secret network of global Experimental setups. After completing the last iteration of
Jewish elites, who manipulate the pandemic to increase their dataset augmentation (L7 ), we have trained topic and opin-
power and control. This rhetoric intersects with the contem- ion classifiers (see Section 2.3). We apply these classifiers to
porary “QAnon” conspiracy theory, which evolved from the the complete unlabeled dataset, which contains 22, 965, 816
“Pizzagate” conspiracy theory. They also heavily draw on postings in total. The vast majority of these (21, 266, 038)1.00
Mainstream media cannot be trusted a Conspiracy opinions co-occurred with it. The edges are weighted by the
Covid−19 is a scam/plan of the elites a Other number of postings in which their connected node opinions
0.75 Climate change crisis isn't real co-occurred.
Frequency (#postings)
5G/smart tech is unsafe/a scam/ We first investigate the evolution of opinion co-
a way of controlling people
0.50 occurrences. In Figure 7, we plot the daily proportions of
China is responsible for Covid−19
Covid-19 is a government tool for
weights of each edge among all edges between September
0.25 surveillance & control of citizens 2019 and January 2020. We manually selected six edges
(i.e., opinion pairs) to represent three types of temporal dy-
0.00
namics:
Opinion • A continuous and relatively strong association between
prevalent opinions — “Climate change crisis isn’t real”
Figure 6: The usage frequency of each of opinions in a large
and “Climate change is a UN hoax”, which not notably is
sample of machine-labeled data shows a long-tail distribu-
a conspiracy theory.
tion. Four of the top six opinions endorse a conspiracy the-
ory (shown in gray). • Associations with declining relative frequencies —
“Greta Thunberg should not have a platform or influence
as a climate...” and “Women and girls don’t deserve a
are off-topic — i.e., with no opinion associated. This is ex- voice in the public sphere”.
pected given the broad keyword sampling of our unlabeled • Rising associations such as “bushfires and climate change
dataset. The remainder of 1, 699, 778 postings are labeled not related” and “bushfires were caused by random arson-
with at least one opinion, and 313, 720 postings were asso- ists”; and also the conspiracy theory associations between
ciated with more than one opinion. This creates 2, 089, 336 “United Nations is corrupt” and “United Nations want to
posting-opinion relations, which we use in the rest of this be the global ruling government”.
section to analyze the dynamics of opinions. We manually
identify the opinion labels that relate to conspiracy theories Given the theoretical importance of conspiracy theories
and we discuss them in the experimental results. and our observations in Figure 6, we plot the temporal vari-
ation of three centrality measures (betweenness, closeness,
5.1 Opinion Frequency Distribution and node degrees) of the opinion co-occurrence network for
We show in Figure 6 the frequency distribution of opinions conspiracy and non-conspiracy opinions in Figure 8. We also
in the machine-labeled data. Unsurprisingly (in hindsight), compare it to the attention dedicated to the bushfire story
the size distribution for opinions is long-tailed, commonly during the same period by the Australian news media. The
emerging in online measurements. This translates into a rela- news coverage ratio is crawled from Media Cloud (Roberts
tively small number of opinions monopolizing the online de- et al. 2021). At times conspiracy opinions can achive on av-
bate. Perhaps more surprisingly, most of the prevalent opin- erage a higher betweenness score. In the online conversa-
ions are linked to conspiracy theories; four among the top tion during the Australia bushfires, a significantly higher be-
six most popular opinions are conspiracy theories, includ- tweenness in September and then again in November during
ing “Covid-19 is a scam/plan of the elites” (2nd most fre- the first surge in news media attention. This suggests that
quent opinion), “5G/smart tech is unsafe/a scam/a way of conspiracy opinions, if not among the most frequently de-
controlling people” (4th), “China is responsible for Covid- tected, are still expressed in conjunction with a high number
19” (5th), and “Covid-19 is a government tool to increase of other opinions, especially fringe and peripheral opinions.
the powers of the state and surveillance/control of citizens” It also shows that conspiracy theories are well suited to ex-
(6th). This showcases the advantages of our mixed-method plain and rationalize several contested opinions.
approach: the qualitative study identified the importance of Eventually, in Figure 9, we map the co-occurrence net-
conspiracy theories in the online debate; still, it could not as- work from posts published over 14 days in late September
sess the scope of their relative importance. We further show 2019, i.e., the period when the betweenness for conspiracy
in (Appendix 2021) the daily relative frequency of top opin- opinions is at peak. This figure explains the ambivalent net-
ions. work role that conspiracy opinions can play: we first note
a conspiracy opinion with relatively high degree and fre-
5.2 Dynamics and Centrality in Opinion quency — “Climate change is a UN hoax” —, while we
Networks also observe the presence of low degree but high between-
ness conspiracy opinions at the periphery of the network —
It is common when postings express multiple opinions. Such
“Bushfires linked to secret elites’ secret technology (chem-
co-occurred opinions help identify central opinions, which
trails, HAARP, HSRN, geoengineering)”, “bushfires delib-
usually spawn new emerging opinions. Here we explore this
erately lit to promote a climate change agenda” and “Aus-
by building an opinion co-occurrence network in the online
tralia should not be a member of the United Nations”.
conversation of the topic 2019-20 Australian bushfire sea-
son. In the network, nodes are the 27 opinions captured dur-
ing the bushfire conversation, while edges are present when 6 Related Work
both opinions are detected in the same postings. The node Several datasets (Wang 2017; Shu et al. 2018; Hasan, Alam,
degree of a given opinion node represents the number of and Adnan 2020) on problematic speeches have been made2019−2020 Australian bushfires and climate change not related 2019−2020 Australian bushfires and climate change not related Climate change crisis isn't real
2019−2020 Australian bushfires were caused by random arsonists Climate change crisis isn't real Climate change is a UN hoax
0.10
0.05
0.00
Climate change crisis isn't real Greta Thunberg should not have a platform or influence as a climate change activist United Nations is corrupt
Mainstream media cannot be trusted Women and girls don't deserve a voice in the public sphere United Nations want to be the global ruling government
0.10
0.05
0.00
p
ec
p
ec
p
ec
ov
ov
ov
b
b
b
n
n
n
ct
ct
ct
Se
Se
Se
Fe
Fe
Fe
Ja
Ja
Ja
O
O
O
N
N
N
D
D
D
Figure 7: Daily proportions of edge weights of six selected co-occurred opinions pairs.
30
betweenness
available recently. Among these, Wang (2017); Shu et al.
20
(2018) crawled and used labels from existing fact-checking
10
0
sites (e.g., POLITIFACT3 ), whereas Hasan, Alam, and Ad-
nan (2020) employed an active learning component in their
closeness
0.020
0.015
pipeline with a goal of maximizing the accuracy of fake
0.010
news detection.
Conspiracy
3000
News story ratio of the bushfire
Such HITL machine learning algorithms have been
degree
2000
Other widely applied for building datasets in various applications,
1000
including sentiment analysis (Mozafari et al. 2014), com-
0.25
0.20 puter vision (Vijayanarasimhan and Grauman 2011) and
news ratio
0.15
0.10 medical image classification (Hoi et al. 2006). Wang et al.
0.05 (2021) provide a comprehensive review of applying HITL
0.00
Sep 2019 Oct 2019 Nov 2019 Dec 2019 Jan 2020 Feb 2020 methods to natural language processing tasks, in which they
stress the importance of designing both quantitative and
Figure 8: Temporal evolution of statistics of the opinion co- qualitative methods to evaluate human feedback for com-
occurrence network and news coverage ratios from Media plex feedback types. In particular, Chen et al. (2018) propose
Cloud (Roberts et al. 2021). to identify ambiguity in qualitative coding via active learn-
ing, which is the most relevant work to ours. In this paper,
Children should not speak
Climate change isn't man
we extend the method by introducing two other strategies to
as authorities on themselves
or their world, because made balance exploration and exploitation.
they are children Overall, our study differs from prior works by highlight-
Climate change is a UN United Nations is corrupt
ing the benefits of deploying HITL algorithms to accelerate
● qualitative studies on online problematic speeches. The aug-
2019−2020 Australian bushfires ●
hoax
Women and girls don't
● deserve a voice in the mented data in this paper exposes us to a richer context of
deliberately lit to promote
public sphere ●
a climate change agenda problematic discussions where we can identify trajectories
Greta Thunberg should of opinion evolutions (in Section 5).
not have a platform or Climate change crisis
influence as a climate isn't real
Australia should not be
change activist
a member of the United 7 Conclusion
● Nations
● In conclusion, this work proposed a solution that fills the gap
2019−2020 Australian bushfires
linked to secret elites' between qualitative and quantitative analysis of problematic
● technology (chemtrails,
online speech. We constructed an ontology (using Wikibase)
HAARP, HSRN, geoengineering) ●
which was initially populated through a qualitative study.
● Conspiracy Other
The latter emerged from both the vocabulary of annotations
0 25 50 75100125 (the opinions expressed in topics) and collected labeled data
from three online social network platforms (Facebook, Twit-
Figure 9: A visualization of the co-occurrence network in ter, and Youtube). Next, we collected a large dataset of social
late September 2020 — node sizes and colors indicate the media data using keyword search. Finally, we augmented the
degrees and betweenness values. 3
https://www.politifact.comlabeled dataset using a human-in-the-loop machine learning Brickley, D.; Guha, R. V.; and Layman, A. 1999. Resource
algorithm. We presented two in-detail case studies with ob- description framework (RDF) schema specification .
servations of problematic online speech which evolved on an Bruns, A.; Harrington, S.; and Hurcombe, E. 2020.
Australian far-right Facebook group. Using our quantitative “Corona? 5G? or both?”: the dynamics of COVID-19/5G
approach, we analyzed how problematic opinions emerge conspiracy theories on Facebook. Media International Aus-
over time and how they co-occur. tralia .
Limitations. The present study has several limitations, Bukatman, S.; Laidlaw, M.; Schwenger, P.; and Sobchack,
which we group into data and methodological limitations. V. 1994. Flame wars: the discourse of cyberculture. Duke
The data limitations are mainly related to the human la- University Press.
beling bias, considered platforms and posting accessibility.
Chang, C.-C.; and Lin, C.-J. 2011. LIBSVM: a library for
The initial qualitative study is conducted by the team mem-
support vector machines. ACM TIST .
bers, which may suffer from human labeling bias. Second,
this study concentrates on three platforms (Facebook, Twit- Chen, N.-C.; Drouhard, M.; Kocielnik, R.; Suh, J.; and
ter, and Youtube), and Facebook makes most of our data Aragon, C. R. 2018. Using machine learning to support
sample. However, all three are mainstream platforms; prob- qualitative coding in social science: Shifting the focus to am-
lematic speech also occurs outside these platforms, and fu- biguity. TiiS .
ture work would need to account for platforms like 8chan or Chen, T.; and Guestrin, C. 2016. Xgboost: A scalable tree
gab. Last, our study only leverages public postings — we do boosting system. In KDD.
not access the private conversations for technical and ethical
reasons. Colley, T.; and Moore, M. 2020. The challenges of studying
We mention four methodological limitations. First, the 4chan and the Alt-Right:“Come on in the water’s fine”. New
quality of the classifier is inferior to any human coder. Yet, Media & Society .
this is a marginal problem when the goal is not to correctly Dixon, A.; Liu, Y.; and Setchi, R. 2016. Computer-
label each posting but instead to capture patterns across a Aided Ethnography in Engineering Design. In IDETC-CIE.
large number of postings. Second, the definition of the set ASME.
of Internet sources where the data collection occurs remains
critical in determining how representative the sample still is; Glaeser, E. L.; and Sunstein, C. R. 2009. Extremism and
a larger set of Internet places might not address the selection social learning. Journal of Legal Analysis .
bias (if they are all selected the same way). Third, the em- Hameleers, M.; van der Meer, T.; and Vliegenthart, R. 2021.
ployed sampling strategies for augmenting the dataset may Civilized truths, hateful lies? Incivility and hate speech in
suffer from the sampling bias. Last, by design, the classi- false information–evidence from fact-checked statements in
fiers we have deployed cannot identify opinions that were the US. Information, Communication & Society .
not identified during the qualitative study. Future research Hasan, M. S.; Alam, R.; and Adnan, M. A. 2020. Truth or
could apply dynamic predictive models designed to capture Lie: Pre-emptive Detection of Fake News in Different Lan-
the label distribution shift and construct an active set of la- guages Through Entropy-based Active Learning and Multi-
bels. model Neural Ensemble. In ASONAM. IEEE.
References Hine, C. 2015. Ethnography for the Internet. Routledge.
Appendix. 2021. Appendix: Slipping to the Extreme: A Hoi, S. C.; Jin, R.; Zhu, J.; and Lyu, M. R. 2006. Batch
Mixed Method to Explain How Extreme Opinions Infiltrate mode active learning and its application to medical image
Online Discussions. Submitted as the supporting document. classification. In ICML.
Bailo, F. 2020. Online Communities and Crowds in the Rise Jack, C. 2017. Lexicon of lies: Terms for problematic infor-
of the Five Star Movement. Springer. mation. Data & Society .
Baym, N. K. 2015. Personal connections in the digital age. Johns, A. 2020. “This will be the WhatsApp election”:
John Wiley & Sons. Crypto-publics and digital citizenship in Malaysia’s GE14
election. First Monday .
Baym, N. K.; and Markham, A. N. 2009. Making smart
choices on shifting ground. Internet Inquiry: Conversations Kim, D.; Graham, T.; Wan, Z.; and Rizoiu, M.-A. 2019.
about Method . Analysing user identity via time-sensitive semantic edit dis-
tance (t-SED): a case study of Russian trolls on Twitter.
Bode, L.; and Vraga, E. K. 2018. See something, say some- Journal of Computational Social Science .
thing: correction of global health misinformation on social
Lin, J.; and Kolcz, A. 2012. Large-scale machine learning at
media. Health communication .
twitter. In MOD.
Boyd, D. 2010. Social network sites as networked publics:
Liu, Y.; Ott, M.; Goyal, N.; Du, J.; Joshi, M.; Chen, D.;
Affordances, dynamics, and implications. In A networked
Levy, O.; Lewis, M.; Zettlemoyer, L.; and Stoyanov, V.
self. Routledge.
2019. Roberta: A robustly optimized bert pretraining ap-
Breiman, L. 2001. Random forests. Machine learning . proach. arXiv .You can also read