San Ysidro Community Plan Update Background Conditions Assessment and Market Analysis - Submitted to City of San Diego Development Services ...
←
→
Page content transcription
If your browser does not render page correctly, please read the page content below
bae urban economics

San Ysidro Community Plan Update
Background Conditions Assessment and Market Analysis
Submitted to City of San Diego Development Services, Planning Division
March 2012

                                                            1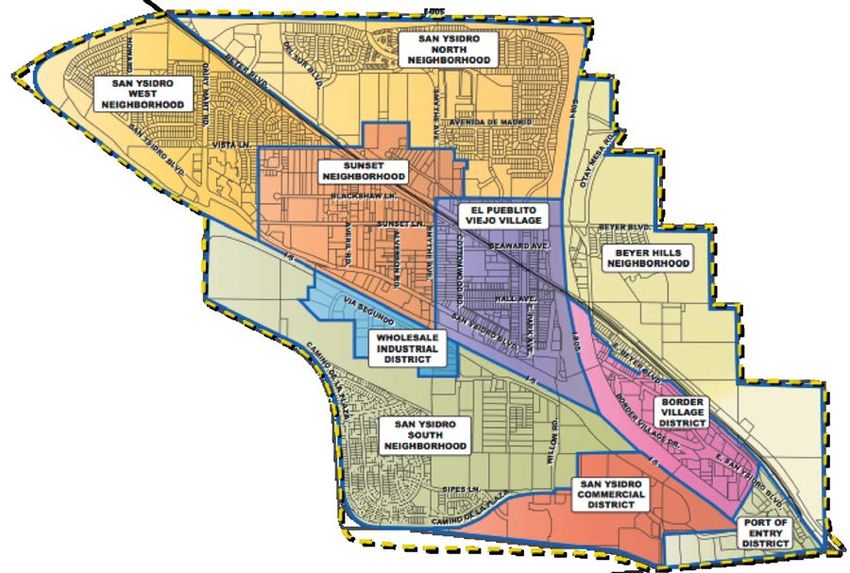
Table of Contents
INTRODUCTION .......................................................................................................................... 1
      Methodology ............................................................................................................................ 1
      History of San Ysidro Development ....................................................................................... 2
      Community Plan Area Context................................................................................................ 4
      Current Planning and Development Initiatives ..................................................................... 9
DEMOGRAPHIC AND ECONOMIC TRENDS............................................................................... 13
      Population and Household Trends...................................................................................... 14
      Economic Trends.................................................................................................................. 19
      Summary of Demographic and Economic Trends ............................................................. 30
REAL ESTATE MARKET CONDITIONS ....................................................................................... 31
      Market-Rate Residential Market ......................................................................................... 31
      Industrial and Flex Space Markets ..................................................................................... 40
      Office Market........................................................................................................................ 43
      Retail Market ........................................................................................................................ 44
DEMAND ESTIMATES BY LAND USE ........................................................................................ 46
      Demand for Housing ............................................................................................................ 46
      Demand for Retail, Hotel, Institutional, Office, and Industrial Space ............................... 48
CONCLUSIONS: MARKET OPPORTUNITIES .............................................................................. 53
      Summary of Overall Market Demand ................................................................................. 53
      Potential Market Opportunities by Subarea and District................................................... 54
APPENDIX A: MAP OF COMMUNITY PLAN AREA, CENSUS TRACTS, & ZIP CODES................... 57
APPENDIX B: STAKEHOLDERS INTERVIEWED FOR STUDY ..................................................... 58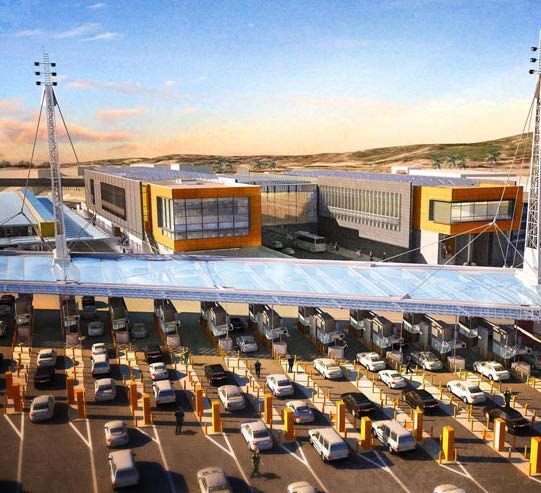
INTRODUCTION
This report has been prepared to support the San Ysidro Community Plan update process. It
provides an overview of demographic and economic trends and real estate market conditions for the
San Ysidro Community Plan Area (CPA), leading to estimates of potential future demand for
additional supportable development. This report is intended to inform the community, stakeholders,
and the City of San Diego and its consultants as community plan land use alternatives are prepared.
Future work by BAE will further support the community plan update by analyzing plan alternatives for
development feasibility and economic / fiscal impacts, preparing an Economic Prosperity Element,
and outlining financing strategies for plan implementation.

Methodology

The analysis and conclusions in this report were based on the following methodologies:
   • Demographic Trends. The City of San Diego maintains an extensive data library, and works
       closely with the San Diego Association of Governments (SANDAG) to prepare data for use in
       community plan updates. Thus, most of the data utilized in this report to describe
       demographic and economic conditions in San Ysidro was provided by the City of San Diego to
       BAE, and includes estimates specifically made by SANDAG for the San Ysidro Community
       Plan Area. It is important to note that these SANDAG estimates were prepared prior to the
       release of 2010 Census data, and may therefore overstate population growth and related
                                                                     1
       demographic trends for San Ysidro and the City of San Diego.
   • Economic Trends. Most of the data included in this report was provided by the City of San
       Diego to BAE. In some cases, the data is associated with confidentiality constraints, and is
       described in this report with those caveats.
   • Real Estate Market Conditions. The real estate market conditions section of this report is
       based on a blend of data provided by the City of San Diego to BAE, and other sources
       available to BAE, including private data vendors and primary research through phone
       interviews and field observations.
   • Estimates of Future Potential Market Demand. Every effort was made in this report to
       provide quantitative estimates of potential future market demand for new development in
       San Ysidro. However, it should be noted that market conditions are cyclical, and the long-
       awaited real estate market recovery has not yet uniformly taken hold in San Diego. Thus,
       demand estimates in this report were conservatively formulated.
   • Stakeholder Interviews. This report also includes findings based on a series of stakeholder
       interviews conducted by BAE during late 2011. The list of stakeholders interviewed is
       included in the Appendix to this report.

   1
     SANDAG formulated its estimates of 2010 and future conditions, prior to release of 2010 Census data, which shows that the
   City of San Diego did not grow as rapidly between 2000 and 2010 as anticipated by SANDAG. This situation has occurred
   throughout California, due in part to the impacts of the recession in the latter part of the decade.

                                                                1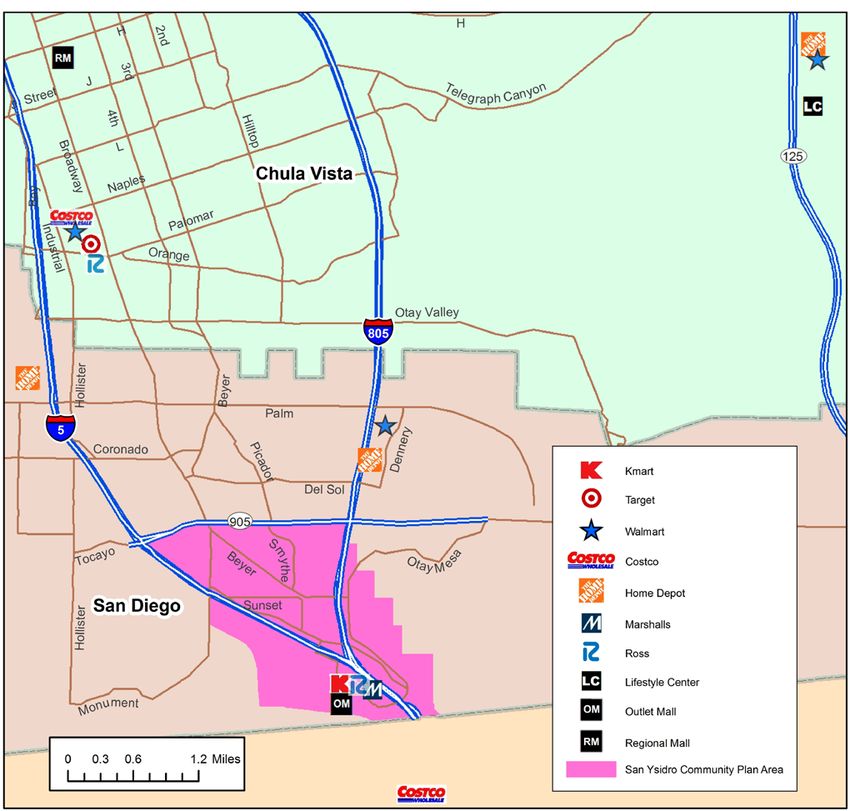
History of San Ysidro Development

San Ysidro began as a small-scale farming community. Between 1906 and 1918, it existed as the
                                  2
Little Landers farming community, an agrarian commune based on William Ellsworth Smythe’s
principles of family farming. When the Hatfield flood of 1916 wiped out the irrigation pumping
system and crops, the Little Landers community began to decline.

Starting in the 1920s, San Ysidro
developed as a residential community.
This trend accelerated during Prohibition,
when US residents moved to San Ysidro to
open saloons across the border, spurring
tourism by US residents in Tijuana.
Towards the end of World War II, the
shortage of US labor led to the national
Bracero program, which continued
through 1964; it allowed Mexican
nationals to work in the US legally without
obtaining permanent residency. Many of
these workers eventually settled in San
Ysidro with their families.

In the 1950s, San Ysidro residents believed that it would be fiscally burdensome to continue
separate municipal services and petitioned the City of San Diego to annex the community, resulting
in its annexation in 1957. San Ysidro, and the adjacent Otay Mesa communities, are essentially
separated from the rest of San Diego to the north by the cities of Chula Vista and National City; as
shown in Figure 1, only a narrow strip of City jurisdiction through San Diego Bay provides a physical
connection with the rest of the City.

San Ysidro has experienced ongoing residential and commercial development since World War II due
to the growth in border traffic and regional population, and development of the freeway system. In
1957, US Highway 101 was upgraded to a freeway from National City to the border. In subsequent
decades, I-805 and State Route 905 were constructed. These freeways, along with rail lines, have
divided the San Ysidro community into three subareas.

The core residential subarea is bounded by the freeways and is largely built out with a mix of historic,
older, and relatively newer multifamily and single family developments and subdivisions, along with
local serving retail and services. The east of Interstate 805 subarea includes a hillside area with
clusters of single family residential development; closer to the border, a border commercial area with

    2
      Lee, Lawrence B. “The Little Landers Colony of San Ysidro” The Journal of San Diego History. Winter 1975, Vol 21, Number 1.
    http://www.sandiegohistory.org/journal/75winter/littlelanders.htm

                                                                 2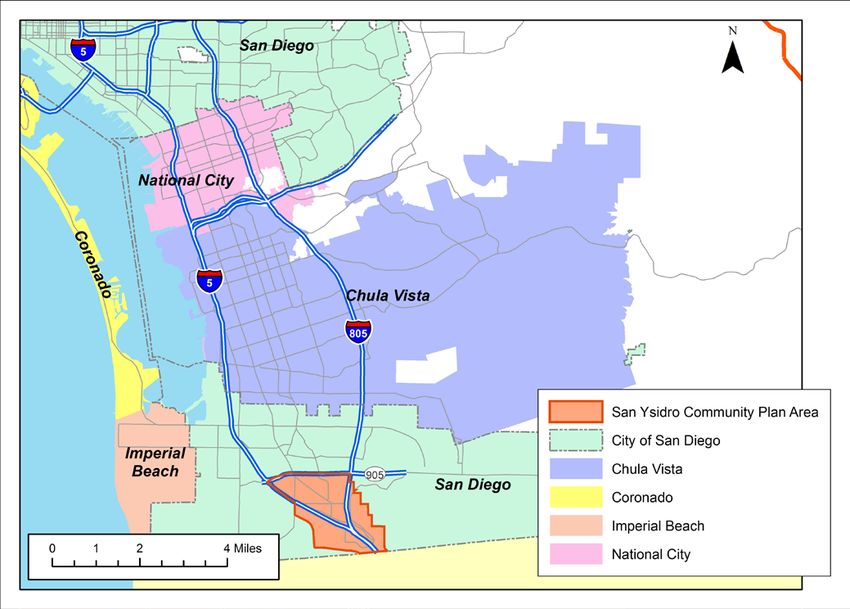
smaller retail spaces and related lodging and services; and at its southern edge the San Ysidro Land
Port of Entry (LPOE), operated by US Customs and Border Protection. The west of Interstate 5
subarea contains a commercial area with larger format and outlet retail, along with older multifamily
developments, a newer single family subdivision, and a small industrial area. Because of how San
Ysidro has been divided, and its many decades of development, there is within each subarea a wide
diversity of uses, building types, and property conditions.
Projects for the remaining vacant sites, as well as redevelopment of existing properties, are in
various stages of consideration and planning for development. Continued growth in the San Diego
and Tijuana border regions, as well as cross-border traffic and trade, are expected to create ongoing
potential for future investment in development in the area.
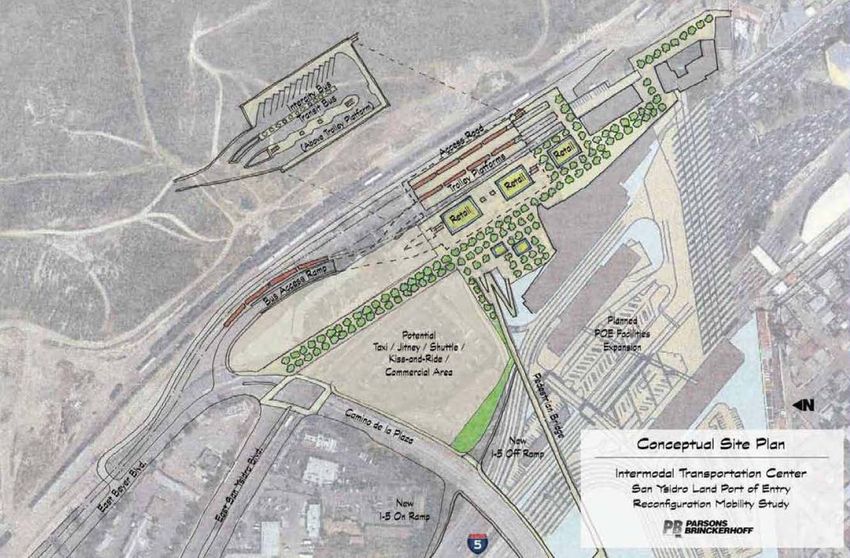
Figure 1: San Ysidro Community Plan Area and Regional Context
3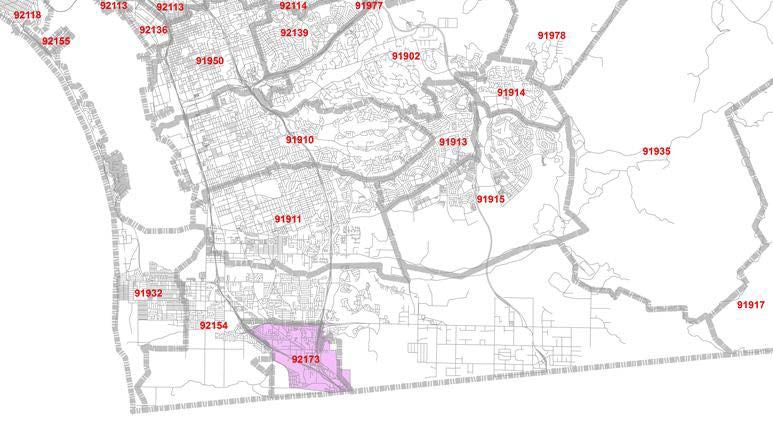
Community Plan Area Context

San Ysidro consists of approximately 1,800 acres located in the southernmost portion of the City of
San Diego. The San Ysidro Community Plan Area (CPA) is bounded to the south by the US/Mexico
border, to the east by the Otay Mesa community, to the north by State Route 905 (SR-905) and the
Otay Mesa-Nestor community, and to the west by the open space of the Tijuana River Valley. Figure
1 shows the boundaries of the San Ysidro Community Plan area.

The San Ysidro Land Port of Entry (LPOE), operated by US Customs and Border Protection and
considered to be the busiest international land border crossing in the world, is at the southern edge
of the CPA. The LPOE serves Mexican and American tourists, shoppers, workers, students, and
others, with many crossing on a daily or weekly basis. The extensive vehicle delays, often extending
to two hours or more, have resulted in heavy pedestrian traffic through the LPOE. Those crossing on
foot are able to use the adjacent San Ysidro Intermodal Transit Center to connect with the San Diego
Metropolitan Transit System Trolley and bus routes, private jitneys and shuttles, Greyhound long
distance bus service, and private vehicles. A number of private parking lots on both sides of the
border are used by many crossing the border to take advantage of the faster pedestrian crossing;
anecdotally some frequent crossers keep vehicles parked on both sides of the border.

The US/Mexico border has been a driving factor in San Ysidro’s growth throughout its history.
Combined with the impact of freeways and rail lines, the CPA has evolved into three distinct
subareas: a core subarea that lies within the triangle defined by the freeways; the subarea east of
Interstates 5 and 805; and the subarea west of Interstate 5. Within each of these three primary
subareas there are multiple districts that can be identified, based on the diversity of land uses and
the widely varying age and conditions of properties, reflecting development patterns over many
decades. These subareas and districts are shown in Figure 2 and described below.

                                                   4
Figure 2: San Ysidro Community Plan Area – Subareas and Districts

Sources: RRM Design Group; Kimley-Horn & Assocs.; City of San Diego

Core Subarea Bounded by the Freeways
This subarea is separated from the rest of San Ysidro by Interstates 5 and 805, and State Route
905, enclosing the subarea in a triangular shape. It is further bisected by rail lines that extend from
the LPOE and parallel Beyer Boulevard, and are used for the San Diego and Imperial Valley Railroad
freight line and the San Diego Trolley.

This is the core residential area in San Ysidro, where most of its population lives, with a mix of
historic, older, and relatively newer multifamily and single family developments and subdivisions.
East and West San Ysidro Boulevard, between Interstate 805 and State Route 905, is the primary
commercial corridor with a range of local serving retail stores and services, including three grocery
stores, and some tourism-oriented services near Interstate 805 and the Via De San Ysidro on/off-
ramps to Interstate 5. The northern side of West San Ysidro Boulevard is constrained along a portion
of its length by a grade change that limits the size of buildable lots.

                                                          5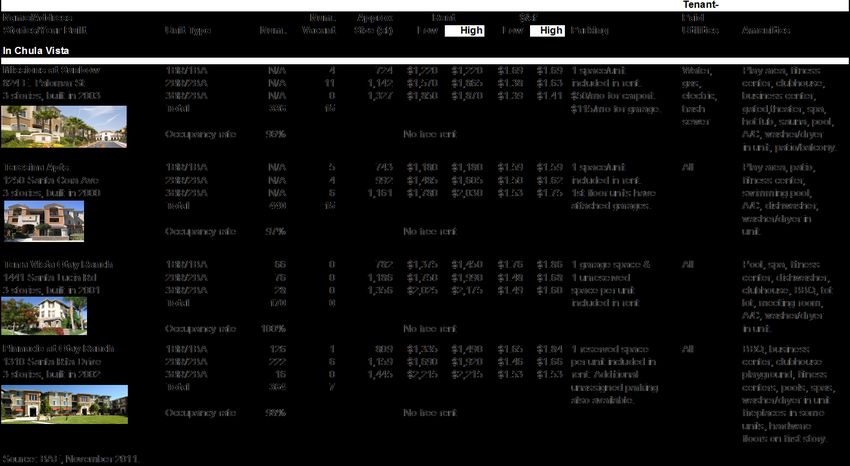
El Pueblito Viejo Village District. Bounded by Smythe Avenue, Interstates 5 and 805, and extending
north of Beyer Boulevard, this is the most historic area of San Ysidro. The Beyer Boulevard Trolley
Station is located in the middle of it, with its large parking lot presenting a potential joint
development opportunity. North of Beyer Boulevard are several community and social service
facilities. Most of the development in this area is small multifamily and single family development of
varying ages from pre-World War II to new construction. Many of the older properties are on small
lots, with a number in poor condition and/or sited in a manner inconsistent with current standards.
There are a number of vacant lots near the Trolley Station that could accommodate development.
Along West Olive Drive is a small commercial district that includes a La Bodega Supermarket. The
commercial area along East and West San Ysidro Boulevard contains a diverse mix of retail,
including auto- and tourism-related uses, but relatively limited dining choices aside from fast food
outlets. Between East and West Park Avenue is the San Ysidro Community Park, along with a library
that is considered undersized for the community’s needs.

Sunset Neighborhood District. West of the El Pueblito Viejo Village District, with a small area across
Beyer Boulevard, this is a primarily residential area with a diverse mix of multifamily and single family
residences of varying age and condition, including a number of properties on small and irregular lots.
Commercial development along the southern side of West San Ysidro Boulevard includes older
shopping centers with a variety of retail uses, including a Lucky Supermarket, and a Post Office. At
its western edge, on the north side of San Ysidro Boulevard where the southern edge of the street is
bounded by Interstate 5, there are fast food outlets and a motel.

San Ysidro West Neighborhood District. The westernmost portion of this subdistrict, south of Beyer
Boulevard, it is primarily a residential area with multifamily and single family developments built over
the past several decades that are newer than most of the housing stock to the east. Southwest of
Dairy Mart Road and West San Ysidro Boulevard is the La Pacific RV Resort. The area around the
intersection of West San Ysidro Boulevard at the Dairy Mary Road on/off-ramp to Interstate 5
contains several fasts food and a casual dining restaurant, a motel, and a neighborhood center
anchored by a Neighbors Supermarket.

San Ysidro North Neighborhood District. This district is located north of Beyer Boulevard, and is
bounded by State Route 905 and Interstate 805. It is located on a hillside, and the upper reaches
are primarily single family subdivisions built over the past several decades. The Las Lomas Mobile
Home park is also located in this area. Closer to Beyer Boulevard there are a number of multifamily
developments and a Border Patrol Station. A cluster of industrial buildings is located along Precision
Park Lane at Beyer Boulevard, near State Route 905. Beyer Boulevard and the rail lines, along with
a limited number of streets that cross them, serve to physically separate this area from the rest of
the core residential area.

East of Interstates 5 and 805 Subarea
This subarea lies east of the Interstates, and is further bisected by the Trolley and freight rail lines.
The northerly area extends into the hills that define the eastern edge of San Ysidro.

                                                     6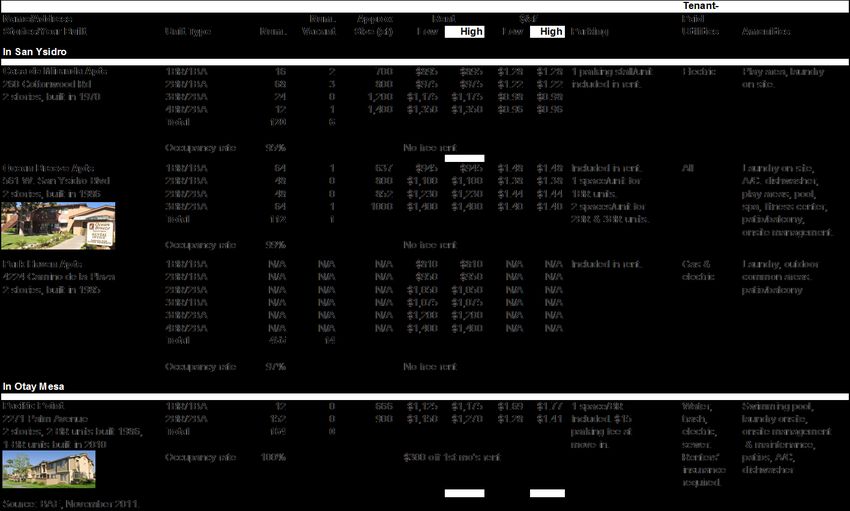
Beyer Hills Neighborhood District. East of Interstate 805, along Beyer Boulevard, East Beyer
Boulevard, and Otay Mesa Road, and north of the rail lines, are clusters of single family residential
development. A limited amount of older residential is located along East Beyer Boulevard. The
owners of the undeveloped hillside area further to the east are proposing extensive new residential
and other development; its consideration will be subject to a future City planning process distinct
from the San Ysidro Community Plan Update.

Border Village District. This district surrounds East San Ysidro Boulevard adjacent to Interstate 5
and 805, the LPOE, and the Trolley and freight rail lines. A limited amount of commercial and
industrial uses are located along East Beyer Boulevard. The primary use in this area is a border
commercial area that has developed primarily along East San Ysidro Boulevard from Interstate 805
south to Camino de la Plaza, and which itself contains several district nodes. The area between
Camino de la Plaza, East San Ysidro Boulevard, and Interstate 5 contains a mix of older lodging, fast
food, and retail shop space, with a significant amount of undeveloped land behind these uses
extending to Interstate 5, creating the potential for redevelopment if these sites can be assembled.
East of East San Ysidro Boulevard and north of Camino de la Plaza are several parcels with older
buildings containing community uses and older retail spaces that are upslope, and that also
represent underutilized sites.

East San Ysidro Boulevard, starting from the intersection with Border Village Road and continuing to
Virginia Road, as well as Border Village Road, is the core of the border commercial area and is
densely populated with multiple small strip centers and free standing buildings that contain small
shop spaces featuring Mexican-themed merchandise, apparel, and other items targeted at Mexican
purchasers, as well as US shoppers. The buildings here range from newer construction to older
remodeled buildings. This area also has a large number of US bank branches along with currency
exchange stores serving cross-border traffic.

Between Virginia Road, East San Ysidro Boulevard, and Border Village Road is an older neighborhood
center, now anchored by a 99 Cents store, a CVS pharmacy, a Reilly Auto Parts store, and other retail
stores. East San Ysidro Boulevard from this area, north to Interstate 805, contains older and lower
density freestanding retail buildings. There is an underutilized parcel bounded by East San Ysidro
Boulevard, Center Street, and the Interstate 805 northbound onramp.

Port of Entry District. The Port of Entry District is the area currently most intensely affected by
northbound pedestrian and vehicular border traffic. Adjacent to Camino de la Plaza are several
privately owned parking lots, a motel, and a fast food restaurant. Further south, below the Interstate
5 northbound access ramp, is the LPOE facility, whose reconfiguration is discussed later in this
section. East of the LPOE is the existing San Ysidro Intermodal Transit Center (ITC), with its Trolley
station and other transportation services. SANDAG is currently planning for a reconfigured ITC, in
conjunction with the reconfigured LPOE, discussed later in this section. East of the ITC is a multi-
story retail center that is the first facility pedestrians see when they exit the LPOE; it contains a food
court along with other retail.

                                                    7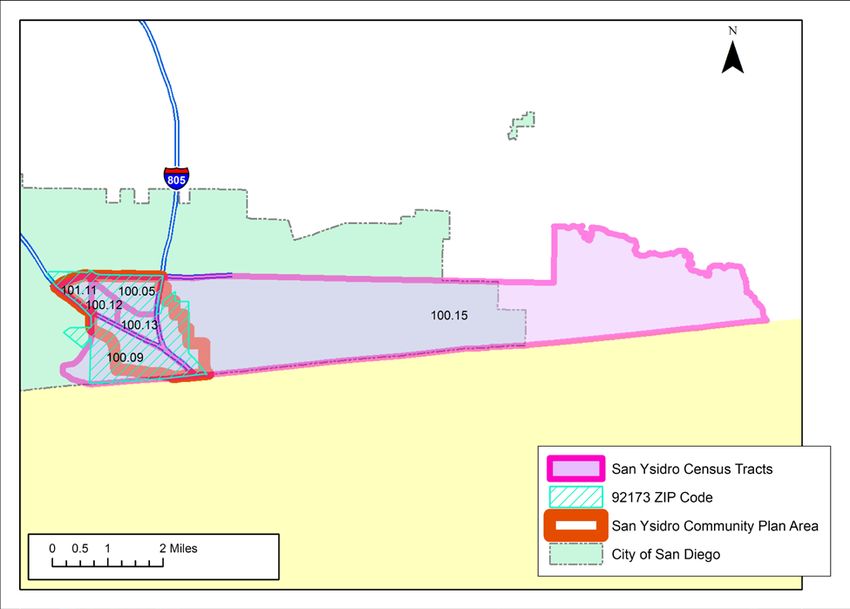
West of Interstate 5 Subarea
This subarea lies west of Interstate 5, and is bounded to the west by open space and border areas.
The reconfigured LPOE at its final buildout will extend across Interstate 5 into this area, taking the
existing parking area south of Camino de la Plaza for use by the LPOE.

San Ysidro Commercial District. This area contains the Las Americas Premium Outlets center, which
contains a large variety of outlet apparel retail stores, along with dining uses. Property on either side
of this center is in the process of being developed into an expansion of the outlet center and other
destination retail. Across Camino de la Plaza, is an older community shopping center that is now
anchored by a K-Mart, Marshall’s, and Ross, along with other retailers and fast food. The remaining
undeveloped property in this area is between Camino de la Plaza, Virginia Street, and the Interstate
5 southbound onramp to Mexico; it has previously been used for parking, and now is being used for
an outdoor bodega-style market.

San Ysidro South Neighborhood District. North of the Commercial District, this District consists of a
number of older multifamily developments along Willow Road and west of it, with a limited number of
older and smaller single family residences. The Rancho Del Rio Mobile Home Park is located in this
area. Camino de la Plaza, as it heads west and north towards Dairy Mart Road, is the western
boundary of the relatively new Coral Gate single family subdivision, which is bounded on the north
and east by protected open space. Willow Road as it reaches Interstate 5 turns west and becomes
Calle Primera; at its intersection with Via De San Ysidro and Interstate 5 on/off-ramps there is a
small highway commercial and tourist services retail node, along with a motel.

Wholesale Industrial District. North of Via De San Ysidro, Calle Primera becomes Via Segundo, with
Interstate 5 frontage, and extends to Via Trecero. This area contains a number of industrial and flex
buildings. Many of the buildings with frontage on Via Segundo and Interstate 5 visibility have largely
become wholesale outlets offering a wide range of commercial goods. This area also includes a self-
storage facility and until recently, contained an indoor San Ysidro Swap Meet.

                                                    8
Current Planning and Development Initiatives
In addition to the community plan update process, there are several major planning and
development projects which will shape San Ysidro’s future. These include a US General Services
Administration (GSA) project to reconfigure and expand the LPOE, development of a new Intermodal
Transit Center, and expansion of the San Ysidro Rail Yard. The San Diego Redevelopment Agency,
prior to its recent dissolution, was proceeding with the development of a Pilot Village concept, a new
public park and library, and other investments in the San Ysidro Redevelopment Project Area. These
planning and development initiatives are described in the following sections.
San Ysidro Port of Entry Master Plan
GSA is in the process of implementing a three phase expansion and reconfiguration of the LPOE.
3
The LPOE currently handles passenger vehicle, bus, and pedestrian traffic , processing
approximately 50,000 northbound vehicles and 26,000 northbound pedestrians per day. The high
traffic levels that pass through LPOE result in extensive delays, of up to two hours or more for
vehicles during peak periods, with up to 2,900 cars queued to cross the border. Numerous studies
have estimated that border delays result in multi-billion dollar annual losses to the San Diego
regional economy.
Caltrans and the GSA project that by 2025 the number of primary inspections will increase 28
percent from increased border crossings, and wait times at the current facility could increase to 10
hours. Besides providing the ability to accommodate growth in cross-border traffic, reconfiguration
of the LPOE allows US Customs and Border Protection to implement enhanced border security
programs.
Phases 1 and 2 of the LPOE project address work east of Interstate 5, has received Congressional
appropriation, and is currently under construction. It will increase the number of vehicular crossing
lanes, reconfigure the east pedestrian crossing area and construct new pedestrian crossing bridges,
as well as redesign the existing LPOE facility and related support functions.
Phase 3 has not received Congressional appropriation and it is unknown at this time when Congress
will provide funds for its construction. This phase will have a major impact on the San Ysidro
Commercial District through relocation of the southbound lanes of Interstate 5 to the west, creation
of southbound inspections areas for entry into Mexico, addition of a west pedestrian crossing, and
loss of the approximately 1,200 car parking lot south of Camino de la Plaza that is used by border
crossers. Additionally, the existing transit connections in the San Ysidro Commercial District along
Camiones Way are located in the LPOE expansion area, and will be relocated to a new Virginia
Avenue Transit Center.
3
Trucks and commercial vehicles utilize the Otay Mesa Port of Entry, approximately 5.3 miles in a straight line, or 9 miles by
road, east of San Ysidro LPOE.
9San Ysidro Intermodal Transit Center (ITC)
The City of San Diego completed a concept study for the relocation and reconfiguration of the ITC to
complement the reconfiguration of the LPOE project. The current design of the transit station results
in conflicts between the multiple modes of transit that use the facility (SDMTS Trolley and buses,
private jitneys and shuttles, long distance bus services, and private vehicle drop off and pick up).
The area around the existing ITC also suffers from severe traffic congestion, as well as convoluted
access to the northbound lanes of Interstate 5.
The concept study for a new ITC would include a multi-level facility that would shift the Trolley tracks
to the east, and include ground floor retail uses. This design would impact the existing retail building
to the east of the current ITC. The planning effort has also considered the extent to which the ITC
project could complement redevelopment of private property adjacent to it. Community members
have expressed interest in the creation of a larger ITC facility that could house expanded retail,
office, and other uses to better take advantage of border crossing activity.
SANDAG will soon commence the next phase of planning for the ITC. The planning effort will refine
the proposed design, conduct a market study, evaluate partnership opportunities, identify funding
strategies, and prepare a final plan for a new ITC. There is at this time no adopted timeline for
construction of a new ITC.
Figure 3: Intermodal Transit Center Conceptual Site Plan
10Rail Yard Expansion Project
It is anticipated that goods movement demand by rail, especially from northern Baja California, will
soon surpass the existing capacity of the San Ysidro yard to accommodate rail cars and yard
switching. The San Ysidro Rail Yard has been approved for an expansion project, which will increase
storage capacity from 100 to 196 cars. This will allow for an increase in cross border rail goods
movement from 10,000 carloads per year to 19,600 on the south line. The project adds track to an
existing rail yard, and includes acquisition of property and development of an access road, drainage
and detention facilities, and expansion of the yard lead and storage tracks. It will enhance the
primary purpose of this line, which is to facilitate cross-border rail service and connections with the
Burlington Northern Santa Fe rail yard and rail lines near the Port of San Diego.
Pilot Village
In 2004 the San Diego City Council approved the Mi Pueblo Pilot Village proposal as one of five
innovative City of Villages demonstration projects. The proposed project is in the heart of the
community along the historic commercial core of San Ysidro Boulevard, stretching from Interstate
805 to Cottonwood, and into the residential neighborhood immediately adjacent. It is linked through
Pathways to Knowledge, a system of pedestrian connections throughout the community and to the
Las Americas Plaza next to the international border. Some of the highlights of this project include
Its proposal to revitalize an aging, underutilized commercial district while providing an enhanced and
pedestrian friendly connection between historic San Ysidro, the new community, a regional shopping
plaza, a mixed use project and a future branch library in the San Ysidro community.
It proposes 1,143 residential dwelling units, almost 25 percent of which would be affordable
housing. It includes a public market (Mercado), social services (Casa Familiar offices), commercial
office, public plazas, community gardens, senior housing and a linear park, along with a proposed
20,000-square-foot branch library and a 5,000-square-foot community center. The design theme
builds upon the Latino New Urbanism, an urban design philosophy that incorporates many different
types of uses, higher density and an accommodation of unit types and site planning for extended
family living arrangements.
The Mi Pueblo proposal is being further refined as a part of the community plan update process.
Some changes to the original proposal may be brought forward as a result of community input, traffic
studies, further developments in library planning, and other inputs. In addition, a shift in focus from
San Ysidro Boulevard to the Beyer Trolley Station may present more opportunities to promote transit-
oriented development (TOD) on a number of vacant and underutilized properties near the station.
Another consideration is that since Redevelopment tools are no longer available (as discussed
below), the original plan’s program that required land assembly from many small privately owned
parcels may no longer be feasible. Given that consideration, project changes may be warranted and
will be a topic for community discussion.
San Ysidro Redevelopment Project Area
The San Ysidro Redevelopment Project Area contains approximately 766 acres of land located in
central San Ysidro, generally bound by the border to the south, Caithness Drive to the north, East
11Beyer Boulevard to the east, and the Tijuana River levee to the west. The San Diego Redevelopment
Agency adopted a Project Area Redevelopment Plan that outlines how it will utilize tax increment
from the Project Area, and other resources, to support a range of projects to further redevelopment.
Through 2011, its accomplishments included assistance for:
• Development of the Las Americas Premium Outlet center;
• Camino de la Plaza streetscape improvements;
• San Ysidro streetlight improvement project;
• Assistance for the San Ysidro Health Center expansion project;
• Assistance to Casa Familiar social services agency;
• Planning for West San Ysidro Boulevard and Averil Street streetscape improvements;
• $2.5 million funding commitment for a new San Ysidro public library;
• Funding for affordable housing projects (El Pedregal Family Apartments, Verbeña Family
Apartments, Casitas de la Florecitas affordable homeownership, for a total of 133 dwelling
units); and
• Housing rehabilitation projects (financial assistance for HELP home rehabilitation programs,
financial assistance to Urban Corps for home rehabilitation programs).
In 2011, the California Legislature adopted a series of bills to dissolve redevelopment agencies and
distribute funds to property tax recipient agencies including school districts, except for funds needed
for payment of legally binding obligations. This was done to enable a reduction in State aid to these
agencies. After legal challenges, the dissolution became effective on February 1, 2012.
Pursuant to the provisions of the legislation, the San Diego City Council agreed that the City would
act as the successor agency to the Redevelopment Agency. The role of a successor agency is limited
to ensuring payment on binding contracts and debt obligations incurred prior to January 1, 2011, as
set forth in an Enforceable Obligations Payment Schedule (EOPS) pursuant to the legislation. The
successor agency cannot enter into new obligations, nor continue planning efforts or project
negotiations for projects not on the EOPS.
There is currently a great deal of other uncertainty on how the provisions of the legislation will be
implemented, possibly resulting in future litigation on issues that the legislation did not fully address.
Thus, for San Ysidro, even though design assistance for a new public library, and the Agency’s 2002
commitment to the City for $2.5 million in funding assistance for the new library, are listed in the
EOPS, the wording of the dissolution legislation has created uncertainty on the extent to which such
commitments will be carried out.
Redevelopment agencies have historically been a leading source of funding and technical assistance
for projects that contribute to community revitalization and produce affordable housing. The loss of
this tool will create near-term challenges for implementation of the Community Plan Update. While
replacement financing tools to spur revitalization exist, and others are anticipated, it is not yet clear
how California cities will in the future pursue redevelopment-type activities. It is worth noting that
cities in other states have created non-profit economic development corporations to leverage a
variety of funding sources and provide technical expertise to plan and implement projects.
12DEMOGRAPHIC AND ECONOMIC TRENDS
This chapter analyzes demographic and economic trends for the San Ysidro Community Plan Area
(CPA). It should be noted that selected data used for this chapter is based on estimates of
demographic trends prepared by the San Diego Association of Governments (SANDAG) for the San
Ysidro CPA prior to release of the 2010 US Census. Since the City and County of San Diego did not
grow as rapidly between 2000 and 2010 as anticipated prior to the 2010 Census count, the
SANDAG estimates for 2010 may overestimate population and household counts for San Ysidro.
Nevertheless, the trends described by the SANDAG estimates used in this report likely remain
relatively accurate. Another key data source for demographic factors used in this chapter is from the
American Community Survey (ACS), a US Census process conducted on a rolling-sample basis for
small geographic areas (e.g., Census Tracts) over a five year time period. For San Ysidro, the time
period covered by this data set at the time this report was drafted (Fall 2011) was for 2005 through
2009. This data source provides extensive detail for demographic variables, but its collection
method means that it represents the span of time during which it was collected, rather than a single
point in time. A map showing the San Ysidro Community Plan Area, the boundaries of Census Tracts,
and the boundaries of Zip Codes (also used for some data), is shown in Appendix A to this report.
Regional Context for San Ysidro Community Plan Area (CPA)
In order to understand demographic and economic forces impacting San Ysidro, it is important to
first assess the community’s key location at the US/Mexico border, and the economic factors which
affect both countries in this region. The following table profiles 2006 estimates of the combined San
Diego/Tijuana region. As shown, the combined bi-national region contains almost 4.5 million
residents, 2.1 million workers, and a combined gross regional product of over $155.2 billion.
T ABLE 1: S AN D IEGO /T IJUANA R EGION D EMOGRAPHICS (2006 ESTIMATES )
2006
San Diego Tijuana Region Combined Region
Population (a) 3,066,820 1,417,730 4,484,550
Land Area (sq. miles) (b) 4,261 1,071 5,332
Population Per Square Mile 720 1,317 1,019
Labor Force (c) 1,537,220 594,830 2,132,050
Gross Regional Product (US $millions $ 143,650 $ 11,576 $ 155,226
Total Housing Units (e) 1,118,410 357,064 1,475,474
Median Household Income (f) $ 63,737 $ 14,240
Forecast for 2030
Population (g) 3,984,753 2,422,071 6,406,824
Housing Units (h) 1,383,803 803,021 2,186,824
Sources for San Diego Region: Sources for Tijuana Region
a) SANDAG Istituto Nacional de Estadistica Geografia e Informatica (2005)
b) SANDAG Secretaria de Desarrollo Economico de Tijuana, XVII Ayuntameineto de T
c) SANDAG Istituto Nacional de Estadistica Geografia e Informatica (2005)
d) San Diego Regional Chamber of Commerce Secretaria de Desarrollo Economico de Tijuana, XVII Ayuntameineto de T
e) SANDAG Istituto Nacional de Estadistica Geografia e Informatica (2005)
f) SANDAG Secretaria de Desarrollo Economico de Tijuana, XVII Ayuntameineto de T
g) SANDAG Consejo Nacional de Poblacion (CANAPO)
h) SANDAG Consejo Nacional de Poblacion (CANAPO)
Overall Source: South County Economic Development Council; San Diego Association of Governments, BAE 2012.
13Population and Household Trends
Population and Household Growth
San Ysidro constitutes a small portion of the City’s total population; according to SANDAG, in 2010
the San Ysidro CPA had an estimated population of 28,707, representing just 2.1 percent of the
City’s total. Population grew modestly in the CPA between 2000 and 2010, increasing 6.5 percent
compared to City (12.5 percent) and the County (14.6 percent) for the same period. The number of
households in the CPA declined, with a loss of 1.9 percent of households, compared to an increase
of 5.8 percent in households citywide, and a 7.5 percent increase countywide.
T ABLE 2: P OPULATION AND H OUSEHOLD T RENDS , 2000 - 2010
San Ysidro 2000 2010 % Change
Population 26,953 28,707 6.5%
Households 6,922 6,790 -1.9%
City of San Diego
Population 1,223,401 1,376,173 12.5%
Households 450,691 477,008 5.8%
San Diego County
Population 2,813,833 3,224,432 14.6%
Households 994,677 1,068,797 7.5%
Data from SANDAG 2010 estimates for CPA, City, and County.
Sources: U.S. 2000 Census; SANDAG; City of San Diego; BAE, 2011.
Age Distribution
The San Ysidro CPA has a notably young population; the CPA’s median age of 24.5 years in 2010
was well below the City’s (35.6 years) and the County’s (35.3 years). Over half of the CPA’s residents
(51.4 percent) were below age 25, compared to just over one-third of the City and County residents.
At the other end of the age spectrum, the CPA has a smaller share of people aged 65 year or older
(6.8 percent) than the City (11.3 percent) or the County (11.7 percent).
T ABLE 3: A GE D ISTRIBUTION , 2010
City of San Diego
Age Cohort San Ysidro San Diego County
Under 18 37.6% 22.6% 23.9%
18-24 13.8% 11.3% 11.5%
25-34 15.5% 15.0% 14.2%
35-44 10.8% 15.6% 14.0%
45-59 12.6% 19.5% 19.9%
60-64 2.8% 4.6% 4.8%
65-74 3.7% 5.7% 5.8%
Over 75 3.1% 5.6% 5.9%
Total 100.0% 100.0% 100.0%
Median Age 24.3 35.6 35.3
Data from SANDAG 2010 estimates for CPA, City, and County.
Sources: SANDAG; City of San Diego; BAE, 2011.
14Race and Ethnicity
San Ysidro’s population is characterized by an extremely large Hispanic component. As shown
below, over 90 percent of CPA residents are Hispanic, compared to only 28 percent of City residents
and 31 percent of County residents. Only two percent of CPA residents are Non-Hispanic Whites,
compared to 45 percent in the City and 49 percent countywide.
T ABLE 4: R ACE AND E THNICITY
City of San Diego
Race/Ethnicity San Ysidro San Diego County
Non-Hispanic/Latino
White 2.2% 44.5% 49.2%
Black/African American 0.8% 6.9% 5.2%
Native American & Alaskan Native 0.1% 0.4% 0.5%
Asian 3.0% 15.5% 10.3%
Native Hawaiian & Pacific Islander 0.2% 0.5% 0.5%
Other 0.0% 0.3% 0.3%
Two or More Races 1.0% 3.7% 3.4%
Hispanic/Latino - All Races 92.7% 28.3% 30.6%
Total 100.0% 100.0% 100.0%
Data from SANDAG 2010 estimates for CPA, City, and County.
Sources: SANDAG; City of San Diego; BAE, 2011.
Household Size and Composition
Along with a young and largely Hispanic population, the CPA has a large average household size.
According to SANDAG, in 2010 the average household size in the CPA was 4.21 persons, compared
to 2.80 persons for the city overall and 2.90 persons countywide. The CPA also has a larger share of
households with children under age 18 (58.6 percent) than the City (30.7 percent) or the County
(35.0 percent). In addition, the CPA has a substantially larger share of family households containing
related individuals (83.2 percent) than the City (58.7 percent) or County (66.0 percent). These
demographic characteristics underscore the need to provide ample public facilities geared towards
families with children, including parks, playgrounds, libraries, and recreational facilities.
T ABLE 5: H OUSEHOLD C OMPOSITION
City of San Diego
Household Type (a) San Ysidro San Diego County
Non-Family 16.8% 41.3% 34.0%
Family
Married Couple 51.3% 43.4% 49.6%
Other Family 31.9% 15.3% 16.4%
Family Households 83.2% 58.7% 66.0%
Households with Children Under 18 58.6% 30.7% 35.0%
Average Household Size (b) 4.21 2.80 2.93
(a) From 2005-2009 American Community Survey (ACS). Estimate based on
continuous sampling from 2005 through 2009. For data from ACS, San Ysidro
has been defined by the "best fit" of Census Tracts, consisting of Census Tracts
100.05, 100.09, 100.12, 100.13, 100.15, and 101.11. This is an area somewhat
larger than the CPA boundaries.
(b) Data from SANDAG 2010 estimates for CPA, City, and County.
Sources: U.S. Census, American Community Survey; SANDAG; City of San
Diego; BAE, 2011.
15Household Tenure
Even though San Ysidro has a high proportion of families, the CPA has a relatively low rate of home
ownership. Less than 40 percent of CPA households are owners; compared to ownership rates of
over 50 percent citywide and over 57 percent countywide.
T ABLE 6: H OUSEHOLD T ENURE
City of San Diego
Tenure San Ysidro San Diego County
Owner-Occupied 37.6% 50.6% 57.1%
Renter-Occupied 62.4% 49.4% 42.9%
Total 100.0% 100.0% 100.0%
From 2005-2009 American Community Survey (ACS). Estimate based on
continuous sampling from 2005 through 2009. For data from ACS, San Ysidro
has been defined by the "best fit" of Census Tracts, consisting of Census Tracts
100.05, 100.09, 100.12, 100.13, 100.15, and 101.11. This is an area somewhat
larger than the CPA boundaries.
Sources: U.S. Census, American Community Survey; BAE, 2011.
Educational Attainment
As shown, San Ysidro residents have lower levels of educational attainment than City and County
residents. Approximately 47 percent of residents 25 or older do not have a high school diploma,
compared to less than 15 percent citywide and countywide. Residents also have a low college
attainment level, with 17 percent having a college degree, compared to 48 percent citywide and 42
percent countywide.
T ABLE 7: E DUCATIONAL A TTAINMENT , P OPULATION A GE 25+
City of San Diego
Educational Attainment San Ysidro San Diego County
Less than 9th Grade 28.1% 7.1% 7.3%
9th to 12th Grade, No Diploma 18.9% 6.6% 7.5%
High School Graduate (incl. Equivalency) 20.1% 17.4% 20.2%
Some College, No Degree 15.7% 20.9% 23.0%
Associate Degree 7.6% 7.4% 8.0%
Bachelor's Degree 7.2% 24.7% 21.3%
Graduate/Professional Degree 2.3% 15.9% 12.7%
Total 100.0% 100.0% 100.0%
Population with College Degree 17.1% 48.0% 42.0%
(a) From 2005-2009 American Community Survey (ACS). Estimate based on
continuous sampling from 2005 through 2009. For data from ACS, San Ysidro has
been defined by the "best fit" of Census Tracts, consisting of Census Tracts 100.05,
100.09, 100.12, 100.13, 100.15 and 101.11. This is an area somewhat larger than the
CPA boundaries.
Sources: U.S. Census, American Community Survey; BAE, 2011.
16Labor Force Participation, Employment, and Unemployment
The ACS data set also tracks labor force participation, employment, and unemployment for the
Census Tracts approximating San Ysidro. As shown, CPA residents have a somewhat lower labor
force participation rate than the City or County, with 58 percent of San Ysidro residents either
employed or seeking work, compared to almost 67 percent of the City overall, and 66 percent for the
County. In addition, San Ysidro residents have a higher unemployment rate of 8.7 percent at the
time the data was collected, compared to 6.3 and 6.7 percent, respectively, for the City and the
County.
T ABLE 8: L ABOR F ORCE , E MPLOYMENT , AND U NEMPLOYMENT , A GE 16+
City of San Diego
San Ysidro San Diego County
Total Population Age 16 and older 20,084 1,038,097 2,337,491
In Labor Force 58.0% 66.8% 66.1%
In Armed Forces 0.4% 2.8% 3.1%
In Civilian Labor Force 57.7% 64.0% 62.9%
Employed 52.7% 60.0% 58.7%
Unemployed 5.0% 4.1% 4.2%
Not in Labor Force 42.0% 33.2% 33.9%
Civilian Unemployment Rate 8.7% 6.3% 6.7%
(a) From 2005-2009 American Community Survey (ACS). Estimate based on
continuous sampling from 2005 through 2009. For data from ACS, San Ysidro has
been defined by the "best fit" of Census Tracts, consisting of Census Tracts 100.05,
100.09, 100.12, 100.13, 100.15 and 101.11. This is an area somewhat larger than the
CPA boundaries.
Sources: U.S. Census, American Community Survey; BAE, 2011.
17Household Income
Reflecting the younger age distribution, higher unemployment, and lower educational attainment
levels of residents, the CPA has lower levels of household incomes than the City or county. The CPA
has a much higher concentration of households with incomes below $50,000 (64.2 percent) than
the City (40.8 percent), or County (40.0 percent). In addition, the area has a higher percentage of
individuals in poverty (26 percent) than the City (13.1 percent) or County (11.5 percent).
T ABLE 9: H OUSEHOLD I NCOME AND P OVERTY R ATES
City of San Diego
Income Category (a) San Ysidro San Diego County
Less than $15,000 18.5% 10.3% 9.2%
$15,0000-$24,999 16.4% 8.8% 8.6%
$25,000-$34,999 14.8% 8.6% 8.9%
$35,000-$49,999 14.4% 13.1% 13.2%
$50,000-$74,999 20.0% 17.5% 18.0%
$75,000-$99,999 6.2% 13.4% 13.6%
$100,000-$149,999 6.3% 15.3% 15.7%
$150,000-$199,999 1.4% 6.6% 6.6%
$200,000 or more 1.9% 6.5% 6.1%
Total 100.0% 100.0% 100.0%
Median HH Income (a) $35,184 $61,962 $62,901
Individuals in Poverty (b) 26.0% 13.1% 11.5%
(a) From 2005-2009 American Community Survey (ACS). Estimate
based on continuous sampling from 2005 through 2009. For data from
ACS, San Ysidro has been defined by the "best fit" of Census Tracts,
consisting of Census Tracts 100.05, 100.09, 100.12, 100.13, 100.15,
and 101.11. This is an area somewhat larger than the CPA
boundaries.
(b) Calculated from the universe of individuals for whom poverty
status is known, not all individuals. From ACS 2005-2009.
Sources: U.S. Census, American Community Survey; BAE, 2011.
Commute Patterns
According to estimates made by the US Census in 2009, most of San Ysidro’s working residents
commuted to jobs located outside of San Ysidro or the immediate surrounding area; only eight
percent of San Ysidro’s employed residents remain in San Ysidro to work, while 45 percent commute
to jobs located elsewhere in the City of San Diego, 29 percent commute elsewhere within the County,
and 18 percent work outside of San Diego County.
Conversely, because so few of San Ysidro’s residents work locally, most of the jobs in San Ysidro are
held by in-commuters, including more than 2,000 workers who commute from far distances outside
of San Diego County to work in San Ysidro.
It is important to note that the data below is based on Census Tracts (see Appendix A map), and
includes the area to the east of the CPA, which has additional jobs, particularly in Otay Mesa (which
in turn emphasizes that San Ysidro residents must go outside San Diego to access employment).
18T ABLE 10: C OMMUTER F LOWS , 2009
Note: Includes areas adjacent to San Ysidro Community Plan Area
Number of
San Ysidro Employed Residents by Place of Work Workers % Total
San Ysidro 1,090 8.0%
City of San Diego, outside San Ysidro 6,164 45.0%
San Diego County, outside San Diego City 3,966 29.0%
All Other Locations 2,470 18.0%
Total 13,690 100.0%
Number of
San Ysidro Workers by Place of Residence Workers % Total
San Ysidro 1,979 17.6%
San Diego County, outside San Ysidro 7,185 64.0%
All Other Locations 2,055 18.3%
Total 11,219 100.0%
From the U.S. Census Bureau's Longitudinal Employer-Household Dynamics program's On the Map, a
tool created by combining administrative data on employment with Census data. The employment data
are based on Quarterly Workforce Indicators (QWI) a set of economic indicators on employment.
Note that this data source has limitations with respect to covered employment and other factors; for
example most Federal employment is not included. Thus the numbers here should not be taken to
represent all workers, but should still provide a general "order of magnitute" picture of commute flows
between areas. Counts of workers are not directly comparable with other sources. San Ysidro
has been defined by the "best fit" of Census Tracts, consisting of Census Tracts 100.05, 100.09,
100.12, 100.13, 100.15, and 101.11. This is an area somewhat larger than the CPA boundaries.
Sources: Census LEHD On The Map, 2009; BAE, 2011.
Economic Trends
Regional Context
The San Diego-Tijuana region is the largest bi-national metropolitan area in North America, with San
Ysidro located both at the border that splits the region as well as near its geographic center. As
described in the previous section of this report, the combined bi-national region had a reported gross
regional product (e.g., measure of economic activity) of over $155.2 billion in 2006. With a
combined population of almost 4.5 million, the region benefits from economic growth on both sides
of the border. The region has a diverse economic base, including electronics, manufacturing, high-
technology, biotech, agriculture, construction, defense, and service and tourism related sectors. San
Ysidro plays a key role in this bi-national region, as the busiest land port of entry in the world, with
almost 30.6 million northbound individual crossings in 2010.
The following describes San Ysidro employment trends, and then elaborates on the economic forces
shaping the CPA due to its location in the center of this dynamic bi-national region, which may
provide increased opportunities for economic development in the CPA.
San Ysidro Employment Trends
The best available employment data for small area geographies like San Ysidro CPA is available from
the State of California Employment Development Department (EDD), based on employer-reported
jobs related to workers enrolled in required unemployment insurance programs. However, it should
19be noted that actual employment data is difficult to analyze and publish for the San Ysidro
Community Plan Area (CPA), due to the small amount of employment in certain industry sectors
creating suppressed data / confidentiality issues, as well as the potential under-counting of local
4
jobs due to several challenges in the data series. Thus, the following data has been arrayed to
show the larger private industry sectors for which data covering San Ysidro is available and
publishable, compared to the same sectors in San Diego County over the 2004-2009 time period.
As shown, retail was the largest private industry sector in both 2004 and 2009, accounting for 32
percent of reported employment in San Ysidro in 2009. Retail employment also grew rapidly,
increasing 21 percent in San Ysidro in the five-year period. This trend was countercyclical to the
County, which lost almost 10 percent of its retail employment during the same period. It is important
to note that according to SANDAG in 2008, there were approximately 6,300 government workers in
San Ysidro. As Table 11 is summarizing private sector jobs the SANDAG government employment is
not included in the data shown below. Retail employment also grew rapidly, increasing 21 percent
in San Ysidro in the five-year period. This trend was counter-cyclical to the County, which lost almost
10 percent of its retail employment during the same period.
T ABLE 11: E MPLOYMENT BY I NDUSTRY S ECTOR , 2004-2009
Employment 2004-2009 Concentration of Sectors
San Ysidro (b) San Diego County (c) San Ysidro San Diego County
Selected Private Industry Sectors (a) 2004 2009 Change 2004 2009 Change 2004 2009 2004 2009
Retail Trade 1,992 2,406 20.8% 144,900 130,500 -9.9% 24.8% 32.6% 11.4% 10.5%
Accommodation & Food Services 755 713 -5.6% 123,600 130,500 5.6% 9.4% 9.7% 9.7% 10.5%
Health Care & Social Assistance 546 599 9.7% 101,600 116,900 15.1% 6.8% 8.1% 8.0% 9.4%
Manufacturing 1,252 417 -66.7% 104,300 95,400 -8.5% 15.6% 5.6% 8.2% 7.7%
Finance & Insurance 360 413 14.7% 52,800 43,800 -17.0% 4.5% 5.6% 4.2% 3.5%
Wholesale Trade 672 341 -49.3% 41,900 40,700 -2.9% 8.4% 4.6% 3.3% 3.3%
Transportation & Warehousing 531 232 -56.3% 22,100 19,900 -10.0% 6.6% 3.1% 1.7% 1.6%
Professional, Scientific, & Technical Services 88 181 105.7% 99,800 108,100 8.3% 1.1% 2.5% 7.8% 8.7%
Other Services 104 90 -13.5% 47,900 47,000 -1.9% 1.3% 1.2% 3.8% 3.8%
Real Estate & Rental & Leasing 86 80 -7.0% 29,100 26,500 -8.9% 1.1% 1.1% 2.3% 2.1%
Management of Companies & Enterprises 61 45 -26.2% 18,200 15,300 -15.9% 0.8% 0.6% 1.4% 1.2%
Subtotal 6,447 5,517 -14.4% 786,200 774,600 -1.5% 80.4% 74.7% 61.8% 62.5%
Additional Undisclosed Employment (a) 1,573 1,864 18.5% 485,300 464,700 -4.2% 19.6% 25.3% 38.2% 37.5%
Total Employment 8,020 7,381 -8.0% 1,271,500 1,239,300 -2.5% 100.0% 100.0% 100.0% 100.0%
Data for San Ysidro is for Zip Code 92173
a) Data shown excludes industry sectors for which employment data can not be discosed in San Ysidro (due to confidentiality rules).
Additional undisclosed employment include jobs in Agriculture, Information, Utilities, Construction, Administration & Support, Educational Services, Arts/Entertainment/Recreation,
Government, and Unclassified.
(b) San Ysidro data from Quarterly Census of Wages and Employment (QCEW). This data source excludes some wage and salary jobs, particularly in the government sector.
Self-employed workers are also excluded. Some jobs may also be mis-classifed by zip code due to where the employer choses to report place of work.
Data shown are annual average employment.
(c) From Current Employment Statistics (CES) series, which are the official employment counts in CA, and provide more complete coverage of wage and salary employment
than the data series used for San Ysidro (QCEW). Self-employed workers are still excluded. CES data not available for sub-county area such as San Ysidro.
Data shown are annual average employment.
Sources: CA EDD; City of San Diego; BAE, 2011.
4
For San Ysidro, the small size of some employment sectors prevents reporting of the data, due to State of California non-
disclosure rules. Under-reporting is also likely present due to anomalies including likely high self-employment (and thus not
covered by standard unemployment insurance, the source of the data set used here), large numbers of US Customs and Border
Protection workers reporting officially to an address outside of San Ysidro (and thus counted as located elsewhere), and other
factors.
20The table shows several other interesting trends among the industry sectors for which data is
available and can be reported. Accommodations and Food services, the next largest private industry
sector in San Ysidro, lost employment during the period, compared to growth in this sector
countywide. Nevertheless, this sector’s concentration among the reported private industry sectors in
San Ysidro is relatively similar to the County’s share, suggesting that San Ysidro’s hotels and
restaurants may be employing typical numbers, but likely could improve with targeted lodging
development products and restaurant offerings, especially given the very substantial border traffic
and activity at Las Americas Outlets. Health care and social services are not as concentrated in San
Ysidro as throughout the County, and the CPA’s jobs in this sector did not grow quite as rapidly as
elsewhere in the County; this finding suggests another sector to further explore for increased
economic development, particularly in health care.
Manufacturing, which accounted for almost 16 percent of jobs shown in 2004 in San Ysidro, has
experienced much more rapid decline in the five-year period (- 67 percent decline in employment)
than for the County overall (- 9 percent). This major decline in a key local sector should be further
explored in future economic development strategic planning for the CPA.
One of the most notable and unique sectors in San Ysidro is Finance and Insurance. As evidenced
on the ground, with 10 bank branches, Mexico car insurance providers, and currency exchange
stores located in the core of San Ysidro, this sector has a large concentration in the CPA (six percent
of jobs shown for 2009 in San Ysidro, compared to four percent for the County). The CPA’s Finance
and Insurance sector employment also grew rapidly for the period, up 15 percent in San Ysidro
compared to a decrease of - 17 percent for this sector in the County. Stakeholder interviews
conducted for this report suggested that this competitive advantage of attracting banks and related
financial businesses serving cross-border commerce should be further expanded as economic
development strategies are formulated for the CPA.
Both Wholesaling and Transportation/Warehousing appear to be losing ground in San Ysidro for the
period, losing 49 and 56 percent of employment, respectively. The County also lost jobs in these two
sectors, but at a slower rate. The Professional and Technical sector, which is relatively small in San
Ysidro, experienced rapid growth during the period compared to the County.
Finally, as mentioned previously, these data do not adequately account for Government employment,
particularly compared to known levels of federal employment associated with the San Ysidro LPOE.
If accurate counts could be included in the above table, this sector would be the largest sector in
San Ysidro (approximately 6,300 jobs), and also is likely a rapidly-growing sector given the border
crossing needs for customs as well as homeland security.
21You can also read