PAPER VS LEAF: COMPARATIVE LIFE CYCLE ASSESSMENT OF SINGLE-USE PLATES MADE OF RENEWABLE MATERIALS - DIVA-PORTAL
←
→
Page content transcription
If your browser does not render page correctly, please read the page content below
Master thesis in Sustainable Development 2019/26
                                              Examensarbete i Hållbar utveckling

                         Paper vs Leaf: Comparative Life Cycle
                        Assessment Of Single-use Plates Made
                                      Of Renewable Materials

                                                        Lucia Korbelyiova

DE PA R TM E N T OF
EA R TH S CI E N CE S
  INSTITUTIONEN FÖR
GEOVETENSKAPER 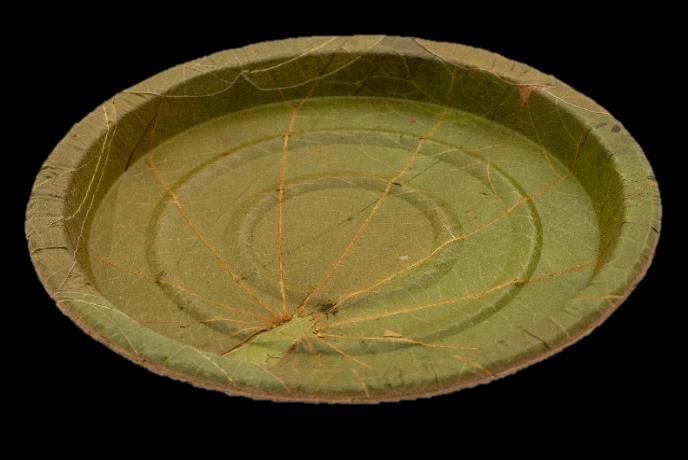
Master thesis in Sustainable Development 2019/26
                          Examensarbete i Hållbar utveckling

     Paper vs Leaf: Comparative Life Cycle
    Assessment Of Single-use Plates Made
                  Of Renewable Materials

                                    Lucia Korbelyiova

                      Supervisor: Mattias Eriksson
                 Subject Reviewer: Cecilia Lalander
Copyright © Lucia Korbelyiova and the Department of Earth Sciences, Uppsala University
Published at Department of Earth Sciences, Uppsala University (www.geo.uu.se), Uppsala, 2019
Content

Abstract: ................................................................................................................................................. ii
Summary: .............................................................................................................................................. iii
1.      Introduction ................................................................................................................................... 1
2.      Background .................................................................................................................................... 2
3.      Methods .......................................................................................................................................... 5
     3.1 Life cycle assessment (LCA)......................................................................................................... 5
        3.1.1. Functional Unit ...................................................................................................................... 7
        3.1.2. System boundary and description .......................................................................................... 8
        3.1.3. Inventory data collection ..................................................................................................... 12
        3.1.4. Inventory data processing .................................................................................................... 14
        3.1.5. Impact assessment ............................................................................................................... 18
        3.1.6. Scenario analysis ................................................................................................................. 19
4.      Results........................................................................................................................................... 23
5.      Discussion ..................................................................................................................................... 27
6.      Conclusion .................................................................................................................................... 30
7.      Acknowledgements ...................................................................................................................... 31
8.      References .................................................................................................................................... 32

                                                                              i
Paper vs. Leaf: Comparative Life Cycle Assessment of single-
use plates made of renewable materials
LUCIA KORBELYIOVA
Korbelyiova, L., 2019: Paper vs. Leaf: Comparative Life Cycle Assessment of single-use plates made of
renewable materials. Master thesis in Sustainable Development at Uppsala University, No. 2019/26, 39 pp,
30 ECTS/hp
Abstract:
Global plastic pollution of the natural environment is extremely detrimental as it is causing deaths of animal
species. More than 80 % of marine litter is made up by plastics and 70 % of those are made up by disposable items.
For this reason, the European Parliament has agreed to abolish the top ten single-use plastic items found in the
marine environment from the EU market from 2021. Therefore, the fossil-based disposables will need to be
substituted by disposables made from renewable materials. It is thus important to investigate the environmental
impact of these alternatives through their life cycle in order to support sustainable consumption and production.
In this study, environmental impact of disposable plates made from two different renewable materials (paper and
leaf) were analysed by means of life cycle assessment (LCA). The aim of the study was to examine the
environmental performance of the two plates in the impact category global warming potential (GWP); and reveal
the processes with the largest contributions to the overall GWP of each plate. The leaf plate was produced in India
and the paper plate in the Nordics, however, both plates were used and disposed of in Uppsala, Sweden. The results
showed that the leaf plate has a higher GWP due to its long-distance transport and electricity use derived from
fossil fuels. Scenario analysis has proved that its GWP can be reduced when sea transport route is chosen instead
of flying and production is increased. When it comes to the paper plate life cycle, the processing stage was
identified to contribute the most to the total GWP. It could be further improved by applying a biodegradable layer
for its coating. To keep the good performance in GWP the plate should be incinerated with energy recovery. The
disposal of the plates has a substantial positive influence on their total carbon footprint as both plates substitute
use of fossil fuels. However, the credits allocated for the different waste management options are specific to
Uppsala and thus the results of this study should be applied only under similar conditions.
Keywords: Sustainable Development, Life cycle assessment, Disposable plates, Leaf, Paper,
Lucia Korbelyiova, Department of Earth Sciences, Uppsala University, Villavägen 16, SE- 752 36 Uppsala,
Sweden
iiPaper vs. Leaf: Comparative Life Cycle Assessment of single-
use plates made of renewable materials
LUCIA KORBELYIOVA
Korbelyiova, L., 2019: Paper vs. Leaf: Comparative Life Cycle Assessment of single-use plates made of
renewable materials. Master thesis in Sustainable Development at Uppsala University, No. 2019/26, 39 pp,
30 ECTS/hp
Summary:
Global plastic pollution of the natural environment is extremely detrimental as it is causing deaths of animal
species. More than 80 % of marine litter is made up by plastics and 70 % of those are made up by disposable items.
For this reason, the European Parliament has agreed to abolish the top ten single-use plastic items found in the
marine environment from the EU market from 2021. Therefore, the fossil-based disposables will need to be
substituted by disposables made from renewable materials such as paper, sugar cane, bamboo or leaves. If these
materials are to replace fossil-based plastic it is important to study their environmental impact through their whole
life cycle, i.e. from the extraction of raw materials used in the production, through processing of the materials,
production, use until the disposal of the disposables. In this study, environmental impact of the whole life cycle of
disposable plates made from two different renewable materials (paper and leaf) was analysed. The aim of the study
was to examine the environmental impact of the two plates on climate change and reveal the processes with the
most potential for improvement. The leaf plate was produced in India and the paper plate in the Nordics, however,
both plates were used and disposed of in Uppsala, Sweden. The results showed that the leaf plate has a higher
impact on climate change due to its long-distance transport and electricity use derived from fossil fuels. However,
it can be reduced when sea transport route is chosen instead of flying and production is increased. When it comes
to the paper plate life cycle, the processing of raw materials and manufacturing the paper plate were identified to
contribute the most to the overall impact of the paper plate on climate change. It could be further improved by
using a biodegradable layer as a coating material, which is applied to make the paper plate soak-proof. The best
option for the paper plate when it comes to its disposal is incineration with energy recovery. Disposal of the plates
has a substantial positive influence on their total carbon footprint as both plates substitute use of fossil fuels.
However, this might be true only in the context of Uppsala, where specific technologies and fossil fuels are used
for provision of heat and electricity. These conditions might change in a different geographical location. Therefore,
the results of this study should be applied only under similar conditions to Uppsala.
Keywords: Sustainable Development, Life cycle assessment, Disposable plates, Leaf, Paper,
Lucia Korbelyiova, Department of Earth Sciences, Uppsala University, Villavägen 16, SE- 752 36 Uppsala,
Sweden
iii1. Introduction
Global plastic production reached 322 million tonnes in 2015 and is expected to double over the next
20 years (European Commission, 2018). However, our love for plastic has not always been that strong.
In 1950 the global production of plastic was around 2 million tonnes (Geyer et al., 2017). Yet, it was
around this time when plastic started to be mass-produced and its main market changed from the military
to everyday products such as food packaging, cosmetics packaging, textiles and similar (Andrady and
Neal, 2009; Geyer et al., 2017; Parker, 2018). The world realised what benefits this versatile material
can bring to our lives. From more health and safety in the food industry to energy savings in transport
(Andrady and Neal, 2009). Nowadays, around 40 % of plastic produced in the world is applied in
packaging, which is used once and then disposed (Geyer et al., 2017).
The rapidly increasing plastic production and use has given rise to the rapidly increasing plastic waste
generated. Globally, a mere 9% of all plastic waste generated until 2015 was recycled, 12% was
incinerated, and 79% was disposed of in landfills or the natural environment (Geyer et al., 2017).1 The
highest recycling rates are in Europe, where less than 30% of plastic is recycled (European Commission,
2018), followed by China with 25 % of plastic recycled (Geyer et al., 2017). These numbers are still
very low and need to be improved, since most of the plastic waste is littered, landfilled or incinerated
(Geyer et al., 2017). This gives rise to greenhouse gas (GHG) emissions, thus contributing to
anthropogenic climate change (Eriksson and Finnveden, 2009; European Commission, 2018; IPCC,
2014). Most of this plastic is fossil- based as bio-based plastic, derived from e.g. corn, potatoes, sugar
cane or sugar beet (IfBB, 2017), currently make up only 1% of the global annual plastic production
(European Bioplastics, n.d.).
In addition to GHG emissions generated from the production and waste management of plastic, leakage
of plastic rubbish into the oceans causes formidable damages to the environment. It has been estimated
that more than 80% of marine litter is made up by plastics (European Commission, 2018). This plastic
degrades to small microplastics less than 5 mm in size, which is eaten by marine species and can get
into the food chain (European Commission, 2018). Not only is the plastic polluting the marine
environment but also causing deaths of marine species (BBC, 2018; Borunda, 2019; Parker, 2018).
Therefore, the top ten single-use plastic items such as disposable plates, cutlery, straws or cotton buds,
making up over 70% of marine litter, are to be banned from the EU market from 2021(European
Parliament News, 2018).
If the plastic disposables are to be prohibited, however, the current “to-go” culture based on fast and
ready-made food and beverages is to prevail, alternatives to fossil-based, single-use items must be
developed. The Industry seems to notice the necessity of change and has thus introduced disposables
made of renewable materials, e.g. corn, sugar cane, wood, grass, leaves onto the market (Duni, n.d.(a);
Leafymade, n.d.; Vegware, n.d.). As Fieschi and Pretato (2018) have shown it is crucial what material
disposable tableware is made from since this has substantial impact on the end-of-life choices for the
product. Compostable tableware can reduce the overall environmental impact of food waste
management as it can be composted together with the food waste. Otherwise fossil-based, non-
compostable disposables would need to be incinerated or landfilled, which has a higher carbon, water
and resource footprint (Fieschi and Pretato, 2018). However, if bio-based and compostable disposables
are to substitute fossil-plastic disposables, they will need to be produced on a much larger scale than at
present. Therefore, it is crucial to study the environmental impact of these alternatives through their
life cycle in order to support sustainable consumption and production. Sustainable consumption and
production is one of the 17 global Sustainable Development Goals. It aims to reduce resource and
energy use; degradation and pollution along the whole life cycle of products and services, while
increasing quality of life (UN, n.d.).
Previous research in this field seem to target disposable cups rather than plates (Garrido and Alvarez
del Castillo, 2007; Häkkinen and Vares, 2010; Van der Harst et al., 2014; Van der Harst and Potting,
2013; Woods and Bakshi, 2014). The goal of these studies was to compare environmental impacts of
1
These numbers exclude bio-based plastic, produced from renewable biomass sources.
1disposable cups made of different materials in order to find the most environmentally friendly one.
Most of the studies were comparing bio-based materials with fossil-based materials. In some studies
bio-based materials scored better than fossil-based when it comes to global warming potential
(Häkkinen and Vares, 2010). Nonetheless, multiple datasets comparisons based on life cycle
assessments of disposable cups showed none of the cup materials to be consistently better than the
others (Van der Harst and Potting, 2013). However, three processes were identified to have the highest
environmental impact: production of the cup's basic material, cup manufacturing, and waste
processing (Van der Harst et al., 2014). Garrido and Alvarez del Castillo (2007) studied reusable and
single-use cups and concluded that in order for the reusable cup to have a smaller environmental
impact than the single-use cup, it needs to be used at least 10 times.
As no specific study on environmental impacts of single-use plates could be found this study intends
to address this research gap. The goal of this research was to assess the global warming potential of
common and popular alternatives to fossil-based, single-use plates on the market. The results should
serve actors in the Industry to make informed decisions on their product life cycle with the aim to
decrease their environmental impact. Ultimately, the results should also inform consumers about the
environmental impact of these products in order to make choices in line with sustainable consumption.
This study aims to answer the following research questions:
1. What is the environmental performance of single-use plates made from two different renewable
materials in the impact category global warming potential?
2. What are the hotspots in the life-cycle, contributing the most to the overall impact and with the
largest potential for improvement, of each type of plate?
2. Background
Disposables is a term encompassing consumer products and packaging that are mostly used only once
and then thrown away (Allaby and Park, 2013). They have become such common items in our throw-
away society that about 50 % of global plastic annual production is used to produce single-use items
(Plastic Oceans, n.d.).
Single use items are nowadays mostly associated with consumerism and excessive waste generation
(European Commission, 2018; Hall, 2017), even though one of the primary reasons for their invention
was sanitation. The idea of disposable cups is said to be inspired by an American public health officer,
Samuel J. Crumbine, at the beginning of the 20th century. Mr. Crumbine was on a train with his
tuberculosis patient, who drank from a common dipper and water bucket. After him came a young girl
and drank from the same dipper and bucket. Seeing the germs spreading this way inspired the health
officer to ban publicly shared utensils in public spaces (Bandini, 2018; Giordano, n.d.). Not long after
this ban had come into force two entrepreneurs invented a disposable paper cup to be used at public
spaces and prevent illness from spreading (Giordano, n.d.).
Introduction of disposables to the market was not just a matter of sanitation but soon it became a
matter of convenience too. Fast food restaurants, amusement parks, sport stadiums started to realise
other advantages offered by disposable tableware. They did not have to worry about theft, breakage or
washing-up of reusable dishware anymore (Giordano, n.d.). Disposables were also cheaper than their
reusable counterparts (Giordano, n.d.; Gitschlag et al., 2009). Furthermore, as eating out was
becoming more common (Giordano, n.d.), increasing demand pushed the food service industry to
become more efficient. A great example of this change in the food service industry is McDonald’s.
The fast food restaurant chain introduced the self-service and take-away concepts to their restaurants
based also on the use of disposable tableware (McDonald’s, n.d.).
When it comes to the history of disposable plate itself it is ambivalent. It has been manufactured from
an array of materials, however, the first disposable plate is said to be made of paper. There are
different names considered to be the first inventor of paper plate. Some argue it was the German
bookbinder Hermann Henschel and his invention happened in Luckenwalde in 1867 (Bandini, 2018).
2Others state that it was Martin Keyes of Lempster who invented the paper plate in 1903 in New
Hampshire (Encyclopedia of Products & Industries - Manufacturing, n.d.). The differing information
might be due to the material the paper plate was made of since Martin Keyes is said to invent moulded
pulp paper plate, which has a sturdier structure than sheet paper (Encyclopedia of Products &
Industries - Manufacturing, n.d.). The invention came to be instrumental in the restoration phase after
the earthquake in San Francisco in 1906 as the demand for paper plates said to have escalated
(Macken, 2017; Wonderopolis, n.d.).
During the 1940’s and 1950’s new materials began to emerge on the market. Different forms of
plastics, such as polypropylene or polystyrene were developed and were later commercially available
(Andrady and Neal, 2009). The properties they brought to the market – light weight, versatile
mouldability, insulation properties (Andrady and Neal, 2009) were also applicable and beneficial to
the food service industry. Disposable plates could have now been manufactured from plastic, which
unlike paper plates without lamination, made them soak proof, lighter, more cut resistant and still
economical (Gitschlag et al., 2009).
It was around this time when the concept of throw-away living appeared for the first time in a popular
magazine. The magazine LIFE dedicated a full page to disposable items such as “disposa-pan”,
disposable pet bowls or single use barbecue grills, which they considered to be part of throw-away
living (LIFE, 1955). In the magazine they were advertised as items that “cut down the household
chores”, saving time and labour (LIFE, 1955, p. 43). However, “behind the scenes” of this throw-away
culture lies a marketing strategy developed as early as the 1930’s based on obsolescence of products
(Whiteley, 1987). The main idea of this strategy is to convince consumers that they need a new
product because the current one has become obsolete due to its old design, disregarding its full
functionality. This led to consumers throwing away their old products and replacing them with new
ones in relatively short periods of time.
Unfortunately, this consumer mentality is still prevalent in our society and with the aid of globalisation
expands to economically developing countries too (Cole, 2010; Kuhn, 2009). What’s more our
lifestyles have been changing driven by convenience and fast-paced living (Business Wire, 2018; FMI,
2017). As a result, home delivery and online food service platforms have been experiencing growth as
well as fast-food, ready-made food and drinks to-go have become common in our culture (Business
Wire, 2018; FMI, 2017). The inevitable part of this culture is then the use of disposables, in which the
food and drinks come in. This trend is also reflected in the projected high demand for single use items
in the future. According to freely available online market research sources the global disposable plates
market is estimated to grow to the value of US$ 6 Billion by the end of 2027 from around US$ 3.5
Billion in 2017 (FMI, 2017). The disposable cups and lids market is also projected to experience a
growth of almost 7% annually between 2018-2022 (Business Wire, 2018).
With increased demand for single-use items comes an increased amount of waste generated. A
problem never talked about in the 1950’s has become a frequently discussed topic of the present day
(BBC, 2018; European Commission, 2018; Hall, 2017). Single-use items made of plastic are rarely
recycled and their leakage causes severe damage to the marine environment and littering (European
Commission, 2018). Therefore, as mentioned above, the European Parliament has approved the
Directive to ban plastic single-use items, including disposable plastic plates, from the EU market from
2021 (European Parliament News, 2018).
These concerns have brought businesses as well as the general public to think about and demand
ecological alternatives to plastic disposable plates. Thus, biodegradable disposable plates have been
emerging on the market recently. These are made of renewable materials such as wood, sugar cane,
bamboo or leaves (Duni, n.d.(a); Leafymade, n.d.; Little Cherry, n.d.). Paper plate has been a long-
standing alternative to the plastic plate since the 19th century, as mentioned above. However, these
plates are often coated with a plastic layer, which could be made of fossil- or bio-based plastic, in
order to become soak proof (MiniMaid Ab, n.d.). Another alternative is a leaf plate, made entirely
from leaves, which are heat pressed. This plate is based on a long-lived Indian tradition, serving food
on leaves instead of ceramic plates (Leafymade, n.d.; Little Cherry, n.d.). Bagasse plate, a recent,
popular biodegradable alternative to plastic plates, is made of a by-product of sugar and ethanol
3production. Usually burnt in the production process in order to supply bioenergy to the production
(Dias et al., 2015), it can also be used for production of paper and board (Tsiropoulos et al., 2015).
Another alternative is tableware made of bamboo. The base for this plate material is sawdust generated
from chopstick production (CINK, n.d.).
43. Methods
3.1 Life cycle assessment (LCA)
Life cycle assessment is a well-established, internationally recognised method of analysing and
quantifying environmental impacts of products and services through their whole life cycle, starting from
extraction of raw materials, through processing materials, to production, use and final disposal of a
product (European Commission, 2011).
There are three different models of life cycle assessment – “cradle-to-gate”, “cradle-to-grave” and
“cradle-to-cradle”. “Cradle-to-gate” LCA model takes into consideration all the processes from raw
material extraction to the factory gate of the product life cycle (Baumann and Tillman, 2004). “Cradle-
to-grave” model includes the whole product life cycle from raw material acquisition to the disposal of
the product (Baumann and Tillman, 2004). Lastly, “cradle-to-cradle” model maps the circular product
life cycle, where the product is not discarded after use but instead re-used or refurbished again.
Life cycle assessment can be used for different purposes. Most common reasons for LCA application
are learning about a product or service; decision making support and communication of specific
properties of the product (Baumann and Tillman, 2004). When carrying out a life cycle assessment, it is
inevitable to explore the product system in detail, thus learning about it. This can reveal critical points
for improvement. If the LCA is applied for a product system, learning about the deficiencies can serve
as a base for new product design or for a change in the existing supply chain. In the public sector, LCA
can be used to motivate a policy change (Baumann and Tillman, 2004). Finally, the results of an LCA
can be used for justifications for environmental product declarations or identification of crucial
indicators for requirements for eco-labelling (Baumann and Tillman, 2004).
In order to maximally utilise and compare the results of world-wide LCA studies, a standardisation of
the LCA methodology had to be carried out. This would reassure the quality of datasets and
harmonisation of the methodology across the globe. Therefore, the International Organisation for
Standardisation (ISO) issued an LCA standard, which comprises of two related standards, 14040:2006
and 14044:2006 (Matthews et al., 2014) However, the international standard still leaves practitioners
with their own choices to make that can affect the overall quality of the study (European Commission,
2011). For this reason, the Joint Research Centre of the European Commission published The
International Reference Life Cycle Data System Handbook. The Handbook is to provide technical
guidance for LCA practitioners and facilitate consistent and quality assured LCA data collection for
easier comparability of results within the EU (European Commission, 2011)
According to the ISO LCA standard there are four essential phases in a life cycle assessment: goal and
scope definition, inventory analysis, impact assessment, and interpretation (Matthews et al., 2014).
Interpretation is a continuous process and happens throughout the assessment as, for example, goal
and scope might be changed after interpreting the inventory analysis.
The first phase, the goal and scope definition, is the most essential as it influences all the subsequent
phases (European Commission, 2011). The goal definition states the intention of the study. The goal
should include the following four aspects: intended application(s) of the results; reasons for carrying
out the study; target audience of the results and comparative assertions (Baumann and Tillman, 2004;
European Commission, 2011; Matthews et al., 2014). A clear goal definition is vital for a correct
interpretation of the results (European Commission, 2011).
The goal definition guides the scope definition. The scope is defined by a number of qualitative and
quantitative information implying the extent of the study. The ISO LCA standard states 12 different
parameters denoting the scope, including function, functional unit, product system description, system
boundary, inventory inputs and outputs, impact categories and methods of impact assessment
(Baumann and Tillman, 2004; European Commission, 2011; Matthews et al., 2014).
5Function of the studied system is expressed quantitatively by a functional unit. It is a reference point
and all the results should be normalised by it. It also serves as a unit of comparison in comparative
studies (Baumann and Tillman, 2004). Further scope parameters are product system description and
system boundary. Product system describes all the necessary unit processes and flows that together
deliver a certain function of the product (Matthews et al., 2014). System boundary indicates what
processes and flows were included in the study and what is considered as surrounding environment.
The system description and its boundary are often accompanied by a diagram for the ease of
understanding.
The second phase of a life cycle assessment is inventory analysis. In this phase data are collected to
meet the stated goal and scope. The smallest element considered in the analysis is a unit process
(Matthews et al., 2014). Each unit process has inputs flowing in and outputs flowing out, after the
process has been undergone (Fig.1).
Fig. 1. Diagram depicting the inputs and outputs flow to unit processes in a product system (ISO 14040:2006).
Inputs are material, product or energy flows that enter a unit process, which could include raw
materials, intermediate products or co-products (Matthews et al., 2014). Inputs can come from nature
such as resources from the ground, water and air or from technosphere, i.e. human altered
environment, such as products from other unit processes (Matthews et al., 2014).
Similar to inputs, outputs are material, product or energy flows that leave a unit process and can
include raw materials; intermediate products; products; waste and releases to the ground, water and air
(Matthews et al., 2014). ISO defines raw materials as “primary or secondary material that is used to
produce a product”(Matthews et al., 2014, pp. 93–94). Intermediate products are products that are not
final yet but will be assembled to become one whole product. Such products can also be called
components. Co-products are “two or more products of the same unit process or system”(Matthews et
al., 2014, p. 94).
The third process in life cycle assessment is impact assessment. This is a required part of LCA,
otherwise the study can be considered a mere life cycle inventory (Matthews et al., 2014). Impact
assessment translates inputs and outputs calculated in the inventory analysis into impacts on the
environment or humans. It makes the results more understandable and possible to relate to. First,
impact categories are selected together with their indicators, followed by the choice of characterisation
model (Baumann and Tillman, 2004; Matthews et al., 2014). The choice of impact categories depends
on the goal and scope definition and the data collected during the inventory analysis (Baumann and
Tillman, 2004). For example, if releases of SO2, HCl, NH3 or NOx to the air were documented during a
product’s life cycle, the impact category “acidification” could be assessed. The indicators for this
6category are the amounts of SO2, HCl, NH3 and NOx and the characterisation model could be the model
developed by the Centre of Environmental Science at Leiden University (CML 2002 in Baumann and
Tillman, 2004).
After the impact categories, indicators and characterisation models have been selected, the next step is
classification. Classification organises inventory results under their relevant impact categories
(Matthews et al., 2014). The subsequent step is characterization, when the extent of environmental
impacts are calculated based on characterization factors (also called equivalency factors) (Baumann
and Tillman, 2004). In the case of acidification described above, all the emissions causing acidification
are added together based on the equivalency factors. Here the equivalency factors are based on the
potential to release H+ ions, which in turn causes acidification (Baumann and Tillman, 2004). Each
SO2 molecule reacts with water and oxygen to form sulfuric acid that in turn causes the release of two
hydrogen ions, while each HCl molecule releases one hydrogen ion (Baumann and Tillman, 2004).
Thus, the equivalency factors are 2 to 1, respectively.
The final stage of life cycle assessment is the interpretation phase. Although, as mentioned above,
interpretation takes place throughout the life cycle modelling, at the end of the assessment the results
for the specific impact categories are interpreted. If comparative LCA was undertaken, results from
different systems are compared with each other. Consequently, recommendations for improvements to
reduce impacts could be made.
Life cycle assessment was chosen as a method of analysis in this study. In order to fulfil the aim of
this research two different product systems were selected to be compared with each other. First one is
the system of a disposable plate made of Sal tree leaves (lat. Shorea robusta), grown in India. This
plate was selected because it is a far-travelled product, which has an impact on its carbon footprint. As
it is a relatively novel material for production of disposable plates in the Western world, an
investigation into the mode of its production and the associated environmental impact could be
informative for sustainable consumption within Europe. The second plate analysed is a disposable,
paper plate produced within the Nordics. This product was chosen due to its shorter distance in its
supply chain as opposed to the leaf plate. In addition, paper plate has been manufactured for over a
century now, thus its production is relatively advanced and well-studied within Europe in comparison
with the leaf plate. Therefore, comparing these two products might reveal some new knowledge about
sustainable production and consumption of disposable plates and create some spill-over effects
between the product systems.
3.1.1. Functional Unit
ISO 14040 defines the functional unit as “quantified performance of a product system for use as a
reference unit” (Benoît et al., 2010, p. 4). It allows quantitative assessment and comparison of impacts
(Benoît et al., 2010).
It is important that the functional unit is defined in a way that it is comparable within the different
systems in question. For the purpose of this study, the functional unit has been defined as follows: one
flat disposable plate. As a flat disposable plate can have different dimensions, the functional unit
needed to be further defined as one flat disposable plate of 20 (+- 2) cm diameter. These seem to be
the common dimensions of disposable plates on the market (Duni, n.d.(b); Leafymade, n.d.; Little
Cherry, n.d.)
73.1.2. System boundary and description
Fig. 2. A diagram of the product systems of both plates. The green boxes represent the processes specific to
the leaf plate and the orange boxes represent the processes specific to the paper plate. The dashed line depicts
the system boundary, showing that a “cradle-to-grave” LCA was carried out.
System boundary
This study took into consideration the whole life cycle of the two studied product systems, i.e. “cradle-
to-grave” perspective (Matthews et al., 2014). The cradle represents the initiation of the product
journey, starting from the extraction of materials, moving to processing, manufacturing, and
subsequent use. Eventually, if the product is not reused or refurbished, it comes to the end of its life,
which is represented by the grave.
Both disposable plates are used and disposed of in Uppsala, Sweden. The product systems of the leaf
and paper plate are to a large extent similar and are depicted in Fig. 2. The life cycle stages preceding
the “Use” stage of each product system will be described below. Packaging of the products is a part of
8the system studied. Furthermore, it was assumed that the customer comes to the shop by bicycle.
When it comes to transportation means within the two systems studied, only the use stage of vehicles,
i.e. transporting, was included in this study. The manufacturing of the vehicles was excluded.
Similarly, the life cycle of the food served on the plates is not included in the studied systems.
Therefore, the use stage of the plates was assumed to have no energy requirement.
At the end of their life, both plates could be either composted, anaerobically digested or incinerated
with energy recovery. Recycling is not an option as plates are heavily contaminated by food leftovers,
therefore, it would be impossible to recycle them. Landfilling of organic waste is forbidden by law in
Sweden (SFS 2001:512).
System descriptions
Leaf plate
Fig. 3. A picture of the leaf plate made from Sal tree leaves (Leafymade, 2019)
There are few companies producing leaf plates (Eco-gecko, n.d.; Leafymade, n.d.; Little Cherry, n.d.),
however, the leaf plate produced by Leafymade was selected as a representative of the leaf plate
scenario in this study. The leaf plate is produced by a young start-up called Leafymade located in
Uppsala, Sweden. The production takes place in eastern India, in the state of Odisha. Tribal women
collect leaves of Sal trees (lat. Shorea robusta) in the local rainforest. The leaves have special
properties such as water resistance, rigid structure and colour retention.
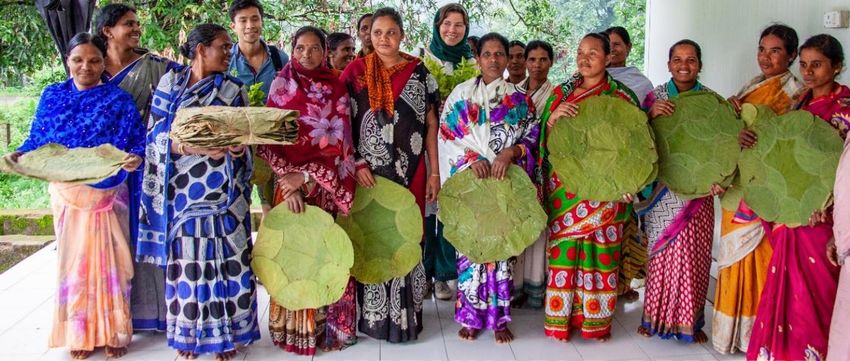
When leaves are picked they are washed first and then sewn together. The tribal women sew them on
mechanical sewing machines therefore no electricity is required. One plate requires six leaves. This
extraction and processing of the material for the plate is done in Daringbadi, India. After the leaves
have been sewn together and bundled (Fig. 4), they are transported to another city Bhubaneswar, India
(246 km).
9Fig. 4. A picture of Leafymade's employees with bundles and sewn leaves, ready to be transported further
(Leafymade, 2019).
In Bhubaneswar the sewn leaves are pressed at electrical heat-press machines. The plates are then
packed in corrugated cardboard boxes and sent to Kolkata, India (442 km). In some cases (8% of all
the shipments so far), the plates are transported from Bhubaneswar, India to Stockholm, Sweden by
airplane (Mehta, 2019). This is in case of time pressure, when Leafymade needs product samples as
soon as possible (Mehta, 2019). Most of the time (92% of all the shipments so far) the goods are
transported by ship from Kolkata, India to Gothenburg, Sweden (Mehta, 2019). Compared to shipping
goods by air, the sea transport is markedly longer and can take about a month (Searoutes, 2019).
After arrival in Sweden, the shipment continues to Uppsala by road. In Uppsala, plates are re-packed
to packages of 12 plates each. Packaging is made of bio-based polyethylene (Bio-PE), which is 100%
recyclable, however not biodegradable (Braskem, 2019). Each packaging has 2 paper stickers
containing information about the product. Packages are then ready to be sent to points of sale.
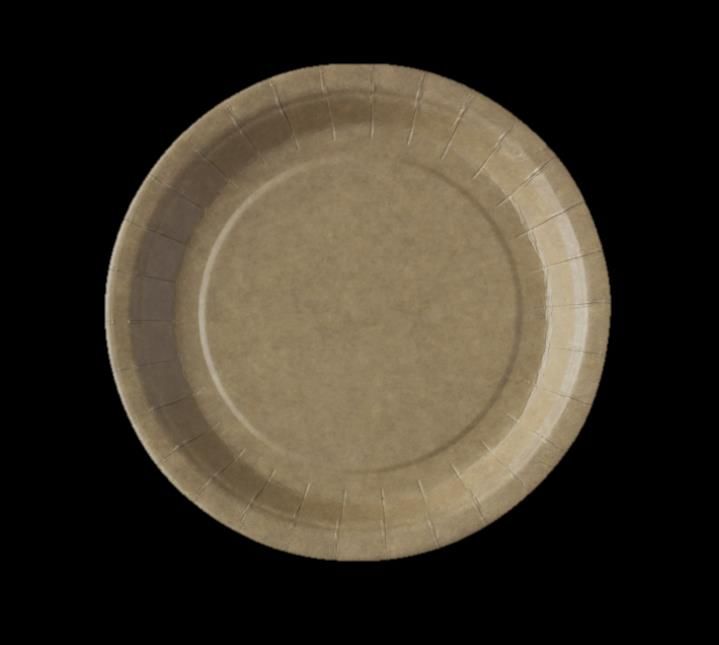
Paper plate
Fig. 5. An illustrative picture of paper plate made from paperboard (MiniMaid, n.d.)
10Since its invention, disposable paper plate has been manufactured by many different companies
around the world, each of them with specific manufacturing processes. In this research, the paper plate
produced by the Finnish company MiniMaid was selected as a case study due to the relatively close
proximity of the production line to Uppsala, Sweden.
The journey of the paper plate starts with wood harvesting. This involves a number of processes,
starting from the site preparation for tree planting, subsequent logging and final transport to a pulp
mill (González-García et al., 2009). Upon arrival to the pulp mill wood logs need to be debarked and
processed into wood chips. Wood chips can be turned into pulp by three different main methods of
pulping – mechanical, chemical or biopulping (Das and Houtman, 2004). Mechanical pulping involves
applying mechanical forces to grind wood against a rotating stone (Das and Houtman, 2004). The
wood chips can be pre-treated by steam (thermo-mechanical pulp) or the combination of steam and
sodium sulphite (chemi-thermomechanical pulp) (CEPI, n.d.; Das and Houtman, 2004). Mechanical
pulping is energy-intensive, gives higher yields but lower strength fibres than pulp obtained by
chemical pulping (Das and Houtman, 2004).
Chemical pulping uses chemicals in a cooking process to remove lignin from the wood and separate it
to cellulose fibres (CEPI, n.d.). This gives lower yield but fibres of higher strength than mechanical
pulping (CEPI, n.d.; Das and Houtman, 2004). Biopulping is the third method of pulping, where
lignin-degrading fungi is applied before pulping (Das and Houtman, 2004). The integrated pulp and
board mill that produces the paperboard used for MiniMaid’s paper plates uses both chemi-
thermomechanical pulping and chemical pulping methods (Metsä Board Husum, n.d.).
Even though each board grade is produced by machines tailored to its specific standard, the overall
basic process of paper and board making is similar (Ottenio et al., 2004). After pulp has been obtained,
it can be bleached depending on its final use (Australian Packaging Covenant, n.d.; Iggesund, n.d.;
Ottenio et al., 2004). In this study, unbleached pulp was assumed to be used for the paper plate.
Unbleached pulp is then screened, cleaned and diluted in water (Iggesund, n.d.; Ottenio et al., 2004).
Following the cleansing process, chemicals are added into the mixture of raw fibres and water, which
is then pumped to the headbox, a device controlling the flow of the mass (Ottenio et al., 2004). The
headbox feeds the stock onto the wire section, a woven mesh conveyor belt (Ottenio et al., 2004). As
the paper mass travels on the conveyor belt the water is drained away, leaving fibres on the mesh. By
the time the mat of fibres arrives at the end of the wire section it has become a sheet of paper (Ottenio
et al., 2004). A paperboard machine has a number of formation devices in headboxes and wires which
manufacture multi-ply sheets, combined later in the process (Ottenio et al., 2004). The moist sheets of
paperboard move to the press section, where more water is squeezed out, which binds the fibres
together (Ottenio et al., 2004). The sheets are then dried by steam. Halfway through the drying process
paperboard can be coated with pigments and binding agents (Ottenio et al., 2004).
According to the wishes of the customer paperboard can be coated by a number of soak-proof
materials such as polyethylene (PE), water-based barrier (MiniMaid Ab, n.d.) or a compostable
polylactic acid layer (Shah et al., 2008). MiniMaid provides their customers with the options of PE- or
water-based dispersion coating (MiniMaid Ab, n.d.). The process of coating can be performed at the
paperboard mill or at a separate factory (Knutar, 2019). At MiniMaid most of the coating is done at a
separate factory (Grahn, 2019). After the paperboard has been transported to and coated in a separate
factory, it is sent to MiniMaid.
The production process at MiniMaid starts with forming plates by pressing them out of the
paperboard. The plates are then packed using polyolefin shrink film and placed into a corrugated
cardboard box to be shipped to customers (Knutra, 2019). Most of the time (70% of deliveries) a full
truck of 2 million paper plates is sent at once (Knutar, 2019).
113.1.3. Inventory data collection
In this section, inputs and outputs of unit processes of the life cycles of the two plates are described.
Processing of the data will be discussed in the succeeding section.
Leaf plate
Data for this system were collected in close collaboration with the company Leafymade through
regular visits to the company, emails and phone calls.
The first stage of the life cycle is extraction of material. In Leafymade’s product system this stage only
comprises of one unit process - picking leaves. Picking leaves does not require any other energy than
manpower. The only raw material needed for this process is leaves collected from the rainforest, which
are also the only output of this process.
The second stage of the life cycle is processing of the leaves collected. This includes washing and
sewing of the leaves. Washing uses ca. 10 ml of water per six leaves (Mehta, 2019). No other natural
or artificial materials are used for this unit process. The only output associated with this unit process is
waterborne dust washed off the leaves.
Sewing is done on mechanical sewing machines. As one plate is made of six stitched leaves, sewing
one plate requires 40 cm of cotton thread, of which 5 cm is wasted in the process (Mehta, 2019). At
the end of this life cycle stage the sewn leaves are stacked, bundled and transported from Daringbadi
to Bhubaneswar. The distance between the two cities is 246 km and a light diesel truck is used for this
journey. As the truck uses a diesel combustion engine, it generates outputs in the form of greenhouse
gas (GHG) emissions.
The production of plates begins with the arrival of the stitched leaves in Bhubaneswar. Depending on
the quality of leaves, a small amount of water (ca. 2 ml/plate) may be sprinkled on leaves in order to
increase elasticity before pressing (Mehta, 2019). Pressing and drying of plates happens at the same
time as leaves are hot pressed by heat press machine. Based on the daily energy consumption and daily
plate production of the facility acquired from Leafymade, it was calculated that the electricity used per
plate was 9 Wh. As production of electricity emits GHG so does utilisation of electricity for processes.
Thus, the output from hot pressing of the plates are atmospheric emissions. When it comes to solid
waste, after pressing one plate, the cut-off pieces of leaves generate 390 cm² of solid waste per plate.
After the production stage, plates are packed in corrugated cardboard boxes. The standard number of
plates per box is 1350. One shipment consists of 19 boxes of 260 kg of gross weight and 237 kg of net
weight according to the shipment list used for calculations (Mehta, 2019). In this shipment, 25 485
plates were transported from India to Sweden. Therefore, the weight of one plate was calculated as 9.3
g.
Once the plates are ready to be shipped, they are sent from Bhubaneswar to the port city Kolkata,
India. The distance between the two cities is 442 km and the goods are transported by a light truck.
From Kolkata the plates travel to the port of Gothenburg, Sweden. This can take almost a month as the
journey is about 15 663 km long (Searoutes, 2019). From Gothenburg the goods are transported to
Uppsala by a rigid truck. The distance between the cities is 453 km. All this transportation emits
greenhouse gases.
In case of shipment via air freight, the goods are sent from Bhubaneswar airport to Stockholm,
Arlanda airport. Five boxes out of 65 boxes shipped so far have been transported by air from India to
Sweden. After arrival in Stockholm, the shipment is later transported to Uppsala by a rigid truck. This
is 71 km. The outputs of these processes are again GHG emissions.
In Uppsala, plates are re-packed to packages of 12 plates each. Packaging is made of bio-based
polyethylene (Bio-PE), which is 100% recyclable, however not biodegradable, and is made of sugar
cane (Braskem, 2019). Each package of 12 plates has two paper stickers on with information about the
product.
12Paper plate
Data for this plate were collected in collaboration with the company MiniMaid through
communication via emails and phone calls. MiniMaid is a private label manufacturer, thus it is the
customers who choose parameters of their desired plate, including thickness of paperboard or numbers
of plates per packaging. Therefore, the figures provided here are for a hypothetical average paper plate
(Knutar, 2019). All figures refer to the calendar year of 2018 (Knutar, 2019).
Since only the production of paper plates takes place at MiniMaid all the data for upstream processes
had to be acquired from businesses MiniMaid contracts with. There is a number of businesses
MiniMaid gets their supplies from thus for the purpose of this study one significant supplier of
paperboard was chosen. This integrated pulp and paperboard mill is located in Husum, Sweden
(Knutar, 2019).
As attempts to interview Husum mill were not successful information on wood supply had to be
assumed based on literature sources. Hence, the data for the first stage of the paper plate life cycle –
extraction of wood – were derived from the study performed by González-García et al. (2009). This
study investigated the whole process of extraction of wood; from site preparation, logging to wood
transport from forest landing to the pulp mill gate (González-García et al., 2009). It was chosen to be
representative since both the pulp mill examined in the study and the pulp and paperboard mill used in
the paper plate scenario are located in Northern Sweden, in close proximity to each other (González-
García et al., 2009; Grahn, 2019). The pulp mill studied by González-García et al. (2009) delivers 25%
of its wood supply from Baltic countries, 30% from South Sweden and 45% from Central Sweden.
This delivery is done by a combination of trucks and ships. All the energy required by silviculture2,
logging and transport is considered as inputs to the first phase of the paper plate’s life cycle. The total
non-renewable energy consumed in these processes is 370 MJ/m3 of wood (González-García et al.,
2009). The outputs of the aforementioned processes are the total GHG emissions associated with the
energy use, which is 36.1 kg CO2 eq/m3 of wood (González-García et al., 2009).
After the delivery of pulpwood to Husum’s mill gate, chemical and chemi-thermomechanical pulping
start. The pulp yield from wood is normally around 55% for chemical pulping (FEFCO and CEPI
Containerboard, 2015), meaning that 1000 kg of wood yields 550 kg of pulp. In order to find out more
information about GHG emissions from the processes at the integrated mill in Husum, the mill’s
website was searched for environmental profiles of their products. Only two kinds of paperboard were
found suitable for paper plate application, one uncoated and one coated (Metsä Board, n.d.). The
uncoated paperboard was selected as representative since MiniMaid have their paperboard coated in a
separate factory (Grahn, 2019). Hence, the environmental profile of the “MetsäBoard Natural FBB
175–325 g/m2” was selected. Based on the environmental profile of this paperboard the process of
making pulp and subsequent paperboard emits 44 kg of fossil CO2 /tonne of paperboard (Metsä Board,
2018). This is due to the fact that 82% of the total fuels used in all the mills within the Metsä Board
group are derived from biomass (wood, bark, black liquor3) (Metsä Board, 2018). According to the
environmental profile of the paperboard investigated, 84 % of its content is made up by pulp, 8% by
moisture, 5 % by binders and 3 % by pigments and fillers (Metsä Board, 2018).
After the paperboard has been manufactured it is shipped to a separate factory for coating. The
distance is between 10 to 50 km (Knutar, 2019). MiniMaid provides two kinds of coating; PE-based
coating or bio-coating (water-based dispersion barrier) (MiniMaid Ab, n.d.). Bio-coating is based on
dispersion of solid material dissolved in water. The solid material used can vary from titanium dioxide
(TiO2) nanoparticles in combination with polyolefin copolymers (Mates et al., 2016) to fluoroacrylic
copolymer in combination with hydrophilic bentonite nanoclay (Mates et al., 2014) as well as their
proportion in relation to water; 5 % and 3% respectively (Mates et al., 2014, 2016). One plate uses
0.39 g of bio-coating or 0.55 g of PE coating (Knutar, 2019). As the exact composition of bio-coating
2
The branch of forestry that is concerned with the cultivation of trees (The Free Dictionary, n.d.).
3
black liquor is the waste product from the kraft process when digesting pulpwood into paper pulp removing
lignin, hemicelluloses and other extractives from the wood to free the cellulose fibres (Climate Technology
Centre & Network, 2016)
13applied on Minimaid’s paper plates was unknown and considering that some bio-coating is still based
on elements found in plastic, the end of life of the paper plate coated with such material is ambivalent.
Therefore, PE layer was chosen as coating for the paper plate scenario, since the process of production
is relatively known and the end of life of such paper plate is unambiguous; incineration with energy
recovery.
Coated paperboard is later transported to MiniMaid by a 20-tonne truck (Grahn, 2019) over a distance
of 330 km. The entire truckload of 40 tonnes of paperboard is shipped to MiniMaid at once (Knutar,
2019). The sheets of paperboard are then pressed into plates. Electricity required for pressing one plate
is 2,8 Wh (Knutar, 2019). The weight of one plate is 8.4 g, with a layer of PE coating it is 9 g (Knutar,
2019). A pressed plate is then packed using 0.05 g polyolefin shrink film per plate (Knutar,2019).
Stacks of plates are then placed into corrugated cardboard boxes. The average number of plates per
box is 600 and the weight of the corrugated cardboard box is 277 g (Knutar, 2019). The packed paper
plates are ready to be shipped to customers. A standard delivery comprises of 2 million plates with a
fully loaded truck (Knutar, 2019).
3.1.4. Inventory data processing
This section will explain what software and methods were used to process the collected data above in
order to calculate greenhouse gas emissions of the two plates.
Leaf plate
Transportation
In order to calculate GHG emissions from transportation of leaf plates throughout their life cycle, The
Network for Transport Measures’ (NTM) Calculator Advanced 4.0 was used (“NTMCalc 4.0”, n.d.).
In this calculator, among the most important variables influencing the overall GHG emissions from
transportation are “cargo load factor” and “cargo carrier capacity”. Cargo load factor is the percentage
of the maximum weight/volume load capacity that is actually utilized by the shipment (“NTMCalc
4.0”, n.d.). Cargo carrier capacity is maximum weight/volume load capacity of the vehicle used for
transportation (“NTMCalc 4.0”, n.d.).
For the first leg of the journey from Daringbadi to Bhubaneswar (246 km) a vehicle type “van” was
used as it corresponds most to the light truck used in India. It was assumed that the van runs on fuel
corresponding to Diesel B5-EU and its fuel consumption was 8.5 l per 100 km. The cargo load factor
was 100% and 50% of this load is taken by Leafymade’s shipment, which represents 4 m³.
For the second leg of the journey, from Bhubaneswar to Kolkata (442 km), the same vehicle type as
above with the same vehicle specifications is used. The calculation model was based on the shipment
weight. The cargo load factor for this shipment was 50% of the total cargo capacity 2.25 tonne and
Leafymade’s weight was 260 kg.
When it comes to transportation by sea from Kolkata to Gothenburg (15 663 km), the sea routes
calculator was used to estimate the route of the ship (Searoutes, 2019). This route was then entered
into the NTM Calculator. The vehicle type used for this calculation was “bulk carrier” as its weight
corresponds most to the actual vessel’s weight used for transportation of Leafymade’s shipment. The
shipment weight was 260 kg. The default cargo load factor (55 % of the full cargo capacity) was
applied.
From Gothenburg to Uppsala (453km) “rigid truck of 7.5-12 t“ was used as a transportation mode,
using Diesel B5 with the engine of Euro 3 class. Its fuel consumption was 17.8 l per 100 km and full
cargo carrier capacity 6 tonne. Cargo load factor was kept as in the default option (40 % of the total
cargo carrier capacity) and Leafymade’s shipment weighed 260 kg.
For air transport “belly freighter – cargo, range based averages” was chosen in the NTM Calculator.
The shipment was transported from Bhubaneswar airport to Arlanda, Stockholm airport (6996 km).
14Cargo carrier capacity was 14 000 kg and the default cargo load factor was 65 %. The weight of
shipment was 14 kg.
The last leg of the journey from Stockholm to Uppsala (71 km) was done in the vehicle type “van”
with the same specifications as described above. Cargo carrier capacity was 1.5 tonne, cargo load
factor was 20 % of the full capacity and Leafymade’s shipment weighed 14 kg.
Processing
As processing of leaves is done on mechanical sewing machines no electrical power is required. The
only unit process in the production phase of the leaf plate that utilises electric power is heat pressing.
Even though a proportion of electricity produced in India is made from renewable energy sources,
most of the electricity still comes from coal (Central Electricity Authority, 2019). Therefore, in order
to quantify GHG emissions of the electricity used in pressing of the plates, the data for GHG
emissions from Indian electricity mix had to be acquired. For this calculation the “Standard values for
emission factors v.1.0.” dataset compiled by the European Commission (2014) was used. This dataset
stated that per 1 MJ of electricity produced in India 292 g CO2 eq is emitted to the atmosphere. The
electricity used per plate was 31 kJ.
Packaging
Packaging can be divided into two subgroups. Packaging used for transport from business to business
and the final packaging of plates designated for the end customer. Business to business packaging is
described first, followed by the end consumer packaging.
The leaf plates are packed in corrugated cardboard boxes with these dimensions (LxWxH) 0.63 m x
0.42 m x 0.42 m (Mehta, 2019). Each box weighs 1 kg (Mehta, 2019). For the purpose of calculating
GHG emissions from packaging the figures from a Finnish comparative study were used (Koskela et
al., 2014). In this study the environmental impacts of reusable plastic crates were compared with those
of corrugated cardboard boxes by the means of life cycle assessment. Koskela et al. (2014) took into
account GHG emissions from manufacturing of the boxes, their use, the delivery routes to retailers and
waste management/recycling of the boxes. They used a corrugated cardboard box with the dimensions
0.54 m x 0.33 m x 0.11 m (LxWxH) and of 0.2 kg weight (Koskela et al., 2014). GHG emissions of
such cardboard box were 0.9 kg (Koskela et al., 2014). These figures were then scaled up to the weight
of the corrugated cardboard box Leafymade uses (1 kg). The final number for GHG emissions of
Leafymade’s box seemed to be in agreement with another study examining environmental impact of
corrugated cardboard boxes (Yi et al., 2017). When the figures from this study were scaled up to the
weight of Leafymade’s box, the number for GHG emissions was almost identical with the number
based on the Finnish study.
The end consumer packaging for the leaf plates is made of bio-based polyethylene (Bio-PE), which is
100% recyclable, non-biodegradable and made of sugar cane (Braskem, 2019). The length of the
package (31 cm) was calculated based on the overall length of the bio-PE roll supplied by the supplier
and the number of packages made from it. The width of the package (25 cm) was obtained from the
supplier (Högström, 2019). The supplier also stated that in order to manufacture bio-HDPE used for
packaging 23-27g/m2 of Bio-PE is needed (Högström, 2019). As the area of one packaging is 0.2 m2
and 25 g of Bio-PE is needed for 1 m2, one package uses 4 g. There are 12 plates in one package,
therefore the amount needed per one functional unit is 0.3 g. According to a cradle-to-gate life cycle
assessment study of bio-PE production, which included ethanol production; bio-ethylene production;
polymerisation to bio-HDPE and final transport of the polymer from Brazil to Europe; production of
bio-HDPE emits 2.45 kg CO2 eq/kg bio-HDPE (Tsiropoulos et al., 2015).
The processing of bio-HDPE resin to bio-HDPE film used for packaging requires 0.5 kWh/kg bio-
HDPE film produced (Högström, 2019). As one plate needs 0.3 g bio-HDPE, then the electricity
required for the production of film per plate is 0.15 Wh. In order to calculate GHG emissions from this
process, GHG emissions from the electricity mix for Sweden had to be acquired, since the production
of bio-HDPE film takes place in Sweden. This number was found in Moro and Lonza (2018), where
they accounted for upstream production as well as import and export of electricity for each Member
state of the EU. For Sweden the carbon intensity of electricity was 47 g CO2 eq/kWh when taking into
15You can also read