DET NORSKE VERITAS Global Technology Roadmap for CCS in Industry - Sectoral Assessment: Refineries - UNIDO
←
→
Page content transcription
If your browser does not render page correctly, please read the page content below
DET NORSKE VERITAS

Global Technology Roadmap for CCS
             in Industry
   Sectoral Assessment: Refineries

        Report No./DNV Reg No.: / 12P5TPP-9
              Draft Rev 3, 2010-08-25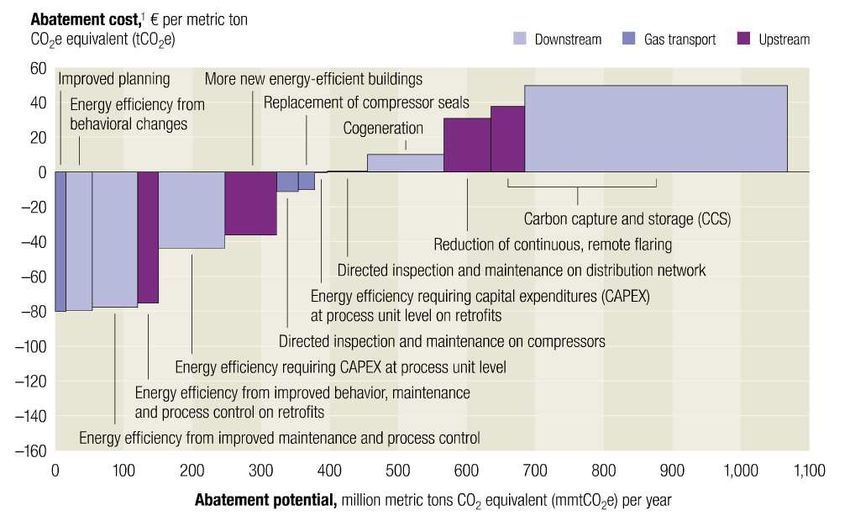

DET NORSKE VERITAS
Research Report for UNIDO
Global Technology Roadmap for CCS in Industry
Sectoral Assessment: Refineries
                                                                           MANAGING RISK

SUMMARY
This report provides an overview of the potential application of carbon capture and storage technologies to
refineries. It describes the industry today, including its CO2 emissions and goes on to analyse various ways
in which CO2 capture technology could be applied. It looks at legislative influences, costs and concludes
by identifying challenges and recommended next steps. Transport and storage aspects of CCS are only
touched upon as they are common with other industries.
At best, the refining of conventional crude will grow slowly, particularly in the Middle East and Asia, as
predicted by OPEC in the decades out to 2050. However in the IEA BLUE map scenario which is
considered to offer the opposite end of the spectrum in terms of predictions for the refining industry, the
industry may shrink considerably over the same period, as demand decays and conventional liquid fuels
are replaced by non-conventional sources. Non-conventional sources include natural gas liquids (NGLs),
gas to liquids (GTLs), coal to liquids (CTLs) and biofuels. It is likely that the emission intensity of the
refining industry will increase during this period due to the use of heavier crudes and tighter specifications
for product quality. Despite this, in the long term to 2050 there is also the possibility that absolute
emissions may decline because the outlook for the refining industry is uncertain: Non-conventional fuels
pose a real threat to supply of conventional liquids and hence refining in the short term and climate
abatement policy will play a role. In the period up to 2030, it is likely that any growth in the refining
sector will be in the Middle East and Non-OECD Asia-Pacific with little in Europe and North America.
Transport related emissions including refining in China, India and rest of world including Middle East,
Africa and Latin America have potential to grow to 2050, hence there is potential for greenfield CCS
deployment in refineries of these regions. In the same period to 2050 more established markets such as the
OECD, potential CCS deployment may be for retrofit of existing refineries.
CCS is a technology that offers carbon abatement for the combustion of fossil fuels. In the refining
industry perspective, it is unclear how much of a role it will play in the long term (to 2030) due to the
comparably high cost of capture, tight refining margins and multiple different CO2 sources on a refining
site. Adding to this uncertainty are major studies such as the Energy Technology Perspectives and
Technology Roadmap for CCS from the IEA, which do not specify the role of CCS in the refining sector.
There are, however, existing publicly funded demonstration projects underway in the sector, such as those
at Mongstad, Rotterdam, Port Arthur and Edmonton. McKinsey and Company suggest CCS will be an
appropriate technology for carbon abatement in oil and gas sectors of Western Europe and North America
to 2030.
Of the CCS technologies, post-combustion technology offers potential for refineries in the near future.
However, in the longer term and as these technologies develop; other promising technologies may develop
for lower cost deployment: Hydrogen production using either heavy residue gasification or steam methane
reforming with chemical absorption separation produces a high purity CO2 stream that seems to be the
lowest cost capture option at ~€30/tCO2 avoided. The cost of CO2 capture will be greater for refineries
producing high purity hydrogen using pressure swing absorption, because the CO2 produced requires
further processing to reach economic specifications required for transport and storage. The energy penalty
resulting from capture is a major influence on the avoided cost of CO2 capture, as is the space requirement
for capture and transport technology on a refinery site. Post combustion technology exists for heaters,
boilers, fluid catalytic crackers and utilities, but at much higher costs (>€80/tCO2 avoided). Oxy-firing
technology is a promising technology but lags post combustion technology in that it remains untested on
the scales required for commercial deployment. Pre-combustion technology also has potential in a refinery
because of the smaller CO2 sources, but again the development of this technology lags post-combustion.
Although not a focus of this assessment, transport and storage have a large influence on the cost of the
CCS chain and are specific to each site. Given that the absolute amount of CO2 emitted is smaller than

 DNV Reg. No.: 12P5TPP-9
 Revision No.: 3
 Date : 2010-08-27                              Page ii
DET NORSKE VERITAS
Research Report for UNIDO
Global Technology Roadmap for CCS in Industry
Sectoral Assessment: Refineries
                                                                          MANAGING RISK

from power stations, CCS for refineries could benefit from the scale economy of CO2 transport and
storage network infrastructure.
In conclusion, the outlook for CCS in the refining industry is mixed. Technology exists that could be
deployed, but cost and complexity is a barrier for capture at most point sources on a refinery, with capture
on certain hydrogen production processes being the notable exception of limited materiality. Policy that
could to lead CCS in the refining sector has the potential to also reduce the demand for transport fuels, and
reduce the output and emissions from the refining sector. Supporting CCS in the refining sector would
have to include support for new technologies that could substantially reduce the deployment costs for
many units of a refinery. Planned publicly funded CCS demonstrations at a number of sites around the
world are a step towards this. The longer term outlook to 2050 for the refining sector on the whole is even
less certain with demand for liquid fuels potentially being eroded by use of non-conventional sources and
carbon abatement policy.
Notwithstanding the uncertain future for the refining industry on the whole there are measures that have
potential to overcome the barriers to CCS deployment in the refining sector and reduce uncertainty. A
comprehensive emissions inventory can be developed and standard methodologies for calculating
emissions universally accepted. This will could either include or lead to characterisation of the unique
emissions of each unit operation. As an outcome, emissions abatement with lower cost than CCS could be
identified and addressed to reduce potential capture inventories. There is also existing information and
experience for CCS and related processes specific to the refinery sector, which could be consolidated and
disseminated globally. On top of this commercial demonstration of CCS technology in a refining setting
could also help reduce the uncertainty.

 DNV Reg. No.: 12P5TPP-9
 Revision No.: 3
 Date : 2010-08-27                              Page iii
DET NORSKE VERITAS
Research Report for UNIDO
Global Technology Roadmap for CCS in Industry
Sectoral Assessment: Refineries
MANAGING RISK
TABLE OF CONTENTS
1 INTRODUCTION...........................................................................................................................1
2 CHARACTERISTICS OF THE REFINING SECTOR..............................................................1
2.1 Outlook for Refining Sector ...................................................................................................4
2.2 Refining Industry interest in CCS...........................................................................................6
3 CURRENT AND PROJECTED EMISSIONS .............................................................................8
3.1 Historic Emissions and Uncertainty........................................................................................8
3.2 Projected Emissions ................................................................................................................9
4 TECHNICAL OVERVIEW OF CAPTURE TECHNOLOGY ................................................11
4.1 Process Heaters .....................................................................................................................12
4.2 Utilities..................................................................................................................................15
4.3 Fluid Catalytic Cracker .........................................................................................................17
4.4 Hydrogen Production............................................................................................................18
4.5 Carbon abatement options other than CCS for the refining sector .......................................19
5 ESTIMATED COSTS AND INVESTMENTS ...........................................................................22
5.1 General CCS costs ................................................................................................................22
5.2 Refinery Specific Costs ........................................................................................................22
5.3 Financing CCS ......................................................................................................................24
6 LEGISLATIVE PRESSURES ON REFINERY CARBON EMISSIONS ...............................24
6.1 Transport Fuel Quality Legislation.......................................................................................25
6.2 IMO MARPOL Fuel Specification Changes ........................................................................25
6.3 Clean Development Mechanism (CDM) ..............................................................................26
6.4 Emissions Trading Schemes .................................................................................................27
6.5 Carbon Leakage Mechanisms ...............................................................................................27
7 CONCLUSIONS ...........................................................................................................................28
7.1 Major Gaps and Barriers to Implementation.........................................................................29
7.2 Actions and Milestones.........................................................................................................30
8 REFERENCES ..............................................................................................................................32
DNV Reg. No.: 12P5TPP-9
Revision No.: 3
Date : 2010-08-27 Page ivDET NORSKE VERITAS
Research Report for UNIDO
Global Technology Roadmap for CCS in Industry
Sectoral Assessment: Refineries
MANAGING RISK
ABBREVIATIONS
API – American Petroleum Institute
bbl – Barrel of oil
bbl/d – Barrels of oil per day
BREF – Best Available Technology Reference Document
CAPEX – Capital Expenditure
CAP – Chilled Ammonia Process
CCP – CO2 Capture Project
CDM – Clean Development Mechanism
CCS – Carbon Capture and Storage
CHP – Combined Heat and Power Generation
CO2 – Carbon Dioxide
CTL – Coal to Liquids
EERP – European Economic Recovery Program
EIPPCB – European Integrated Pollution Prevention and Control Bureau
ETS – Emissions Trading Scheme
EU – European Union
EU ETS – European Union Emissions Trading Scheme
EU NER300 – European Union New Entrants Reserve allocation of 300 million carbon credits
FCC – Fluidised Catalytic Cracker
GHG – Greenhouse Gas
GTL – Gas to Liquids
H2 – Hydrogen
HCC – Hydro Catalytic Cracker
HDT – Hydro-treating unit
IEAGHG – International Energy Agency Greenhouse Gas Research and Development Programme
IEA – International Energy Agency
IMO – International Maritime Organization
IPCC – International Panel on Climate Change
IPIECA – International Petroleum Industry Environmental Conservation Association
MARPOL – Marine Pollution
Mbbl/d – Million barrels of oil per day
MDEA - Methyldiethanolamine
DNV Reg. No.: 12P5TPP-9
Revision No.: 3
Date : 2010-08-27 Page vDET NORSKE VERITAS
Research Report for UNIDO
Global Technology Roadmap for CCS in Industry
Sectoral Assessment: Refineries
MANAGING RISK
MEA – Monoethanolamine
MtCO2 – Million tonnes of CO2
NGL – Natural Gas Liquids
NOx – Oxides of Nitrogen
NPRA – National Petrochemical and Refiners Association
LPG – Liquefied Petroleum Gas
OECD – Organisation for Economic Co-operation and Development
OPEC – Organization of Petroleum Exporting Countries
ppm – Parts per million
PSA – Pressure Swing Absorption
RCI – Rotterdam Climate Initiative
SCR – Selective Catalytic Reduction
SECA – SOx Emissions Control Area’s
SMR – Steam Methane Reforming
SOx – Oxides of Sulphur
TCM – European CO2 Technology Centre Mongstad
UNFCCC – United Nations Framework Convention on Climate Change
UNIDO – United Nations Industrial Development Organization
UK – United Kingdom
US – United States of America
US DOE – United States of America Department of Energy
WPC – World Petroleum Council
DNV Reg. No.: 12P5TPP-9
Revision No.: 3
Date : 2010-08-27 Page viDET NORSKE VERITAS
Research Report for UNIDO
Global Technology Roadmap for CCS in Industry
Sectoral Assessment: Refineries
MANAGING RISK
1 INTRODUCTION
Crude oil refineries are responsible for the separation and processing of crude oil to make more
valuable petroleum products such as liquid petroleum gas (LPG), naphtha, gasoline, jet fuel, diesel
fuel, and. heating oil. Modern refineries have a range of integrated processes such as distillation,
reforming, cracking and hydrotreating, all of which require significant heat input via fuel combustion.
The fuel utilized in the process heaters, reactors and steam boilers comprise of petroleum coke,
process (still) gas, petroleum fuels and natural gas (Rootzen et al. 2009).
CO2 emissions from refineries reportedly account for about 6% of global stationary CO2 emissions
(IPCC, 2005) or nearly 1 billion tonnes of CO2 per year (IEAGHG, 2008). However, these figures are
widely debated and are the topic of further discussion later in this assessment. According to van
Straelen et al. (2009), a typical large-scale (300,000 barrel per day) refinery will produce between 0.8
and 4.2 million tCO2/y. Energy use and CO2 emissions vary depending on processed crude, extent of
processing, and quality and composition of the product mix.
This assessment will be used as a basis for drafting a CCS roadmap for industrial processes, including
refineries, and will form the basis for identifying the steps that need to be undertaken to expand
industrial CCS from where it is today to 2050, to help achieve global GHG emission reduction
targets. The assessment will include a status of the technology in the refining sector as well as the
trends and prospects for deployment of CCS in developing regions out to 2050. The report will focus
on:
- characterising the global refining industry
- current and projected refining industry emissions of the refining sector
- technical assessment of technology for CO2 capture in refineries
- current and potential use of CCS in refining sector
- estimated costs of capturing CO2 generally and more specifically for the refining sector.
- legislative pressures relating to the refining sector
- identifying barriers to implementation of CCS in the refining sector
- actions and milestones to implement CCS in the refining sector
2 CHARACTERISTICS OF THE REFINING SECTOR
There is no such thing as a typical refinery; the configurations and processes in each being dependent
on a number of factors including: the crude feed composition, the product demand, local regulations
and economics. The 661 oil processing complexes considered refineries by the 2009 Worldwide
Refining Survey (Koottungal, 2009) have a combined capacity of 87,223,000 bbl/d (barrels of oil per
calendar day) and range in size from 1,500 bbl/d (Ulyanovskneft, Russia) to 940,000 bbl/d (Paraguana
Refining Centre, Venezuela). The world average is 132,000 bbl/d, with slightly higher averages in the
OECD nations at 140,000 bbl/d, and OPEC nations at 167,000 bbl/d. There has been a trend in the
past two decades to reduce the number of refineries, but increase the capacity; between 1993 and
2007, the average size of refineries increased by 30% (Purvin and Gertz, 2008).
DNV Reg. No.: 12P5TPP-9
Revision No.: 3
Date : 2010-08-27 Page 1DET NORSKE VERITAS
Research Report for UNIDO
Global Technology Roadmap for CCS in Industry
Sectoral Assessment: Refineries
MANAGING RISK
Table 1: Imports and exports of mineral crude oil and refined products around the world in
2009. Source: BP Statistical Review of World Energy 2010.
Million barrels daily
Country Crude Product Crude Product
Imports Imports Exports Exports
US 8.89 2.55 0.04 1.87
Canada 0.79 0.32 1.94 0.54
Mexico 0.01 0.44 1.28 0.17
S. & Cent. America 0.50 0.86 2.59 1.14
Europe 10.31 3.18 0.46 1.52
Former Soviet Union 0.02 0.07 6.87 2.20
Middle East 0.14 0.22 16.51 1.92
North Africa 0.37 0.21 2.23 0.53
West Africa 0.00 0.25 4.26 0.11
East & Southern Africa 0.44 0.12 0.30 0.01
Australasia 0.46 0.36 0.26 0.04
China 4.09 1.04 0.09 0.61
India 2.93 0.22 0.00 0.74
Japan 3.54 0.74 - 0.35
Singapore 0.93 1.67 0.05 1.51
Other Asia Pacific 4.59 2.67 0.81 1.25
Unidentified * - 0.02 0.31 0.43
Total World 38.00 14.92 38.00 14.92
The capacity of the world’s refining sector is generally closely related to the world oil demand, as
shown in Figure 1, with oil primarily being converted to transportation fuels. An upward trend in
demand in the past two decades can be seen, following on from the oil shocks of the 1970s. Despite
the correlation between refinery throughput and oil consumption on a global level, this is not
necessarily reflected at a regional level, as shown by imports and exports of crude oil and refined
products in Table 1. There is a trend for the major oil producing regions, such as Russia and Middle
East to export refined products, although these are in smaller quantities than exports of crude oil.
Changing consumption patterns, such as the reduction in gasoline usage and increase in kerosene (jet
fuel) and diesel usage in Europe has led to increased kerosene and diesel importation, mainly from
Russia and export of gasoline to the US and the Middle East. Additional capacity is expected to come
online in the US in the period to 2020, however, most refinery additions required to meet demand are
likely to take place in the Middle East and Far East (Purvin and Gertz Inc., 2008). OPEC (2009)
reiterates this and predicts that to 2020, 47% of capacity additions will come in the Non-OECD Asia
Pacific region and 22% in the Middle East, while in the period up to 2030, 57% are predicted in the
non-OECD Asia-Pacific region and 18% in the Middle East. Figure 2 shows the annual investment in
different regions of the world, indicating where growth in refining capacity has taken place in the past
decade.
DNV Reg. No.: 12P5TPP-9
Revision No.: 3
Date : 2010-08-27 Page 2DET NORSKE VERITAS
Research Report for UNIDO
Global Technology Roadmap for CCS in Industry
Sectoral Assessment: Refineries
MANAGING RISK
100.0
90.0
80.0
70.0
60.0
MMbbl/d
World Refining Capacity
50.0 World Oil Consumption
World Refining Throughput
40.0
30.0
20.0
10.0
0.0
80
81
82
83
84
85
86
87
88
89
90
91
92
93
94
95
96
97
98
99
00
01
02
03
04
05
06
07
08
09
19
19
19
19
19
19
19
19
19
19
19
19
19
19
19
19
19
19
19
19
20
20
20
20
20
20
20
20
20
20
Year
Figure 1: Refining capacity and throughput in relation to world oil consumption since 1980.
Source: BP Statistical Review of World Energy 2010.
Figure 2: Refining industry annual investment by region from 1995 to 2007 in Billion US$.
Source: Purvin and Gertz, 2008
The world’s refining capacity is made up of a mixture of International oil companies, National oil
companies, and smaller local companies. Concentration in the refining industry is fairly low – e.g. the
top 25 refinery owners, operate little more than 50% of the capacity (Reuters, 2008). In saying that,
the top ten refining companies include five super major oil companies: ExxonMobil, Royal Dutch
Shell, BP, ConocoPhillips and Total and these ten make up 36% of the world’s capacity. The national
oil companies of Venezuela, China and Saudi Arabia, also feature on the list of the top ten, but in
contrast to the super majors, these companies operate almost exclusively in their own country. Note
that Table 2 is possibly misleading, as a number of joint venture companies operate separately from
their parent organisation. An example of this is Motiva Enterprises LLC, which is a 50/50 joint
DNV Reg. No.: 12P5TPP-9
Revision No.: 3
Date : 2010-08-27 Page 3DET NORSKE VERITAS
Research Report for UNIDO
Global Technology Roadmap for CCS in Industry
Sectoral Assessment: Refineries
MANAGING RISK
venture between Saudi Aramco and Shell, and which has refining capacity of 762,000 bbl/d, making
it the world’s 25th largest refining company.
Table 2: Top 10 refining companies by capacity in bbl/d. Source: Reuters (2008)
Rank Company Capacity Percentage of
[bbl/d] World Capacity
1 ExxonMobil 5,357,850 6.1
2 Sinopec 4,210,917 4.8
3 Royal Dutch Shell 3,985,129 4.6
4 BP 3,231,887 3.7
5 ConocoPhillips 2,799,200 3.2
6 Petroleos de Venezuela 2,642,600 3.0
(PDVSA)
7 PetroChina 2,607,407 3.0
8 Valero Energy Corp 2,422,590 2.8
9 Saudi Aramco 2,005,000 2.3
10 Total 1,934,733 2.2
2.1 Outlook for Refining Sector
The refining sector has uncertain times ahead with the current financial crisis, non-conventional liquid
fuels, and climate policy potentially impacting the sector. In the early part of the decade, 2002-2006,
the refinery market was particularly tight due to historic lack of investment and low margins and a
sudden surge in demand. This led to a surge in investment and capacity, which is leading to an over
supply of refining capacity in light of the recent financial crisis. In the 2008 World Energy Outlook,
OPEC predicted that in 2015 the worldwide refinery utilization would be 84.4%, while following the
financial crisis in 2009, OPEC predicted 2015 utilization rates of 76.6% (OPEC, 2009). This
predicted decline in utilization comes on the back of especially large demand drops in the OECD, that
probably will imply widespread consolidation and closures to restore operating rates and refinery
viability (OPEC, 2009).
The refining industry globally is set to be dramatically affected in coming decades by new supplies of
non-conventional liquid fuels and also by the demands of climate change abatement policy. Excluding
biomass, non-conventional oil supplies including oil sands, natural gas liquids (NGLs), synthetic oil
from shale oil, natural gas (GTLs) and coal (CTLs) are likely to impact the refining industry going
forward. Non-conventionals such as NGLs, GTLs, CTLs and biofuels require less mainstream
refining and will potentially have a negative impact on the industry, while synthetic oil from shale oil
and oil sands still require extensive processing. The OPEC (2009) projections for the supply of crude
and other non-conventionals are summarised in Table 3. Supply of NGLs and condensates in 2008
was 9.8Mbbl/d and is expected to be 11.5 Mbbl/d by 2013. Oil sands production totalled 1.2 Mbbl/d
in 2008 and is expected to reach 1.6 Mbbl/d in 2013, mainly from Canada (OPEC, 2009). Current
supplies of shale oil total 10,000 bbl/d with little expectation of short term growth. GTLs production
is about 50,000 bbl/d, however, this is set to expand substantially with an additional 140,000 bbl/d
coming on line in Qatar in 2011 (Shell, 2010). Supply of CTLs was 160,000 bbl/d in 2008 and is
expected to increase to 300,000 bbl/d in 2013, with these increases mainly in China, South Africa and
US (OPEC, 2009). Non-conventional supplies excluding NGLs and biofuels are expected to grow
DNV Reg. No.: 12P5TPP-9
Revision No.: 3
Date : 2010-08-27 Page 4DET NORSKE VERITAS
Research Report for UNIDO
Global Technology Roadmap for CCS in Industry
Sectoral Assessment: Refineries
MANAGING RISK
from 1.8 Mbbl/d in 2008 to 6.0 Mbbl/d in 2030. Although this growth is much faster than
conventional oil markets, it still is only the equivalent of twenty 300,000 bbl/d refineries. In the short
term the impact of NGLs and condensates on the refining industry is expected to be the greatest of all
the non-conventionals and may lead to a decline in the prices of gasoline and naphtha. This will lead
to a decrease in the need for secondary processing such as FCC. In the longer term there is expected
to be substantial growth in other non-conventionals, which leads to a slight growth in absolute terms
for crude, but a large decline in demand for refined products as a share of total supply.
Table 3: World oil supplies from crude, NGLs and other non-conventionals to 2030. Source:
OPEC, 2009
2008 2013 2020 2030
Total Crude [Mbbl/d] 72.9 72.3 75.0 79.5
Total NGLs [Mbbl/d] 9.8 11.5 13.5 15.2
Total Non-Conventials 3.1 4.2 6.8 10.7
Total World Supply [Mbbl/d] 85.8 88.2 95.7 105.9
% Crude of Total 85.0 82.0 78.4 75.1
% NGLs of Total 11.4 13.0 14.1 14.4
% Non-conventionals of Total 3.6 4.8 7.1 10.1
The climate change debate is affecting the refineries industry: part of the predicted climate abatement
policies will be to introduce biofuels to replace crude-based fuels, and part will be to reduce demand.
The future impact of biofuels is expected to be led by bio-diesel use in Europe on the back of the
2009 EU Renewable Energy Directive. The Directive obliges EU members to have 10% transport fuel
from renewable sources by 2020, however, it must be noted that the requirement of a previous
directive to have 2% by 2005, was not met. Biofuel use in the US and Latin America is also expected
to grow substantially in the coming decades, which will also impact refining in those regions. By
2020, Purvin and Gertz, (2008) expect the world demand to be 100,000t/y. OPEC (2010) state that in
2008 there was 1.3 Mbbl/d of biofuel production and this is expected to grow by 0.7 Mbbl/d between
2008 and 2013, mainly in US, Brazil and China. In the long term to 2030, OPEC predict demand will
reach 4.7 Mbbl/d. Note however, that there is an ongoing debate regarding biofuels’ climate
credentials: E.g. in Lange (2010) there is evidence that suggests changing land use for certain bio-
fuel’s production does not actually reduce global emissions, whilst for other it has a reduced
abatement impact. The exception to this is using existing crop land for biofuel, which has implications
for the food chain. This adds to the pressure on unproven second generation biofuels technology.
In it’s Energy Technology Perspectives report (IEA, 2010), the IEA has forecast transport energy use
in scenario’s where no climate abatement policy exists (baseline) and for scenario’s with different
carbon abatement policy trends (BLUE). In the scenario that growth in fuel usage continues without
any policy interventions in the baseline scenario (Figure 3), the IEA (2010) expects conventional
liquid fuels for transport could increase. In a worst case which includes strong growth in the light
passenger vehicles of the high baseline scenario this could be by as much as 40 Mbbl/d in the period
to 2050. The concept of peak oil is not universally agreed upon by all stakeholders but may mean that
such a rise in production is not possible, as suggested by UK Industry Taskforce on Peak Oil &
Energy Security (Roberts, 2010). Policy that could lead to CCS applications in the refining sector has
the potential to also reduce the demand for transport fuels, and to reduce the output and emissions
DNV Reg. No.: 12P5TPP-9
Revision No.: 3
Date : 2010-08-27 Page 5DET NORSKE VERITAS
Research Report for UNIDO
Global Technology Roadmap for CCS in Industry
Sectoral Assessment: Refineries
MANAGING RISK
from the refining sector. In this case changes of mode of transport, reduction in miles traveled,
electrification of the small vehicle fleet and use of hydrogen and biofuels could erode demand for
traditional refinery products. Abatement described in the IEA’s so-called BLUE map scenario aims to
maintain long term global temperature rises within 2°C to 3°C range, by reducing 2005 CO2
emissions by half in 2050 with changes in transport technology. In the BLUE map world, crude oil
demand is expected to fall by 27% compared with 2007, although the exact implication for the
refining sector is not defined. Demand for Gasoline, Diesel, Jet fuel and Heavy fuel oil, all fall
considerably under this scenario, which will heavily influence the refining industry throughput (see
Figure 3). It is possible that the actual demand in 2050 will lie somewhere between the two scenarios
described. The weight of evidence from all the sources reviewed suggests demand for conventional
refined products is likely to ease, nevertheless business as usual predictions such as that described by
the IEA (2010) indicate a large amount of uncertainty for the refining sector and its investors. With
reference to Figure 3, the BLUE shifts scenario assumes a change in transport modes to more efficient
modes, with slight reduction in growth and the BLUE map / shifts scenario combines the technology
changes of the BLUE map with the changes in travel patterns of the BLUE shifts scenario. These
scenarios further emphasize the potential carbon abatement policy has to reduce demand for refinery
products.
Figure 3: Evolution of transport energy use by fuel type, worldwide. Source: IEA, 2010
2.2 Refining Industry interest in CCS
Projections of deployment, statements by various companies and demonstration projects currently
underway indicate a desire in the refining sector to understand the potential for and implications of
deploying CCS as a substantial CO2 abatement option. In order to prove CCS technology and to
monitor the G8 goal of achieving commercial deployment of 20 CCS projects by 2020, the Global
CCS Institute has developed an ideal portfolio of projects: it believes there should be 26 projects in
order to prove various configurations of technology in various industrial sectors, transport
configurations and storage options (LEK, 2009). The major contributors to CO2 emissions are power
generation, iron and steel and cement. Outside these three, refineries are identified as a target, because
high purity CO2 is produced as a byproduct of certain hydrogen production configurations. The
DNV Reg. No.: 12P5TPP-9
Revision No.: 3
Date : 2010-08-27 Page 6DET NORSKE VERITAS
Research Report for UNIDO
Global Technology Roadmap for CCS in Industry
Sectoral Assessment: Refineries
MANAGING RISK
Global CCS Institute portfolio recommends that at least 3 of the 26 projects be in processes which
already produce high purity CO2, such as applicable refinery hydrogen production processes (LEK,
2009). This interest in demonstrating CCS on certain hydrogen production facilities is a reflection of
the relatively low amount of processing required before storage and hence low costs, which it should
be noted is not a generalisation on the totality of a refinery, as discussed in more detail in section 5.2.
In terms of geographic location of the projects, the LEK report recommends 60% are located in the
Europe, North America and China regions, 15% in Japan and Australia, and final 25% should include
India, Russia, Rest of Asia, Latin America, the Middle East and Middle and East Africa. There is no
preference for the type of project in each region.
The IEA Technology roadmap for CCS (2009b) predicts that in order to meet climate change goals,
100 CCS plants need to be deployed by 2020 and 3,400 by 2050. In this roadmap the IEA does not
specifically point to CCS in the refining industry as a target for deployment of CCS out to 2050, but
does include hydrogen production as one of the target sectors. The IEA predictions are based on the
BLUE map scenario, which predicts a decline in the demand for liquid fuels. For this reason it is hard
to determine exactly how many CCS plants are expected to be deployed in the refining sector and if
this should even be a focus for development.
Oil companies and by implication refineries, are increasingly emphasising their “green credentials”,
as can be witnessed by their increasing interest in alternative energy and in cleaner production
methods. BP (through its “Alternative Energy” unit), Shell, Chevron and Statoil have all entered the
market for renewable energy (including wind and biofuels) during the past decade (although BP and
Shell have since re-balanced their positions). The current environmental crisis in the Gulf of Mexico
is likely to influence developments as well, although it is too early to say how or when. This increased
interest in sustainability (whether perceived or real) may result in an appetite for technologies such as
CCS, including the application of CCS to refineries. Furthermore, CCS at refineries can potentially be
a (although limited) Low Carbon Fuel Standard compliance option, depending on regulatory
acceptance.
OPEC recently stated that it “advocates further development of CCS technologies and where possible,
in conjunction with CO2-enhanced oil recovery” (OPEC, 2010).
Note that there are differences between the motivations of national oil companies and international oil
companies to implement greenhouse gas technologies, including CCS. Because of the level of
development in most of the countries of national oil companies/refineries, the priorities for these
regions (and their industry) are to reduce poverty and increase standards of living. It will be more
difficult to justify implementing CCS which will increase demand for already over stretched
electricity or water supplies to the detriment of the general population.
In the developed world, there are some projects looking at implementing CCS in refineries. One such
project is the Rotterdam Climate Initiative (RCI) which is investigating the potential for developing a
CCS network for the Rotterdam industrial complex, reducing emissions in 2025 by 50% compared to
1990. The RCI plans to use CO2 in the horticulture industry, expanding the existing CO2 pipelines
from the Shell refinery, and to use, in a start up phase, ships to transport the CO2 for storage. In this
project, pure sources of CO2, such as those from refinery hydrogen manufacture, are to be addressed
in the first phase (Rotterdam Climate Initiative, 2009).
Another European project that indicates interest in development of CCS technologies from the
refining industry is the European CO2 Technology Centre Mongstad (TCM), next to the Mongstad
refinery in Norway. The project is currently building two small-scale capture demonstration plants.
Also there are plans to develop a full-scale capture plant on the natural gas fired combined heat and
DNV Reg. No.: 12P5TPP-9
Revision No.: 3
Date : 2010-08-27 Page 7DET NORSKE VERITAS
Research Report for UNIDO
Global Technology Roadmap for CCS in Industry
Sectoral Assessment: Refineries
MANAGING RISK
power (CHP) plant. The demonstration project will capture CO2 from both a power station and
refining flue gases with different compositions. The project is part owned by A/S Norske Shell,
Statoil ASA and South African coal to liquids refining company SASOL, who purchased a 2.44%
share in 2010 (TCM, 2010).
In North America, the US Department of Energy used the 2009 economic recovery package to fund a
number of CCS projects, including three refinery-based projects; the IGCC plant at the
ConocoPhillips refinery in Houston, the hydrogen production gasifier at the BP refinery in Denbury,
Connecticut, and the steam methane reformer project in Port Arthur, Texas. Subsequently, the Air
Products & Chemicals and Denbury Onshore-led Port Arthur project was selected in June 2010 for
further funding of the order of $US 253 million, to proceed with the project. It is important to note
that all these projects are government-funded in one way or another. In Canada, the Alberta
Government has recently agreed to fund the North West Upgrading Bitumen Refinery, near
Edmonton, as part of its Bitumen Royalty in Kind initiative. The refinery is to be built with CCS
capability. These already announced projects indicate that there is some appetite mainly from the
public sector, and to a lesser extent the private sector to develop CCS for the refining industry. In the
perspective of the requirements to combat climate change, many more projects will be required.
Technical aspects of these projects are described in more detail in Section 4 Technical Overview of
Capture Options.
3 CURRENT AND PROJECTED EMISSIONS
3.1 Historic Emissions and Uncertainty
Historic data of greenhouse gas emissions has been estimated by a number of sources, but this study
has found no comprehensive record for the world’s refining industry. The most freely available source
of data of existing CO2 for the worldwide refining industry is the IEA Greenhouse Gas Program
(IEAGHG) CO2 Emissions Database. The information in this database is based on numerous editions
of the Oil and Gas Journal’s worldwide refining survey, the most recent being the 2008 edition of the
survey. Most of the emissions in the database are estimated, other than those in Europe, which are
measured for the EU Emissions Trading Scheme (ETS). IEA-GHG (2008) reports that refineries
produce 818 Mt CO2/year. The IPCC (2005) report that refineries make up 5.97% of global emissions,
based on an earlier version of IEA-GHG’s CO2 emissions database.
Estimates of the emissions are based on the daily production capacity operating for 8,300 hrs/year
with an emissions factor of 0.219 kg CO2/kg of product (IEAGHG, 2008). The assumptions made in
these estimates lead to uncertainty in the final estimates, and a number of different sources would
suggest that the uncertainty is great. Gary and Handwerk (2001) state that typically for a 300,000
bbl/d refinery, CO2 emissions range from 0.8 million tCO2/y to 4.2 million tCO2/y, which correlates to
an average of 2.28 million tCO2/y with uncertainty of ±1.55 million tCO2/y or ±70%. Typically a
refinery will use between 4% and 15% of the crude oil input for process energy production (Szklo &
Schaeffer, 2010) depending on the configuration. The European BREF document (EIPPCB, 2003) for
mineral oil and gas refining suggests uncertainty in the specific emissions from refineries is even
greater, stating that refining-specific emissions vary from 0.02 kgCO2/kg of product to 0.81 kgCO2/kg
of product. Others support the figure of 0.219: Mertens (2009) published the EU average as 0.22 t
CO2/t crude. Additionally, Table 4 shows that the specific emissions are dependent on the refinery
configuration.
DNV Reg. No.: 12P5TPP-9
Revision No.: 3
Date : 2010-08-27 Page 8DET NORSKE VERITAS
Research Report for UNIDO
Global Technology Roadmap for CCS in Industry
Sectoral Assessment: Refineries
MANAGING RISK
Table 4: Refinery configuration CO2 Emissions. Source: Mertens (2009)
Refinery Configuration t CO2/t crude
Hydroskimming 0.08 - 0.15
Fluidised Catalytic Cracker + Vis Breaker ~0.2
Hydrocracker Unit + coker 0.2 - 0.35
Residual Desulphurisation + Residual 0.3 - 0.4
Fluidised Catalytic Cracker
The IEA-GHG CO2 emissions database uses a figure of 8,300 hours of full load operation for
calculating the emissions, suggesting 95% of the time refineries operate at full load. Using figures for
refining capacity and refining throughput (BP, 2010), would suggest that using full load operational
time of 8,300 hrs/y is optimistic, given that it does not address part load operation. BP figures show
that the world’s refinery throughput between 2000 and 2009 was about 84% of capacity. Given that
the IEA-GHG (2009) uses full load hours to calculate the emissions, a figure of 7,400 hours (11%)
would appear to be more realistic to show emissions of actual refinery throughput. This uncertainty
could rise again if utilization rates drop to 76.6% in 2015 as predicted by OPEC (2009). It is beyond
the scope of this assessment to calculate what the uncertainty in the existing refining emissions data
might be, however, it is a recommendation for further work to form a more accurate inventory.
3.2 Projected Emissions
Projecting CO2 emissions from refining industry out to 2050 is a difficult task, given that the existing
inventory is so uncertain and the uncertain adaptation responses affecting refinery configuration.
Concawe (2008) predict that for the European basis, refinery CO2 emissions share of total CO2
emissions will increase from 6.1% in 2000 to 8.3% in 2020 and stepwise increase to 10.3% with
predicted fuel quality specification changes. ICF (2005) reports that to keep pace with the rise in oil
demand, refining capacity needs to have a 9% surplus over oil demand. Based on this assumption and
the projections of both the IEA and OPEC, refining capacities for both scenarios are shown in Table
5. Based on both of these assumptions it is fair to assume that the emissions from the refining industry
will increase. McKinsey (2005) reports that downstream refining emissions accounted for 1.1 Gt/y of
CO2 in 2005 and project that this will grow to 1.5 Gt/y by 2030. LEK (2009) have predicted that by
2020, the refining sector will contribute 1.3 Gt/y CO2 emissions. Looking further out is much more
uncertain, due to the differences in predictions for the demand of liquid fuels, and the use of non-
conventional fuels.
In its business-as-usual scenario, the IEA (2010) predicts that industrial emissions in 2050 will rise to
between 19.9 Gt CO2 and 21.9 Gt CO2 and conventional liquid fuels for transport could increase by as
much as 40 Mbbl/d. Abatement described in the so-called BLUE map scenario aims to maintain long
term global temperature rises within 2°C to 3°C range. In the BLUE map world crude oil demand is
expected to fall by 27% compared with 2007, although the exact implication for the refining sector is
not defined. Demand for Gasoline, Diesel, Jet fuel and Heavy fuel oil, all fall considerably under this
scenario, which will heavily influence the refining industry throughput (see Figure 4). Under the
BLUE map scenario, world industrial emissions are predicted to be between 11.0 Gt CO2 and 12.5 Gt
CO2.
DNV Reg. No.: 12P5TPP-9
Revision No.: 3
Date : 2010-08-27 Page 9DET NORSKE VERITAS
Research Report for UNIDO
Global Technology Roadmap for CCS in Industry
Sectoral Assessment: Refineries
MANAGING RISK
Table 5: World oil consumption and refining capacity related for the OPEC and IEA
projections in Mbbl/d. Oil consumption projections are from IEA (2008c) and OPEC (2009).
Year 1990 2006 2008 2010 2015 2020 2025 2030
OPEC 2009 World 85600 84600 90200 95400 100400 105600
Oil Consumption
World Refining 98318 103986 109436 115104
Capacity (OPEC)
IEA 2008 Oil
68222 86624 98193 102945 107155 110865
Consumption
World Refining 107030 112210 116799 120843
Capacity (IEA)
Under the BLUE map scenario for transport fuels, outlined “well to wheel” analysis in Figure 3, the
world refining industry would be expected to decline and hence the potential for CCS in the refining
sector is in retrofit. Figure 4 indicates that there will be some regional emissions growth to 2050.
Transport related emissions including refining in China, India and rest of world including Middle
East, Africa and Latin America could grow for various scenarios, hence there is potential for
greenfield CCS deployment in these regions. Based on Figure 4, the potential for CCS deployment in
the more establish OECD markets to 2050 may be as retrofit of brownfield refinery sites.
Figure 4. Well-to-wheel transport CO2-equivalent emissions by region and by scenario. CCS is
only relevant to the refinery part of the emissions. Source: IEA, 2010
DNV Reg. No.: 12P5TPP-9
Revision No.: 3
Date : 2010-08-27 Page 10DET NORSKE VERITAS
Research Report for UNIDO
Global Technology Roadmap for CCS in Industry
Sectoral Assessment: Refineries
MANAGING RISK
4 TECHNICAL OVERVIEW OF CAPTURE TECHNOLOGY
The focus of this chapter is on the capture of CO2, as the transport and storage of CO2 are more
generic and relate to all applications of CCS. There are three different pathways for capturing CO2;
post-combustion capture, pre-combustion capture and oxy-fuel combustion capture and in this section
we explore the potential of each for the refining industry. Post-combustion capture is the removal of
CO2 from flue gases of a combustion process, most likely using a chemical absorption process,
following the combustion of the carbonaceous fuel. Pre-combustion capture involves the partial
oxidation of a carbonaceous fuel, followed by steam reforming to produce high concentration
hydrogen and CO2, which are subsequently separated. Hydrogen can then be used as a clean burning
fuel. Oxy-fuel combustion involves combustion of carbonaceous fuel in high purity oxygen, forming
a flue gas of only steam and CO2, which are separated by condensing the water. A summary of the
CO2 separation technology used to actually separate the CO2 is shown in Table 6.
Refineries consist of a number of complex and varied unit processes and hence have numerous point
source emissions distributed over a large site. For the sake of this study and to simplify the refinery
scenario, the emissions streams will be classified in the following four categories: process heaters,
utilities, fluid catalytic cracker (FCC) and hydrogen manufacture. Table 6 offers more detailed
description of each category outlined, the proportion of the typical refinery emissions it makes up and
the concentration of the CO2 emitted. There will also be a distinction between the likely capture
options for new refineries vs. retrofitting existing refineries. In the interim between the initial
demonstration of capture technology and any eventual mandatory requirement to CCS there may be a
need for plants to be built “capture ready”, which is something that will need to be explored in more
detail.
Table 6: An overview of major CO2 emission sources at a typical refinery complex. Source: van
Straelen et al., 2009.
CO2 emitter Description % of total Concentration of
refinery CO2 stream
emissions
Process Heaters Heat required for the separation of liquid feed and to 30-60 % 8-10%
provide heat of reaction to refinery processes such
as reforming and cracking
Utilities CO2 from the production of electricity and steam at 20-50% 4% (CHP Gas
a refinery. turbine)
Fluid catalytic cracker Process used to upgrade a low hydrogen feed to 20-50% 10-20%
more valuable products
Hydrogen For numerous processes, refineries require 5-20% 20- 99%
manufacturing hydrogen. Most refineries produce this hydrogen on
site. The requirements for Hydrogen increase with
demands of stricter fuel quality regulation.
DNV Reg. No.: 12P5TPP-9
Revision No.: 3
Date : 2010-08-27 Page 11DET NORSKE VERITAS
Research Report for UNIDO
Global Technology Roadmap for CCS in Industry
Sectoral Assessment: Refineries
MANAGING RISK
4.1 Process Heaters
Combustion in process heaters account for up to 60% of a refinery’s CO2 emissions. Currently the
two most developed technologies likely to be used for emissions reduction from process heaters (and
utility boilers) in the refinery scenario are post-combustion capture and oxy-fuel combustion.
Technologies that potentially could feature in the future include chemical looping combustion for
green field using refinery gas (Morin and Béal, 2005) and pre-combustion capture, using hydrogen
fuel in boilers and heaters (IEAGHG, 2000). Further studies are required to assess the potential of
pre-combustion for refinery process heaters, since this will include hydrogen production units
(Mirracca, 2009).
Post-combustion capture has been investigated for a number of scenarios, namely Hurst and Walker,
(2005) and van Straelen et. al. (2010). The engineering details for capture will vary, but the basis for
the Hurst and Walker (2005) study was the 196,000 bbl/d, Grangemouth refinery in Scotland and
capture of the CO2 emissions from the fired heaters and boilers on the site. They proposed to collect
all the stacks gases from these heaters across the site and duct them to a central location where CO2 is
separated and compressed. To move these gases across the site would require the addition of fans to
move the stack gases to the central treatment process. This is not a unanimously accepted
configuration as van Straelen et. al. (2010) question the feasibility of such a configuration on a larger
400,000 bbl/d refinery, stating that finding the space for large diameter ducting will be a challenge,
and instead propose only capturing the CO2, from the largest stack emissions. This lack of agreement
indicates that solutions will be site specific and further detailed design is required to establish the best
for each. Independent of the ducting configuration is the requirement to remove the NOx and SOx
from the stack gases before the CO2 absorber to reduce degradation of the absorption solvent. With
the lay outs of refineries with numerous emission points of different sizes, the capture rate at
refineries will be limited and be determined by the “tail” of smaller hard to connect emissions points
rather then the capture efficiency of the capture technology/process.
Removal of NOx and SOx from flue gas streams is a relatively well known technology, which is
applied to combustion processes in a number of industries for environmental reasons. Metz et. al.
(2005) state that SOx needs to be reduced to between 1 & 50 ppm for post-combustion capture of CO2
in flue gases. For combustion of refinery or natural gas in heaters and boilers, SOx removal may not
be required, but where higher sulphur fuel oil and solid fuels are used this will be required.
Concentrations of NOx needs to be reduced to 20 ppm for CO2 capture (Hurst & Walker, 2005),
meaning that some form of NOx reduction will almost certainly be required on all heaters and boilers
irrespective of the fuel. To operate the SOx and NOx reduction technologies there are also
requirements for soot and fly ash in order to prevent plugging of the absorbers (Metz et. al., 2005).
The addition of CO2 capture will require considerable amounts of additional energy and utilities and
result in an increase in (to be captured|) emissions. Table 7 details the utility requirements and waste
production of equipment required to retrofit Grangemouth refinery with CCS on the process heaters
and boilers. The basis for this is using Fluor Econamine FG+ process for CO2 capture, Cansolv
process for SOx capture and selective catalytic reduction (SCR) for NOx treatment.
Oxy-fuel offers another potential mechanism for capturing the CO2 from heaters and boilers. The
Grangemouth refinery was used as the basis for investigating the deployment of Oxy-fuel for an
existing refinery (Wilkinson et. al., 2003 & Allam, 2005). For this scenario it is proposed that all
heaters and boiler on site are modified for firing with pure oxygen, produced at a central location, and
that flue gases from the combustion plants will be initially treated at locations local to the stacks
(where water will be removed and CO2 will be compressed to 30bar). As shown in Table 8 the
production of the oxygen will require considerable amounts of additional (electrical) energy and thus
DNV Reg. No.: 12P5TPP-9
Revision No.: 3
Date : 2010-08-27 Page 12DET NORSKE VERITAS
Research Report for UNIDO
Global Technology Roadmap for CCS in Industry
Sectoral Assessment: Refineries
MANAGING RISK
increase CO2 emissions. Final compression of CO2 to pipeline pressure will take place at one central
location. To fire the process heaters and boiler that produce 2 million tonnes/year of CO2 with
oxygen, two 3,700 tonne/day air separation units (ASU) will be required (Allam et. al., 2005). By
current standards, these are very large given the largest existing facility is 3,500 tonne/day (Metz et.
al., 2005). All of the heaters and boilers will require significant modification or replacement. The use
of induced draft fans on the flue gases means in order to reduce the amount of air leakage into the
boiler better sealing is required, but complete sealing is not feasible due to maintenance requirements
(Wilkinson et. al., 2003). To control the combustion temperature, each heater and boiler will also
require modification for flue gas recycle, including the addition of a flue gas recycle fan. The ability
to completely shut off of boiler flue gases is required in addition to use of air for firing during start up.
The result of these modifications will reduce the firing rates by up to 15%. Typical for any refinery,
one of the challenges will be the large distances for piping oxygen and carbon dioxide across the site
between oxygen facilities and CO2 compression stations, illustrated in Figure 5 which gives an
isometric of a proposed layout of the Grangemouth refinery.
Table 7: Shows the increases in utility requirements and wastes produced when retrofitting post
combustion capture and compression to the heaters and boilers of the 196,000 bbl/d
Grangemouth refinery. Process changes will reduce CO2 emissions by 2 million tonnes/year
from refinery boilers and heater. Source: Hurst & Walker, (2005).
Utilities Quantity
Steam 480 tonnes/h
Power 72 MW
Cooling Water 18,139 m3/h
Process Water 1025 tonnes/h
Source and Wastes
CHP Stack from additional power & steam (CO2 0.6 million tonnes/y
produced at 18% eff from natural gas)
Cooling towers (water vapour) 8 million tonnes/y
Amine Reclaimer wastes (heat stable salts 150 tonnes/week
SOx unit (SO2 waste) 100 tonnes/week
The existence of new or increased quantities of hazardous materials; pure oxygen and high-pressured
carbon dioxide, will increase the level of risk in a refinery, but the existing health safety and
environmental hazards on a refining site are such, that these will not require a step change to be
managed (Wilkinson et. al., 2003). For oxy-fuel combustion, there may be a technical requirement to
remove the NOx and SOx from the CO2 for transport and storage specifications. Allam et. al. (2005),
considered three different cases for oxy-fuel capture at the Grangemouth site. Table 8 shows the
utility requirements and waste outputs for the case with the greatest capacity to avoid CO2 from the
addition of oxy-fuel CCS technology to the process heaters and boilers. The basis for this is addition
of a gas turbine operating pre-combustion CO2 capture to generate power for the ASU compressors
and additional fans, two 3,700 tonne/d adiabatic ASU’s, configured as described above.
DNV Reg. No.: 12P5TPP-9
Revision No.: 3
Date : 2010-08-27 Page 13DET NORSKE VERITAS
Research Report for UNIDO
Global Technology Roadmap for CCS in Industry
Sectoral Assessment: Refineries
MANAGING RISK
Based on promising economics, several vendors are developing and commercialising oxy-burners
(Miracca, 2009). There are a number of shortcomings that remain, including the heat flux which could
induce fouling in some heaters, but it is generally expected that these can be overcome. Further cost
reductions can be expected if internal rather than external dilution technology is developed. There is
also specific attention to lower the cost of oxygen production. The focus on post combustion
technology in the power industry now means that a single amine train is capable of capturing more
CO2 than produced with oxy-combustion from a single ASU, which may be a factor in decision
making for retrofit where space is an issue.
Table 8: Utility requirements and wastes produced for the addition of Oxy-fuel CCS technology
to the process heaters and boilers with hydrogen fired GT power generation at the 196,000
bbl/d Grangemouth refinery.
Utility Quantity
Power generated 108 MW
Power Export 0.3 MW
O2 requirement 6889 tonne/d
Cooling water use 16,700 tonne/h
CO2 Captured 2.33 million tonne/y
CO2 Avoided 1.97 million tonne/y
DNV Reg. No.: 12P5TPP-9
Revision No.: 3
Date : 2010-08-27 Page 14DET NORSKE VERITAS
Research Report for UNIDO
Global Technology Roadmap for CCS in Industry
Sectoral Assessment: Refineries
MANAGING RISK
Figure 5: Isometric view of Grangemouth refinery site layout and proposed location of oxy-fuel
systems, air separation units and cooling towers. Source: Allam et. al. (2005).
4.2 Utilities
In a refinery, utilities steam and electricity are used by many of the unit processes to varying degrees.
There is a much greater demand for steam than there is for electricity for all refinery configurations.
Steam is produced in (waste heat) boilers where (GT) cogeneration of Power and Heat is an
established energy efficiency (and carbon abatement) measure for refineries, combined with power
transport for the optimal power to heat generation ratio. In the near to mid-term, the capture
technology most likely to be deployed for utilities is post combustion technology for retrofit that has
been developed in other sectors, such as power generation. Longer term, other technologies such as
poly-generation and oxy-fuel may offer more potential for new builds. Capture technology for the
power generation sector will probably lead the development before other sectors, so refinery utilities
are a good opportunity for deployment of their learnings and optimisation. Amine technology
developed from acid gas processing is the most advanced and well known technology, however other
technology such as the chilled ammonia process (CAP) offer potential as well. Although unproven at
commercial scale, process modelling indicates that the CAP process potentially has a smaller energy
penalty. Table 9 shows a comparison of the energy penalty for each process, based on a 460 MWel
pulverised coal super critical power plant. In order to reduce the need to capture CO2, the amount of
CO2 emissions should be minimised. Combined heat and power is a technology that has potential for
this.
Combined Heat and Power (CHP) or Cogeneration is another technology that offers potential
emission reductions due to the increase in overall efficiency. CHP also makes CCS technology more
DNV Reg. No.: 12P5TPP-9
Revision No.: 3
Date : 2010-08-27 Page 15You can also read