At Your Service Aotearoa - A well qualified workforce in your community - Embargo until 6pm 3 May 2017
←
→
Page content transcription
If your browser does not render page correctly, please read the page content below
At Your Service Aotearoa
A well qualified workforce in your community

       Embargo until 6pm 3 May 2017
Authors: Fiona Stokes, Konrad Hurren, & Julian Williams

All work is done, and services rendered at the request of, and for the purposes of the client only. Neither
BERL nor any of its employees accepts any responsibility on any grounds whatsoever, including negligence, to
any other person.

While every effort is made by BERL to ensure that the information, opinions and forecasts provided to the
client are accurate and reliable, BERL shall not be liable for any adverse consequences of the client’s
decisions made in reliance of any report provided by BERL, nor shall BERL be held to have given or implied
any warranty as to whether any report provided by BERL will assist in the performance of the client’s
functions.

©BERL                                         Reference No: #5775                                     April 2017
At Your Service Aotearoa
The service sector: a well-qualified workforce
Every day, from the cities to the remotest regions, service sector workers are expected to meet the needs of
hundreds of thousands of New Zealanders and scores of overseas visitors. Anyone who is dining out, shopping,
touring, holidaying, in medical or residential care, expecting a clean workplace, working out, theatre-going, or
undergoing personal grooming – and a myriad of other everyday activities - relies on these workers. Service
sector employees are an expanding and largely unseen army of workers whose labours are often repetitive,
demanding and modestly paid. Yet without them our health and safety, and sense of national wellbeing, would
be profoundly compromised.
Moreover, the service sector is a large and important part of our economy, fostering significant wealth and job
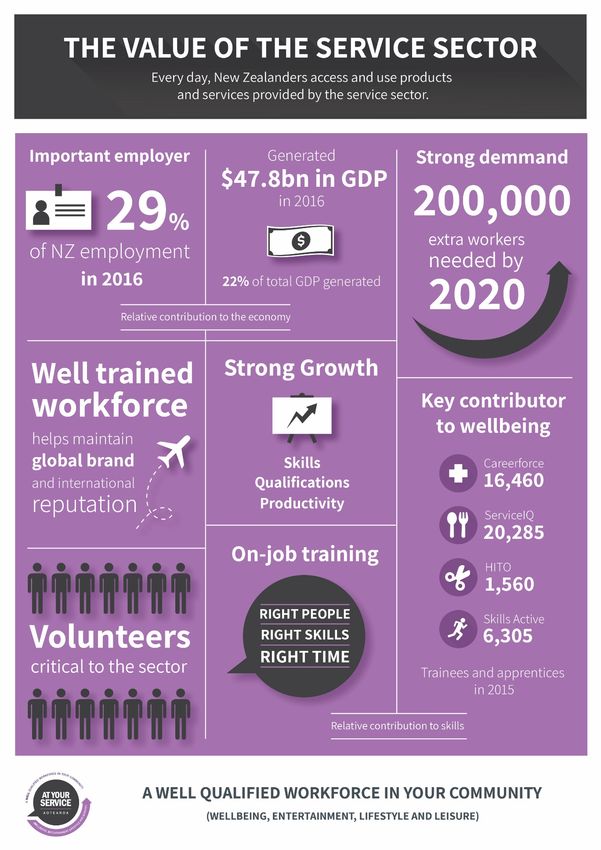
opportunities. The sector accounts for 29% of New Zealand employment. The sector’s national workforce of
590,440 full-time equivalents (FTEs) roughly equates with the combined population of Wellington and
Christchurch cities. In the year to March 2016 the service sector contributed $47.8 billion to GDP, approximately
22% of the country’s total production of goods and services. Further, labour cost measures indicate the quality
(productivity) of labour improved by over 11% over the seven years to 2016 – further evidence of the sector’s
robust contribution to the nation’s economic efforts.
Yet for all this, the service sector and its workforce is rarely seen as a critical cog in the nation’s economic effort.
Regrettably this perception is perpetuated by analysis (and media stories), which portray the sector as plain-
vanilla with unskilled workers, and so offering few career prospects.
Clearly this is far from the truth. The service sector is flourishing, with the tourism and aged care sectors leading
the charge. One-third of service sector roles are already classified as medium-high to highly skilled, and the
demand for trained workers is rising rapidly. Worryingly, the sector is estimated to need more than 200,000
extra workers by 2020 as people leave and new jobs are created. There is a need to upskill the existing workforce,
and for school leavers to see the service sector as an appealing career option.
As noted, the service sector is a key contributor to the wellbeing of New Zealanders. Our focus in this report is
predominantly on economic wellbeing. However, there are many intangible benefits that our communities gain
from the service sector. These benefits are difficult to measure as one cannot quantify the importance of feeling
well-cared for, enjoying a good meal, or feeling fit and well. This is why our report focuses on numbers to tell a
story, and we use case studies to illustrate why people work in the service sector and the importance of training
to the sector.
Growth in the service sector in New Zealand is largely driven by the ongoing purchase of goods and services we
use in daily life, our focus on our health and wellbeing, and our growing and ageing population. It is also driven
by a surge in the number of people who are visiting New Zealand, which has propelled tourism to the top of the
export-earner ladder.
Looking ahead, the demand for the products and services provided by the service sector is expected to grow. To
maintain the level of service we currently enjoy, and in some areas expand this, it is important to plan for this
growth. One way of doing this is through a well-qualified workforce.
The body that commissioned this report, At Your Service Aotearoa, is a collaboration between four service sector
industry training organisations: ServiceIQ, Careerforce, Skills Active and HITO. The purpose of this collaboration
is to optimise the link between the supply of people ready and available to work, and the demand for a well-
qualified workforce in the service sector. If more people are aware of the opportunities that are available, and
are able to make that connection, then our communities and their wellbeing will benefit.
The service sector: a well-qualified workforce i
At Your Service Aotearoa

Industry training organisations (ITOs) are set up by industry, and work with employers to coordinate training on
behalf of those industries. Industry training is systematic work-based training that leads to national
qualifications. Trainees and apprentices complete unit standards and ultimately receive qualifications at a variety
of levels.

However, skill levels are not just about the qualifications obtained by an individual. Skills also relate to
experience, and the range and complexity of the tasks an individual does at work. But the ITOs’ core roles of
developing qualifications, arranging training towards agreed skill standards and providing leadership within their
industries on matters relating to skills and training are critical to upskilling the New Zealand workforce for the
benefit of the wider economy.

In New Zealand today, some service industry employers are becoming increasingly concerned about skills
shortages. The skills gaps are frustrating efforts to fully satisfy users’ needs and to raise productivity.
Compounding the situation is the service sectors appeal to young, mobile and transient workers, which makes
enrolling in and completing industry training a “stretch target” for some.

Against that background the At Your Service Aotearoa ITOs are seeking concerted and nationally focused action
over service workers’ training needs, so that clear development pathways are available.

                                                             The service sector: a well-qualified workforce           ii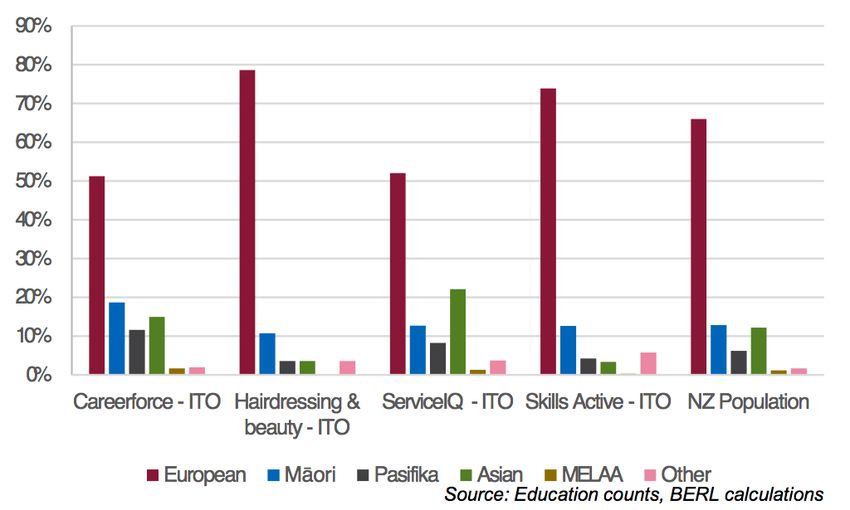
At Your Service Aotearoa

                           The service sector: a well-qualified workforce   iii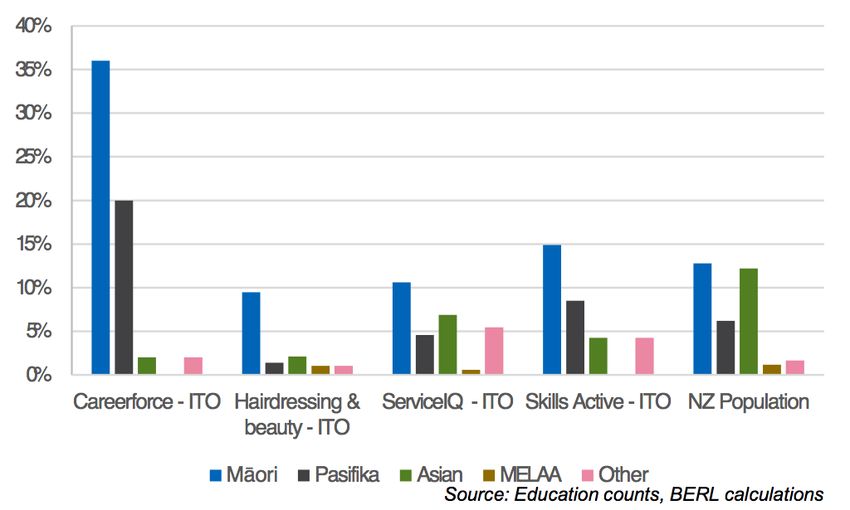
At Your Service Aotearoa

Contents
1     The contribution the service sector makes to the economy ................................. 1
      1.1    Employment in the service sector ........................................................................................................1
      1.2    Gross Domestic Product (GDP) generated by the service sector........................................................3
      1.3    Productivity and growth ........................................................................................................................5

2     The projected growth in the service sector ............................................................ 7
      2.1    Spotlight on key sectors ........................................................................................................................7
      2.2    Potential labour constraints and skill shortages ............................................................................... 15

3     At Your Service Aotearoa ....................................................................................... 17
      3.1    The training that the workforce engages in ...................................................................................... 17
      3.2    Why engage in industry training? ...................................................................................................... 20
      3.3    Demographic information on trainees and apprentices .................................................................. 25

4     The support the service sector needs ................................................................... 29
      4.1    How the service sector currently works with government .............................................................. 29
      4.2    The value of skills and qualifications.................................................................................................. 31
      4.3    What’s next? ....................................................................................................................................... 34

                                                                                                                                           Contents                    iv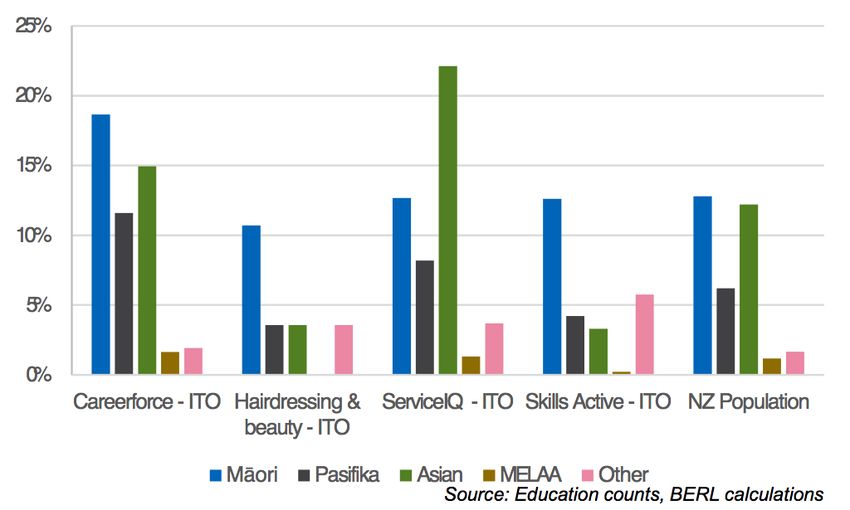
At Your Service Aotearoa
Tables
Table 1.1 Relative contribution of the service sector to the New Zealand economy, 2016 .....................................1
Table 1.2 Relative contribution of the service sector to the New Zealand economy, 2006-2016 ...........................4
Table 1.3 Contribution to the economy of all industries in New Zealand ..................................................................5
Table 2.1 International tourist total spend, year ended 2016 ....................................................................................7
Table 2.2 Domestic tourist total spend, year ended 2015 ..........................................................................................8
Table 3.1 Trainee counts by year, 2010-2015 .......................................................................................................... 17
Table 3.2 Apprentice counts by year, 2010-2015 ..................................................................................................... 19
Figures
Figure 1-1 Employment by sectors of the New Zealand economy, FTEs, 2016 .........................................................2
Figure 1-2 Areas of employment within the service sector, FTEs, 2016 ....................................................................3
Figure 1-3 GDP by sectors of the New Zealand economy, $millions, 2016 ...............................................................4
Figure 1-4 Adjusted versus unadjusted LCI, 2009-2016 ..............................................................................................5
Figure 1-5"Quality gap" as a percentage of the adjusted series, 2009-2016 ............................................................6
Figure 3-1 Distribution of trainees under each ITO by NZQF level, 2015 ............................................................... 18
Figure 3-2 Distribution of trainees under each ITO by previous qualification, 2015.............................................. 18
Figure 3-3 Distribution of apprentices under each ITO by previous qualification, 2015 ....................................... 19
Figure 3-4 Distribution of trainees under each ITO by sex, 2015 ............................................................................ 25
Figure 3-5 Distribution of apprentices under each ITO by sex, 2015 ...................................................................... 25
Figure 3-6 Distribution of trainees under each ITO, by age, 2015........................................................................... 26
Figure 3-7 Distribution of apprentices under each ITO, by age, 2015 .................................................................... 26
Figure 3-8 Distribution of trainees under each ITO, by ethnicity, 2015 .................................................................. 27
Figure 3-9 Distribution of trainees under each ITO, detailed ethnicity data, 2015 ................................................ 27
Figure 3-10 Distribution of apprentices under each ITO, by ethnicity, 2015 .......................................................... 28
Figure 3-11 Distribution of apprentices under each ITO, detailed ethnicity data, 2015 ........................................ 28
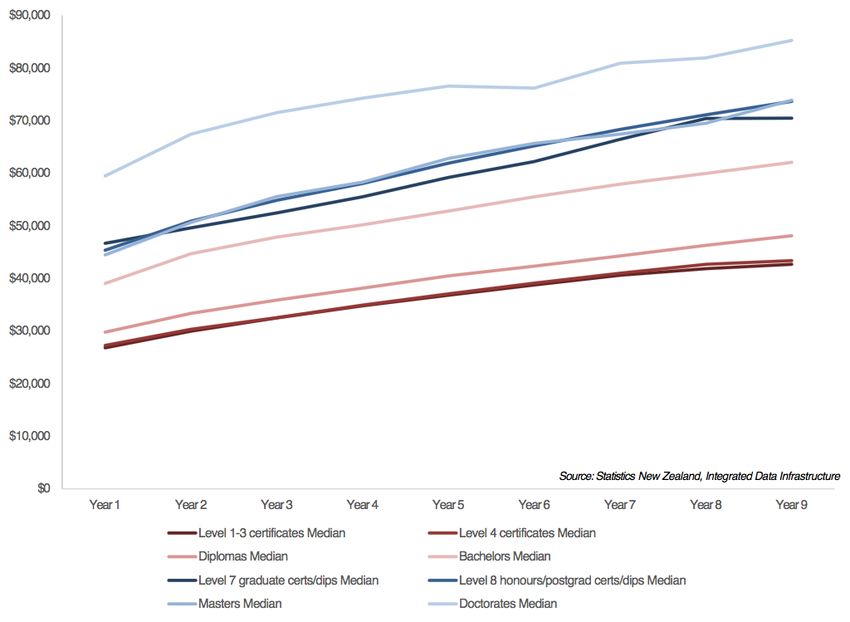
Figure 4-1 Earnings for different levels of education ............................................................................................... 32
Contents vAt Your Service Aotearoa
1 The contribution the service sector makes to the economy
The service sector is important to the New Zealand economy for two key reasons. Firstly, it contributes to
economic growth through the generation of jobs, income and export earnings. Secondly, it contributes to a
better standard of living through improving the health and wellbeing of New Zealanders.
The importance of the service sector to the New Zealand economy is also growing. This growth can be measured
through changes in employment, annual growth in GDP, or productivity improvements. It can also be measured
through an increase in qualifications, skills and customer experience. These later points are important as the
service sector is outcomes and wellbeing focused.
In this discussion we begin with the numbers – setting the scene with a big picture look at the size of the service
sector in terms of economic variables. We then turn to discuss training and the importance of industry training
to ensure the service sector has the appropriate pipeline of trained staff. Throughout these discussions case
studies are presented that focus on why people work in the service sector, the rewards they have gained from
undertaking this work, and why they would recommend industry training.
1.1 Employment in the service sector
In the year ending March 2016, approximately 590,440 Full-Time Equivalents (FTEs) were employed across
114,600 businesses in the service sector in New Zealand. 1 Approximately one in three New Zealanders work in
the service sector (29%), and one in five (21%) of all businesses in New Zealand are in the service sector.
Together, these businesses generated an estimated $47.8 billion in Gross Domestic Product (GDP). This implies
that productivity in the service sector was approximately $81,032 in 2016.
Table 1.1 Relative contribution of the service sector to the New Zealand economy, 2016
Total % of New
Service Sector
2016 Zealand
Employment (FTEs) 590,443 29.2%
GDP ($mn) 47,845 21.9%
Business units 114,603 20.8%
source: BERL regional database, Statistics NZ
Service sector businesses on average employ 5.2 Full-Time Equivalents (FTEs) per business, this indicates these
businesses are slightly larger than the average New Zealand business.
1 Full-Time Equivalent is a measure of employment. One Full-Time Equivalent is a person who works 30 hours or more per week.
1At Your Service Aotearoa
Figure 1-1 Employment by sectors of the New Zealand economy, FTEs, 2016
16%
29% Service sector
Primary sector
Manufacturing sector
19%
Business services sector
Social services sector
7%
Other sectors
18% 11%
The largest area of employment within the service sector is retail trade. The retail trade sector can be broken
down into the various types of store retailing. Statistics New Zealand gathers data and information on the retail
trade sector, including how many people are employed in each of the sectors and how much we spend in each
type of retail store. In the year to March 2016, approximately 95,000 FTEs were employed in the retail trade
sector, excluding food retailing. Food retailing includes stores such as supermarkets, butchers and liquor stores.
Food and beverage services 2 is the second largest area of employment within the service sector, with a further
16% of the workforce. In 2016, an estimated 91,500 FTEs were employed providing food and beverage services.
2
Food and beverage services includes cafes, restaurants, takeaway food services, catering services, pubs, taverns, bars, and clubs like the
RSA.
2At Your Service Aotearoa
Figure 1-2 Areas of employment within the service sector, FTEs, 2016
16%
Retail
Food and Beverage Services
Food Retailing
48% 16%
Residential Care Services
Sport and Recreation Activities
Hairdressing and Beauty Services
9% Other Service Sectors
7%
1%3%
Overall, these numbers indicate that the service sector is broad and includes industries such as retail, hospitality,
tourism, sport and recreation, personal services such as hair and beauty, and health services such as aged care.
It is also far reaching because the sector is customer focused, and the services provided underpin our quality of
life. The service sector is therefore a large, growing and important part of our economy.
However, it is also worth noting here that these employment figures - and the associated business numbers and
GDP - are an underestimate. This is because people employed in the service sector can work full-time or part-
time, as well as seasonally, casually or as volunteers. This means the proportion of New Zealanders working in
the service sector at any one time may be well above one in three, and the contribution of the sector to our
national economy may be well above $47.8 billion. 3 However, despite this shortcoming, it is important to have
a “ballpark” estimate of the number of people employed in the service sector, and what areas of the sector they
may be employed in.
1.2 Gross Domestic Product (GDP) generated by the service sector
Growth in the service sector in New Zealand is largely driven by the ongoing purchase of goods and services we
use in our daily life, our focus on our health and wellbeing, and our growing and ageing population. It is also
driven by an increase in the number of people who are visiting New Zealand.
The size of the contribution that the service sector makes to the New Zealand economy and our Gross Domestic
Product (GDP) is important. In 2016 the service sector contributed an estimated $47.8 billion in GDP to the New
Zealand economy. This represents 22% of the total GDP generated that year.
3Official data on employment is provided by Statistics New Zealand, either through the Census of Population and Dwellings which is held
every five years or through the annual Business Demography statistics. Both the Census and the business statistics provided in the Business
Demography survey are a snapshot of information. They rely on people filling in forms and providing information either on their employment,
or on their business and the number of people they employ.
3At Your Service Aotearoa
Figure 1-3 GDP by sectors of the New Zealand economy, $millions, 2016
13%
22%
Service sector
15% Primary sector
Manufacturing sector
10% Business services sector
Social services sector
Other sectors
12%
28%
The size of this contribution is also growing, and is likely to continue to grow as the service sector expands. For
example, between 2006 and 2016, the GDP generated by the sector grew by 1.9% per annum, with the largest
contributor to this growth being retail trade. Between 2006 and 2016, the GDP generated by retail trade grew
by $1.6 billion, to sit at $6.8 billion in 2016.
Table 1.2 Relative contribution of the service sector to the New Zealand economy, 2006-2016
Change 2015 - 2016 %pa change
Service Sector 2006 2015 2016
Number % 2006 - 2016
Employment (FTEs) 560,266 584,067 590,443 6,376 1.1 0.5
GDP ($mn) 39,714 46,742 47,845 1,103 2.4 1.9
Business units 103,785 112,728 114,603 1,875 1.7 1.0
source: BERL regional database, Statistics NZ
This is important, because if the amount of GDP that is generated in the economy increases compared to the
previous quarter (three months) or on an annual basis (every 12 months) then essentially the economy is
growing. Economic growth - as illustrated by GDP - generally results in more jobs, higher incomes and a better
standard of living. This means that the service sector makes a large contribution to the economy through GDP
and employment, and provides the products and services that impact on our broader wellbeing.
Over the last 10 years, GDP generated by the service sector has grown faster than the average for the New
Zealand economy. Employment in turn has grown slightly slower. This implies that greater productivity gains
have occurred in these sectors compared to the rest of the economy, and when we examine the numbers we
find this to be true.
Productivity has grown by 1.4% per annum over the last 10 years in the service sector compared to 0.6% per
annum productivity growth across the rest of the economy. This means that while the sector has lower
productivity than other sectors in our economy overall, this productivity has grown faster than other sectors in
the economy over the last 10 years.
4At Your Service Aotearoa
Table 1.3 Contribution to the economy of all industries in New Zealand
Change 2015 - 2016 %pa change
New Zealand 2006 2015 2016
Number % 2006 - 2016
Employment (FTEs) 1,794,183 1,976,617 2,019,473 42,856 2.2 1.2
GDP ($mn) 182,317 213,135 218,573 5,438 2.6 1.8
Business units 492,849 541,872 549,804 7,932 1.5 1.1
source: BERL regional database, Statistics NZ
1.3 Productivity and growth
Labour quality is a means of measuring productivity growth, and attributing this growth to a change in skills
and/or education level. Labour quality and changes or growth in labour quality is an area of interest
internationally and in New Zealand. These studies show that improvements in the quality of labour occur due to
education and training, and this has a positive impact on the growth rate of GDP. 4 In New Zealand, the Treasury
uses a growth accounting framework to analyse economic policy and performance, and to present data and
information on labour quality and labour utilisation.
To determine an approximate measure of the productivity (labour quality) improvement achieved by industry
training we use two index measures of the labour cost of workers. These index measures are from Statistics New
Zealand. One is an unadjusted index for quality so its growth is influenced by the quality improvements that
workers apply from skills, developed through training and experience. The other is adjusted, which means
Statistics New Zealand has removed an amount attributable to the quality improvement.
By comparing the two index measures for the service sector, we derive an approximate measure of the value of
these skills in providing a quality improvement to the service sector and the New Zealand economy.
Figure 1-4 Adjusted versus unadjusted LCI, 2009-2016
1300
Index
1250 2009Q2 = 1000
1200
1150
1100
1050
1000
adjusted unadjusted
Figure 1-4 displays the adjusted and unadjusted Labour Cost Index for the service sector. Both series grow, which
indicates that labour costs are growing. However, the unadjusted series diverges upwards from the adjusted
series over time.
4
For example: Jajri, I., & Ismail, R. (2010). Impact of labour quality on labour productivity and economic growth. African Journal of Business
Management, 4(4), 486; Sweetman, A. (2002). Working Smarter: Education and Productivity. The Review of Economic Performance &
Social Progress; Chevalier, A., Harmon, C., Walker. I., & Zhu, Y. (2004). Does Education Raise Productivity, Or Just Reflect It. The Economic
Journal. 114 (November). F499-F517.
5At Your Service Aotearoa
This indicates that the increase in labour costs attributable to labour quality (productivity) are increasing over
time. Both series start at a base of 1,000 in 2009. The adjusted series grows to 1,129 while the unadjusted grows
to 1,224. The difference (95) is an estimate of the quality adjustment – or the “quality gap”. This is the
productivity improvement.
Further, in Figure 1-5 we display this gap as a percentage of the adjusted series. This series grows to reach 11%
in 2016. This measure tells us that (labour) quality improvements of around 11% were achieved over the 2009
to 2016 period.
Figure 1-5"Quality gap" as a percentage of the adjusted series, 2009-2016
12%
10%
8%
6%
4%
2%
0%
What these figures illustrate is that productivity (labour quality) is increasing in the service sector, and some of
this improvement can be attributed to the training and qualifications that the ITOs represented by At Your Service
Aotearoa are providing.
1.3.1 Technical note
In order to develop the two index series, Statistics New Zealand conducts quarterly surveys of employers and
queries the wages and salaries of their employees. It then applies weights to the wages and salary data to reflect
the relative importance of the job in that particular sector. In order to adjust for the quality of labour increasing
over time Statistics New Zealand asks respondents to give reasons for any shift in wages and salary data.
Surveyed job descriptions usually specify the duties, qualifications required, years of service, and number of
hours worked.
The unadjusted series is calculated in a similar way but makes no adjustment for labour quality improvements.
Hence, we can compare an adjusted series to an unadjusted series to get at least a sense of improvement in
labour quality over time in a robust way.
6At Your Service Aotearoa
2 The projected growth in the service sector
The Ministry of Business Innovation and Employment (MBIE) produces short, medium and long-term
employment forecasts using economic models. These forecasts are used to inform policy advice relating to
immigration policy settings, and priority settings for tertiary education and industry training. 5
The latest forecasts produced by MBIE indicate that employment in the service sector is expected to grow in the
medium to long-term. 6 On average, this growth will also be above the expected growth in employment
nationally. For example, between 2020 and 2025 nationally employment is projected to grow by 1.6% per annum
while in sectors such as retail trade and commercial accommodation employment is projected to grow by 1.9%
per annum.
Employment growth in the service sector is expected to be driven by our growing and ageing population,
household spending, and tourism growth. Over the medium-term net migration will also be higher than average.
This means New Zealand is expected to remain an attractive place to live and work, and by default, to visit for a
holiday. This will have a positive impact on the service sector and create a demand for service sector workers.
2.1 Spotlight on key sectors
2.1.1 Tourism
Tourism is currently New Zealand’s largest export earner; but we operate in a competitive international
marketplace and we need to continue to attract international visitors and be their destination of choice.
In 2016, 3,127,100 international visitors spent $10,086 million in New Zealand, or an estimated $3,230 per visitor.
These visitors purchased accommodation and food and beverages. They undertook activities, rented vehicles
and travelled throughout New Zealand by bus, plane, train or rental car. Some visitors purchased a holiday
package, while others were independent travellers who picked their own activities, accommodation and the
locations they visited.
Table 2.1 International tourist total spend, year ended 2016
Product Spend ($millions) % of total
Accommodation services 1,479 15%
Cultural, recreation, and gambling services 495 5%
Food and beverage serving services 2,029 20%
Other passenger transport 1,546 15%
Other tourism products 875 9%
Retail sales - alcohol, food, and beverages 504 5%
Retail sales - fuel and other automotive products 853 8%
Retail sales - other 2,304 23%
Total 10,086 100%
Source: Statistics New Zealand, BERL calculations
5 MBIE. (2017). Medium to long-term employment forecasts: Looking ahead to 2017. Accessed at www.mbie.govt.nz.
6 Medium-term is defined by MBIE as 2015 to 2020, long-term is defined as 2020 to 2025.
7At Your Service Aotearoa
Statistics New Zealand Domestic Travel Survey data can be used to quantify the average spend by domestic
tourists. In short, this data tells us that New Zealanders when they go on holiday spent less on accommodation
and food and more on activities (other tourism products), as shown in Table 2.2. As domestic travellers, we like
to do and see things as well as stay with friends and family rather than just in commercial accommodation.
Table 2.2 Domestic tourist total spend, year ended 2015
Product Spend ($millions) % of total
Accommodation services 1,176 8%
Cultural, recreation, and gambling services 731 5%
Food and beverage serving services 1,569 11%
Other passenger transport 2,128 15%
Other tourism products 1,927 14%
Retail sales - alcohol, food, and beverages 1,645 12%
Retail sales - fuel and other automotive products 1,468 10%
Retail sales - other 3,488 25%
Total 14,132 100%
Source: Statistics New Zealand, BERL calculations
The service sector provides goods and services to international visitors as well as New Zealanders on holiday. For
international visitors our comparative advantages are our unspoilt natural environment, our great outdoors and
our landscapes. These are the same reasons why New Zealanders go on holiday to key destinations. The service
sector adds value to this by providing great customer service and memorable experiences.
The sector also helps New Zealand to maintain our international reputation and our global brand. This is
particularly important as the number of international visitors reached just over 3 million in 2016, and this number
is projected to continue to grow. The latest projections provided by MBIE indicate that international visitor
numbers could reach 4.5 million by 2022.
As the number of international and domestic visitors is projected to grow - due to favourable exchange rates,
New Zealand being considered a safe destination, growing consumer confidence and strong economic growth
internally - the demand for tourism-related services is also projected to grow.
This is positive news; but it is creating some concern among industry players. These players are signalling the
need to be prepared for this growth through the establishment of strategies. These strategies are focused on
encouraging the dispersal of international visitors beyond the main tourist centres and ensuring the service
sector has the appropriate mix of trained and skilled people.
MBIE, in their latest tourism research, has identified the need to disperse visitors across all regions of New
Zealand. MBIE argues that this could be encouraged through promotion of the regions, and investment in
promoting all regions as locations and destinations in their own rights. These promotions could potential focus
on features of historical significance and/or natural resources. The reasoning behind this is that visitors often
choose to visit a place based on the offerings of tourism operators in these locations.
To build and maintain our reputation as a great place to visit, New Zealand also needs to offer great customer
service as well as great experiences. This is where training and ensuring an appropriate mix of skills, knowledge
and qualifications is important. The Tourism Industry Association has recognised this in their People and Skills
2025 report. Further, the aim of this association is to ensure that “Tourism operators can meet their labour and
skills needs to deliver high quality visitor experiences in a profitable way.”
8At Your Service Aotearoa
This is complemented by MBIE’s Tourism Strategy, which envisions that a skilled and committed workforce will
be critical for the future success of the tourism industry along with career development pathways.
2.1.2 The unregulated (Kaiāwhina) health workforce
Health and disability support services are provided by two tiers of workers with different skill sets. When a
person is ill (mentally or physically) they can seek help from a professional. However, treatment of illness is not
limited to the immediate attention of these professionals and consumers often need ongoing support. The
workforce that provides this ongoing support falls under the umbrella of Kaiāwhina.
The Kaiāwhina workforce is an important part of the service sector. Kaiāwhina is the over-arching term to
describe non-regulated roles in the health and disability sector. The term does not replace the specific role titles,
for example: healthcare assistant, orderly, mental health support worker. These workers improve the lives of
their clients immensely by providing health and disability support services.
The New Zealand Treasury recognises the value of care and support services. In its 2014 Briefing to the Incoming
Minister of Health, it says: “The role of the care and support workforce in the aged care and disability support
sectors is important to the health sector’s capability to respond to the ageing population and the increasing
prevalence of chronic disease. It is also important to the wider workforce because it allows other health workers
such as nurses to concentrate on tasks that make better use of their training. A well-functioning, appropriately
trained care and support workforce enables people with more complex health needs to be cared for in their
homes for longer and facilitates earlier discharge from hospital, freeing up hospital beds with a positive impact
on patient flows and efficiency.”
The demand for carers and support workers is expected to rise as the population ages and the trend for care to
move out of hospitals and closer to people’s homes continues. 7 New Zealand therefore faces similar challenges
to the rest of the OECD, with potential shortages of skilled and unskilled staff in the health and disability sectors,
and the need for a cohesive and integrated vocational education system that offers opportunities for school
leavers and the existing workforce. 8
Careerforce emphasised in their Briefing to the Incoming Minister of Tertiary Education, Skills and Employment
that the predicted shortfall in health and disability support workers is a major issue facing both the sector and
the wider community. 9
7 Information accessible from the Ministry of Health website, www.moh.govt.nz.
8 Careerforce Briefing to the Incoming Minister for Tertiary Education, Skills and Employment. Information accessible from
www.careerforce.org.nz
9
Dr Ganesh Nana. A Profile of the Health and Disability Workforce. Careerforce Workforce Development Conference 2014. Accessible from
http://www.careerforce.org.nz/wordpress/wp-content/uploads/Presentation-Dr-Ganesh-Nana.pdf and associated video.
9At Your Service Aotearoa
In this sector we work with people that have multiple disabilities and issues and we aim to improve the life of that
person at that moment. This is because we are essentially helping our residents to make the most of every day.
“Many of our clients are coping with illness and dealing with loss, and this loss can be wide ranging - from the loss
of loved ones, through to losing their home or independence. So our role is to give them back a sense of value and
self-respect, and to show them that we value where they are at now in their lives. It is important to show respect
to older people and to treat them as an adult – we do this through working alongside them rather than for them.
We give them things they can do – such as brushing their hair or cleaning their teeth – and support them in this
independence.
“Whether you are a school leaver or a career changer you need to be someone who has an understanding and
respect for the elderly. You need to be tolerant and show empathy because you are providing people with care and
that involves communication and listening skills, and the ability to work independently as well as part of a team.
You also need to be trustworthy as you are working with vulnerable people”
Heather Harlow is the National Quality Advisor for a large retirement village operator. Her role involves supporting
staff to work better and smarter. “We are constantly reviewing our workplace performance and practices, and we
are interested in not only current best practice but what we can do to provide a better service to our clients, and
work towards the vision and values of our business. We are therefore looking at how we can do this through
education and training.
“Industry training gives people a better understanding of what their role is. And our staff see the relevance of
training because it is directly relevant to their work, and it keeps them engaged and motivated to complete the
training and qualification.
“We believe we are raising the bar in our industry through providing formal qualifications in care. We also believe
it is making a difference for our staff and our clients. Through training and qualifications we are able to offer our
staff a career pathway and illustrate in a straight-forward, simple manner what their role involves and what their
potential trajectory is.
“People may not have had the opportunity to undertake qualifications in the past and we wanted to provide them
with developmental opportunities. We wanted to invest in our staff and provide them with skills and knowledge
relevant to their role, but we also wanted to show our staff that we valued them in other ways than just salary.
“Many of our staff have no previous qualifications so we have a notice board where we acknowledge the completion
of qualifications, and what people are working towards, and we have a graduation ceremony when people complete
their qualifications.
“I really like working with Careerforce. The people I have worked with are professional, proactive and very
supportive. They take a real partnership approach and want industry training and the qualifications we are
providing to work well. You can see this in the way they acknowledge our staff and their previous skills and
experience, and then work with them to ensure that the qualifications add value to these skills and experiences.
“The best thing about working in aged care is the benefit you gain from interacting with people who are an older
age. They give such a lot back of themselves, and you learn about them as people – their character and interests,
and their background and history. Also when you work with older people they are very appreciative of what you do
for them, and they show that through positive comments and smiles, and they also show gratitude.”
Heather Harlow, National Quality Advisor, Hurst Lifecare
10At Your Service Aotearoa
2.1.3 Recreation and sport
Some 2.5 million adult New Zealanders take part in physical activity each week. Our most popular recreation
activities are walking, swimming, cycling and jogging, while popular sports include golf, soccer, tennis, netball,
cricket, rugby and touch rugby.
The benefits of physical activity, in terms of the prevention of health conditions such as heart disease and stroke,
are well documented and it is widely recognised that physical activity can help people live longer, healthier lives.
A number of government-funded initiatives support increasing physical activity for good health outcomes. For
example, Sport NZ’s Green Prescription is a primary health initiative that enables GPs and practice nurses to refer
patients to support such as gyms and recreation centres to increase their physical activity. In the future, the
number of these initiatives may increase due to growing health concerns around issues such as obesity and an
ageing population.
In October 2015, the Government launched the Childhood Obesity Plan, which contains 22 initiatives involving
the private and public sectors, communities, schools and families. At the core of this plan is a new childhood
obesity health target and strategies to improve access to support for children and families, including help with
activity and lifestyle changes.
In addition, the Ministry of Health’s New Zealand Health Strategy, which was launched in 2016, encourages a
cross-sector approach to health promotion, rehabilitation and disease and injury prevention. In this strategy
there are increasing expectations of close cooperation between the health and sport and recreation sectors. This
strategy is focused on young and old people, as increasing numbers of older people wish to remain physically
active.
The benefits of physical activity in terms of social and cultural wellbeing is also widely recognised in New Zealand.
For example, outdoor recreation organisations such as Hillary Outdoors and Outward Bound offer leadership
development for people of all ages through outdoor experiences. For young people in particular, they focus on
building cooperation, trust, self-belief, and good citizenship to others and the environment.
In addition to this local participation, significant numbers of international visitors travel to New Zealand each
year to ski or undertake some form of outdoor activity. From June 2014 to July 2015, for example, 70 percent of
international visitors reported they spent time during their visit walking or tramping. In addition, over one-third
of these visitors reported taking part in other outdoor recreation activities during the same trip.
Outdoor recreation and adventure activities were the second most popular reason for visiting New Zealand in
2014/15. Looking ahead this popularity could grow, particularly if activities are tailored to meet the needs of
growing international visitor markets such as FIT Chinese visitors (Free and Independent Travellers). A strong
overlap therefore exists between outdoor recreation and international tourism in New Zealand.
11At Your Service Aotearoa
“If you are going to work in the outdoor recreation industry you need to be committed to it. You have to put in a
lot of effort to gain the appropriate skills and qualifications, but then you also have to work hard to get your foot
on the ladder and get yourself set up in your career.”
Kate Parr has worked in the outdoor recreation industry for 30 years. She originally trained as a teacher before
retraining and moving into outdoor recreation and outdoor education. As a young woman she knew she wanted
to be an outdoor recreation instructor but she was advised against it at the time.
“It’s not easy as a school leaver to enter the industry, it is a lot of hard work. But when I was younger I did my Duke
of Edinburgh Award through school and I went to an outdoor centre and learnt sailing and kayaking. These
experiences made me want to be an outdoor instructor. I started at the bottom and worked my way up. Now I
have my own company and we provide many people with their first step into an outdoor experience.”
Kate’s company predominantly works with primary school aged children - in Years three to seven. However, her
company also does outdoor recreation activities with secondary school students and adults, and they undertake
specific activities with corporate or cultural groups. “Working in the outdoors provides you with a really good sense
of satisfaction. You are always getting new experiences and you work with great people.”
Kate is a workplace assessor and she currently employs six people who are undertaking their apprenticeships
through Skills Active. She also has three other staff members who are considering undertaking an apprenticeship.
Some of these staff members are completing qualifications as part of gaining recognition for prior learning and
existing skill sets. “There are a lot of skill sets that are required in our industry, and looking ahead the outdoor
recreation industry in New Zealand is becoming more focused on qualifications and the importance of qualifications
to illustrate competency and ability to undertake and instruct in an activity.
For Kate, industry training suits her business as it fits with her workplace training and induction programme.
Industry training provides Kate with a structure and framework that her staff members can use, and the
qualifications are industry recognised. “Industry training also provides our business with the ability to invest in
people. People get involved in industry training because they have worked in the industry and they want new
qualifications; they want to upskill and undertake professional development; or they undertake industry training as
they want recognition of prior experience and skills.”
Kate Parr, Employer and Skills Active Workplace Assessor
12At Your Service Aotearoa
2.1.4 Hairdressing and beauty services
Our hair and beauty sector is well recognised overseas in the fashion, photography and film industries. This is
because New Zealand produces internationally recognised stylists and colourists. These world-renowned stylists
and colourists are the result of a hairdressing industry that embraces and actively promotes industry training.
Industry research indicates that the majority of salons (66%) are small; employing up to five people. 10 However,
the potential customer base of these salons is broad and growing. Employment prospects within the hairdressing
and beauty industries are relatively good as demand for the services remains stable, even in times of economic
recession.
Once fully qualified and experienced, there are opportunities for hairdressers to work in a variety of industries
including film, TV, magazines or fashion and in varying locations such as cruise ships and resorts. 11 These career
opportunities allow for creative expression, the ability to work internationally, and the ability to establish a
business.
Technology is impacting on the services consumers seek. They look online for the latest styles and colours and
many expect a “full salon” experience when they visit their hairdresser not just a haircut or colour. Technology
is also impacting on colour choices. Approximately 51% of New Zealand women colour their hair and
improvements in colour product technology may be influencing client preferences.
10
THE LONG AND SHORT OF IT Hairdressing Industry Report A review by L’Oréal Professional Products of Hairdressing in New Zealand and
future industry opportunities.
11
Ibid.
13At Your Service Aotearoa
“The day you think you know it all is the day you give up hairdressing!” Anne Millar laughs, “It’s an amazing industry.
“I always wanted to be a hairdresser and the passion is still there. I enjoy hairdressing, it’s creative but there is also
a lot of science involved as you are dealing with chemicals. I think to be a hairdresser you have to have imagination
and you have to have a flair for colour, but you’ve also got to want to work hard because hairdressing is not
something that you can learn in just five minutes.
“When I trained to become a hairdresser I got a trade certificate, so I decided to redo my qualifications to better
understand what my apprentices were going through and what HITO expected the apprentices to know and learn.
So I also have a National Certificate in Hairdressing and it was exciting, it was exciting to redo my qualifications.
“HITO training is internationally recognised and the qualifications that you gain in New Zealand are world renown.
But these qualifications are not easily achieved – it’s not a quick fix – you need to put in the hard yards before the
world becomes your oyster. But the rewards are well worth the hard work, particularly because as an apprentice
you get to earn while you learn rather than commence employment with a student loan or debt.
“I employ apprentices because it gives you a chance to train that person. They become a part of your team while
they are training, and they begin to know and understand the culture at the salon and your clients. Each salon has
a different culture, and I send my apprentices to other salons so they can see another side of the business and learn
skills from other hairdressers.
“Our salon has one or two apprentices at any one time, but you can’t treat all of your apprentices the same as they
have different ways of learning. As an employer I have learnt to modify my approach and be adaptable to the needs
of my employees to help them succeed.
“I would recommend industry training because you watch your apprentices increase their skills and become qualified
and you get as nervous and as excited as they are about undertaking their assessments and gaining the qualification.
It is so satisfying watching them grow, particularly when you think about when they first started and the things they
could and couldn’t do. It is satisfying to watch your staff flourish and grow, and you really do want them to succeed.
“As an employer I can see the change in my staff and I can measure that change, particularly in their confidence
and competency levels. You have to let your apprentice know that they are doing well, but you also need to let them
know if things are going wrong! It is important to nurture your staff, particularly your apprentices because they are
often the first person your client meets when they walk through the door and they are often the first impression that
is gained about your salon, particularly as the apprentice greets the client and takes them through to the basin to
have their hair washed.”
Anne has trained a number of apprentices in her salon and her advice to anyone thinking about entering the industry
is that you can’t be shy and be a hairdresser – you need to have confidence and you need to be well-presented. She
also noted the importance of paying attention to your clients. “You need to make your client feel like they are the
most important person in the room.”
Anne Millar, Employer and HITO Workplace Assessor
14At Your Service Aotearoa
2.1.5 Wholesale trade
Wholesalers help New Zealand businesses source products to on-sell to customers. They do this with a high level
of skill in marketing and product knowledge. The end result is that consumers get goods they want. Without
such people the process of procuring for consumers would be much more arduous.
The Food and Agriculture Organisation of the United Nations noted the following economic benefits from
wholesaling activity in the particular case of agricultural produce (of some importance in New Zealand) and these
are generally applicable to wholesaling in general. 12
• Greater stability of supply and sale of produce: wholesaling activities generally take place in large,
centralised locations. These locations are known and easily accessible to operators, this reduces the
number of intermediaries in the distribution pipeline. Thus reducing uncertainty concerning supplies
and completion of sales transactions.
• Improved market information (especially on prices): because transactions in a wholesale market are
centralised information regarding prices and quality is quickly widely disseminated. This improves the
efficiency of the market and makes it easier for retailers to purchase high quality goods.
• Enhanced competition leading to improved efficiency in the exchange process and facilitating price
discovery.
• Improved inspection, quality control, sorting and grading according to quality encourage the use of
standard weights and measures and improved standards of hygiene in the sale of produce (especially
of perishables).
• Increased volume of produce marketed and quality differentiation: the reduction in the number of
intermediaries in the food marketing chain and consequent increase in the tonnage handled by
individual traders or the scale of their operations tend to lower distribution costs (especially the cost of
transporting produce) and also encourage efficient sorting and grading which facilitates trade in
produce of different quality.
• These benefits accrue in the first instance to retailers dealing with wholesalers. The benefits are then
passed on to consumers through the dynamic process of competition in goods markets.
2.2 Potential labour constraints and skill shortages
As at December 2016, the labour force participation rate in New Zealand was 70.5%. This means seven out of
10 people in our working age population are in work. This high participation rate is largely due to historical high
net migration and older people staying in the workforce post-retirement age.
As discussed earlier, MBIE in their medium to long-term forecasts indicate that employment in New Zealand to
2025 will grow by 1.6% per annum. 13 This means an additional 48,000 workers will be employment each year
between now and 2025. During this period, the population will continue to grow and age, and people will enter
and retire from the workforce. Labour force participation rates are projected to remain high, and employment
in the service sector is projected to grow.
However, labour constraints will occur during this period due to an ageing population and an increase in
employment opportunities, and with labour constraints come skill shortages.
12
Tollens, E. (2000). Wholesale markets in African cities: diagnosis, role, advantages, and elements for further study and development. FAO
Agricultural Services Bulletin, (143), 1-13.
13
MBIE. (2017). Medium to long-term employment forecasts: Looking ahead to 2017. Accessed at www.mbie.govt.nz
15At Your Service Aotearoa
Issues of particular concern to the service sector are:
• Approximately 30,000 workers are expected to retire over this period. 14 This figure is based on census data,
including the age and occupation of people in the workforce and their expected behaviour post-65. This
data indicates that the retirement rate will be 1.3% per annum to 2020. This means 1.3% of our workforce
will leave work to retire.
• Unemployment as at December 2016 was 5.2%, but the proportion of people aged 15 to 24 not in
education, employment or training was 13.6%. These young people are disengaged and not part of our
workforce. The proportion of young people who are not in education, employment or training varies by
region, and in some regions one in five young people are in this situation.
MBIE argues to meet the potential labour constraint and ensure long-term sustainable economic growth,
productivity gains need to occur. As discussed in our previous section, productivity in the service sector has risen
over the last 10 years at a higher rate than the national average. This means productivity gains are already
occurring in the service sector, but more work is required.
As discussed in a later section, changing customer preferences and technology are impacting on the service
sector. This means existing workers need to undertake regular training to maintain and grow their skill base,
gain qualifications, and meet customer expectations.
The service sector is in a good position to work with government to further increase productivity and meet any
potential shortfall in labour supply. The service sector has relationships with industry, employers and the
secondary and tertiary education sectors and is willing and able to extend these relationships to ensure the
service sector has a well-qualified workforce in the short, medium and long-term.
Service sector ITOs gather data and information on industry-specific trends and workforce development. This
derives from industry stakeholders and official data sources and is used to develop and facilitate industry training.
It is also disseminated to industry players and government stakeholders such as TEC and NZQA so they are aware
of current data, trends and issues.
Further, the ability of the service sector to deliver skills, training and qualifications at a variety of levels to diverse
learners, trainees and apprentices can be seen in the individual programmes that Careerforce, HITO, ServiceIQ,
and Skills Active offer. The ability of the sector to collaborate is also illustrated through the establishment of At
Your Service Aotearoa.
14
MBIE. (2017). Medium to long-term employment forecasts: Looking ahead to 2017. Accessed at www.mbie.govt.nz.
16At Your Service Aotearoa
3 At Your Service Aotearoa
At Your Service Aotearoa is a collaboration between four industry training organisations that provide workplace
training across the service sector. These ITOs are ServiceIQ, Skills Active, Careerforce, and the Hair and Beauty
Industry Training Organisation (HITO).
• Service IQ is the ITO for the accommodation, aviation, cafes, bars, and restaurants, food services,
museums quick service restaurants, retail, tourism, travel, and wholesale sectors.
• Skills Active Aotearoa is the ITO for the recreation, sport, fitness and snow sport sectors.
• Careerforce is the ITO for the health and wellbeing sectors, which includes the non-regulated workforce
in health, mental health, aged support, disability, social and community services, and youth work.
Careerforce is also the ITO for the cleaning and caretaking, and pest management sectors.
• HITO is the ITO for the hair and beauty sector.
Each of these ITOs have relationships with high profile employers, education providers throughout New Zealand,
and workplace trainees, apprentices and assessors. A collaboration such as At Your Service Aotearoa allows the
ITOs to showcase these relationships, and highlight the importance of the service sector and the training this
sector engages in.
Employers train their staff on the job about how to complete tasks. This training can take place at the beginning
of an employment contract as part of induction. It can also occur throughout the time that a person is employed
by that company. This training can be informal or formal, and it can involve unit standards and national
qualifications. ITOs work with employers to develop qualifications and training programmes that align learning
with workplace activities and tasks.
The size of the service sector and its importance to the New Zealand economy is a key reason for ServiceIQ,
Careerforce, Skills Active and HITO to collaborate. A second reason for this collaboration is the size of the
workforce that these ITOs represent and the influence the ITOs have on training a confident and competent
workforce.
3.1 The training that the workforce engages in
In 2015, approximately 41,100 trainees and 3,500 apprentices were engaged in industry training across the
service sectors. This represents 29% of all industry training taking place in New Zealand at this time. The tables
below illustrate the number of trainees and apprentices engaged under each of the four ITOs, per year from
2010 to 2015. 15
Table 3.1 Trainee counts by year, 2010-2015
Organisation 2010 2011 2012 2013 2014 2015
Careerforce - ITO 17,080 12,620 12,070 12,885 13,765 16,245
Hairdressing & beauty - ITO 50 55 85 100 135 140
ServiceIQ - ITO 27,805 22,610 20,995 20,630 17,145 18,660
Skills Active - ITO 6,270 5,840 5,260 5,890 5,815 6,090
At Your Service Aotearoa ITOs - Total 51,205 41,125 38,410 39,505 36,860 41,135
ITO Total 159,290 115,935 107,345 107,575 105,695 110,535
Source: Education counts
15
Between 2010 and 2015, the number of ITOs has declined and some ITOs have been amalgamated. This has impacted on the number of
people engaged in industry training so caution should be exercised in the interpretation of these numbers.
17You can also read