Strategic Plan for Public Transportation - King County Metro 2015 UPDATE ADOPTED JULY 2011 - King County Metro ...
←
→
Page content transcription
If your browser does not render page correctly, please read the page content below
Attachment A

King County Metro
Strategic Plan
for Public
Transportation
2011-2021
2015 UPDATE
ADOPTED JULY 2011
DRAFT 2015 UPDATE
LETTER FROM THE GENERAL MANAGER
Dear Friends,
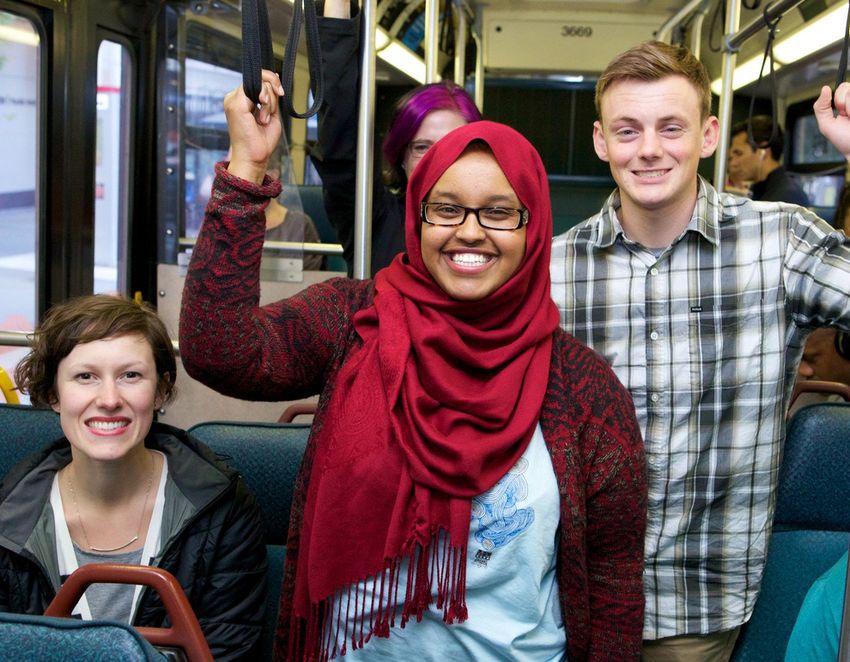
Our strategic plan cover girl, §§ Engaged tens of thousands of county residents in
Anaya, was only six when planning services as we started RapidRide lines,
she appeared on the first restructured bus networks to serve customers better
edition of the plan in 2011. ADOPTED
JULY 2011 and more efficiently, coordinated Metro’s services
She has changed in the with Sound Transit’s Link light rail, and developed
years since then, and so alternative services to meet local community needs.
has Metro as we put the
strategic plan and service §§ Enhanced programs to help employees move
guidelines to work. up in the organization and to develop the next
generation of leaders. The Partnership to Achieve
Some highlights of what we’ve done: Comprehensive Equity, formed in 2013, continues
working to build and sustain an inclusive, fair and
§§ Enhanced safety—our number one goal—through equitable workplace.
more frequent bus operator safety training, a
pedestrian awareness campaign, and stronger §§ Used the service
measures to protect our drivers. guidelines every year
to evaluate our transit
§§ Launched the groundbreaking ORCA LIFT reduced system and help us
fare program, making transit more affordable for provide efficient, high-
people with low incomes. quality service that
meets the county’s
§§ Supported our region’s economy by getting more most important public
people to work as the job market rebounded. Metro transportation needs.
delivered an all-time record of 121 million passenger
trips in 2014. §§ Produced annual
reports showing our
§§ Brought new-generation hybrid buses and zero- progress toward
emission electric trolleys into our fleet as we move the strategic plan
toward our goal of an all-electric and hybrid fleet by objectives using the
2018. We also completed a Sustainability Plan with metrics defined in the plan. The reports also compare
goals for conserving energy and water, reducing Metro’s performance with that of peer transit
climate pollution, managing waste, and growing agencies. Our online Accountability Center makes it
transit ridership. easy for the public to find performance reports as
well as monthly and annual data.
§§ Earned high marks from customers—90 percent of
riders surveyed in 2014 were very or somewhat The first edition of the strategic plan didn’t sit on
satisfied with our service. Service improvements, the shelf—we actively used it. The same will go
such as the six RapidRide lines we completed for this updated version, and by incorporating
between 2010 and 2014, and improved communication recommendations from the Service Guidelines Task
tools like our new TripPlanner mobile app, are Force and Access to Transit Study, this 2015 plan
factors. improves the strategies and tools we’re using to make
real progress toward our vision.
§§ Continued to focus on containing costs. One way
we’re doing this is to involve employees in Lean and Sincerely,
process improvement projects.
Kevin Desmond, General Manager
King County Metro Transit
King County Metro Transit
Strategic Plan for
Public Transportation
2011-2021
2015 UPDATE
April 27, 2016
Department of Transportation
Metro Transit Division
King Street Center, KSC-TR-0415
201 S. Jackson St
Seattle, WA 98104
206-553-3000 TTY Relay: 711
www.kingcounty.gov/metro
Alternative Formats Available
206-477-3832 TTY Relay: 711
15095-MTSP/comm
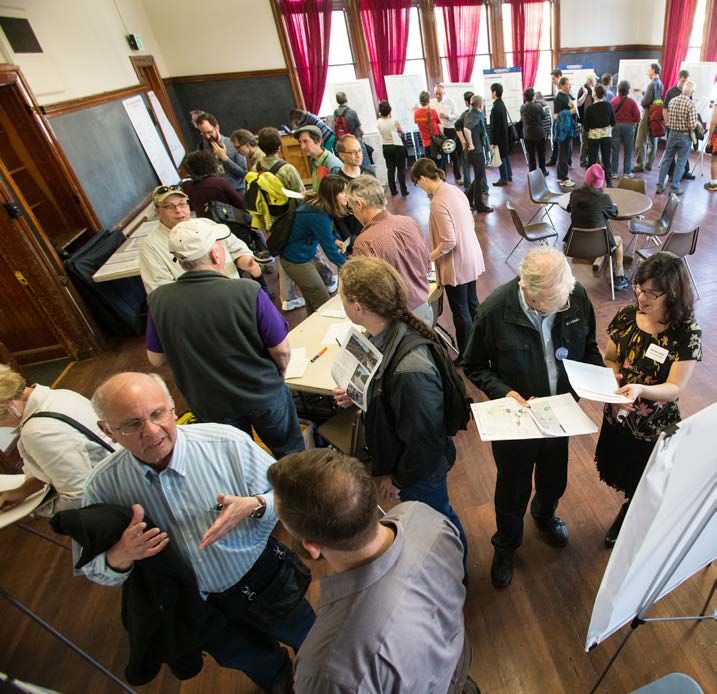
TABLE OF CONTENTS

METRO’S MISSION........................................ 1                    CHAPTER 3: PLAN PERFORMANCE
                                                                             MONITORING.............................................. 54
METRO’S VISION........................................... 2
                                                                             Section 3.1: How Metro measures
                                                                             performance...................................................... 54
EXECUTIVE SUMMARY.................................. 4
                                                                                  Measuring strategic plan progress..................54
CHAPTER 1: INTRODUCTION....................... 12                                 Measuring objectives......................................55
                                                                                  Measuring strategies.......................................56
Section 1.1: Background and context................ 12
                                                                                  Peer comparison.............................................59
     The importance of transit in the Puget Sound
                                                                                  Route performance.........................................59
     region.............................................................12
     Metro’s mandate............................................12
                                                                             FIGURES
Section 1.2: Challenges and opportunities....... 14                          Figure 1: Urban growth area, King County............13
     Regional growth, land use and the economy...14                          Figure 2: Metro ridership 2003-2014....................14
     Demographic changes....................................16               Figure 3: Regional growth, manufacturing/
     Customer service and satisfaction...................17                            industrial, and transit activity centers.....15
     Funding..........................................................17     Figure 4: Puget Sound region projected population
                                                                                       and employment growth
     The environment.............................................18                    2000-2040.............................................16
     Access to transit..............................................19       Figure 5: What’s important to Metro riders...........17
     Evolving transportation system.......................19                 Figure 6: Fourth quarter park-and-ride
                                                                                       utilization 2003-2014.............................35
Section 1.3: Strategic plan development.......... 21
     The path ahead...............................................23         TABLES
                                                                             Table 1: Summary table of Metro strategic plan
CHAPTER 2: A PATHWAY TO THE FUTURE... 25                                              elements..................................................6
                                                                             Table 2: Objectives and related outcomes...........55
Section 2.1: Goals, objectives and strategies... 25                          Table 3: Strategy performance measures.............56
Section 2.2: Metro’s goals................................. 26               Table 4: Peer comparison—key areas of
                                                                                      performance..........................................58
     Goal 1: Safety.................................................26
     Goal 2: Human Potential.................................28
     Goal 3: Economic Growth and Built
     Environment...................................................32
     Goal 4: Environmental Sustainability...............38
     Goal 5: Service Excellence...............................40
     Goal 6: Financial Stewardship.........................43
     Goal 7: Public Engagement and Transparency....48
     Goal 8: Quality Workforce...............................51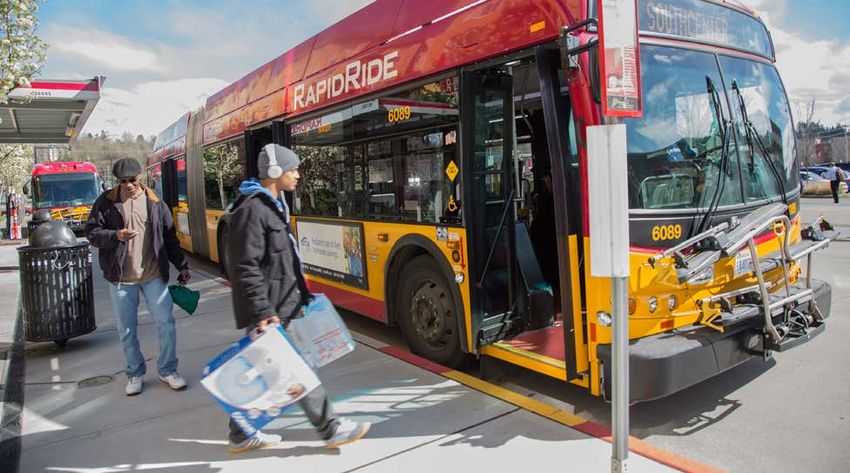
METRO’S MISSION

  Provide the best possible
  public transportation services and
  improve regional mobility and
  quality of life in King County.

1		                      KING COUNTY METRO STRATEGIC PLAN   (2015 UPDATE)
METRO’S VISION

     What we aspire to be.

      Metro provides safe,                Expanded and improved               The public is engaged with
      efficient and reliable              products and services make          Metro—informed about our
      public transportation that          public transportation attractive    plans and performance and a
      people find easy to use.            to a growing segment of             big part of the decision-making
      We offer a cost-effective mix of    the population, and public          process. Customers find the
      products and services, tailored     transportation ridership            public transportation experience
      to specific market needs and        increases as a result. With more    to be positive at every stage,
      well-integrated with the            and more people switching from      from trip planning to arrival at a
      services offered by other public    single-occupant cars to buses,      destination. People understand
      transportation agencies.            carpools and other alternative      how to use Metro’s products and
                                          transportation options, roadways    services, and are happy with the
                                          are more efficient—carrying more    variety of transportation options
       Our fixed-route bus system         people and goods and moving         available.
       meets the public transportation    them faster. Less land is paved
       needs of most of our               for parking, and the region can
       customers, particularly in areas   reduce its reliance on highway
       of concentrated economic           expansion.
       activity or urban development
       and along the corridors that                                           Metro has quality employees
       link them. Metro’s other public                                        who enjoy their jobs. Their
       transportation options include                                         satisfaction shows in their good
       paratransit service for people                                         work ethic and responsiveness
       with disabilities who can’t                                            to customers.
       use the fixed-route system,        Public transportation is
       alternative services designed      contributing to a better
       for communities where              quality of life in the Puget
       regular bus service isn’t the      Sound region. The local economy
       best fit, commuter vanpools,       is thriving because transit
       and ridesharing programs.          keeps the region moving. Public     Metro is financially stable—
       No matter what community           health is improving because         able to sustain transit products
       people live in or what needs       people are walking, biking, and     and services in both the short
       they might have related to         using transit more. Emissions       and long term by emphasizing
       age, disability, income, or        from transportation have            productivity and efficiency and
       other circumstances, people        leveled off and are starting to     by controlling costs. Metro
       can use public transportation      decline, and Metro is using new     receives sufficient funding to
       throughout King County.            technologies to reduce our energy   fulfill the public’s expectations
                                          consumption.                        for service and the region’s
                                                                              vision for a robust public
                                                                              transportation system.

KING COUNTY METRO STRATEGIC PLAN    (2015 UPDATE)		2
3 EXECUTIVE SUMMARY KING COUNT Y METRO STRATEGIC PL AN (2015 UPDATE)
EXECUTIVE SUMMARY

A plan for moving toward our vision
Public transportation is vitally important to the Puget Sound region, providing
connections to jobs, schools, and other destinations; enabling people with limited
mobility options to travel; enhancing regional economic vitality; providing an alternative
to single-occupant driving on the most congested roadways; helping accommodate
growth; and benefitting the environment.

King County Metro Transit, King County’s public transportation provider, is committed
to serving the public with the highest quality products and services possible as we work
toward our vision of a sustainable public transportation system that helps our region
thrive.

The Strategic Plan for Public Transportation outlines key opportunities and challenges
Metro faces:

Population and economic growth: To accommodate 28 percent more people and
40 percent more jobs, Metro’s annual service is expected to grow by 2.3 million annual
service hours (roughly 60 percent) by 2040.

Demographic changes: The percentage of residents in King County over age 65 is
increasing, younger people are increasingly choosing transit, the number of people
with low incomes is growing, and our population is becoming more diverse—with
associated disparities in education, employment, and income. Metro will continue
to provide mobility for people who, for these and other reasons, have limited
transportation options or are increasingly choosing transit.

Customer service and satisfaction: An ongoing aspiration is to make every customer’s
public transportation experience positive at every stage of a trip. Among the drivers
of customer satisfaction are the frequency of service, personal safety on buses and at
stops, comfort and cleanliness on buses and at stops, customer information, bus drivers'
performance and the number of transfers.

    KING COUNT Y METRO STRATEGIC PL AN     (2015 UPDATE)                                     EXECUTIVE SUMMARY   4
The environment: Metro has a major role to play in helping King County meet
                        its greenhouse gas reduction targets: reduce countywide sources of greenhouse
                        emissions by 25 percent by 2020, 50 percent by 2030, and 80 percent by 2050; and
                        reduce emissions from County operations by at least 15 percent by 2015, 25 percent
                        by 2020, and 50 percent by 2030. (Targets are compared to a 2007 baseline.)

                        Funding: Metro’s heavy reliance on sales tax makes it challenging to provide
                        sustainable bus service, because revenue from this source is likely to decline in an
                        economic downturn. While Metro’s finances are on relatively stable footing as of
                        late 2015, all of the region’s transit agencies need additional long-term, sustainable
                        funding to deliver the services our region expects. Metro’s annual service guidelines
                        analysis consistently finds that the transit system needs substantially higher
                        investments in service than Metro can make with available resources. The 2015
                        analysis found a need of more than 470,000 annual service hours, equivalent to a
                        13 percent expansion of our system.

                        Access to transit: People’s access to transit depends on factors such as their
                        proximity to bus stops, the quality of walking and biking pathways, the availability
                        of parking spaces at park-and-rides, and the type and amount of transit service
                        provided at the access point. Working in partnership with other transit agencies and
                        local jurisdictions, Metro can help improve access across King County.

                        Evolving transportation system: Continued and increased collaboration with
                        other agencies will be necessary to deliver efficient, well-integrated services as the
                        region’s public transportation system evolves.

                        Pathway to the future
                        This is a plan for addressing these challenges and opportunities and moving
                        toward our vision for public transportation. A companion long-term plan, slated for
                        adoption in 2016, will contain more detail about Metro’s future public transportation
                        network.

                        Our plan builds on the foundation of King County’s mission, vision, guiding
                        principles, and goals, which were adopted in 2010 and updated in 2015. The revised
                        County goals highlight the importance of transportation by adding a new goal:
                        Deliver a seamless, reliable network of transportation options to get people where
                        they need to go, when they need to get there.

                        Metro's plan and attached service guidelines also reflect the recommendations of
                        two public advisory groups:

                        §§ The Regional Transit Task Force, which in 2010 proposed a groundbreaking
                           new policy framework and service guidelines for transit in King County.

                        §§ The Service Guidelines Task Force, which in 2015 reviewed Metro’s experience
                           using the service guidelines and recommended a number of revisions.

                        The plan establishes goals, objectives, and strategies for achieving our vision, as
                        well as performance measures to track progress. These are summarized in the table
                        that follows.

5   EXECUTIVE SUMMARY                                      KING COUNT Y METRO STRATEGIC PL AN       (2015 UPDATE)
TABLE 1: Summary table of Metro strategic plan elements
OBJECTIVES STRATEGIES MEASURES
Goal 1: Safety. Support safe communities.
Keep people safe and Promote safety and security in • Preventable accidents per million
secure. public transportation operations and miles
facilities. • Operator and passenger incidents
Outcome:
Metro’s services and facilities Plan for and execute regional and assaults
are safe and secure. emergency-response and homeland • Customer satisfaction regarding
security efforts. safety and security
• Effectiveness of emergency responses
Goal 2: Human Potential. Provide equitable opportunities for people from all areas of King County
to access the public transportation system.
Provide public Design and offer a variety of public • Population within a ¼-mile walk
transportation products transportation products and services delete to a transit stop
and services that add value appropriate to different markets and • Number of jobs within a ¼-mile
throughout King County mobility needs. walk to a transit stop
and that facilitate access to
Provide travel opportunities and • Number of students at universities
jobs, education and other
supporting amenities for historically and community colleges that are
destinations.
disadvantaged populations, such as within a ¼-mile walk to a transit
Outcome: low-income people, students, youth, stop
More people throughout King seniors, people of color, people with • Percentage of households in low-
County have access to public disabilities, and others with limited income census tracts within a
transportation products and transportation options. ¼-mile walk to a transit stop
services.
Provide products and services that are • Percentage of households in
designed to provide geographic value minority census tracts within a
in all parts of King County. ¼-mile walk to a transit stop
In areas that are not well-served • Population within ½ mile of stops
by fixed-route service, seek with frequent service
to complement or “right-size” • Number of jobs within ½ mile of
transportation service by working stops with frequent service
with partners to develop an extensive • Households within specific ranges
range of alternative services to serve of distance from frequent service
the general public.
• Average number of jobs and
households accessible within
30 minutes countywide (total
population, low-income
population, minority population)*
* See note on next page.
KING COUNT Y METRO STRATEGIC PL AN (2015 UPDATE) EXECUTIVE SUMMARY 6OBJECTIVES STRATEGIES MEASURES
• Average number of jobs and
households accessible within 30
minutes from regional growth
centers, manufacturing/industrial
centers, and transit activity centers*
• Vanpool boardings
• Transit mode share by market
• Student, reduced fare (youth,
seniors, people with disabilities) and
low-income fare permits and usage.
• Accessible bus stops
• Access registrants
• Access boardings/number of trips
provided by the Community Access
Transportation (CAT) program
• Requested Access trips compared to
those provided
• Access applicants who undertake
fixed-route travel training
* These two metrics measure the accessibility of the county using the transit system, or what can be accessed via transit within a given time from a given
location. Because buses run on schedules, trip times can vary greatly depending on the exact time the trip begins. For this reason, we compute the number
of jobs and households that a person can reach from particular locations at multiple different times, averaged throughout the day. For the countywide
measures, we conduct the same computations, but we choose multiple starting locations throughout the county. These results provide a picture of how
many jobs the average King County resident can access via transit within 30 minutes.
7 EXECUTIVE SUMMARY KING COUNT Y METRO STRATEGIC PL AN (2015 UPDATE)OBJECTIVES STRATEGIES MEASURES
Goal 3: Economic Growth and Built Environment. Encourage vibrant, economically
thriving and sustainable communities.
Support a strong, diverse, Encourage land uses, policies, and • All public transportation
sustainable economy. development that lead to communities ridership in King County (rail,
that have good access to transit and that bus, Paratransit, Rideshare)
Outcome:
transit can serve efficiently and effectively. • Transit rides per capita
Public transportation products
and services are available Partner with employers to make public • Ridership in population/
throughout King County and are transportation products and services more business centers
well-utilized in centers and areas affordable and convenient for employees. • Employees at CTR sites sharing
of concentrated economic activity. non-drive-alone transportation
Address the growing need Expand services to accommodate the modes during peak commute
for transportation services region’s growing population and serve hours
and facilities throughout the new transit markets. • Employer-sponsored passes
county. and usage
Coordinate and develop services and
Outcome: facilities with other providers, local • Park-and-ride capacity and
More people have access to and jurisdictions and the private sector to utilization (individually and
regularly use public transportation create an integrated and efficient regional systemwide); capacity and
products and services in King transportation system that takes innovative utilization of park-and-ride lots
County. approaches to improving mobility. with frequent service
• HOV lane passenger miles
Facilitate convenient and safe access to
transit by all modes. • Bike locker capacity and
utilization (including number of
Work in collaboration with transit partners, locations with bike lockers)
WSDOT, and other public and private
partners to address transit parking capacity
demand through a range of approaches
that use resources efficiently and enable
more people to access transit.
Support compact, healthy Encourage land uses, policies, and
communities. practices that promote transit-oriented
development and lead to communities
Outcome:
that have good access to transit and that
More people regularly use public
transit can serve efficiently and effectively.
transportation products and
services along corridors with Support bicycle and pedestrian access to
compact development. jobs, services, and the transit system.
Support economic Serve centers and other areas of
development by using concentrated activity, consistent with
existing transportation Transportation 2040.
infrastructure efficiently
and effectively.
Outcome:
Regional investments in major
highway capacity projects
and parking requirements are
complemented by high transit
service levels in congested
corridors and centers.
KING COUNT Y METRO STRATEGIC PL AN (2015 UPDATE) EXECUTIVE SUMMARY 8OBJECTIVES STRATEGIES MEASURES
Goal 4: Environmental Sustainability. Safeguard and enhance King County’s natural resources and
environment.
Help reduce greenhouse gas Increase the proportion of travel in • Average miles per gallon of the
emissions in the region. King County that is provided by public Metro bus fleet
transportation products and services. • Vehicle energy use (diesel, gasoline,
Outcome:
People drive single-occupant kWh) normalized by miles
vehicles less. • Vehicle fuel use (diesel, gasoline,
kWh) normalized by boardings
Minimize Metro’s Operate vehicles and adopt technology
environmental footprint. that has the least impact on the • Total facility energy use
environment and maximizes long-term • Energy use at Metro facilities: kWh
Outcome:
sustainability. and natural gas used in facilities,
Metro’s environmental footprint
normalized by area and temperature
is reduced (normalized against Incorporate sustainable design,
service growth). construction, operating and • Per capita vehicle miles traveled
maintenance practices. (VMT)
• Transit mode share
Goal 5: Service Excellence. Establish a culture of customer service and deliver services
that are responsive to community needs.
Improve satisfaction with Provide service that is easy to • Customer satisfaction
Metro’s products and understand and use. • Customer complaints per boarding
services and the way they
Emphasize customer service in transit • On-time performance by time of
are delivered.
operations and workforce training. day
Outcome: • Crowding
Improve transit speed and reliability.
People are more satisfied with
• Use of Metro web tools and alerts
Metro’s products and services.
Improve public awareness of Use available tools, new technologies,
Metro products and services. and new methods to improve
communication with customers.
Outcome:
People understand how to use Promote Metro’s products and services
Metro’s products and services to existing and potential customers.
and use them more often.
9 EXECUTIVE SUMMARY KING COUNT Y METRO STRATEGIC PL AN (2015 UPDATE)OBJECTIVES STRATEGIES MEASURES
Goal 6: Financial Stewardship. Exercise sound financial management and build
Metro’s long-term sustainability.
Emphasize planning and Manage the transit system through • Service hours operated
delivery of productive service guidelines and performance • Service hours and service hour
service. measures. change per route
Outcome: • Boardings per vehicle hour
Service productivity improves. • Boardings per revenue hour
Control costs. Continually explore and implement • Ridership and ridership change per
cost efficiencies including operational route
Outcome:
and administrative efficiencies. • Passenger miles per vehicle mile
Metro’s costs grow at or below
the rate of inflation. Provide and maintain capital assets to • Passenger miles per revenue mile
support efficient and effective service • Cost per hour
delivery. • Cost per vehicle mile
Develop and implement alternative • Cost per boarding
public transportation services and • Cost per passenger mile
delivery strategies.
• Cost per vanpool boarding
Provide alternative or “right-sized” • Cost per Access boarding
services in the context of overall
• Fare revenues
system financial health and the need to
reduce, maintain or expand the system. • Farebox recovery
• ORCA use
Seek to establish a Secure long-term stable funding.
• Asset condition assessment
sustainable funding structure
Establish fare structures and fare levels • For new or nontraditional
to support short- and long-
that are simple to understand, aligned alternative services, cost per
term public transportation
with other service providers, and meet boarding, ride, or user, as
needs.
revenue targets established by Metro’s appropriate
Outcome: fund management policies.
(Note: Different performance
Adequate funding to support
measures may be used to evaluate
King County’s short- and long- Establish fund management policies
different types of services.)
term public transportation needs. that ensure stability through a variety
of economic conditions.
KING COUNT Y METRO STRATEGIC PL AN (2015 UPDATE) EXECUTIVE SUMMARY 10OBJECTIVES STRATEGIES MEASURES
Goal 7: Public Engagement and Transparency. Promote robust public engagement that informs,
involves, and empowers people and communities.
Empower people to play Engage the public in the planning • Public participation rates
an active role in shaping process and improve customer • Customer satisfaction regarding
Metro’s products and outreach. Metro’s communications and
services. reporting
Outcome: • Social media indicators
The public plays a role and is • Conformance with King County
engaged in the development of policy on communications
public transportation. accessibility and translation to other
languages
Increase customer and public Communicate service change concepts,
access to understandable, the decision-making process, and
accurate and transparent public transportation information in
information. language that is accessible and easy to
understand.
Outcome:
Metro provides information Explore innovative ways to report to
that people use to access and and inform the public.
comment on the planning
process and reports.
Goal 8: Quality Workforce. Develop and empower Metro’s most valuable asset, its employees.
Attract and recruit quality Market Metro as an employer of choice • Demographics of Metro employees
employees. and cultivate a diverse and highly • Employee job satisfaction
skilled applicant pool.
Outcome: • Promotion rate
Metro is satisfied with the quality Promote equity, social justice and • Probationary pass rate
of its workforce. transparency in hiring and recruiting
activities.
Empower and retain Build leadership and promote
efficient, effective, and professional skills.
productive employees.
Recognize employees for outstanding
Outcome: performance, excellent customer
Metro employees are satisfied service, innovation and strategic
with their jobs and feel their thinking.
work contributes to an improved
Provide training opportunities that
quality of life in King County.
enable employees to reach their full
potential.
11 EXECUTIVE SUMMARY KING COUNT Y METRO STRATEGIC PL AN (2015 UPDATE)CHAPTER 1: INTRODUCTION
King County Metro Transit’s strategic plan is divided into three chapters:
Introduction, which provides background and context, summarizes the challenges
facing Metro, and describes the strategic planning process; Pathway to the Future,
which presents Metro’s goals, objectives and strategies; and Plan Performance
Monitoring, which describes how Metro will track progress.
SECTION 1.1
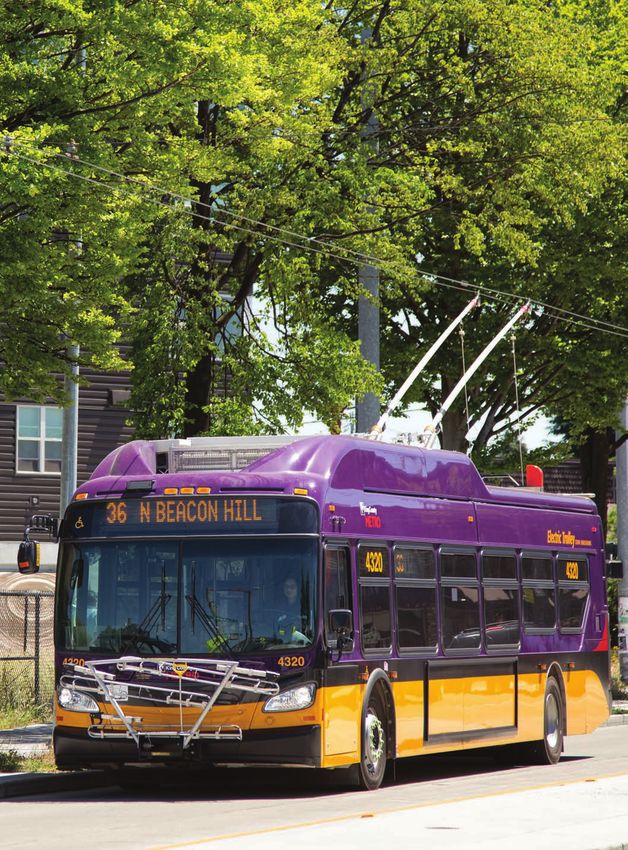
Metro products
Background and context and services
The importance of public transportation in the Puget Sound region Metro provides a wide
Public transportation is vitally important to the Puget Sound region. In 2014, people range of services: about
190 bus routes including
in the region took about 172 million trips on the fixed-route transit services offered
six RapidRide lines, Dial-
by King County Metro, Community Transit, Pierce Transit, and Sound Transit.
A-Ride Transit (DART),
and operation of the
Metro carried 70 percent of these trips, with 121 million boardings in 2014, or City of Seattle’s streetcar
about 400,000 passenger trips every weekday. Metro also provides an array of other system. These fixed-
products and services to meet a range of public transportation needs (see sidebar). route services delivered
121 million passenger
These services improve the quality of life in our region by providing mobility to those trips in 2014. Metro also
who need or choose to use them. Public transportation connects commuters to jobs. In operates Sound Transit’s
2014, 45 percent of work trips to downtown Seattle were made on transit. Students Link light rail and most
take the bus to schools and universities. People also use public transportation to reach ST Express buses in King
shopping, services, and recreation. Transit offers travel options to those who cannot County under contract.
drive, and provides assurance to drivers that other mobility options exist should they For people with
need them. disabilities who cannot
use Metro’s regular
Transit enhances the region’s economic vitality not only by getting people to their buses, Metro offers
jobs but also by freeing up roadway capacity, improving the movement of people Access service and
and goods. Metro’s service keeps more than 175,000 vehicles off our roads every supports the Community
weekday. Public transportation is an integral part of the regional growth strategy Access Transportation
in the Puget Sound Regional Council’s Vision 2040 and Transportation 2040 action program.
plans. These plans rely on the expansion of public transportation to support growth Metro’s commuter
by meeting the travel needs of a larger share of the region’s projected population. vanpool program
had 1,450 vehicles in
Public transportation also improves the region’s air quality by reducing the number operation in 2014.
of miles people drive. Energy-efficient transit vehicles contribute to the decrease in Metro also offers
transportation emissions. Metro service displaces approximately 600,000 metric tons a growing suite of
of carbon dioxide equivalent (MTCO2e) each year. alternative services, such
as ride-sharing programs
Metro is committed to working closely with other transit providers to continually enhance and community vans,
our region’s public transportation system and attract a growing number of riders. tailored to local needs.
In this plan, the terms
Metro’s mandate “public transportation”
The King County Department of Transportation’s Metro Transit Division performs or “Metro’s products and
the “metropolitan public transportation function” authorized in the Revised Code of services” encompass all
Washington 35.58. Metro is required to plan and operate transit services consistent of Metro’s offerings.
with county, regional, state and federal policies. As a County agency, Metro complies
KING COUNTY METRO STRATEGIC PLAN (2015 UPDATE) CHAPTER ONE: INTRODUCTION 12with County law and procedures; the Metropolitan King County Council approves
Metro’s fund management policies and Metro’s biennial budget.
Countywide planning and policies: King County Countywide Planning Policies
(CPPs) are established by King County and its cities and jurisdictions. These policies
are consistent with state law, state agency guidance, decisions of the Growth
Management Policy Council and the regional growth strategy outlined in Vision
2040. The CPPs provide a countywide vision and serve as a framework for each
jurisdiction to develop its own comprehensive plan, which must be consistent with
the overall vision for the future of King County. Metro’s Strategic Plan for Public
Transportation 2011-2021 is consistent with King County’s Countywide Planning
Policies, Comprehensive Plan, Strategic Climate Action Plan, Comprehensive Financial
Management Policies, and adopted mission, vision, guiding principles and goals.
Regional planning and policies: State law (RCW 47.80.020) designates the
four-county Puget Sound Regional Council (PSRC) as the Metropolitan Planning
Organization (MPO) and the Regional Transportation Planning Organization (RTPO)
for federal planning purposes. As the region’s MPO, PSRC develops a regional
plan and strategies to guide decisions about regional growth management and
environmental, economic and transportation issues. As the region’s RTPO, PSRC
develops long-range transportation and development plans across multiple
jurisdictions and allocates federal transportation funds for the region. Metro
participates in the PSRC planning process and strives to meet the goals of the
regional plans, Vision 2040 and Transportation 2040.
Washington state planning and policies: The 1990 Washington State Growth
Management Act (GMA) requires the state’s largest and fastest-growing counties
to conduct comprehensive land-use and transportation planning, to concentrate
new growth in compact “urban growth areas,” and to protect natural resources
and environmentally critical areas. King
FIGURE 1: Urban growth area, King County County’s urban growth area is shown in
Figure 1. The GMA requires King County to
consider population and employment growth
targets and land uses when determining the
future demand for travel and whether such
demand can be met by existing transportation
facilities. Metro contributes to King County’s
compliance with the GMA by focusing public
transportation services on urban growth
areas.
Federal planning and policies: Metro
complies with federal laws that require the
public transportation system to be equitable,
accessible, and just. Civil rights statutes,
0 1 2
including Title VI of the Civil Rights Act of 1964
(see sidebar, p.14), require that Metro provide
Miles
public transportation in a manner that does not
discriminate on the basis of race, color, national
King County Urban The information included on this map has been compiled
Growth Area
by King County Staff from a variety of sources and is
subject to change without notice. King County makes
no representations or warranties, express or implied, as
origin, disability, or age. The Americans with
to accuracy, completeness, timeliness, or rights to the use
of such information. King County shall not be liable for any Disabilities Act of 1990 requires that Metro
Rural King County general, special, indirect, incidental, or consequential
damages including, but not limited to, lost revenues or
lost profits resulting from the use or misuse of the
information contained on this map. Any sale of this map or
ensure equal opportunities and access for
Major Road information on this map is prohibited except by written
permission of King County.
13 CHAPTER ONE: INTRODUCTION KING COUNTY METRO STRATEGIC PLAN (2015 UPDATE)people with disabilities. A 1994 executive order requires that all federal agencies
include environmental justice in their missions. This means that Metro cannot
disproportionately impact minority or low-income populations and must ensure
full and fair participation by all potentially affected groups. Metro provides public
transportation that adheres to these and other federal requirements.
SECTION 1.2
Challenges and opportunities Title VI of the Civil
Rights Act of 1964
Metro based this strategic plan in part on an assessment of the current environment provides that “no person
and the opportunities and challenges we face both within and outside the in the United States
organization; these are described below. The goals, objectives and strategies shall, on the ground of
presented later in the plan address these challenges. race, color or national
origin be excluded
from participation in,
Regional growth, land use and the economy
be denied the benefits
King County is the most populous county in the state and the 13th most populous of, or be subjected to
county in the nation. It has a variety of geographic characteristics and diverse discrimination under
communities; land uses, densities and population vary greatly. any program or activity
receiving Federal
The most densely developed parts of the county, where most people live and financial assistance.”
work, have little room to expand existing transportation infrastructure. Building new The Americans
highways, roads, and other infrastructure would be costly, disruptive of existing with Disabilities
property uses, and technically challenging. Consequently, the regional growth plans Act of 1990 (ADA)
call for more intensive use of existing infrastructure by increasing both the number prohibits discrimination
of people using transit services and the proportion of overall regional trips made on and ensures equal
transit. opportunity for persons
with disabilities in
Riders population and economic growth: Since 2011, when this strategic
Regional employment, state
03 plan was 91.6
first produced, King County’s population has grown by 5.6 percent to an and local government
04 estimated94.2
2 million people in 2015. Practically every city in the county has seen services, public
05 population95.8growth, and several cities have annexed large areas that previously accommodations,
06 103.2 commercial facilities, and
were unincorporated. The number of jobs in the county has grown more than
transportation.
07 110.6
10 percent since 2011, to about 1.3 million jobs, reflecting the local economy’s
08 recovery118.8
from the Great Recession.
09 111.7
10 Transit ridership
109.6 tends to fluctuate with changes in population and jobs, as well as
11 fuel prices and other factors. As shown in Figure 2, Metro’s ridership grew steadily
112.8
12 between115.4
2003 and 2008, then dropped following the recession that began in 2008.
13 118.6 Rider growth resumed in 2011 as
14 FIGURE 2: Metro ridership 2003-2014
120.9 the economy began to recover and
Annual boardings (millions) population growth continued. Metro
delivered 121 million passenger trips
125 in 2014—a record high number.
100
In the broader Puget Sound region,
75 the population is expected to
surpass 4 million people in 2016
50 and then grow to nearly 5 million
25
people by 2040 (2.4 million in King
County). The region is expected
0 to support 3 million jobs by 2040.
03 04 05 06 07 08 09 10 11 12 13 14 More people and jobs (shown in
KING COUNTY METRO STRATEGIC PLAN (2015 UPDATE) CHAPTER ONE: INTRODUCTION 14Centers
Centers are at the heart of the Puget Sound Regional Council’s approach to growth management in Vision
2040. PSRC designates regional growth centers and manufacturing/industrial centers as places that will
receive a significant proportion of population and employment growth compared to the rest of the urban
area. Concentrating growth in centers allows cities to maximize the use of existing infrastructure, make more
efficient investments in infrastructure, and minimize the environmental impact of growth. Consequently, centers
receive priority in regional and local investments in the infrastructure and services that support growth.
Regional growth centers are focal points of more dense population and employment. Linking these centers
with a highly efficient transportation system allows the region to reduce the rate of growth in vehicle miles
traveled by expanding transportation choices.
Manufacturing/industrial centers are employment areas
with concentrated manufacturing and industrial land uses
that cannot be easily mixed with other activities. They
should continue to accommodate a significant amount
of regional employment, and good access to the region’s
transportation system will contribute to their success.
In addition to PSRC’s designated centers, Metro has
identified “transit activity centers” in King County.
These centers are served by and reflect the current transit network and are areas of the county that are
important for Metro to serve to connect communities throughout the county. They are typically associated
with higher levels of transit in their land-use context. Transit activity centers are further explained in the King
County Metro Service Guidelines.
Regional growth, manufacturing/industrial, and transit activity centers are collectively referred to as “centers”
in this strategic plan.
FIGURE 3: Regional growth, manufacturing/
industrial, and transit activity centers
is h
m
La ke
ma
Wa shingt on
Lake Sam
is h
m
La ke
ma
Wa shingt on
Lake Sam
Activity Center The information included on this map has been
compiled by King County Staff from a variety of
0 1 2
sources and is subject to change without notice. Miles
0 1 2
Regional Growth Center King County makes no representations or
warranties,
on this mapexpress
has been or implied, as to accuracy,
Activity Center The information included
compiled by King County Staff from a variety of
Miles
completeness, timeliness,or rights to the use of
sourcesincluded
and ison
subject tohas
change
without notice.
Activity Center The information this map been
Manufacturing
Regional Growth CenterCenter
compiledKing County
by King County
sources warranties,
makes
and is subjectexpress
to changeor for
such information. King County shall not be liable
no arepresentations
Staff from variety of
any
without general,
notice.
implied, as
or
special, indirect, incidental, or
to accuracy,
Regional Growth CenterKing County makes no representations or
completeness, timeliness, or rights to thedamages
consequential
warranties, express or implied, as to accuracy,
use of including, but not limited
Manufacturing Center such information.
completeness, King to
timeliness, or rights County
the useshall
of not be liable
to, lost revenues or lost profits resulting from the
Rural King Center County for any general, special,
shall notindirect,
be liable incidental, or
Manufacturing such information.
for any general,
King County
consequential damagesuse or misuse of the information contained on this
special, indirect, including,
incidental, or but not limited
consequential damages
to, lost revenuesincluding,
or lostbutprofits
not limited
map. Any sale of this map or information on this
resulting from the
Rural KingCounty
Rural King County to, lost revenues or lost profits resulting from the
use or misuse of the information contained on this
map is prohibited except by written permission
Major Road
use or misuse of the information contained on this
map. Any sale of this map or
map. Any sale of this map or information on this information on this
map is prohibited of King County.
except by written permission
Major Road
Major Road map is prohibited except by written
of King County.
of King County.
permission
CF: GL2015_ActCen
CF: GL2015_ActCen
July 29, 2015
July 29, 2015
15 CHAPTER ONE: INTRODUCTION KING COUNTY METRO STRATEGIC PLAN (2015 UPDATE)Figure 4) mean that Metro has an opportunity to serve a growing number of riders
and major employment centers. Metro’s annual service is expected to grow by 2.3
million annual service hours, from about 3.5 million hours in 2015 to 5.8 million
hours by 2040—an amount that is beyond Metro’s capacity to provide with current
funding.
This growth will be focused in King County’s centers (see sidebar, p. 15). The
centers referred to in Metro’s strategic plan are shown in Figure 3.
Demographic changes FIGURE 4: Puget Sound region
projected population and
King County’s population is aging; people 65 and older now Puget Sound Region Projected Population and
employment growth
Employment Growth, 2000-2040
comprise more than 12 percent of the people who live here. Over 2000-2040
the next 20 years, this age group will grow to about 18 percent of 5,000
the population. An aging population may rely more on public 4,000
transportation.
Thousands
3,000
At the other end of the age scale, younger people are 2,000
increasingly choosing transit. The share of driving trips in the 1,000
Puget Sound region declined from 86 percent in 1999 to 82 0
percent in 2014, while the share of transit and nonmotorized ‘00 ’06 ‘08 ’10 ‘20 ’30 ‘40
trips increased. Between 2006 and 2014, the shift away from Population Employment
automobiles was most pronounced for 18-24 year olds, closely
followed by 25-35 year olds.1
People with low incomes often rely heavily on transit, and while many King
County residents are prospering, the percentage of people living in poverty or
near-poverty has been growing. In 2013, about 12 percent or 240,000 people
living in our county had incomes below the federal poverty level. Nearly 500,000
residents—a quarter of the county’s total population—had incomes less than twice
the federal poverty level (currently about $23,000 annually for a single person, or
about $48,000 for a family of four). A growing number of people in poverty live in
suburban areas. According to King County’s 2014 Equity and Social Justice Annual
Report, more than three in five county residents who are poor live outside of
Seattle.
King County is also becoming more diverse. Immigrants from Asia, Latin America,
Eastern Europe, and Africa, as well as native-born African Americans and Latinos, Metro’s innovative
are making up a large part of our population growth. Overall, compared to ORCA LIFT program
White and Asian residents, Black and Latino residents have less education, offers a reduced fare
higher unemployment, and lower incomes. Immigrants may have limited English to people whose
proficiency. All of these conditions make public transportation critically important for income is below 200
enabling people to reach the jobs, education and services that can help reverse our percent of the federal
society’s inequities. poverty level.
Metro plays an essential role in providing mobility to people who, for a variety of
reasons, have limited transportation options or are increasingly choosing transit. We
continue striving to find innovative solutions, such as the introduction of the ORCA
LIFT reduced fare for people with low incomes and the expansion of the Alternative
Services Program.
1
PSRC 2014 Regional Travel Survey, www.prsc.org/data/transportation/travel-surveys/2014-household
KING COUNTY METRO STRATEGIC PLAN (2015 UPDATE) CHAPTER ONE: INTRODUCTION 16Customer service and satisfaction
Maintaining and improving customer satisfaction with Metro services is an ongoing
process. Every experience a customer has on a Metro bus, at a Metro facility, or with
Metro employees and information services affects perceptions about the quality of
public transportation. Metro strives to make every customer’s public transportation
experience positive at every stage of a trip.
Metro continually gathers feedback about how well our services are meeting
customer needs and expectations. We track customer correspondence and
interactions and conduct an annual telephone survey of riders—including nonriders
every two years.
Figure 5 illustrates the issues that have the most impact on customer satisfaction.2
FIGURE 5: What’s important to Metro riders RANK IN
ORDER OF
LEVEL OF SERVICE IMPORTANCE
Level of service 1
Personal safety 2
Comfort and cleanliness at stops 3
Comfort and cleanliness on board 4
Information sources 5
Metro drivers 6
Transferring 7
Another key to customer satisfaction is public involvement. Whenever we plan major
changes to service, we conduct robust public engagement processes and use what
we learn to shape our plans. Service change proposals are also guided by objective
data and guidelines that help make the decision-making process transparent.
Funding
Approximately 55 to 60 percent of Metro’s funding comes from local sales tax.
This source has grown increasingly important since 2000, when the Washington
legislature eliminated the motor vehicle excise tax for transit, which had provided
nearly one-third of Metro’s revenue.
About 20 percent of Metro’s revenue comes from fares. Other sources include federal and
state grants—which can fluctuate significantly—and contributions from service partners,
vanpool operations, investment income, and a small portion of county property tax.
Metro’s heavy reliance on sales tax makes it challenging to provide sustainable bus
service because revenue from this source is dependent on economic conditions.
Since 2000, two economic downturns forced Metro to scale back planned service
2
King County Metro Transit 2014 Rider Survey
17 CHAPTER ONE: INTRODUCTION KING COUNTY METRO STRATEGIC PLAN (2015 UPDATE)expansions. In the six years following the 2008 recession, Metro took numerous
actions to cut costs, increase revenue and preserve most service. Although service
reductions were necessary in September 2014, improved economic conditions
enabled the County Council to adopt a 2015-2016 budget that maintained service.
In 2015, following Seattle voters’ approval of a transit funding ballot measure, the
City of Seattle entered into a Community Mobility Contract with Metro to purchase
approximately 270,000 additional hours of bus service annually, about 8 percent of
the Metro system, through 2020. Other economic improvements enabled Metro to
invest in additional service in suburban areas around the county.
These developments enable Metro to sustain and enhance service during the
2015-2016 biennium and for some years beyond. However, funding from the City
of Seattle will expire unless extended by Seattle voters in 2020, future economic
downturns will again cause sales tax revenues to drop, and even today demand for
transit service exceeds Metro’s funding capacity. For these reasons Metro and other
transit agencies continue to need long-term, sustainable and sufficient funding to
deliver the public transportation services our region expects.
of customers
The environment
Metro surveyed
Metro strives to provide solutions to urgent environmental challenges: reduce
greenhouse gas emissions, minimize energy consumption, shrink Metro’s said they
environmental footprint and improve the sustainability of transit operations. are satisfied
with our service
King County’s 2015 Strategic Climate Action Plan makes a strong commitment
to taking action to prevent and respond to the impacts of climate change. It
establishes the targets in the Countywide Planning Polices that were adopted by
the King County Growth Management Planning Council in 2014. These targets
are: reduce countywide sources of greenhouse emissions by 25 percent by 2020,
50 percent by 2030, and 80 percent by 2050; and reduce emissions from County
operations by at least 15 percent by 2015, 25 percent by 2020, and 50 percent by Source: 2014 Rider Survey
2030. (Targets are compared to a 2007 baseline.)
Transportation is the largest source of greenhouse gas emissions in King County,
and our community must make major changes in how we live and travel if we
are to significantly reduce emissions. Metro will play a leading role by providing
transportation options that encourage transit ridership and help reduce the number
of vehicle miles traveled. Fast, frequent RapidRide service and innovations like the
Real-Time Rideshare app exemplify the strategies Metro will continue to pursue.
Metro can also support the development of compact, pedestrian-friendly
communities that are easily served by transit by working closely with King County
cities to coordinate development and transit plans.
The acquisition of hybrid buses and electric trolleys, and efforts to make Metro
facilities more energy-efficient, advance King County’s goal of reducing energy
consumption. Metro is also testing zero-emission, battery-electric buses to
determine how they will be used in Metro’s fleet in the future.
Metro has developed a Sustainability Plan that calls for ongoing efforts to reduce
energy use, greenhouse gas emissions, water use and waste and to increase transit
ridership.
KING COUNTY METRO STRATEGIC PLAN (2015 UPDATE) CHAPTER ONE: INTRODUCTION 18Access to transit
If people are going to use the public transportation system, they must be able to
reach transit service and then get from transit service to their final destinations.
People’s access depends on factors such as their proximity to bus stops or train
stations, the quality of walking and biking pathways they can use to reach those
places, the availability of parking spaces at park-and-rides, and the type and amount
of transit service provided at the access point.
Metro will work with jurisdictions, public and private partners, transit agencies
and the PSRC to identify where improvements are needed and actions that can be
taken to address them. Partnerships among Metro, other transit agencies and local
jurisdictions will be essential to improving transit access.
Evolving transportation system
The Puget Sound region’s transportation system is constantly changing and adapting
to the mobility needs of its residents, presenting numerous opportunities and
challenges for Metro.
Metro has long worked closely with other agencies to plan and provide efficient,
integrated travel options that enhance public transportation in King County. Metro
works particularly closely with Sound Transit to realize efficiencies, achieve savings,
and deliver better transit service for the people of our region. We also partner with
Pierce Transit, Community Transit, Kitsap Transit, Everett Transit, Washington State
Ferries and the King County Water Taxi as well as the Washington State Department
of Transportation, PSRC, local and regional jurisdictions, and businesses such as
Microsoft that provide direct transit service to their employees. The focus is on
customers—offering them information about various agencies’ services in one place,
coordinating schedules for convenient transfers between agencies and modes,
making fare payment simple, and collaborating in other ways to create a seamless,
easy-to-use transportation network. This form of integration is critical because so
many people cross county lines as part of their work commutes.
Metro collaborates on some of the region’s most important transportation projects
to ensure that public transportation continues to play a vital role in the region’s
broader transportation system. These projects include:
§§ Sound Transit’s Link light rail: Sound Transit extended Central Link light rail to
Seattle’s Capitol Hill and the University of Washington in 2016 and has funding
to extend Link north to Lynnwood, east to Redmond/Overlake and south to Kent/
Des Moines by 2023. The agency is developing plans to further expand. To
optimize the public’s investments in fast, high-capacity transit services, Metro will
continue to work with Sound Transit and local jurisdictions to revise bus networks
and supporting infrastructure in coordination with Link extensions. The goal is to
improve the public transportation system’s efficiency, effectiveness and ease of use.
§§ Major highway projects: Public transportation is an essential part of major
transportation projects in the Puget Sound region. Metro provides public
transportation service to mitigate the impacts of major projects—and is also
affected by changes to the transportation infrastructure in the region. With
financial support from partners, public transportation will continue to play a major
role in the Alaskan Way Viaduct and Seawall Replacement Project, the SR-520
Bridge Replacement Project, and other transportation infrastructure projects.
19 CHAPTER ONE: INTRODUCTION KING COUNTY METRO STRATEGIC PLAN (2015 UPDATE)You can also read