FROM PLANS TO ACTION - STATE OF TRANSIT 2018 - Ride New Orleans
←
→
Page content transcription
If your browser does not render page correctly, please read the page content below
FROM PLANS TO ACTION

         STATE OF TRANSIT 2018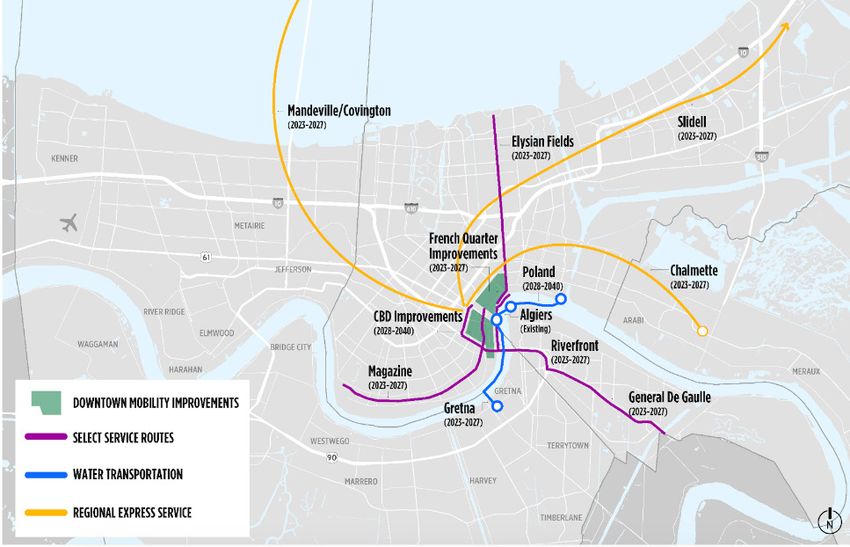
About our Organization                                          Thank you to our 2018
                                                               State of Transit sponsors
Ride New Orleans is an independent nonprofit                                 GOLD LEVEL
501(c)3 organization. We envision a region in
which taking transit enables full access to jobs,
education, health care, and other needs that ensure
the equitable, thriving community that all residents
deserve. Our mission is to win world-class and
equitable public transportation that works for all
residents across the New Orleans region.

Visit rideneworleans.org for more information.

Board of Directors
Jennifer Terry – President
Adrian Guy Anderson - Treasurer
Lacy McManus - Secretary
Jacquelyn Dadakis – Past President                                           SILVER LEVEL
Marcelle Beaulieu
Buddy Boe
Walt Leger III
Fred Neal, Jr.
Nina P. Red
Jeff Schwartz

Ride New Orleans staff
Alex Posorske – Executive Director
Matthew Hendrickson – Policy Director
Lawrence Mason III – Engagement Coordinator
                                                                            BRONZE LEVEL
State of Transit in New Orleans report                 HNTB • Greater New Orleans Hotel & Lodging Association
contributors                                                   • Huber, Slack, Thomas & Marcelle, LLP
                                                          • LCMC Health • Lime-S • Villavaso & Associates
Kevin Harrison – Data collection & analysis
Ann Wanserski – Layout & design
                                                              A special thanks to our 2018
                                                                 organizational funders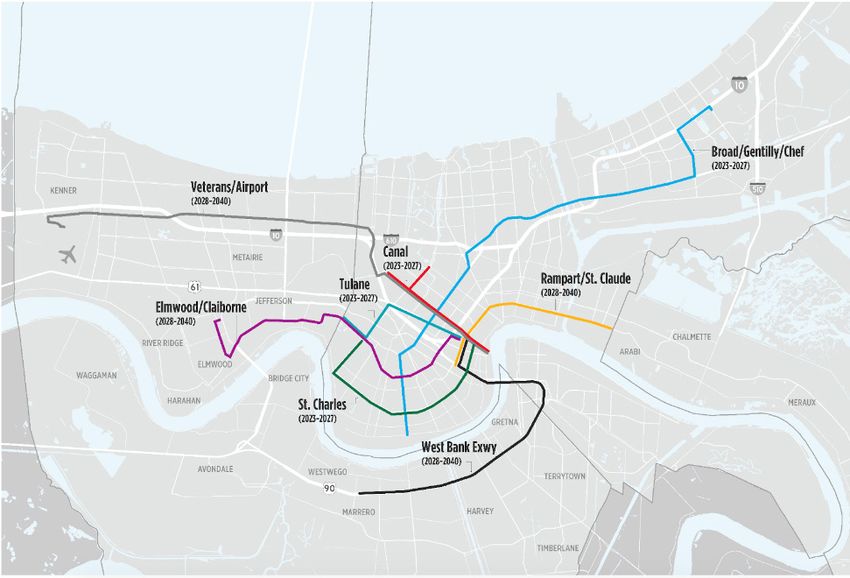
From the
When Ride New Orleans was founded in 2009 as an all-volunteer watchdog
organization, our founding board members were outside of most New
Orleans decision making circles.

It didn’t matter because we knew that the work was very necessary. After
a heroic effort from many to get the transit system up and running again

                                                                                Board of
after the devastation of Hurricane Katrina, New Orleans transit recovery had
stalled and decisions about future investments weren’t taking into account
what people who rely on transit needed.

There was a need for a group to speak openly and honestly on transit
issues and Ride New Orleans filled that need – even if not many people

                                                                                Ride
were listening at the time.

Nine years later, things look different.

In 2018, in addition to an enhanced RIDE – with three paid staff members
and an increasing reputation in the region – we’re excited to have a

                                                                                New
new and reform-minded mayor who is prioritizing equitable transit
improvements.

In the first 100 days of Mayor LaToya Cantrell’s administration we’ve already
seen many encouraging moves. But the biggest so far from the RIDE

                                                                                Orleans
perspective is the Mayor’s June appointment of our then-Board President
Fred Neal, Jr. to the New Orleans Regional Transit Authority Board.

Fred’s appointment is a seminal moment for transit riders. Too often, the
RTA board has missed the voice of current transit riders who understand
the problems with the system in more than an abstract way. As a regular
rider and experienced transit advocate, Fred will be able to give voice to
that transit rider perspective.

Fred’s appointment is also a seminal moment for RIDE. While Fred
has stepped down as RIDE President, he remains on our board. His
appointment signals a new era for transit decision making in our region
– one where advocates and transit riders now have a direct voice in the
decision-making process.

While we’re encouraged by these developments, we do not intend to
change our approach. As you’ll read in the pages to come, many basic
realities about transit service unfortunately remain the same – despite some
encouraging advances on planning and governance issues over the last
year. Riders still need and deserve better and we will continue to push for
the changes and improvements that riders throughout the region must see.

Fortunately, we’re moving into what looks like a promising period for New
Orleans transit. The momentum is there, but the victory still has not been
won. We look forward to continuing to work closely with you and many
others to truly bring equitable and world-class transit to the New Orleans
region.

Sincerely,

Jennifer Terry
President, Ride New Orleans Board of Directors
Executive   MOVING FROM PLANS TO ACTION
            In recent years, Ride New Orleans’ criticism of the New
            Orleans Regional Transit Authority (RTA) has centered around

Summary
            two deficiencies – poor long-term planning and priorities and
            insufficient public control and oversight.

            Most of the specific problems plaguing our transit system
            like the lack of bus stop shelters, unnecessary streetcar
            investments, long waits between buses, nonexistent regional
            connections, and other items – stem from these issues.

            Therefore, we’re excited to think that the last seven months may
            have been a clear turning point for New Orleans-region transit.
            In that time, we’ve seen two major shifts that could be game-
            changing:

             1. A 14-month long planning process culminated in the
                passage of the first post-Katrina long-term strategic plan
                for the New Orleans Regional Transit Authority (RTA) – the
                Strategic Mobility Plan (SMP), in December 2017. With 129
                specific implementable action items, the SMP creates a
                real road map to tangible improvements.

             2. The appointment of three new RTA board members by a
                reform-minded new mayor and the hiring of a new interim
                RTA Executive Director offer an opportunity to improve
                transparency and oversight of Transdev - the company that
                currently manages transit service for the RTA - immediately,
                and to lead a comprehensive effort to ensure a competitive
                bidding process as the current contract winds down over
                the next year.

            Although these changes are exciting, we must remember that
            they do not guarantee success.

            Despite progress on big-picture planning and governance,
            the daily commute has not improved for most transit riders.
            We remain a region with highly unequitable access to
            economic opportunity where the ability to take advantage of
            a job opportunity too often depends on whether or not you
            can afford a car.

            That’s because the average New Orleanian with a car can reach
            89 percent of the region’s jobs in 30 minutes or less while a
            transit dependent New Orleanian can reach only 12 percent of
            the region’s jobs in that same 30-minute time period.

            This is a steep and unacceptable disparity in a city with a high
            poverty rate – which especially affects communities of color
            – and a rate of carless households nearly twice the national
            average. Even worse, these numbers are not moving in the
            right direction. Since 2016, when RIDE started using the access
            to jobs analysis metrics, we’ve seen only a paltry 0.2 percent
            increase in job access for the average New Orleanian – basically
            statistical noise.
Meanwhile, certain RTA spending priorities remain troublesome.       Figure 1: Average percent of jobs accessible, by mode
In 2018, the RTA could spend up to $624,000 studying a short
streetcar extension that is not included in the SMP and would
not increase access to jobs. This is highly problematic and
should worry transit riders and government reform advocates
alike.

The RTA, the City of New Orleans, and the region are in a great
position to achieve tangible results in the next few years. But we
need to remember that advances on planning and governance
are important not as an end in themselves but because they
make it easier to achieve those tangible results.

To take those next steps we must focus on several
important items over the next year:

  •   We must prioritize implementation of the SMP. We
      especially need to complete a Comprehensive Operating
                                                                     Source: U.S. Census Bureau. 2018. LODES Data.
      Analysis (COA). If done right, the COA will make               Longitudinal-Employer Household Dynamics Program. http://
      community-supported recommendations to reimagine               lehd.ces.census.gov/data/lodes/; Ride New Orleans analysis
      and redesign some or all of our transit network. In other
      communities nationwide, this has significantly increased
      access to frequent, reliable transit service without busting
      the budget.

  •   We must redesign key portions of roads and intersections
      to move transit vehicles more efficiently and quickly.
      Implementation of dedicated transit lanes, traffic signal
      priority, and queue jumps for buses through busy
      intersections will require working collaboratively across
      agencies and departments.

  •   We must acknowledge that sustainable progress on
      transit will be almost impossible without better regional
      cooperation – especially between Jefferson and Orleans
      parishes. We must leverage the strong commitment to
      regional transit from New Orleans Mayor LaToya Cantrell
      as well as Jefferson Transit’s (JeT) in-progress strategic
      planning process to agree on implementable, near-term
      regional transit priorities.

  •   Finally, we must start a real regional conversation about
      how to increase revenue to pay for critical improvements
      to our transit service. The simple truth is that we will not
      be able to implement changes needed to accomplish our
      goals for transit in New Orleans over the next decade
      without selling the public and stakeholders on increased
      revenue for transit. We must start that conversation in the
      next year as we evaluate what parts of the SMP should
      be implemented first and the COA tells us what shape our
      transit network should take over the next five years.

                                                                              Ride New Orleans   The State of Transit 2018   Page 4
Recent
                                                The New Orleans region made major progress toward future transit
                                                success over the last year. Notable achievements include:

                                                 •    The passage of a long-term strategic plan for the New Orleans
                                                      Regional Transit Authority (RTA) and start of a similar planning
                                                      process for Jefferson Transit (JeT)

Progress
                                                 •    A strong push for more accountability and public control of the
                                                      RTA in the first months of Mayor LaToya Cantrell’s administration
                                                 •    The long-awaited introduction of “real” real-time transit vehicle
                                                      arrival data for the public

                                                These actions set the stage for future growth and improved transit
                                                service. Building upon this progress over the next year will be the key
                                                challenge for RTA, New Orleans, and the region.

                                                STRATEGIC MOBILITY PLAN PASSED
                                                The RTA board passed the Strategic Mobility Plan (SMP) in December
                                                2017 after a planning process that involved more than a year of
RTA Strategic Mobility Plan                     community outreach and data analysis. The SMP is now the guiding
                                                document to improve transit over the next 20 years with six overall
Mission                                         goals, specific objectives and strategies, and 129 implementable action
                                                items.
Provide safe and dependable mobility
services.                                       Previously, there was no clear publicly-approved plan guiding the
                                                agency, which led to some questionable decisions. Embarrassingly, the
Vision                                          closest thing to a guiding document might have been an RTA wish list
Become the preferred mobility provider in       established in 2014 that envisioned an impractical $900 million/33.5
the region.                                     miles streetcar expansion with no context or funding plan.1

Goals                                           To address this, RIDE pushed the agency to develop a strategic plan
                                                to identify goals, track progress, and better communicate the rationale
•   Earn Trust. Be transparent in decision-     for RTA’s investment decision making to the public. After several years,
    making.                                     the RTA responded with a strong document that – if followed and
                                                implemented – will make a big difference for the riding public.
•   Be Equitable. Provide mobility service in
    a just and fair manner.
                                                Most important are new benchmarks that define success. These
•   Prioritize the Rider Experience. Provide    benchmarks are critical because they can guide how we prioritize
    mobility services that are safe, easy to    capital investments. Simply put, if a capital investment doesn’t move
    use, and comfortable.                       the needle on a key benchmark, we should not invest in it.
•   Be Reliable. Provide on-time and
    predictable service.                        The two most important benchmarks are:
•   Connect to Opportunities. Provide            1.   Increasing the percentage of jobs in the region reachable by
    good access to destinations utilizing all         transit in 60 minutes by the average household within the RTA’s
    transportation options available.                 service area to 60 percent by 2027. Current RIDE analysis
                                                      estimates that during the peak time, the average New Orleans
•   Support a Sustainable, Healthy Region.
    Mitigate climate change and improve               resident can reach 42 percent of the region’s jobs in 60 minutes,
    public health.                                    so this would be a big step forward.
                                                      The plan calls for even better access for the average lower
                                                      income households – 65 percent by 2027.
                                                 2.   Increasing on time performance for transit vehicles to 80 percent
                                                      by 2020 and 85 percent by 2022. Currently, the reliability rate –
                                                      defined as being no more than one minute early or five minutes
                                                      late - is 75 percent, so this would be an important step as well.
Figure 2: High-capacity transit corridors identified in Strategic Mobility Plan

Figure 3: Other major transit corridors and areas

Source: Regional Transit Authority “Strategic Mobility Plan: Mobility Options and Corridors”

                                                                                               Ride New Orleans   The State of Transit 2018   Page 6
After the benchmarks, RIDE is most pleased by the “Connect to
                                                          Opportunities” goal. If followed closely, this goal will be the foundation
    Comprehensive Operations Analysis (COA)               for key transit investments to increase frequency and connectivity.

    Improving transit in a climate of limited resources   Important highlights include:
    requires a thorough understanding of the current
    system’s strengths, weaknesses, constraints,           •   Eight identified high capacity corridors (10-15 minutes or less
    and opportunities and a willingness to be bold             20-24 hours a day) and four Select routes (15-20 min a day, 18-24
    and use that analysis to propose changes to the            hours a day)
    transit network in order to better get riders where        Critically, regional routes are identified in these high capacity
    they need to go.                                           corridors in order to connect to major job centers across parish
                                                               lines. This is vital to riders to get them where they need to go and
    Over the next year, we have a good opportunity             essential to the region’s economic development.
    to accomplish both of these tasks via a soon-to-
    start process called a Comprehensive Operations        •   A scheduled Comprehensive Operations Analysis (COA) and
    Analysis (COA) that will look at both the RTA and          network redesign to structure routes more efficiently to achieve
    Jefferson Transit systems.                                 the benchmarks.

                                                          Other important highlights in the plan include:
    In general, a COA consists of a detailed
    analysis of each transit line, data analysis           •   A strong focus on reliability and the rider experience:
    for existing and future demand, transit rider
    surveys to better understand origin and                    ◦◦   90 percent of transit stops with 15 or more boardings a day
    destinations, and rider and stakeholder                         to have benches or shelters by 2027
    outreach. This information is then used                    ◦◦   Provide for more easy payment options and implement real-
    to develop immediate and medium-term                            time tracking
    recommendations to improve service within
    given financial constraints. More importantly,             ◦◦   Build transit centers in the CBD, NO East, Algiers, and
    a transit agency can use the process to                         smaller mobility hubs around city
    reimagine the transit network as a whole and
                                                               ◦◦   Improve communication about delays – both online and
    propose a full or partial network redesign                      physically at the stops
    to better accomplish important goals like
    reducing travel time to important destinations             ◦◦   Implement transit priority treatments to get transit vehicles
    for more riders.                                                through traffic delays

                                                               ◦◦   Install ticket vending machines at 25 high traffic stops and
    The New Orleans Regional Planning Commission
                                                                    pilot off-board vending along an entire route.
    (RPC) – charged with leading regional planning
    efforts - will lead the COA process.                   •   A strong focus on transparency and trust (recognizing that the RTA
                                                               needs to earn back trust is an important step on its own):
    Advocates and stakeholders should be aware
    though that just because the process is taking             ◦◦   Provide regular updates and a dashboard for SMP metrics to
                                                                    deliver transparency and a way to track progress
    place, tangible changes are not guaranteed.
    A 2012 regional COA made numerous                          ◦◦   Increase public participation in the budget process.
    recommendations for network and service
    adjustments in both New Orleans and Jefferson         The ultimate assessment of this plan will turn on whether key items are
    Parish. However, most of those went immediately       actually implemented, as we discuss in this report’s final section. But
    to a shelf and were never implemented.                the huge step of having a detailed plan is worth celebrating.

                                                          JET STRATEGIC PLAN
    The RPC, RTA, and JeT must be bold in their
    recommendations and work closely with the
    public to be build support for needed change
    and avoid a similar end result this time. The RTA’s   Jefferson Transit (JeT) recently began a strategic planning process
    SMP and JeT strategic planning process give us        to improve bus service. The process will take a year and will develop
    significant momentum to leverage – it would be a      several alternative service scenarios to provide improved access to
    shame to fall back on the status quo again.           jobs, more reliable service, and determine best uses in conjunction
                                                          with current and future land use. There will be a scenario based on the
                                                          status quo, a scenario based on a network redesign, and a scenario
                                                          that assumes additional funding to expand service.

Page 7   The State of Transit 2018   Ride New Orleans
As JeT has fewer resources than the RTA, the most important improve project coordination between the City and the RTA, a
component will be determining where and how regional transit long-time weak spot.
can work. With that approach, an economy of scale can be
maximized to the benefit of riders in Jefferson Parish and the Mark Raymond, Jr. is the
entire region. Executive Director of the
Split Second Foundation –
JeT’s strategic planning process should build off the momentum an organization focused on
of the RTA’s Strategic Mobility Plan – especially the focus on improving treatment of spinal
expanded regional transit – as well as the upcoming regionally cord injuries. Raymond has
focused COA. This could be a very important year for regional limited personal mobility
transit and this process should be watched with interest. after an accident several
years ago and is a regular
user of the RTA’s on demand
NEW MAYOR MAKES PROGRESS paratransit service. He has
already proclaimed a strong
interest in improving paratransit
New Mayor LaToya Cantrell made two important moves in the service and pushing for overall
first 100 days of her administration that could pay big dividends improvements to the system.
down the road. She moved quickly to appoint three new RTA
board members and created a new Office of Transportation
that could streamline decision making and speed up transit Office of Transportation
improvements. She also released an ambitious transition plan
that – if followed – will put regional transit on a firm foundation A potentially groundbreaking move is Mayor Cantrell’s decision
over the next four years. to create the City’s first Office of Transportation. We hope the
office will lead coordination on transportation projects in the city
New RTA board has great potential by reducing department silos to improve communication and
operations on transportation projects.
The most direct way the Mayor can affect transit policy is through
appointments to the RTA Board of Commissioners. Mayor An empowered Office of Transportation could be a major force
Cantrell has moved quickly on that front, appointing three new for improving transit service and accessibility in New Orleans. A
board members (of the five controlled by Orleans Parish). common challenge is the fact that separate entities often control
important parts of the transportation system. For example,
Fred Neal, Jr. Ride New implementing a transit-only lane or giving transit vehicles priority
Orleans’ immediate past board
at a traffic signal is a proven method to reduce transit travel
president and co-founder,
is an especially important time and thus increase frequency. But one decision – where
appointment for transit riders. such an idea would make the most sense – is controlled by
Not only is he an advocate, but the RTA, while another decision – how, if, and when it can
he takes transit regularly and be implemented - is controlled by the City’s Department of
has served on the RTA Riders’ Public Works (DPW). With each agency already focused on
Advisory Committee for the last multiple issues, the coordination necessary to implement transit
three years – all of which will improvements too often falls by the wayside.
provide valuable perspective to
a board that too often does not Ideally, the Office of Transportation will be empowered by the
include transit riders. Fred also
Mayor to forge solutions for improved and more equitable
has professional expertise as an
urban planner and understands mobility and will help cut red tape and navigate agency/
the everyday issues that impact riders as well as the systemic department specific politics and policies. With the Mayor’s
changes needed for the long-term success of the organization. choice to head the office – Laura Bryan – also now on the
RTA board, a lot of additional synergy is possible as well.
Laura Bryan is a long-time
staffer to Mayor Cantrell and
was recently tapped to serve
as director of the City’s newly
minted Office of Transportation
(see below). This connection to
the administration will provide
the Mayor’s Office with more
direct impact on transit policy,
which looks very positive based
on the priorities laid out in the
mayoral transition plan. It also
has potential to significantly
Ride New Orleans The State of Transit 2018 Page 8Strong transition plan
Mayor Cantrell’s “Forward Together New Orleans” transition plan has a strong focus on transportation with several recommendations
that – if implemented – will significantly improve the landscape for transit and equitable mobility. Ride New Orleans – as well
as government, business, and other nonprofit stakeholders – served on the committee where many of these recommendations
originated.
In addition to sections on board members and the Office of Transportation that have already been implemented, key recommendations
include:
• Implement the SMP. The report suggest a focus on easily implemented action items that can be accomplished in the short-
term. The suggestions range from bus stop improvements that can greatly improve the daily experience of using transit without
requiring large amounts of time or money to front-loading the COA – with a special focus on providing equitable transit to
underserved areas like New Orleans East and Algiers.
• Take the first steps toward establishing a truly regional transit system. The report sets a goal that by the end of the current
mayoral term, we should advance planning and engineering studies for the four regional routes named in the RTA SMP and
implement at least one regional pilot route. To accomplish that, the RTA must create a better working relationship with JeT and
other stakeholders that can become the foundation of a future partnership.
• Increase public control. The report underscores that while the current system of delegated-management contracting may
have had some benefits in bringing back service in the unprecedented post-Katrina situation, future progress requires increased
public control of the system, especially with an effective executive management team that reports only to the RTA board. The
hiring of an interim RTA Executive Director in June was a big step forward, as detailed in the following section.
INCREASED PUBLIC CONTROL
The RTA currently employs a unique delegated-management contracting model where all aspects of agency operations – planning,
management, finances, and operations – are contracted out to a private operator, Transdev. Until June, there was only one full-time RTA
employee – the board secretary. All other RTA staffers are actually Transdev employees.
Transit contracting is not inherently bad. Many transit agencies contract services, but no other US transit agency delegates all aspects of
operations and planning to a private firm. Without a full-time, executive management team to oversee Transdev, an all-volunteer board
of lay people has been overmatched in the task of overseeing an international company that generates billions in revenue annually from
operating transit. This situation has allowed a company with a profit motivation to set the priorities and standards of our local service.
We celebrated the hiring of a new RTA Executive Director, Greg Cook, last year in the hope that his hiring was the start of a solution to
this problem. But soon after last year’s SOTS report was released, Cook left the RTA, after – by all accounts – losing the confidence of
the RTA board. Unfortunately, the Board did not immediately replace him, resulting in a vacuum of leadership during the conclusion of the
SMP process and the mayoral transition.
However, in May, the RTA board finally addressed this by hiring Interim Executive Director, Jared Munster. Munster, the City’s former
Director of the Department of Safety and Permits, served as the City’s liaison to RTA starting in December 2017. He has developed a firm
understanding of issues and processes at RTA. In coordination with the board, he has already improved access to board documents and
outlined a more formal annual budget creation process.But Munster’s most important role will be leading the procurement Figure 4: Screenshot of RTA GoMobile 2.0 App
process for the next operations contract. Transdev’s contract expires
at the end of August 2019. Moving forward, the next contract must
include:
• Clear incentives to encourage the transit operator to improve on
the performance metrics that matter to New Orleanians like bus
frequency, on-time performance, and SMP implementation.
• An increased role for additional RTA staff, regardless of which firm
wins the contract.
RTA can achieve these goals only via an open and competitive bidding
process – and the RTA Executive Director can ensure this happens.
In this regard, Munster is off to a good start. In July 2018, the
RTA launched a website (www.drivertaforward.com) to serve as a
clearinghouse for information on the process. The site announced three
open houses in August for interested firms to study RTA operations and
infrastructure. A formal RFP for the contract is scheduled to be issued
on December 1, 2018.
Following through to ensure a strong field of bidders and preparing
the agency for more public staff will be the most important markers of
progress in the coming months.
REAL TIME IS A REALITY
In last year’s report, we highlighted the RTA’s decision to invest in
a reliable ‘real-time’ system through the installation of “CAD/AVL”
(Computer Aided Dispatch/Automatic Vehicle Location) hardware
in each transit vehicle. Over the last year, installation and testing
took place and, after a few relatively minor delays, the RTA released
“GoMobile 2.0” on July 1, 2018.
GoMobile 2.0 is the Transdev-developed smart phone app that allows
riders to track buses and streetcars in real time and purchase electronic
tickets. This release is obviously good news for people with smart
phones, a growing majority in this country (a 2017 Pew Center study
estimates that even 67 percent of those making under $30,000 annually
have smart phones now).2 But it’s also good news whether you have a
smart phone or not as it will benefit the entire system.
Studies have shown that reliable real-time information increases
ridership. After partial implementation on Chicago’s transit system in
2008 and 2009, routes with real-time implementation saw an average
increase of 126 riders per month compared to routes without the
real-time data.3 New York City saw a two percent increase in ridership
between 2011 and 2012 after reliable real-time data arrived.4 Increased
ridership is important for all riders – it means more revenue to invest
back into the system and a bigger transit rider constituency pushing for
more improvements.
Real-time data will also result in more reliable buses by keeping drivers
on track and on schedule. Over time, real-time data can more easily
identify trouble spots where congestion consistently impacts service.
Planners can use this data to inform service planning and make
improvements to address congestion and unreliability.
Moving forward, RTA should make this data publicly available. There
are many ways this data can be used to benefit riders. This will
enable outside groups to more easily evaluate the RTA’s performance
and progress and help build trust in the agency. Additionally, app
developers can use the data to create new products to benefit riders. Ride New Orleans The State of Transit 2018 Page 10Challenges
Despite last year’s progress in setting long-term direction, outside of
the addition of real-time data, riders have not seen tangible benefits.
Continued poor access to jobs via transit for the majority of New
Orleans region residents remains a critical concern.
to Overcome
For Ride New Orleans, access to jobs is one of the most important
metrics. The high poverty rates and high numbers of carless
households in our region, plus the high cost of owning a car –
estimated at $8,469 annually in 20175 – mean that better access
to economic opportunity via transit is an essential ingredient to an
equitable and growing regional economy.
As long as we’re not improving transit access to jobs, the majority
of riders will not feel tangible benefits and many will view other
improvements as mere window dressing. We must maintain a laser-like
focus on implementing the strategic plan, especially improving access
Methodology notes to jobs. We must not be distracted by projects that won’t help the vast
majority of riders – like the St. Claude streetcar.
Job Access Analysis: The methodology used for this
study strongly reflects the cumulative opportunity
metric that is utilized in the “Access Across America”
report produced by the University of Minnesota’s ACCESSIBILITY METRICS REMAIN POOR
Accessibility Observatory. Data is obtained from
the U.S. Census Bureau’s Longitudinal-Employer Table 1: Average percent of jobs accessible, by mode
Household Dynamics Program 2015. The
calculations are based on the travel times observed
between every US Census Block Group (CBG) in
Jefferson Parish, Orleans Parish, and St. Bernard
parishes. To calculate the trip origin and destination
for a particular CBG, the population- and job-
weighted centroid was used.Travel time is calculated
using OpenTripPlanner based on graphs composed Source: U.S. Census Bureau. 2018. LODES Data. Longitudinal-Employer
of data from OpenStreetMap and published transit Household Dynamics Program. http://lehd.ces.census.gov/data/lodes/; Ride
timetables. Driving times assume that the vehicles New Orleans analysis
do not encounter any congestion and travel at the
speed limit. The transit travel times operate on an
assumption of perfect schedule adherence. The Time is the most valuable commodity for a transit rider. Simple
observed travel times further make the assumption arithmetic dictates that a person can keep a job only if she can access
that portions of a trip that are not on-board a transit that job regularly in a reasonable amount of time. A job that takes
vehicle take place by walking at a speed of 3 miles 25 minutes to get to via car, but 90 minutes via transit, is feasible for
per hour along designated pedestrian facilities such an individual with a car, but much more difficult for a transit-reliant
as sidewalks, trails, etc. To reflect the influence of individual.
transit service frequency on accessibility, travel times
are calculated repeatedly for each origin-destination Unfortunately, the average transit-reliant New Orleanian can reach
pair every ten minutes between 7:00 and 8:59 AM only 12 percent of the region’s jobs in 30 minutes or less during peak
as the departure time. Accessibility is averaged time. That number has remained stagnant for the last two years and is
across the three parishes Orleans Parish, with the especially concerning when compared to the average access a New
number of jobs accessible from each CBG weighted Orleanian with a car enjoys – 89 percent.
by the percentage of workers residing in that
CBG. The result is a single metric that represents Transit riders in Jefferson and St. Bernard parishes fare even worse,
the accessibility value experienced by an average with the average Jefferson rider able to reach 4.6 percent of the
worker in each of the three parishes. The following region’s jobs in 30 minutes or less during peak time and the average St.
formula describes how the weighted average is Bernard rider only able to reach 0.6 percent of the region’s jobs in 30
calculated: minutes or less during peak time.
Weighted Average = (w1/a)j1 + (w2/a)j2 ... wn/a)jn
w = workers residing in CBG
a = all workers residing in Orleans Parish
j = jobs accessible from CBG
n = Each CBG in Orleans ParisFigure 5: Percentage of jobs reachable in 30 minutes using public transit and walking Figure 6: Percentage of jobs reachable in 30 minutes driving Source: RTA, Jefferson Transit, OpenStreetMap, US Census Bureau: LODES (2015). Map Data: US Census Bureau, OpenStreetMap Contributors
Figure 7: Percentage of jobs reachable in 60 minutes using public transit and walking

Figure 8: Percentage of jobs reachable in 60 minutes driving

Source: RTA, Jefferson Transit, OpenStreetMap, US Census Bureau: LODES (2015). Map Data: US Census Bureau, OpenStreetMap Contributors
Table 2: Percentage of jobs accessible within 30-minute transit
commute by parish, weekday and weekend
                                                                            Methodology changes

                                                                            Ride New Orleans began performing this analysis
                                                                            annually in 2016 and in 2017 a minor tweak was
                                                                            made to include portions of neighboring parishes
                                                                            that are reachable on transit and/or by walking.
                                                                            However, fixed route public transit routes do not
                                                                            presently reach beyond Jefferson, Orleans and St.
                                                                            Bernard Parishes so as a result a simple buffer of
                                                                            three miles was used around the three parishes so
                                                                            that jobs within walking distance would be included.
Table 3: Percentage of jobs accessible within 60-minute transit
                                                                            It was decided this year that this tweak would
commute by parish, weekday and weekend                                      be abandoned and we would return to the same
                                                                            methodology used in 2016.

                                                                            Here’s why:

                                                                            A simple buffer around the parishes will include jobs
                                                                            that are not actually reachable on foot within 60
                                                                            minutes, which was the original intention because
                                                                            the street grid does not actually allow people to walk
                                                                            directly to those jobs. As a result, what was intended
Source: U.S. Census Bureau. 2018. LODES Data. Longitudinal-Employer         to be a “transit shed” (the area accessible on transit
Household Dynamics Program. http://lehd.ces.census.gov/data/lodes/; Ride    and walking” was much to large and included areas
New Orleans analysis                                                        that could never realistically be reached on public
                                                                            transit and walking.

Weekend service drops slightly                                              Including jobs around the periphery of the three
                                                                            parishes made it more difficult to succinctly and
Weekend service is especially important because the hospitality             clearly explain to readers what the denominator in
industry, which does limit itself to typical ‘9 to 5’ hours, comprises an   our access percentages was. I.e. when someone
outsized percentage of the regional economy. Hospitality workers are        asks, “11% of what jobs are reachable?” We can
often commuting on weekends, the evening, or early morning.                 now simply answer, “11% of the jobs in Jefferson,
                                                                            Orleans, and St. Bernard Parishes.”
The good news is that weekend access to jobs declines only slightly
in comparison to weekdays for RTA riders. Midday on Saturday, the           The expanded area outside the three parishes
average New Orleans rider can still reach 11.9 percent of jobs in the       accounted for about 16,700 jobs (4% of total) and
region, only a slight drop. To a large degree that is due to the RTA’s      11,900 workers (3% of total). These jobs were
service enhancements in 2016.                                               accessible to very few people without a car and
                                                                            the workers in this area were able to access a very
Although weekend service is only slightly worse than weekday service,       small number of jobs without a car. The result is that
the share of regional jobs accessible via a reasonable transit commute      the percentage of jobs that are reachable by transit
is far too low and needs to be improved. In a 2017 Ride New Orleans         appears larger than last year’s report even though
survey of transit-reliant Harrah’s workers, we found that 49 percent had    the year-to-year access percentage remained steady
a one-way commute of 60 minutes or more.                                    using the new methodology.

                                                                                Ride New Orleans    The State of Transit 2018   Page 14
Using value capture to improve public transit
MISPLACED INVESTMENT PRIORITIES?
Of equal concern is an apparent push to have the RTA invest its limited
Along with poor transit service, one of the main transit infrastructure funds in projects that don’t improve overall transit
criticisms of recent streetcar expansions has been service or help transit-reliant people get to work.
that they take money away from other potential
projects. When federal grants are used there is still In a display of tone deafness, the first planning project to take center
a required 20 percent local match that could be stage after the Strategic Mobility Plan (SMP) was passed is not part of
spent elsewhere. Meanwhile, the $41.5 million St. the SMP. Instead of advancing projects included in the SMP, in spring
Claude/Rampart streetcar expansion was paid for 2018, Transdev staff in service to the RTA opted to continue a study of
completely by local funds that certainly could have an extension of the Rampart/St. Claude streetcar six blocks downriver
been used in other areas. and a connection down Elysian Fields to the Riverfront Line.
But for communities that believe the aesthetic There are three main reasons why this study is especially troubling:
and economic development improvements some
associate with streetcars are worth the investment, 1. It does an end run around the SMP. The SMP rightfully
there is a way to move forward with investments prioritizes high capacity transit along St. Claude and
without taking funds away from other projects. Value improvements through the CBD and French Quarter, but looks to
capture instruments such as special assessment the Comprehensive Operations Analysis (COA) or other studies
districts and tax increment financing (TIF) can fund to determine the right mode and routing. Pushing for a streetcar
capital and operational expenditures. outside of that process indicates a troubling lack of internal belief
in a plan the RTA just spent almost $1 million to produce. That
New Orleans is no stranger to value capture creates legitimate concern about whether the rest of the plan will
instruments that collect revenue from specific areas be prioritized. The study did start before the final passage of the
and direct that revenue towards specific capital SMP, but the RTA board has clear authority to halt studies that do
improvements and operational expenditures. The not meet agency priorities.
Downtown Development District of New Orleans
(DDD) was the nation’s first ever assessment-based 2. The RTA board appeared to be in the dark about the study.
business improvement district. It was created in The current arrangement between RTA and its manager/operator,
1974 and raised over $7 million in 2016. Transdev, makes it impossible for an all-volunteer board to
effectively oversee an international, profit-driven company. In
Special assessment districts like the DDD introduce February 2018, the RTA board gave further ammunition to critics
a dedicated millage on property taxes within a of the arrangement when they indicated that they thought that
specified district and use the resulting revenues to federal grant money was paying for the study based on what
fund investments in the district. Special assessment Transdev staff told them. Instead, the funding came from general
districts like this could also be used to fund transit operating funds.6
capital costs. 3. Streetcars haven’t helped. Recent streetcar construction in
New Orleans omits dedicated lanes and other features that could
Another mechanism for leveraging the value created make streetcars more effective transit. The result is that access to
by transportation investments is a TIF district. TIF jobs has not improved despite $92.5 million in investment in new
districts cap tax revenue going outside the district streetcar tracks along Loyola, Rampart, and St. Claude. In fact,
at the pre-TIF level. Revenue over the capped the 2017 Ride New Orleans analysis showed that potential transit
amount (the increment) is then directed into the TIF riders along the Rampart/St. Claude streetcar spur experienced
fund. These funds can be leveraged to fund capital slightly worse access to regional jobs in 30 minutes or less via
investments or utilized to fund recurring expenses. transit after the line opened in 2016.
TIFs have supported transit projects across the
country including the Portland Streetcar and Some streetcar defenders claim that streetcar expansions should be
Houston Bus Rapid Transit system. They are also measured differently because these projects leverage federal grants,
being considered as a dedicated revenue source for which can pay up to 80 percent of the cost of construction. This
the Charity Hospital redevelopment. argument ignores the fact that localities still pay at least 20 percent of
the cost. With an estimated $75 million price tag for the St. Claude/
Elysian Fields expansion - that would mean up to $15 million in local
funds. RTA could use that $15 million to increase access and reliability
elsewhere in the system.
Other streetcar proponents point to indirect effects – like economic
development – as a reason to continue investment in streetcar lines. In
a poor city, this can be a tempting argument. At this time, it is unclear
Page 15 The State of Transit 2018 Ride New Orleans if there is a measurable economic impact from streetcar investmentsin New Orleans – which should make decision makers wary of this line Figure 9: Proposed streetcar extension
of argument. And even if there is a measurable impact, there are other
ways to use this increased economic value to pay for the expansion
instead of forcing other needed investments to wait in line (see sidebar
on page 15).
Whatever the rationale, one thing is clear to RIDE. With limited funding
and many needs, we must prioritize projects that clearly get people to
work and other important destinations in less time.
Stalled recovery
RIDE utilizes total weekly trips as a way to gauge the actual service
delivery on the streets compared to what service was like before
Hurricane Katrina. We use pre-storm 2005 service as a benchmark and
calculate the percentage of recovered service each year.
We also measure each route’s peak time frequency as another metric
to determine the quality of that service. Generally, frequencies of
Source: New Orleans Regional Transit Authority, St. Claude
15-minutes-or-less are considered the cut off for the “high frequency”
and Elysian Fields Streetcar Extensions Study, http://nortav11.
transit most riders say they want. msfglobal.net/About/Streetcar-Study
Unfortunately, for the second year running, we see a stalled recovery in
these metrics as well.
Methodology notes
Weekly trip count Trips and Total Trip Volume: A “trip” is a single round
The RTA saw a slight increase in the percentage of total weekly trips trip made by a single vehicle, like a bus or streetcar,
recovered between 2017 (52.1 percent) and 2018 (52.3 percent). from the time it leaves its first station until it returns to
that station at the end of its route. Ride New Orleans’
The total number of streetcar trips remained stagnant this year. Due analysts relied on the RTA’s maps and schedules
to previous increases though, streetcar recovery is still high when from 2005 and 2018 to count total weekly trips on
compared with bus service recovery. Total streetcar service has well each route. We added all the routes together to get
exceeded its pre-Katrina levels, with a 125 percent overall recovery the “weekly trip volume” or total number of weekly
rate. trips available in a normal week during 2005 and
2018. Our trip volume analysis does not include
paratransit trips; it focuses on the scheduled service
Figure 10: Total weekly trips, by mode available to the majority of transit riders.
Route Frequency: To determine the frequency of the
region’s 2005 and 2017 transit service, we calculated
the headway – or number of minutes wait between
transit trips – on each bus and streetcar route during
weekday morning peak hours (from 6:30AM to
10:00AM) and weekday evening peak hours (from
3:30PM to 7:00PM), based on official RTA, JeT,
and SBURT schedules. The total number of trips
departing during these hours was divided by 420
minutes to calculate minutes per trip within the seven
hours of peak periods. The results organized into
the following categories: Headways of 15 minutes
or less; 15.1 to 30 minutes; 30.1 to 50 minutes; and
Source: Ride New Orleans analysis of Regional Transit Authority schedules
greater than 50 minutes.
Ride New Orleans The State of Transit 2018 Page 16Figure 11: VRH by mode
Frequency
Frequent service, or transit vehicles arriving every 15-minutes-
or-less by most industry standards, is one of the most critically
important aspects of a quality transit system.7 Pre-Katrina, our
region had 19 high frequency routes, with most of them within
the RTA system. 13 years after the storm, we only have 5 high
frequency lines, all within the RTA system.
Vehicle revenue hours
Vehicle revenue hours (VRH) are the hours that transit vehicles
travel while they are accepting passengers on their scheduled
routes.
Source: NTD 2000-2017 and Regional Transit Authority 2017 NTD
Filings VRH continues to increase but the pace is slowing. There does
not appear to be any service increases for the coming year.
Table 4: Number of routes by frequency, 2005 & 2018
Table 5: Farebox recovery ratios, 2016
Source: Ride New Orleans Analysis of RTA, JeT, and SBURT Source: NTD 2016 and NTD 2016 National Transit Summary & Trends
schedules in 2005 and 2018
Page 17 The State of Transit 2018 Ride New OrleansFigure 12: 2018 proposed operating budget revenues
OPERATING BUDGET
It’s important to understand current costs and
revenue. To provide more total service, the RTA
will need to find additional revenue and reduce
costs and increase operational efficiency.
For 2018, the agency’s budgeted operating
expenses are $95,955,327. Over 2/3 of their
budgeted revenues come from a city-collected
sales tax. Farebox revenue makes up the next
largest portion, followed by the RTA’s portion
of the Hotel/Motel tax, funding from the state
motor vehicle sales tax, and assorted other small
sources of revenue.
Overall the operating budget is still down from
before Hurricane Katrina; in 2004 operating
expenses were $116,258,709. When accounting Source: RTA CY2018 Proposed Budget Statement of Revenue and Expenses
for inflation using the Bureau of Labor Statistics’
CPI Inflation Calculator, the equivalent budget
would be $158,185,290 in 2018. That is an Figure 13: Total operating expenses per VRH, 2016 - peer agencies
operational deficit of $62,229,963.
The high cost of service has been a continuing
concern. The RTA once again ranks highest in
total operating expenses per vehicle revenue
hour among peer cities. In recent years, RTA
has reduced this cost, but transit operations
costs in New Orleans still are significantly more
expensive than in comparable systems.
Staff from the private operator, Transdev,
often point to low fares as a problem. A quick
comparison to peer cities shows the RTA among
the lowest in fares. Fares have not risen since
1999 and if keeping pace with inflation the base
$1.25 fare would be $1.90 today. This results
in a low ‘farebox recovery rate’ of 16.9%, Figure 14: Bus operating expenses per VRH, 2016 - peer agencies
significantly less than the national average of
36%.
However, a fare increase poses challenges
to efforts to ensure equitable access for our
most vulnerable residents. This is especially
important in a city with high poverty rates. Any
consideration of a fare structure shift must
also consider, and protect, the people most
impacted.
We also must understand that a fare increase
alone is insufficient to cover the increased
operations costs from full or even partial
implementation of the SMP. Any conversation
about increased revenue must also look to
additional sources of revenue and discuss how Source: Urban Integrated National Transit Database and National Transit
to improve the efficiency of RTA operations. Database (NTD) 2016
Ride New Orleans The State of Transit 2018 Page 18RIDERSHIP CONTINUES TO PLATEAU
In what seems to be good news at first glance, the New Orleans RTA was one of only four systems nationwide to not see a drop in
ridership in 2017. Instead the RTA saw a slight increase of 144,274 boardings.
That’s positive against a backdrop of general transit ridership decline nationwide. This decline may be attributable to numerous factors
like demographic shifts, poor service, increased car ownership, relatively cheap gas, and competition for choice riders from emerging
mobility providers, among other ideas.
A strong case can be made that the three other cities with increased ridership – Seattle, Houston, and Phoenix – earned those ridership
gains through increased service or redesigned transit, especially bus, networks.
Closer inspection of the New Orleans numbers shows partial similarities, but also some dangerous trends that should caution us against
over-celebration.
RTA increased ridership in several key areas where service has been increased over the last several years, including:
• New Orleans East routes (separate from the #94 Broad) saw continued jumps in ridership – adding 88,268 trips, or a 5.6 percent
improvement from 2016.
• The Freret and Martin Luther King lines – with their vastly improved connectivity after the RTA reconnected them with Canal Street
in late 2016 – proved popular with riders, adding 37,890 trips, or a 10.1 percent increase from 2016.
• The #94 Broad bus – the most popular bus route in the city – increased by 52,792 trips, or a 4.0 percent improvement from 2016.
• The Canal Streetcar lines as a whole saw very strong growth despite the inconveniences from the Cemeteries transfer point
construction and detours, adding 284,514 trips or a 9.5 percent increase from 2016.
• The St. Bernard lines (#51 and #52) saw continued rider response to increased frequency implemented in 2016, adding 42,682
trips or a 8.8 percent improvement from 2016.
All of these routes have one main thing in common – they all saw increased frequency or connectivity within the last few years and riders
clearly responded.
Figure 15: Ridership changes 2016 to 2017, by route
r
ca
e
ad
et
an
tre
pl
ss
Es
e
rle
ine
d
n-
lau
ha
so
az
e
lan
.C
.C
ck
ag
Ja
Tu
St
St
M
2
1
9
1
8
#1
#1
#3
#9
#8
d
es
es
rs
.K
oa
ca
.L
lin
ut
Br
M
et
ro
d
tre
ar
8
4
st
#2
#9
rn
Ea
ls
Be
&
na
ns
et
Ca
.
lea
St
er
Fr
8
2
Or
#4
#5
5
w
#1
&
&
Ne
7
1
#4
#5
-6.7% -3.8% -3.3% -1.9% -1.8% 4.0% 5.60% 8.8% 9.5% 10.10%
Source: Regional Transit Authority
Page 19 The State of Transit 2018 Ride New OrleansBut while this good news is worth noting, there were also corresponding
declines that create worries for the system overall – including some routes that
also saw service enhancements in recent years.
Many of these routes that saw decreased ridership are traditionally among
the most robust in the RTA system. – like the #11 Magazine, #39 Tulane, and
#88 St. Claude. While we are pleased to see the increased ridership in several
lines moving forward, we must determine what happened to the other lines
and what makes sense for the system as a whole. It will be very important to
closely examine why these lines lost riders.
Figure 16: Total annual RTA boardings
Figure 17: Total RTA boardings by mode
Source: Regional Transit Authority
Ride New Orleans The State of Transit 2018 Page 20USING TRANSIT FOR A HEALTHIER NEW ORLEANS
Transit and health care access
The RTA’s Strategic Mobility Plan (SMP) included two metrics for
Reliable and affordable public transportation can increased healthcare access that could be groundbreaking for New
impact health by enabling access to a range of Orleans residents moving forward. Those two metrics are:
health-promoting destinations, including:
• Percentage of households in the service area within 30 minutes
• Facilities that offer primary or specialty by transit of a major hospital during typical office hours. The
healthcare services target in the SMP is 80% by 2022. This goal is important not
necessarily for emergency care but for providing equitable access
• Pharmacies to specialists that tend to cluster at major hospitals.
• Safe and clean spaces for physical activity, • Percentage of households in the service area within 30 minutes
such as parks and recreation facilities by transit of a community health center during typical office
• Businesses or organizations that offer healthy hours. The target in the SMP is 80% by 2022.
and affordable foods
65 percent of New Orleans households can reach a hospital within 30
• Employers, schools, churches, and other minutes or less via transit. 88 percent of New Orleans households can
locations that contribute to economic reach a community health center within 30 minutes or less via transit –
opportunity and social cohesion already above the SMP target.
In both the health and transportation sectors, there Those encouraging initial numbers mask specific challenges to be
is increasing awareness of the mutual benefits of overcome such as inequitable access to healthcare in generally
having a transit system that considers the region’s underserved areas – especially New Orleans East, Algiers, and Gentilly.
health. The RTA SMP goal to “support a sustainable,
healthy region” is an important acknowledgement of The problem is especially pronounced in New Orleans East. As can be
the need for both sectors to work closer together. seen in Figure 18, all major hospitals in the area provide easy transit and
walking access to people already within their immediate vicinity expect
Since lower-income residents are more likely to rely one – New Orleans East Hospital. This is due to the car-first design of
on public transportation to get around, our transit many New Orleans East streets. The access issues to New Orleans East
system can play an important role in tackling health Hospital clearly show that increasing frequency and connectivity in the
inequities and ensuring that all New Orleanians have transit network likely will have to be paired with improving walking and
the opportunity to be healthy. biking access as well, or success may be elusive.
The Greater New Orleans region continues to exhibit While Jefferson Transit (JeT) is not a part of the SMP and has not
poor health outcomes, such as high rates of heart established any metrics for access to health care, it’s also worth noting
disease and obesity, in spite of 89% of households that JeT provides much lower access levels to healthcare than the RTA
in Orleans Parish residing within 30 minutes of does.
transit access to community health centers. This
may be partially explained by the well-established Ultimately, healthcare access is a critical component of an equitable
fact that much of what affects an individual’s health region and a thriving and healthy workforce so it is imperative to
happens outside of a doctor’s office. Additionally, address these questions.
while the number of community health centers
greatly increased in the years following Hurricane
Katrina, and these centers provide access to Table 6: Households transit access to healthcare facilities within 30
much-needed primary care, many of the chronic minutes or less
conditions prevalent in the region also require
engagement with specialty care. With much of
the region’s specialty care provided by hospitals,
enhancing access to hospitals via transit could help
meet riders’ health needs.
Source: RTA, Jefferson Transit, OpenStreetMap, US Census Bureau: LODES
(2015). Map Data: US Census Bureau, OpenStreetMap Contributors; Ride New
Orleans Analysis
Page 21 The State of Transit 2018 Ride New OrleansYou can also read