Predicting the effects of waning vaccine immunity against COVID-19 through high-resolution agent-based modeling
←
→
Page content transcription
If your browser does not render page correctly, please read the page content below
Predicting the effects of waning vaccine
arXiv:2109.08660v4 [q-bio.PE] 22 Oct 2021

                                                   immunity against COVID-19 through
                                                   high-resolution agent-based modeling

                                                                        October 25, 2021

                                               Agnieszka Truszkowska1,2 , Lorenzo Zino3 , Sachit Butail4 , Emanuele Caroppo5,6 ,
                                            Zhong-Ping Jiang7 , Alessandro Rizzo8,9 , and Maurizio Porfiri1,2,10

                                            1 Center for Urban Science and Progress, Tandon School of Engineering, New
                                            York University, Brooklyn NY, USA
                                            2 Department of Mechanical and Aerospace Engineering, Tandon School of
                                            Engineering, New York University, Brooklyn NY, USA
                                            3 Faculty of Science and Engineering, University of Groningen, Groningen,
                                            The Netherlands
                                            4 Department of Mechanical Engineering, Northern Illinois University, DeKalb
                                            IL, USA
                                            5 Department of Mental Health, Local Health Unit ROMA 2, Rome, Italy
                                            6 University Research Center He.R.A., Università Cattolica del Sacro Cuore,
                                            Rome, Italy
                                            7 Department of Electrical and Computer Engineering, Tandon School of
                                            Engineering, New York University, Brooklyn NY, USA
                                            8 Department of Electronics and Telecommunications, Politecnico di Torino,
                                            Turin, Italy
                                            9 Institute for Invention, Innovation and Entrepreneurship, Tandon School
                                            of Engineering, New York University, Brooklyn NY, USA
                                            10 Department of Biomedical Engineering, Tandon School of Engineering,
                                            New York University, Brooklyn NY, USA

                                            Correspondence should be addressed to: mporfiri@nyu.edu

                                                                                  1
Abstract
The COVID-19 pandemic is yet again on the verge of escalating,
despite a hopeful case decrease recorded during spring and summer
2021, due to successful vaccination roll-outs. Together with the emer-
gence of new variants, the potential waning of the vaccination immu-
nity could pose threats to public health. It is tenable that the timing
of such a gradual drop in the immunity of most of the vaccinated
population would synchronize with the near-complete restoration of
normalcy. Should also testing be relaxed, we might witness a poten-
tially disastrous COVID-19 wave in winter 2021/2022. In response
to this risk, many countries, including the U.S., are opting for the
administration of an additional vaccine dose, the booster shot. Here,
in a projected study with an outlook of six months, we explore the
interplay between the rate at which boosters are distributed and the
extent to which testing practices are implemented. Projections are
based on a highly granular agent-based model that provides a close,
one-to-one digital reproduction of a real, medium-sized U.S. town. Fo-
cusing on the dominant Delta variant, we contemplate the waning
immunity provided by the locally available Johnson&Johnson, Pfizer,
and Moderna vaccines. Theoretical projections indicate that the ad-
ministration of boosters at the rate at which the vaccine is currently
administered could yield a severe resurgence of the pandemic, even
worse than the first wave experienced in spring and summer 2020.
Our projections suggest that the peak levels of mid spring 2021 in
the vaccination rate may prevent the occurrence of such a scenario.
Our study highlights the importance of testing, especially to detect
infection of asymptomatic individuals in the very near future, as the
release of the booster reaches full speed.
Winter and spring 2021 marked a long-awaited massive vaccination cam-
paign against COVID-19, starting approximately one year after the incep-
tion of the outbreak. As of the mid-September 2021, 42.6% of the World and
63.8% of the U.S. population took at least one dose of the vaccine, while 30.8%
and 54.5%, respectively, are fully vaccinated [1]. However, approaching fall
2021 brings to light a new unknown: the possibility of waning vaccination im-
munity and the consequent need for an additional vaccine dose —the booster
shot [2]. There is evidence that the booster shot would not only restore the
original protection, but would also enhance people’s immunity against the
most recent variants, including the widely dominant and highly transmittable
2Delta variant [3, 4]. Many countries, including the U.S., are starting their re-
vaccination campaigns, in an attempt to prevent new outbreaks accompanied
by socially and economically disastrous restrictions [3, 5, 6].
In the original (August 2021) schedule of booster shot administration by
the U.S. Centers for Disease Control and Prevention (CDC), the booster
campaign was expected to start on September 20th , 2021, with booster shots
available to all the adults in the U.S. eight months after they took their
second vaccine dose, with plans for expansion to people taking the one-dose
Johnson&Johnson vaccine [2]. At the same time, despite a surge in new
infection cases [7] and the nationwide dominance of the Delta variant [8],
non-pharmaceutical interventions (NPIs) are gradually being relaxed [9], and
preparations for a return to full-time in-person education and work are under-
way [10, 11]. Following mass vaccinations, COVID-19 testing is continuously
reduced [12, 13], with the enforcement of mandatory testing slowly aban-
doned by public health authorities [13] and contact-tracing home-isolation
no longer required for fully vaccinated individuals [9, 14]; not to mention
the ongoing trend in encouraging indoor gatherings (e.g., restaurants, bars,
gyms) for the fully vaccinated. In this evolving scenario, scientifically backed
policy-making is of paramount importance.
Mathematical modeling has played a key role in assisting public health
authorities to combat the COVID-19 pandemic [15, 16]. Since COVID-19
onset, mathematical models are being routinely used to forecast the course
of the pandemic and guide policymakers’ decisions on several chief issues,
including the enforcing of NPIs [17–21], the design of testing policies [22, 23],
the implementation of contact tracing [24–27], and the implementation of
vaccination campaigns in light of the concurrent uplifting of NPIs [28–35].
Mathematical modeling can also play a critical role in the present sce-
nario, where vaccine-induced immunity seems to be waning [36–39], testing
coverage is being lowered [12,13], and a booster shot campaign is going to be
implemented [2]. The interplay of these critical issues has received only lim-
ited attention so far. Layton et al. [4] have simulated the emergence of new
virus strains, including hypothetical deadlier variants in Ontario, Canada,
in light of realistic vaccination and booster campaigns implemented in the
region. Their results, projected until the end of 2021, point out the need
of vigilance and readiness to reinstate severe NPIs, as well as the possible
importance of a large-scale campaign of booster shots. Over longer time hori-
zons, other studies have been carried out to evaluate the potential benefits of
annual re-vaccination campaigns against COVID-19. In particular, Song et
3al. [40] have simulated different scenarios in the loss of immunity, spanning
until 2029. Their findings indicate that an annual re-vaccination campaign
could avoid future COVID-19 outbreaks if the vaccine is sufficiently effica-
cious and provides at least six months of protection. Sandmann et al. [41]
have compared the economic burden of introducing a regular vaccination
program in the U.K. to the cost associated with implementing social dis-
tancing measures for the next decade. Their work highlights the benefits
of re-vaccination schemes, evidencing that they would allow to avoid large
outbreaks and consequent restrictions. Lastly, Li et al. [42] have compared
different re-vaccination strategies in 15 countries over the next 20 years in
terms of long-term efficacy. Their findings identify a public health benefit in
alternating re-vaccination between fragile older strata and highly active por-
tions of the population, who habitually generate a high number of contacts.
Although conclusive evidence on the waning immunity of the vaccine and
on its timing is yet to be established [36–39, 43], these studies offer an im-
proved understanding of the potential benefits of re-vaccination campaigns
for a range of possible waning profiles. Yet, this knowledge does not imme-
diately translate into predictions on the short-term roll-out of booster shots,
which could be critical in shaping the future of the pandemic. Moreover, the
long-term predictions of most of these studies are limited to coarse-grained
considerations, which cannot take into account granular details of the popu-
lation.
Here, we fill in this gap by providing a systematic study of the effec-
tiveness of a re-vaccination campaign in the upcoming 2021–2022 fall/winter
season, considering as key factors the rate of administration of booster shots
and the population coverage of testing policies implemented during this
phase. We perform our study by means of a high-resolution agent-based
model (ABM), which faithfully provides a one-to-one digital reproduction
of a real, medium-sized U.S. town. As a test case, we simulate COVID-19
spreading in the town of New Rochelle, NY, for the next six months, ex-
panding on our previous efforts [23, 34]. The town of New Rochelle is chosen
as a representative medium-sized US town, characterized by high levels of
diversity and inequality [44, 45]. The digital town closely mirrors the geog-
raphy and demographics of the actual one, including household distribution,
lifestyles, and mobility patterns of its residents, thereby incorporating the
diversity of its population and potential inequalities across its fabric. The
progression model is expanded to include salient features of the predominant
Delta variant [8], booster shot campaign, and co-existence of three vaccines
4(Johnson&Johnson, Pfizer, and Moderna) providing different levels of pro-
tection over time, with a gradual waning immunity. The level of detail in
the model allows us to closely study the combined effect of booster shot ad-
ministration and testing practices in this stage of the pandemic. The study
was designed based on information about the pandemic gathered during sum-
mer 2021; some of the original design assumptions have changed between the
time of the submission (September 2021) and its revision (October 2021) [2].
These changes have prompted new simulation studies, which are included as
part of the Appendix.
Materials and Methods
Our computational framework consists of two components: a detailed database
of the town of New Rochelle, NY, and a high-resolution ABM that repro-
duces the spread of COVID-19 at a one-to-one granularity level that includes
mobility patterns among households, schools, workplaces, and non-essential
locations (including leisure locations).
The database of the town contains geographical coordinates of every build-
ing, residential and public. Public buildings include governmental institu-
tions and private companies of any kind, open to the general population —
the public. The database includes any workplace and non-essential locations,
identified using SafeGraph [46], explicitly distinguishing schools, retirement
homes, and hospitals. Town population is recreated using U.S. Census data
on residents age, household and family structure, education, and employment
characteristics. Residents can work and gather in New Rochelle, and in its
vicinity, including New York City. They commute to work via common means
such as public transit, cars, or carpools, and visit each other in private.
Each resident of New Rochelle is mapped into an agent in the ABM, re-
sulting into 79,205 agents. In the ABM, agents are characterized by a health
state that can change according to a disease progression model detailed in the
following, and they can take two types of tests — safe, contact-less car tests,
and more risky ones performed in a hospital. If infected, agents may undergo
three types of treatment — home isolation, routine hospitalization, and hos-
pitalization in intensive care unit (ICU). The ABM was originally proposed
in Truszkowska et al. [23], while a later extension of the work incorporated
a simplified version of the vaccination campaign [34].
For this projective study, we tailored the ABM to capture the scenario
5as of fall 2021, thereby introducing realistic and time-dependent vaccination
effects, booster shots, increased mobility of fully vaccinated agents, and CDC-
compliant contact-tracing measures [14, 47, 48]. In the following, we detail
these new features. For details on the other features of the model, the reader
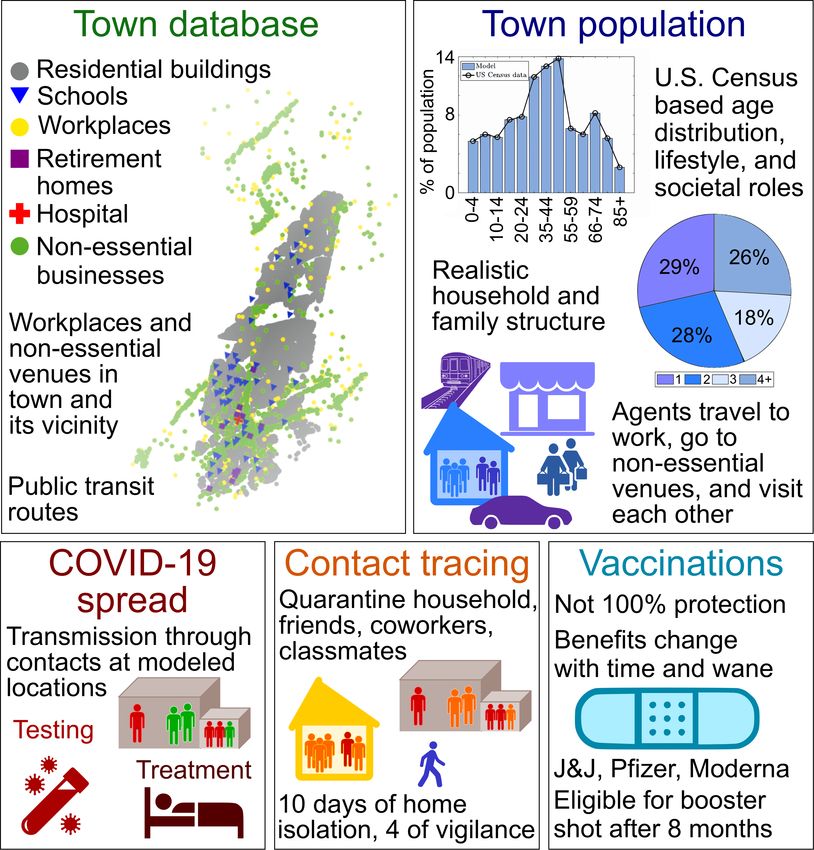
should refer to our previous publications [23, 34]. Figure 1 schematically
illustrates major components of our computational framework.
COVID-19 progression model
In our model, all the agents who are not infected, with exception of those
recently recovered, are susceptible to COVID-19. Once infected, agents can
undergo testing and treatment. Agents who are not symptomatic can get
vaccinated, and anyone can be contact-traced and home-isolated.
The progression model is shown in Fig 2. A susceptible agent (S) can
be vaccinated (Sv ), may be home isolated, irrespective of their vaccination
status, as a result of a home-isolation order due to a contact with an agent
with a confirmed COVID-19 infection (ICT ). Isolation may also be triggered
if a susceptible agent has COVID-19-like symptoms due to some other disease,
such as seasonal influenza (IHm ). Agents can be tested, via one of the two
available testing types, in a car (Tc ) or in a hospital (THs ). The former type
is considered contact-less and safe, while the latter carries infection risks.
Complete details on testing procedures and the corresponding parameters
are outlined in our two previous works [23, 34].
Susceptible individuals may become infected upon interactions with infec-
tious individuals who are in the same building. The same building may have
a role in multiple spreading pathways; for instance, a school provides path-
ways of infection between students, and students and teachers, but it is also
the workplace for its teachers. Infections occur according to a probabilistic
mechanism that accounts for differences in infection probability with respect
to the characteristics of the location and the number, role, and symptomatic
state of infectious individuals in the location, as detailed in Truszkowska
et al. [23, 34]. Specifically, inspired to Ferguson et al. [49], we assumed that
symptomatic individuals are twice as much likely to transmit the disease than
asymptomatic and pre-symptomatic individuals. For non-essential locations,
like leisure ones, we neglect spreading between employees and visitors, while
retaining spreading within the two groups. This choice was motivated by the
enforced use of personal protective equipment and social distancing toward
minimizing contagions between employees and customers.
6Fig 1. Schematic outline of the ABM computational framework.
The database of New Rochelle, NY, includes geographical information of
every residential and public building in the town. It also incorporates
workplaces and non-essential venues in the area as many town residents
work outside of town and some frequent non-essential locations locations in
its vicinity. Each resident is represented as an agent. The population
faithfully mirrors the sociodemographic profile of the actual one. The
top-right panel shows the age distribution of agents, as registered in the
U.S. Census data. The pie chart represents the percentage of households
with the indicated size, also in close agreement with the Census (values
omitted for clarity). COVID-19 spreads through contacts at different
locations associated with the agents, and infected agents can be tested and
treated. Positive test result triggers contact tracing, resulting in
CDC-compliant home-isolation of potentially exposed individuals. Finally,
the platform models imperfect, realistic vaccines, which grant a number of
benefits, and wane with time. After eight months, vaccinated agents
become eligible for an additional vaccine dose, the booster shot.
7Upon infection, a susceptible agent becomes exposed (E), not showing
symptoms of the disease. The exposed agent can also get vaccinated (Ev )
as long as their infection status is not known. Even without any symptom,
exposed agents can be tested and home isolated. Agents can either recover
after being asymptomatic (R), or develop symptoms after the latency period
and transition to the symptomatic state (Sy). Symptomatic agents cannot
get vaccinated, which is also the case for agents with symptoms similar to
COVID-19 due to another disease. However, vaccinated agents can become
symptomatic as a result of an infection (Syv ), potentially leading to milder
symptoms.
Agents with symptoms can test and subsequently receive treatment through
home isolation (IHm ), normal hospitalization (HN ), or hospitalization in an
intensive care unit, ICU (HICU ). Agents can either recover or die (D). Symp-
tomatic and exposed agents can also get contact traced, and home isolated on
that account. A contact-traced symptomatic agent will undergo treatment
regardless of their testing status. Recovered agents are temporarily immune
to COVID-19 and, after a certain period of time, they can also be vaccinated.
Once their natural immunity is lost, these agents transition to the vaccinated
susceptible category (Sv ). Recovered agents who do not receive the vaccine
spontaneously lose natural immunity after a fixed period of time. Based on
some (possibly conservative) estimations [50–53], in our simulations we fixed
such a period to six months. Additional simulations to assess the robustness
of our findings with respect to different duration of natural immunity (loss
of natural immunity after four or eight months) are reported in Figure 9 and
Figure 10.
Contact-traced agents cannot be vaccinated, and even if susceptible; they
become vaccine-eligible only after some period of time. These restrictions
hold for the booster shots as well.
All the parameters that characterize the transitions in the COVID-19 pro-
gression model are listed in Table 4. An explicit expression of the contagion
probability for each agent i, pi (t), depending on the agent’s characteristics
(including lifestyle, workplace or school, household in which they live) can be
found in Truszkowska et al. [34]. The main elements of novelty of the present
modeling extension include realistic treatments of the effect of vaccination
and contact tracing and are detailed in the following.
8IHm
TC THs
ICT
V
ICT S E Ev IHm
V
TC
Sv
Sy SyV HN
THs
R
Rv V
ICT
ICT D HICU
Fig 2. Diagram of the COVID-19 epidemic progression. Agents’
health states are susceptible (S), exposed (E), and symptomatic (Sy).
Since a vaccination does not grant 100% immunity, and exposed agents can
be vaccinated, the progression distinguishes those three health states in
their vaccination version, Sv , Ev , and Syv . Susceptible and exposed agents
can be tested and home isolated (IHm ). Testing can take place in a
contact-less form in a car (Tc ) or in a hospital (THs ). All the agents can be
subject to contact tracing and subsequent home-isolation (ICT ). Exposed
agent may recover without ever developing symptoms (R), or become
symptomatic after a latency period. Symptomatic agents can undergo
testing and subsequent treatment through home isolation (IHm ), normal
hospitalization (HN ), or hospitalization in an intensive care unit, ICU
(HICU ). They can either recover or die (D). A recovered agent, if not
already vaccinated, can vaccinate as well (Rv ). Recovered agents are
temporarily immune to the disease and after some period of time they
become susceptible again, regardless of their vaccination status.
9Vaccinations
An agent can get vaccinated with one of the three vaccine types distributed in
the area according to their availability. We considered one vaccine mirroring
the one-dose Johnson&Johnson (abbreviated as J), and two vaccines with the
characteristics of the two-dose Pfizer and Moderna vaccines (abbreviated as P
and M, respectively). The probability of being administered a given vaccine
type was computed based on data collected manually on actual vaccine offer
in the town, as of late July 2021, see Table 5 [54].
Once agent i is vaccinated, five of the model parameters related to the
individual are modified accordingly. Specifically, four quantities decrease
upon vaccination: (1) the probability of being infected by SARS-CoV-2, (2)
the transmission rate if infected, (3) the probability of requiring hospitaliza-
tion, and (4) of dying if infected. Conversely, (5) the probability of being
asymptomatic when infected increases upon vaccination.
To model such a temporal effect, for each vaccine α = J, P, M and for
each model parameter k = 1, . . . , 5, we introduce a function γα,k (s), which
models the effect of vaccine α on parameter k as a multiplicative coefficient, s
days after vaccine administration. As an example, the probability of COVID-
19 infection pvi (t) for agent i vaccinated with vaccine α at time ti is reduced
compared to the original probability in the absence of vaccination pi (t) to
pvi (t) := γα,1 (t − ti ) pi (t) . (1)
Similar expressions can be written for the other four properties (see S1 Appendix
for more details).
The shape of these functions is estimated from efficacy data on vaccines.
Specifically, they are all defined as piece-wise linear functions. For the one-
dose vaccine, they increase up to their most favorable values two weeks after
the shot (smaller than one for property k = 1, . . . , 4 and greater than 1 for
property 5). In case of two-dose vaccines, the functions linearly interpolate
efficacy values collected at the time of the first shot, of the second one, and at
the attainment of full immunity. The second dose is always contemplated in
the model, following local vaccination campaign that sets the appointment
for the second shot at the time the first shot is administered, one month
later [55]. The peak benefits for all three vaccine types last for an eight-
month period following recent studies on the humoral and cellular immune
responses [36, 37]. In this period, the functions have a constant value.
10The scientific community has not yet reached consensus on the duration of
such period. Studies by Barouch et al. [36] and Colliet et al. [37] provide only
a lower-bound on it, whereas some preliminary analyses based on epidemic
data collected over summer 2021 in countries with fast vaccination campaigns
(for instance, Israel and Qatar) suggest shorter duration of peak-level immu-
nity [38, 39]. To strengthen the robustness of our claims, a parametric study
encompassing different timings of the waning vaccine immunity (six and 10
months) is considered and discussed in Figs. 7 and 8.
Once the peak-benefit period is over, benefits start to gradually wane,
yielding a gradual loss of immunity. Here, we assume that such an immunity
is totally lost over the course of the following six months. This is modeled by
letting the functions γα,k linearly approach 1, over a period of six months.
Following the original CDC guidelines, we assume that people are eligible
for booster shots starting from eight months after their second vaccine dose
[2]. We hypothesize that the booster shot restores peak vaccination benefits
in one day after its administration and beneficial effects remain constant for
a period that is longer than the simulation horizon (that is, six months).
The exact expressions of all the mathematical functions modeling such a
phenomenon and details on their estimations are reported in S1 Appendix.
Agents 12 years and older can vaccinate. We model local vaccine hesi-
tancy using an upper bound on the vaccination coverage in the town. Specif-
ically, no more than 64,364 people are considered as eligible for vaccination
(approximately the 81% of the population), computed as a projection based
on the temporal evolution of the number of new vaccinations in New York
State [1,56], re-scaled to the population of New Rochelle. An agent is consid-
ered fully vaccinated two weeks after their shot of a one-dose vaccine, or two
weeks after the second shot of a two-dose vaccine. A fully vaccinated agent is
more socially active, and is more likely to visit other agents or non-essential
venues, as detailed in Table 4.
Contact tracing
Contact tracing is implemented in the model by complying with local guide-
lines [14, 47, 48], in accordance to their stricter version issued in winter 2021.
When an agent is tested positive to COVID-19 (we contemplated a realis-
tic quota of false positives corresponding to 5% of the tests [23, 34]), their
household members and all the agents with whom they carpool, in case this
is their transit mode to work, are immediately home-isolated.
11Moreover, a predetermined number of coworkers is home-isolated. To ac-
count for realistic implementation of contact tracing, we bound the maximum
number of home-isolated coworkers to a given value of 10 and the same upper
bound is used throughout for schools and residents. In particular, contact
tracing of a retirement home employee results in home-isolating 10 residents
in addition to coworkers. Conversely, a confirmed positive resident leads to
home-isolating 10 other residents and employees. With respect to schools,
the granularity of our model was set to the single school. Hence, contact
tracing of a student who tested positive is modeled by home-isolating 10
students of the same age from that agent’s school, plus one teacher. The
same logic applies also upon tracing a teacher, with a random choice of 10
same-aged students to be home-isolated.
Finally, since agents visit each other in private, we model contact trac-
ing imposing home-isolation to the entire households visited by a COVID-19
positive agent during the course of 14 days preceding the time the agent was
determined positive, according to local policies. Due to the limited supervi-
sion on restrictions to private visits, we accounted for reduced compliance,
estimating such a parameter from the literature, see Table 4.
In the model, home-isolation is implemented by placing the agent in home
isolation for a period of 10 days. Afterwards, the agent continues to moni-
tor themselves for COVID-19 symptoms for a duration of 4 days, reflecting
the guidelines. If during this two-week period the agent develops COVID-19
symptoms, they are assigned to an adequate treatment, regardless their test-
ing status. Finally, following the guidelines, fully vaccinated agents still have
to home-isolate, and negative test results do not shorten the home-isolation
duration.
Simulation setup
Simulations are initialized with a predetermined number of COVID-19 in-
fected agents in the two phases of the disease, that is, exposed or symp-
tomatic, to mimic real conditions in the town. These initial cases can be
in different testing stages and undergo treatment. An initial number of vac-
cinated agents is also contemplated, based on the data collected from the
vaccination campaign put in place between January 2021 and the start of
the simulation. We assume that each of the 51,342 individuals already vac-
cinated at the beginning of the simulations has received their first shot in a
randomly chosen day between the beginning of the vaccination campaign in
12January 2021 and September 7th 2021 (see S1 Appendix for the distribution
of first shots), resulting in different level of immunity at the beginning of the
simulations for these vaccinated agents.
Model parameters related to vaccinations and contact tracing are based
on the literature and official releases from the CDC [57], as detailed in the
above. The characteristics of different vaccine types are based on official
CDC and Food and Drug Administration (FDA) releases [58–63] and are
outlined in detail in S1 Appendix. As indicated therein, in the absence of
confirmed values, we either interpolated between the known benefit levels,
or we used them for scaling. The parameters used in our contact tracing
practices are also listed in Table 4, where our assumptions on the number
of contacts each agent has in their workplaces, schools, and other visited
locations, are detailed. The complete parameter set and all the modeling
assumptions are detailed in Table 4.
Simulations are performed with a time-resolution of six hours. The
complete computational framework, including code needed to reproduce the
study is available through our GitHub repository. The database is accessible
through https://github.com/Dynamical-Systems-Laboratory/NR-population-revac
and the agent-based model through https://github.com/Dynamical-Systems-Laboratory/
ABM-COVID-revac.
Results
Our simulations projected COVID-19 spreading over a time span of six
months starting from September 7th 2021. At this time, most of the town
residents eligible for a vaccine had received their vaccination earlier in the
year. Specifically, 51,342 residents were vaccinated with at least one dose as
of September 7th 2021 [56]. As the first dose was administered in January
2021, during the six-month simulation window many of the vaccinated resi-
dents would lose their immunity (see Fig. 6b). The types of the vaccines and
their effects mirrored those that were distributed in the area and included
the two double-dose vaccines (Moderna and Pfizer) and one single-dose vac-
cine (Johnson&Johnson), see Table 5. Per the original, August 2021 CDC
guidelines, an agent was set to start losing their immunity at approximately
eight months after they become fully vaccinated [2]. At this time, they be-
come eligible for a booster shot, which would restore their peak resistance
to the virus, thereby immunizing again the population at the rate set by the
13administration. Booster shots in the model are distributed alongside regular
vaccination doses. In every simulation, only a fixed number of agents can be
administered with vaccination each day, in the form of booster or first shots,
with no particular prioritization. For example, a rate of twenty vaccines per
day implies that twenty randomly chosen, eligible agents will receive their
vaccine dose that day, either their first or their booster shot, according to
their vaccination status.
Curbing an upcoming wave requires a vaccination rate
at least equal to the rate in spring 2021
To quantify the impact of the vaccination rate on the spread of COVID-19,
we performed simulations with two different rates: 0.58% and 0.11% of the
total population per day. These two values correspond to the maximum first-
dose vaccination rate attained at the beginning of April 2021 and the rate
registered in early September 2021, respectively [56]. The former represents
an optimal scenario, which can be achieved only if local authorities implement
large, temporary vaccination centers or other viable alternatives; the latter
could be considered as a worst case scenario of low vaccination rate.
In our simulations, whose outcome is illustrated in Fig. 3, we assumed
that highly effective testing practices were enacted during the entire period.
In particular, we hypothesized that each symptomatic agent was tested with
probability equal to 80%, while such a probability was reduced to 40% for
asymptomatic agents. These parameters are representative of optimal testing
practices [64], and they are used to illustrate that, even under optimistic
assumptions on the efficacy of testing practices, low vaccination rates may
lead to tremendous increases in infections and death toll.
We compared the number of infections and death toll for the two vacci-
nation rates for six months starting from September 7th , 2021. Results from
Fig. 3 show that, for the higher vaccination rate (green curves), the number
of active cases should start decreasing from mid-October. The average peak
of active cases should exceed 400 active cases per day, and then it should
quickly drop in few weeks, potentially reaching the end of the outbreak at
the beginning of 2022. On the contrary, the current vaccination rate (red
curves) would lead to a 50% increase in number of cases per day during fall
2021. Even more alarming is the projection that it would not be sufficient
to eradicate the disease, leading to a possible slow rise in number of cases
14Peak vaccination rate September 2021 vaccination rate
×103 ×103
1.4 1.4
1.2 1.2
Number of active cases
Number of active cases
1 1
0.8 0.8
0.6 0.6
0.4 0.4
0.2 0.2
0 0
Sept 7 Nov 6 Jan 5 Mar 6 Sept 7 Nov 6 Jan 5 Mar 6
Time, days Time, days
×103 ×103
6 12
5 10
Number of infections
Number of infections
4 8
3 6
2 4
1 2
0 0
Sept 7 Nov 6 Jan 5 Mar 6 Sept 7 Nov 6 Jan 5 Mar 6
Time, days Time, days
12 50
10
40
Number of deaths
Number of deaths
8
30
6
20
4
10
2
0 0
Sept 7 Nov 6 Jan 5 Mar 6 Sept 7 Nov 6 Jan 5 Mar 6
Time, days Time, days
Fig 3. COVID-19 spreading over six months from September 7th
2021, amid two different vaccination campaigns. Active cases, total
number of infections, and total deaths for the next six months at either
peak vaccination rate of 0.58% population/day (green) or present
vaccination rate of 0.11% population/day (red). For each scenario, 100
independent realizations are shown and their average is highlighted. The
vertical lines denote the date at which the entire non-hesitant eligible
population is expected to be vaccinated with at least one shot.
15during winter 2022, and potentially a resurgent wave in spring 2022. These
results indicate the need to maintain a fast pace during the booster cam-
paign toward curbing potential upcoming waves and quickly eradicating the
disease.
In all the simulations, we observed an initial phase in which the number of
cases steadily increases. We believe that such an increase could be caused by
an underestimation of the initial number of infected individuals, due to under-
detection in the officially reported data used to initialize the simulations.
However, such an initial increase does not impact our insights into the effects
of waning immunity, as more than 88% of the individuals vaccinated during
spring and summer 2021 has still full immunity at the end of October 2021
(see Fig. 6b).
Testing is still needed, even with high vaccination rates
We also investigated the role of testing and contact tracing implemented
during the booster shot campaign, toward elucidating the impact of these
practices, their interplay with the vaccination rate, and, ultimately, to un-
derstand whether massive testing campaigns are still needed in this phase.
We conducted a parametric study by varying the vaccination rate and the
overall efficacy of testing practices over a two-dimensional grid. Specifically,
we considered re-vaccination rates ranging between 0.01–5% of the popula-
tion per day. These two extreme values represent scenarios in which the
entire re-vaccination campaign would last more than 20 years or just 20 days.
For context, the first-dose peak vaccination rate was 0.58% during April 2021
and the lowest rate was 0.027% in mid-summer 2021 [56]. The efficacy of
the testing practices was encapsulated by a global parameter, termed “test-
ing efficacy,” which measures the probability that a symptomatic agent is
tested. In the simulations, we varied such a parameter from 10% to 100%,
representing scattered to ideal testing.
We performed these parametric studies within three different detection
scenarios, according to the ability of detecting pre-symptomatic and asymp-
tomatic agents (hereby, referred to as exposed): high detection (in which
exposed agents are tested with the same probability of symptomatic ones),
medium detection (in which the probability for an exposed individual to be
tested is reduced by 50% with respect to the one of a symptomatic agent),
and low detection (in which exposed agents reduce the probability of being
tested to 10% of the one of symptomatic agents). While high detection of
16High detection of exposed Moderate detection of exposed Low detection of exposed
Total infected ×103 Total infected ×103 Total infected ×103
90 150 300
5 0. 5 5
2×10
7×
1×1
7×10³ 80
20×10
2× 1
20×
10×10
30×10
3.5×10
10 3
50×10
%(population)/day
2 2 125 2 250
%(population)/day
0
3
%(population)/day
Vaccination rate,
3
0
10
70
Vaccination rate,
3
Vaccination rate,
3
3
1 1 1
3
3
3
3
1×1 60 100 200
03 5×1 30×10 3
0.5 3. 2×1
03
0.5 20 10 03 0.5 50×10 3
50 ×1 100
7×
5× ×1 50×1 3
10 3 03 03 ×10 3 0
10
0.2 2×10 3 0.2 75 0.2 150
3
5×
40 10 3 100
50
0.1 0.1 0.1 ×10 3
×1
10
30 50 100
0
3.
20
3
20
×1
0.05 10
5×
0.05 0.05
7× 1
0×
25×10
×1
0×
0
10
3
20
10
3
10 3
0
3
0
3
0.02
3
0.02 25 0.02 50
3
10
0.01 0.01 0.01
0 0 0
10
20
30
40
50
60
70
80
90
0
10
20
30
40
50
60
70
80
90
10
20
30
40
50
60
70
80
90
0
0
10
10
10
Testing efficacy, % Testing efficacy, % Testing efficacy, %
Total deaths Total deaths Total deaths
350 600 1250
1500
5 5 5 10
5
10
20
10
2 300 2 500 2 1250
%(population)/day
%(population)/day
1000
%(population)/day
20
Vaccination rate,
Vaccination rate,
Vaccination rate,
1 250 1 1 20
5 10 400 50 1000
0.5 10 0.5 0.5 50 20
2 5 200 50 20 10 150 50 750
50 5 10 5 10 150
0.2 0.2 10
0
20 300 0.2 150
750
300
10 150 50 600
500
0.1 0.1 20 0.1
100
20
200 300 500
25
0
0.05 100 0.05 0.05
60
100
10
200
50
0.02 0 300 250
00
0.02 50 0.02 100 250
50
0.01 0.01 0.01
0 0 0
10
20
30
40
50
60
70
80
90
0
10
20
30
40
50
60
70
80
90
0
10
20
30
40
50
60
70
80
90
0
10
10
10
Testing efficacy, % Testing efficacy, % Testing efficacy, %
Fig 4. Interplay between re-vaccination rates and testing efficacy.
Two-dimensional heat-maps showing the combined effect of vaccination rate
and testing efficacy on the total number of infected and deaths over a
period of six months starting from September 7th 2021. Three different
detection levels of exposed agents capture a range of contact tracing efforts.
exposed is ideal —but likely unrealistic, since asymptomatic infections are
more difficult to be detected without a massive implementation of testing
practices and contact tracing— medium detection could be a realistic proxy
of testing practices seen since the onset of the pandemic [64], and low de-
tection could potentially represent a scenario in which most routine testing
practices are disbanded.
Our results, shown in Fig 4, highlight the need to continue testing during
the upcoming booster shot campaign. In particular, for all the examined
detection scenarios, testing less than 20–30% of symptomatic agents always
resulted in a dramatic increase of infections and deaths. To overcome the
ensuing surge it would necessary to apply unprecedentedly high vaccination
rates of 1–5% of the total population per day, likely beyond the capacity of
the healthcare system that we have seen in spring 2021.
Our results also emphasize that detecting pre-symptomatic and asymp-
tomatic agents is a critical issue. In fact, for all combinations of re-vaccination
rate and testing efficacy, reduced detection of such agents results in a many-
fold increase of total number of infections and deaths. For example, with low
17detection of exposed agents (third scenario, in blue in Fig. 4), the number of
deaths may exceed over 600 (that is, approximately 0.8% of the population
of the town), reaching peaks of more than 1,000 deaths in the worst case
scenarios of both low testing efficacy and low re-vaccination rates.
Discussion
The chief goal of this work was to systematically analyze the spread of
COVID-19 in the upcoming 2021 fall/winter season, as immunity gained
due to vaccination wanes over the year and testing practices change. Toward
this aim, we extended a mathematical model designed in our previous ef-
forts [23, 34], a high-resolution ABM of a medium-sized U.S. town faithfully
reproducing spatial layout, demographics, and lifestyles of urban areas, to
quantify the effects of a range of vaccination and testing efforts. As in our
previous studies, we focused on the town of New Rochelle, NY, which was the
location of one of the first COVID-19 outbreaks in the U.S.. New Rochelle
is representative of many towns in the country and is characterized by high
levels of diversity and potential inequalities [44, 45].
Complementing our earlier efforts, we enhanced the capabilities of the
computational framework along three main directions. First, we considered
realistic types and administration of vaccines, as well as time-varying vacci-
nation benefits, including waning immunity after a tunable period [36–39]
and administration of a booster shot [2]. Second, natural immunity achieved
through recovery was also considered to be no longer permanent [50, 51].
Third, we modeled contact tracing, consistent with the CDC and local health
department guidelines [14,47,48]. Overall, the current model is a highly real-
istic and detailed digital representation of the town and its residents, with the
resolution of a single individual, thus allowing for reliable “what-if” analyses
of the epidemic during the upcoming fall/winter season. Equipped with a
new parameter set tuned on the now-dominant Delta variant, we studied the
local outcome of the interplay between the rate of vaccination and efficacy
of testing practices.
Predictably, we found that low testing efficacy may lead to a disastrous
increase in both infections and deaths, irrespective of vaccination efforts of
any intensity. In fact, low testing efficacy seems to hamper any benefits
that would be offered by realistic re-vaccination campaigns. The final count
of cases and casualties would be substantially independent of vaccination
18rates, unless booster shots were administered to more than 1% population
per day (an unrealistic scenario, since it exceeds the peak vaccination rate
during spring 2021). For low-to-moderate testing efficacy, vaccination rates
below 0.5% consistently lead to a case and death toll comparable with those
experienced during the first wave [23].
These results, in agreement with other studies on testing practices during
previous phases of the COVID-19 pandemic [27,65], highlight the central role
of testing, contact tracing, and home-isolation in the fight against COVID-19
and echo the “Path out of the Pandemic,” presented by the U.S. Government
on September 10th , 2021, as part of “President Biden’s COVID-19 Plan” [66].
To contain COVID-19 mortality below the level of the first wave, we
predict that at least 0.5% of population per day should be immunized/re-
immunized, as testing and contact tracing are carried out with moderate ef-
ficacy. Such a 0.5% vaccination rate is not unreasonable, as it is comparable
to the average vaccination rate during the peak of the spring 2021 vaccina-
tion campaign [56]. However, such a peak vaccination rate was accompanied
by large, temporary vaccination centers that no longer exist. Hence, local
authorities might need to restore these temporary vaccination centers or pro-
vide viable alternatives, to keep the administration of boosters at the desired
rate. On the contrary, vaccination rates below 0.5% might lead to scenarios
that are worse than those recorded in spring 2020 [67]. In particular, using
a vaccination rate equal to that adopted in September 2021 would lead to a
potentially disastrous rise in the number of infections around the beginning
of 2022. While the number of deaths projected in this scenario are still lower
than those occurred in the first wave, likely due to reduced mortality rates of
vaccinated individuals, the steep increase portends that this number would
ultimately overcome first wave figures.
These projections emphasize the importance for a booster shot, in line
with the “President Biden’s COVID-19 Plan” [66] that highlights the need
of “further protecting the vaccinated” (with the booster shot). To efficiently
combat the spread, the booster shot campaign should be conducted on a scale
close to the one implemented during the peak immunization efforts in spring
2021. Similar conclusions have been drawn by other authors. For example,
Layton et al. [4] report doubling of deaths by late December 2021 in Ontario,
Canada, as a consequence of reducing the baseline vaccination rate by 20%.
Sandmann et al. [41] predict the occurrence of up to two annual COVID-19
waves in the UK, whose magnitudes are strictly tied to vaccine efficacy and
active NPIs. In the worst case scenario, it is expected that there will be a
19new wave this fall, with a magnitude comparable, or even higher, than the
one observed during 2020. Similarly, Song et al. [40] indicate reoccurring new
surges in the worst cases of vaccination efficacy and immunity duration, and
a constant, but non-zero COVID-19 incidence in the best scenarios, starting
from mid-2021.
Testing of symptomatic individuals plays a key role in controlling the
spread, especially when it is accompanied by moderate contact tracing efforts.
Seen from another perspective, testing a mere 40% of the symptomatic indi-
viduals with moderate contact tracing efforts should avoid exceeding mor-
tality rates of the first wave. Beyond a 60% testing efficacy, the effect
of increased testing is diluted and higher vaccination rates are needed to
bring‘ down mortality rates. While testing levels of 40% or above are achiev-
able [68], as they are comparable with the estimates for the late summer 2020
in France [64] they are still challenging to attain. Reducing delays in testing
and contact tracing could offer a pathway to mitigate difficulties in reaching
high testing levels [26, 27].
Likewise, the detection of asymptomatic individuals is of paramount im-
portance to combat the spreading. In particular, going from high- to low-
detection of such individuals more than doubles the number of cases and
deaths. This finding is consistent with the literature, whereby efficacious
tracking of the asymptomatic individuals has been shown to arrest the pro-
gression of the spread of the virus [69,70]. High detection rates can be realized
with aggressive contact tracing strategies that can identify stranger contacts
in addition to close contacts [71]. At the same time, while it is reasonable
that most people who develop symptoms or are informed of exposure to an
infected individual will isolate, and possibly test, detecting asymptomatic
individuals could become progressively more difficult, especially with gen-
eral decline in social distancing practices and lifting of mandatory testing by
many employers and institutions [13].
While insightful, our results are not free from limitations. Though cali-
brated in real data, the high granularity of our model comes at a cost of a
series of assumptions. Importantly, immunity due to vaccination was mod-
eled based on educated guesses due to limited data availability. Except for
waning immunity benefits from vaccination, all the parameters in our simu-
lations were time-invariant; in real settings factors such as NPIs or testing
coverage are likely to change in response to emerging situations [72, 73] and,
likewise, vaccination rates to dynamically change. Moreover, we tested the
general, uninfected population in a non-random fashion, and contact trac-
20ing guidelines within our model were more conservative than those currently
in-place.
Concerning the timing and profile of waning immunity, in our study we
made several assumptions based on the knowledge available at the time of
writing the paper. We acknowledge that the scientific community has yet to
reach complete consensus, even at the time of the revision of the manuscript.
Specifically, we set immunity benefits from vaccination to start to gradually
wane after a period of eight months from peak-level immunity. This is in ac-
cordance with recent studies on the humoral and cellular immune responses,
which indicates eight-months as a lower-bound on this period [36, 37]. How-
ever, other studies suggest different, and potentially shorter, timings [38, 39],
thereby conclusive evidence is yet to be established [43]. Similar uncertainty
seems to be present on the duration of natural immunity [50–53], which, in
this work, was chosen to last for six months. To partially address these uncer-
tainties, we performed the parametric study in Figure 7, Figure 8, Figure 9,
and Figure 10, which ensure that our qualitative findings and observations
are robust to changes in the timing and profile of the waning immunity.
The study design was based on information about the pandemic gathered
during summer 2021. In particular, in the original (August 2021) schedule,
booster shots were planned to be available to all the adults in the U.S. eight
months after they took their second vaccine dose [2]. This schedule has
changed between the time of the submission and its revision (October 2021),
as currently COVID-19 vaccine booster shots are available for some categories
of Pfizer-BioNTech vaccine recipients who completed their initial series at
least six months ago [74]. New changes to such a plan are expected in the
next few weeks, as the FDA has approved booster shots for Moderna and
Johnson&Johnson on October 20th [75], and the “President Biden’s COVID-
19 Plan” suggests “to quickly get booster shots into the arms of eligible
Americans once approved” [66]. As scenarios are rapidly changing, we have
opted to adhere to the original CDC guidelines for our simulations. We
believe that the additional simulations in Figure 7 and Figure 8 provide
some insights into this issue, suggesting that the rate of vaccination is more
important than its actual timing, to avoid potential, resurgent outbreaks in
late winter/spring 2022.
The need to administer booster shots must also be put in context with
respect to medical, social, and moral concerns [3, 76]. First, the waning of
immunity is still not confirmed with certainty [43], and the health effects
of an additional dose remain, to some extent, unexplored [3]. It cannot be
21excluded that an additional dose may only selectively boost the efficacy for
individuals who are immunocompromised or whose initial vaccination had low
efficacy [77]. Also, any adverse effects of the booster dose may have a negative
impact to the vaccine acceptance [77]. Second, with less than 5% of the
populations in low income countries being fully vaccinated, the World Health
Organization has deemed every booster shot as “ethically questionable” and
warned that unmitigated COVID-19 pandemic in those areas will continue
yielding new variants [76, 78]. Despite these concerns, countries have already
started their booster shot campaigns in an attempt to curb the risk of new
surges and restrictions [79]. These decisions are likely driven by the Delta
variant, which dilutes the herd-immunity thresholds estimated for the wild-
type strain [80–83].
Acknowledgments
We would like to acknowledge Maya Fayed and Sihan (Silvia) Wei for up-
dating the town database, identifying part of the new model parameters,
and introducing the code for the out-of-town non-essential locations. The
work of AT and MP was partially supported by National Science Foundation
(CMMI-1561134 and CMMI-2027990). The work of EC, ZPJ, and AR was
partially supported by National Science Foundation (CMMI-2027990). The
work of SB was partially supported by National Science Foundation (CMMI-
2027988). The work of AR was partially supported by Compagnia di San
Paolo. The funders had no role in study design, data collection and analysis,
decision to publish, or preparation of the manuscript.
Authors contribution
Conceptualization—AT, LZ, SB, AR, MP; data curation—AT; methodology—
AT, LZ, SB, AR, MP; software—AT, SB; validation—AT; formal analysis—
all the authors; investigation—all the authors; resources—MP; writing—original
draft preparation—AT, LZ, SB, AR, MP; writing—review and editing—
EC, ZPJ; visualization—AT; supervision—SB, EC, ZPJ, AR, MP; project
administration—MP; funding acquisition—SB, ZPJ,AR, MP.
22References
1. Mathieu E, Ritchie H, Ortiz-Ospina E, Roser M, Hasell J, Appel C,
et al. A global database of COVID-19 vaccinations. Nature Human
Behaviour. 2021;5(7):947–953. doi:10.1038/s41562-021-01122-8.
2. Centers for Disease Control and Prevention. Joint statement from
HHS public health and medical experts on COVID-19 booster shots;
2021. Available from: https://www.cdc.gov/media/releases/2021/
s0818-covid-19-booster-shots.html.
3. Mahase E. Covid-19 booster vaccines: What we know and who’s doing
what. BMJ. 2021;374:n2082. doi:10.1136/bmj.n2082.
4. Layton A, Sadria M. Understanding the dynamics of SARS-CoV-2
variants of concern in Ontario, Canada: A case study. Research Square
[preprint]. 2021;doi:10.21203/rs.3.rs-788073/v1.
5. Mahase E. Covid-19: Booster vaccine to be rolled out in au-
tumn as UK secures 60m more Pfizer doses. BMJ. 2021;373:n1116.
doi:10.1136/bmj.n1116.
6. Mahase E. Covid-19: Booster dose will be needed in autumn to avoid
winter surge, says government adviser; 2021.
7. Centers for Disease Control and Prevention. Trends in number
of COVID-19 cases and deaths in the US reported to CDC, by
state/territory; 2021. Available from: https://www.cdc.gov/media/
releases/2021/s0818-covid-19-booster-shots.html.
8. Centers for Disease Control and Prevention. COVID data tracker: vari-
ant proportions; 2021. Available from: https://covid.cdc.gov/
covid-data-tracker/#variant-proportions.
9. Centers for Disease Control and Prevention. When You’ve Been
Fully Vaccinated; 2021. Available from: https://www.cdc.gov/
coronavirus/2019-ncov/vaccines/fully-vaccinated.html.
10. U S Department of Education. U.S. Department of Education
releases “Return to School Roadmap” to support students,
23schools, educators, and communities in preparing for the 2021-
2022 school year; 2021. Available from: https://www.ed.gov/
news/press-releases/us-department-education-releases-
%E2%80%9Creturn-school-roadmap%E2%80
%9D-support-students-schools-educators-and-communities-preparing-2021-2022-s
11. The New York Times. Delays, more masks and mandatory
shots: virus surge disrupts office-return plans; 2021. Avail-
able from: https://www.nytimes.com/2021/07/23/business/
return-to-office-vaccine-mandates-delta-variant.html.
12. Hasell J, Mathieu E, Beltekian D, Macdonald B, Giattino C, Ortiz-
Ospina E, et al. A cross-country database of COVID-19 testing. Sci-
entific Data. 2020;7(1):345. doi:10.1038/s41597-020-00688-8.
13. Centers for Disease Control and Prevention. Guidance for in-
stitutions of higher education (IHEs); 2021. Available from:
https://www.cdc.gov/coronavirus/2019-ncov/community/
colleges-universities/considerations.html.
14. Centers for Disease Control and Prevention. Quarantine and
isolation; 2021. Available from: https://www.cdc.gov/
coronavirus/2019-ncov/your-health/quarantine-isolation.
html?CDC AA refVal=https%3A%2F%2Fwww.cdc.gov%2Fcoronavirus
%2F2019-ncov%2Fif-you-are-sick%2Fquarantine.html.
15. Estrada E. COVID-19 and SARS-CoV-2. Modeling the
present, looking at the future. Phys Rep. 2020;869:1–51.
doi:10.1016/j.physrep.2020.07.005.
16. Vespignani A, Tian H, Dye C, Lloyd-Smith JO, Eggo RM, Shrestha
M, et al. Modelling COVID-19. Nat Rev Phys. 2020;2:279–281.
doi:10.1038/s42254-020-0178-4.
17. Della Rossa F, Salzano D, Di Meglio A, De Lellis F, Coraggio M,
Calabrese C, et al. A network model of Italy shows that intermittent
regional strategies can alleviate the COVID-19 epidemic. Nat Comm.
2020;11(1):5106. doi:10.1038/s41467-020-18827-5.
18. Arenas A, Cota W, Gómez-Gardeñes J, Gómez S, Granell C, Mata-
malas JT, et al. Modeling the Spatiotemporal Epidemic Spreading of
24COVID-19 and the Impact of Mobility and Social Distancing Interven-
tions. Phys Rev X. 2020;10:041055. doi:10.1103/PhysRevX.10.041055.
19. Goldsztejn U, Schwartzman D, Nehorai A. Public policy and eco-
nomic dynamics of COVID-19 spread: A mathematical modeling study.
PLOS ONE. 2020;15(12):1–16. doi:10.1371/journal.pone.0244174.
20. Parino F, Zino L, Porfiri M, Rizzo A. Modelling and predicting the ef-
fect of social distancing and travel restrictions on COVID-19 spreading.
J R Soc Interface. 2021;18(175):20200875. doi:10.1098/rsif.2020.0875.
21. Perra N. Non-pharmaceutical interventions during the
COVID-19 pandemic: A review. Phys Rep. 2021;913:1–52.
doi:10.1016/j.physrep.2021.02.001.
22. Du Z, Pandey A, Bai Y, Fitzpatrick MC, Chinazzi M, Pastore y Pi-
ontti A, et al. Comparative cost-effectiveness of SARS-CoV-2 test-
ing strategies in the USA: a modelling study. Lancet Public Health.
2021;6(3):e184–e191. doi:10.1016/S2468-2667(21)00002-5.
23. Truszkowska A, Behring B, Hasanyan J, Zino L, Butail S, Caroppo
E, et al. High-Resolution Agent-Based Modeling of COVID-19
Spreading in a Small Town. Adv Theory Simul. 2021;4(3):2170005.
doi:10.1002/adts.202000277.
24. Pinotti F, Di Domenico L, Ortega E, Mancastroppa M, Pullano G,
Valdano E, et al. Tracing and analysis of 288 early SARS-CoV-2 infec-
tions outside China: A modeling study. PLOS Med. 2020;17(7):1–13.
doi:10.1371/journal.pmed.1003193.
25. Bilinski A, Mostashari F, Salomon JA. Modeling Contact Trac-
ing Strategies for COVID-19 in the Context of Relaxed Physi-
cal Distancing Measures. JAMA Netw Open. 2020;3(8):e2019217.
doi:10.1001/jamanetworkopen.2020.19217.
26. Kretzschmar ME, Rozhnova G, Bootsma MCJ, van Boven M, van de
Wijgert JHHM, Bonten MJM. Impact of delays on effectiveness of con-
tact tracing strategies for COVID-19: a modelling study. Lancet Public
Health. 2020;5(8):e452–e459. doi:10.1016/S2468-2667(20)30157-2.
25You can also read