Observation and analysis of spatiotemporal characteristics of surface ozone and carbon monoxide at multiple sites in the Kathmandu Valley, Nepal
←
→
Page content transcription
If your browser does not render page correctly, please read the page content below
Atmos. Chem. Phys., 18, 14113–14132, 2018
https://doi.org/10.5194/acp-18-14113-2018
© Author(s) 2018. This work is distributed under
the Creative Commons Attribution 4.0 License.

Observation and analysis of spatiotemporal characteristics of
surface ozone and carbon monoxide at multiple sites in the
Kathmandu Valley, Nepal
Khadak Singh Mahata1,2 , Maheswar Rupakheti1,3 , Arnico Kumar Panday4,5 , Piyush Bhardwaj6 , Manish Naja6 ,
Ashish Singh1 , Andrea Mues1 , Paolo Cristofanelli7 , Deepak Pudasainee8 , Paolo Bonasoni7 , and Mark G. Lawrence1,2
1 Institutefor Advanced Sustainability Studies (IASS), Potsdam, Germany
2 Instituteof Earth and Environmental Science, Department of Geo-ecology, University of Potsdam, Potsdam, Germany
3 Himalayan Sustainability Institute (HIMSI), Kathmandu, Nepal
4 International Centre for Integrated Mountain Development (ICIMOD), Lalitpur, Nepal
5 Department of Environmental Sciences, University of Virginia, Charlottesville, Virginia, USA
6 Aryabhatta Research Institute of Observational Sciences (ARIES), Nainital, India
7 CNR-ISAC, National Research Council of Italy – Institute of Atmospheric Sciences and Climate, Bologna, Italy
8 Department of Chemical and Materials Engineering, University of Alberta, Edmonton, Canada

Correspondence: Maheswar Rupakheti (maheswar.rupakheti@iass-potsdam.de)
and Khadak Singh Mahata (khadak.mahata@iass-potsdam.de)

Received: 28 July 2017 – Discussion started: 18 December 2017
Revised: 23 August 2018 – Accepted: 4 September 2018 – Published: 5 October 2018

Abstract. Residents of the Kathmandu Valley experience se-         Atmosphere for the Kathmandu Valley – endorsed by the At-
vere particulate and gaseous air pollution throughout most of      mospheric Brown Clouds program of UNEP). The monitor-
the year, even during much of the rainy season. The knowl-         ing of O3 at Bode, Paknajol and Nagarkot as well as the CO
edge base for understanding the air pollution in the Kath-         monitoring at Bode were extended until March 2014 to inves-
mandu Valley was previously very limited but is improving          tigate their variability over a complete annual cycle. Higher
rapidly due to several field measurement studies conducted         CO mixing ratios were found at Bode than at the outskirt
in the last few years. Thus far, most analyses of observa-         sites (Bhimdhunga, Naikhandi and Nagarkot), and all sites
tions in the Kathmandu Valley have been limited to short           except Nagarkot showed distinct diurnal cycles of CO mix-
periods of time at single locations. This study extends the        ing ratio, with morning peaks and daytime lows. Seasonally,
past studies by examining the spatial and temporal character-      CO was higher during premonsoon (March–May) season
istics of two important gaseous air pollutants (CO and O3 )        and winter (December–February) season than during mon-
based on simultaneous observations over a longer period at         soon season (June–September) and postmonsoon (October–
five locations within the valley and on its rim, including a su-   November) season. This is primarily due to the emissions
persite (at Bode in the valley center, 1345 m above sea level)     from brick industries, which are only operational during this
and four satellite sites: Paknajol (1380 m a.s.l.) in the Kath-    period (January–April), as well as increased domestic heat-
mandu city center; Bhimdhunga (1522 m a.s.l.), a mountain          ing during winter, and regional forest fires and agro-residue
pass on the valley’s western rim; Nagarkot (1901 m a.s.l.),        burning during the premonsoon season. It was lower during
another mountain pass on the eastern rim; and Naikhandi            the monsoon due to rainfall, which reduces open burning ac-
(1233 m a.s.l.), near the valley’s only river outlet. CO and       tivities within the valley and in the surrounding regions and
O3 mixing ratios were monitored from January to July 2013,         thus reduces sources of CO. The meteorology of the valley
along with other gases and aerosol particles by instruments        also played a key role in determining the CO mixing ratios.
deployed at the Bode supersite during the international air        The wind is calm and easterly in the shallow mixing layer,
pollution measurement campaign SusKat-ABC (Sustainable             with a mixing layer height (MLH) of about 250 m, during

Published by Copernicus Publications on behalf of the European Geosciences Union.
14114                                           K. S. Mahata et al.: Ozone and carbon monoxide in the Kathmandu Valley

the night and early morning. The MLH slowly increases af-         the Mediterranean (Lawrence and Lelieveld, 2010).The pol-
ter sunrise and decreases in the afternoon. As a result, the      lutants are also uplifted to the tropopause by convective air
westerly wind becomes active and reduces the mixing ra-           masses and transported to the extratropical stratosphere dur-
tio during the daytime. Furthermore, there was evidence of        ing the monsoon season (Tissier and Legras, 2016; Lawrence
an increase in the O3 mixing ratios in the Kathmandu Val-         and Lelieveld, 2010; Fueglistaler et al., 2009; Highwood
ley as a result of emissions in the Indo-Gangetic Plain (IGP)     and Hoskins, 1998). Air pollution is particularly alarming
region, particularly from biomass burning including agro-         in many urban areas of South Asia, including in the city of
residue burning. A top-down estimate of the CO emission           Kathmandu and the broader Kathmandu Valley, Nepal (Chen
flux was made by using the CO mixing ratio and mixing layer       et al., 2015; Putero et al., 2015; Kim et al., 2015; Sarkar et
height measured at Bode. The estimated annual CO flux at          al., 2016; Shakya et al., 2017). This is due to their rapid ur-
Bode was 4.9 µg m−2 s−1 , which is 2–14 times higher than         banization, economic growth and the use of poor technolo-
that in widely used emission inventory databases (EDGAR           gies in the transportation, energy and industrial sectors. In
HTAP, REAS and INTEX-B). This difference in CO flux be-           Kathmandu topography also plays a major role: the bowl-
tween Bode and other emission databases likely arises from        shaped Kathmandu Valley is surrounded by tall mountains
large uncertainties in both the top-down and bottom-up ap-        and only a handful of passes. Topography is a key factor in
proaches to estimating the emission flux. The O3 mixing ratio     governing local circulations, where low MLH (typically in
was found to be highest during the premonsoon season at all       the range of 250 to 1500 m) and calm winds have been ob-
sites, while the timing of the seasonal minimum varied across     served, particularly during nights and mornings. This in turn
the sites. The daily maximum 8 h average O3 exceeded the          results in poor ventilation (Mues et al., 2017). Overall, this is
WHO recommended guideline of 50 ppb on more days at the           conducive to trapping air pollutants and the deterioration of
hilltop station of Nagarkot (159 out of 357 days) than at the     air quality in the valley. Effectively mitigating air pollutants
urban valley bottom sites of Paknajol (132 out of 354 days)       in the regions like the Kathmandu Valley requires scientific
and Bode (102 out of 353 days), presumably due to the in-         knowledge about characteristics and sources of the pollu-
fluence of free-tropospheric air at the high-altitude site (as    tants. To contribute to this urgently needed scientific knowl-
also indicated by Putero et al., 2015, for the Paknajol site in   edge base, in this study we focus on the analysis of mea-
the Kathmandu Valley) as well as to titration of O3 by fresh      surements of two important gaseous species, carbon monox-
NOx emissions near the urban sites. More than 78 % of the         ide (CO) and O3 , at multiple sites in and around the Kath-
exceedance days were during the premonsoon period at all          mandu Valley. This study analyzes data from January 2013 to
sites. The high O3 mixing ratio observed during the premon-       March 2014, which includes the intensive phase of an inter-
soon period is of a concern for human health and ecosys-          national air pollution measurement campaign (SusKat-ABC:
tems, including agroecosystems in the Kathmandu Valley            Sustainable Atmosphere for the Kathmandu Valley – Atmo-
and surrounding regions.                                          spheric Brown Clouds) conducted during December 2012–
                                                                  June 2013 (Rupakheti et al., 2018), with measurements of O3
                                                                  and CO at some sites continuing beyond the intensive cam-
                                                                  paign period (Bhardwaj et al., 2018; Mahata et al., 2017).
1   Introduction                                                     CO is a useful tracer of urban air pollution as it is primar-
                                                                  ily released during incomplete combustion processes that are
Air pollution is one of the major health risks globally. It was   common in urban areas. Forest fires and agro-residue burning
responsible for premature loss of about 7 million lives world-    in the IGP and foothills of the Himalayas are other important
wide in 2012 (WHO, 2014), with about 1.7 million in South         contributors of CO in the region (Mahata et al., 2017; Bhard-
Asian countries (India, Pakistan, Nepal and Bangladesh) in        waj et al., 2018). CO is toxic at high concentrations indoors
2013 (Forouzanfar et al., 2015). The latest report shows that     and outdoors, but our focus here is on ambient levels. The
the indoor and outdoor air pollution are each responsible for     main anthropogenic sources of CO in the Kathmandu Val-
4 million premature deaths every year (http://www.who.int/        ley are vehicles, cooking activities (using liquefied petroleum
airpollution/en/, last access: 22 August 2018). South Asia is     gas, kerosene and firewood), and industries, including brick
considered to be a major air pollution hotspot (Monks et al.,     kilns, especially biomass cofired kilns with older technolo-
2009) and it is expected to be one of the most polluted re-       gies, and until recently diesel power generator sets (Panday
gions in the world for surface ozone (O3 ) and other pollutants   and Prinn, 2009; Kim et al, 2015; Sarkar et al., 2016, 2017;
by 2030 (Dentener et al., 2006; IEA, 2016; OECD, 2016).           Mahata et al., 2017). Tropospheric O3 , which is formed by
Past studies have shown that the air pollution from this region   photochemical reactions involving oxides of nitrogen (NOx )
affects not only the region itself, but is also transported to    and volatile organic compounds (VOCs), is a strong oxidiz-
other parts of the world, including comparatively pristine re-    ing agent in the troposphere. Because of its oxidizing nature,
gions such as the Himalayas and the Tibetan Plateau (Bona-        it is also deleterious to human health and plants already at
soni et al., 2010; Ming et al., 2010; Lüthi et al., 2015), as     typically polluted ambient levels (Lim et al., 2012; Burney
well as to other distant locations such as northern Africa and    and Ramanathan, 2014; Feng, 2015; Monks et al., 2015).

Atmos. Chem. Phys., 18, 14113–14132, 2018                                         www.atmos-chem-phys.net/18/14113/2018/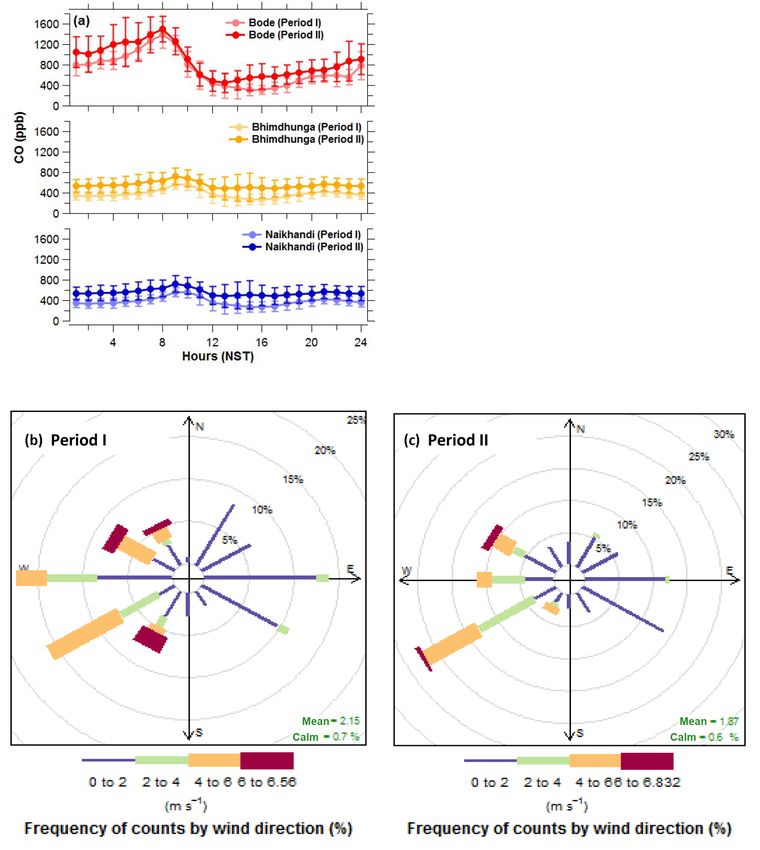
K. S. Mahata et al.: Ozone and carbon monoxide in the Kathmandu Valley                                                      14115

Tropospheric O3 is estimated to be responsible for about 5–        just south of central Kathmandu Metropolitan City (KMC)
20 % of premature deaths caused by air pollution globally          in the Kathmandu Valley. They reported seasonal O3 mixing
(Brauer et al., 2012; Lim et al., 2012; Silva et al., 2013). It    ratios to be highest during the premonsoon period (March–
has also been estimated that high concentrations of O3 are         May) and lowest in the winter (December–February). As a
responsible for a global loss of crops equivalent to USD 11–       part of the SusKat-ABC Campaign, Putero et al. (2015) mon-
18 billion annually (Avnery et al., 2011; UNEP and WMO,            itored O3 mixing ratios at Paknajol, an urban site in the cen-
2011), a substantial fraction of which is associated with the      ter of the KMC, over a full-year period (February 2013–
loss in wheat in India alone (equivalent to USD 5 billion in       January 2014). They also observed similar seasonal varia-
2010) (Burney and Ramanathan, 2014). O3 can also serve as          tions in O3 mixing ratios in the valley to those observed by
a good indicator of the timing of the breakup of the night-        Pudasainee et al. (2006), with highest O3 during the premon-
time stable boundary layer (when the ozone levels increase         soon (1 February–12 May) season, followed by the mon-
rapidly in the morning due to downward transport from the          soon (13 May–6 October), postmonsoon (7 October–26 Oc-
free troposphere; Panday and Prinn, 2009; Geiß et al., 2017).      tober) and winter (27 October–31 January) seasons. They
   Only a few past studies have reported measurements              found that during the premonsoon season, westerly winds
of ambient CO mixing ratios in the Kathmandu Valley.               and regional synoptic circulation transport O3 and its precur-
Davidson et al. (1986) measured CO in the city center              sors from regional forest fires located outside the Kathmandu
and found mixing ratios between 1 and 2.5 ppm in the               Valley. In another study conducted as part of the SusKat-
winter (December–February) of 1982–1983. Panday and                ABC campaign, 37 nonmethane volatile organic compounds
Prinn (2009) measured similar levels of CO mixing ra-              (NMVOCs) were measured at Bode, with data recording ev-
tios during September 2004–June 2005, although the main            ery second, during the winter of 2012–2013; the measure-
sources of CO shifted from biofuel-dominated air pollutants        ments included isoprene, an important biogenic precursor of
from cooking activities in the 1980s to vehicle-dominated          O3 (Sarkar et al., 2016). They found that concentrations vary
pollutants in the 2000s. The growth rate in the vehicle fleet      in two distinct periods. The first period was marked by no
has had a substantial influence on air pollution in the valley,    brick kiln operations and was associated with high biogenic
including CO and O3 . Out of 2.33 million vehicles in Nepal,       emissions of isoprene. During the second period nearby brick
close to half of them are in the Kathmandu Valley (DoTM,           kilns, which use coal mixed with biomass, were operational;
2015). Shrestha et al. (2013) estimated annual emissions of        they contributed to elevated concentrations of ambient ace-
CO of 31 kt in 2010 from a fraction of today’s vehicle fleet in    tonitrile, benzene and isocyanic acid. Furthermore, the au-
the Kathmandu Valley by using data from a field survey as in-      thors found that oxygenated NMVOCs and isoprene com-
put for the International Vehicle Emission (IVE) model. The        bined accounted for 72 % and 68 % of the total O3 production
model simulation considered motorcycles, buses, taxis, vans        potential in the first period and second period, respectively.
and three-wheelers, but did not include personal cars, trucks         Prior to the SusKat-ABC campaign there were no studies
and nonroad vehicles. The fleets studied covered ∼ 73 % of         that simultaneously measured ambient CO and O3 mixing ra-
the total fleet (570 145) registered in the valley in 2010, with   tios at multiple sites in the Kathmandu Valley over extended
motorcycles being the most common vehicle (69 % of the to-         periods of time. Past studies either focused on one long-term
tal fleet).                                                        site, or on short-term observation records at various sites
   Past studies have investigated the diurnal and seasonal         (Panday and Prinn, 2009), or they investigated the seasonal
variations of CO and O3 mixing ratios in the Kathmandu Val-        characteristics of single pollutants such as O3 at a single site
ley. Panday and Prinn (2009) observed distinct diurnal vari-       in the valley (Pudasainee et al., 2006). The most comparable
ations of CO mixing ratios and particulate matter concentra-       past study is by Putero et al. (2015), who described O3 mix-
tions observed during September 2004–June 2005 at Boud-            ing ratios at one SusKat-ABC site (Paknajol) in the Kath-
dha (about 4 km northwest of the SusKat-ABC supersite at           mandu city center observed during the SusKat-ABC cam-
Bode), with morning and evening peaks. They found for the          paign, and discussed O3 seasonal variations. There is also a
Kathmandu Valley that such peaks were created by the in-           companion study on regional CO and O3 pollution by Bhard-
terplay between the ventilation, as determined by the local        waj et al. (2018), which is based on O3 and CO mixing ratios
meteorology, and the timing of emissions, especially traffic       monitored at the SusKat-ABC supersite at Bode in the Kath-
and cooking emissions. The morning CO peak was also as-            mandu Valley for a limited period (January–June 2013) and
sociated with the recirculation of the pollutants transported      at two sites in India (Pantnagar in the Indo-Gangetic Plain
down from an elevated residual pollution layer (Panday and         (IGP) and Nainital in the Himalayan foothills). They reported
Prinn, 2009).                                                      simultaneous enhancement in O3 and CO levels at these three
   O3 was observed to have lower nighttime levels in the city      sites in spring, highlighting the contribution of regional emis-
center than at the nearby hilltop site of Nagarkot (Panday and     sions, such as biomass burning in the northwestern IGP, and
Prinn, 2009). Pudasainee et al. (2006) studied the seasonal        regional transport to broader regional-scale pollution, includ-
variations of O3 mixing ratios based on the observation for a      ing in the Kathmandu Valley. In this study, we document the
whole year (2003–2004) in Pulchowk in the Lalitpur district,       diurnal and seasonal (where applicable) characteristics and

www.atmos-chem-phys.net/18/14113/2018/                                           Atmos. Chem. Phys., 18, 14113–14132, 2018
14116 K. S. Mahata et al.: Ozone and carbon monoxide in the Kathmandu Valley
spatial distributions of CO and O3 mixing ratios based on si-
multaneous observations at several locations within the val-
ley and on the valley rim mountains over a full year, helping
to characterize the pollution within the valley and the pollu-
tion plume entering and exiting the valley. We also compute
the first top-down estimates of CO emission fluxes for the
Kathmandu Valley and compare these to CO emissions fluxes
in widely used emission datasets such as EDGAR HTAP
(Janssens-Maenhout et al., 2000), REAS (Kurokawa et al.,
2013) and INTEX-B (Zhang et al., 2009).
2 Study sites and methods
The Kathmandu Valley, situated in the foothills of the central
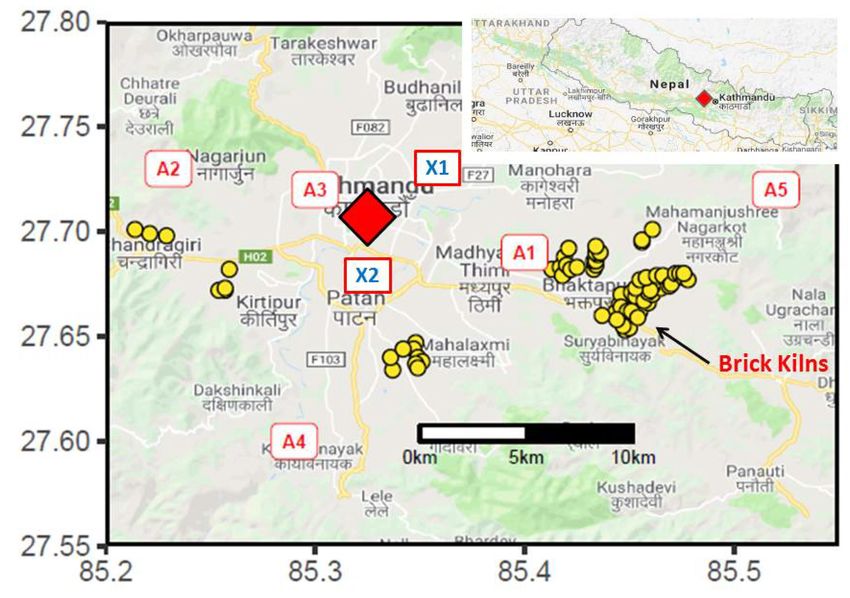
Himalayas, is home to more than 3 million people. The valley Figure 1. Observation sites in the SusKat-ABC international air
floor has an area of about 340 km2 , with an average altitude pollution campaign during 2013–2014 in the Kathmandu Val-
of about 1300 m above sea level (m a.s.l.). It is surrounded ley. A1 = Bode, A3 = Paknajol and A4 = Naikhandi were selected
by peaks of about 1900–2800 m a.s.l. The valley has five ma- within the valley floor and A2 = Bhimdhunga and A5 = Nagarkot
jor mountain passes on its rim: the Nagdhunga, Bhimdhunga on the mountain ridge. Naikhandi site is also near the Bagmati
and Mudku Bhanjhyang passes in the west, and the Nala and River outlet. Past study sites, Bouddha (X1) and Pulchowk (X2),
Nagarkot passes in the east, as shown in Fig. 1. The passes which are referred in the paper, are also shown in the figure. Source:
Google Maps.
are situated at altitudes of 1480–1530 m a.s.l. There is also
one river outlet (the Bagmati River) towards the south, which
constitutes a sixth pass for air circulation in and out of the The CO instrument was placed on the ground floor of a small
valley (Regmi et al., 2003; Panday and Prinn, 2009). We se- one-story building and its inlet was 2 m above ground. An
lected five measurement sites, including two on the valley automatic weather station (AWS) (Hobo Onset, USA) was
floor (Bode and Paknajol), two on mountain ridges (Bhimd- set up on the roof of another one-story building at a distance
hunga and Nagarkot) and one near the Bagmati River outlet of ca. 15 m from the first building.
(Naikhandi) to characterize the spatial and temporal variabil- Paknajol (27.72◦ N, 85.30◦ E; 1380 m a.s.l.) is located in
ities of CO and O3 mixing ratios in the Kathmandu Valley. A the city center in the KMC, near the popular touristic area
short description of the measurement sites is presented here of Thamel. It is in the western part of the valley and about
and in Table 1, while details on instruments deployed at those 10 km distance from the Bode supersite. The O3 and mete-
sites for this study are presented in Table 2. Further details orological instruments relevant to this study were placed on
of the measurement sites are described in the SusKat-ABC the top floor and rooftop of a six-story building, the tallest
campaign overview paper (Rupakheti et al., 2018). in the area (details in Putero et al., 2015; note that CO was
Bode (27.69◦ N, 85.40◦ E; 1344 m a.s.l.) was the supersite not measured here). The inlet of the O3 analyzer was placed
of the SusKat-ABC campaign. Bode is located in the Mad- 25 m above the ground.
hyapur Thimi municipality just east of the geographic cen- Naikhandi (27.60◦ N, 85.29◦ E; 1233 m a.s.l.) is located
ter of the valley. It is a semiurban site surrounded by urban within the premises of a school (Kamdhenu Madhyamik
buildings and residential houses scattered across agricultural Vidhyalaya) located in the southwestern part of the val-
lands. Within 4 km there are 10 brick kilns and the Bhaktapur ley (∼ 7 km south from the nearest point of the ring road).
Industrial Estate towards the southeast (refer to Sarkar et al., The school premises are open, surrounded by sparsely scat-
2016, and Mahata et al., 2017, for details). The O3 and CO tered rural houses in agricultural lands. The nearest village
instruments at the Bode site were placed on the fifth floor of (∼ 75 houses) is about 500 m away in the southwest direc-
a six-story building, the tallest in the area. The inlets of the tion. There are 5 brick kilns within 2 km distance (2 to the
CO and O3 analyzers were mounted on the rooftop of the north and 3 to the northeast) from the site. The instruments
temporary lab, 20 m above the ground level. were kept in a two-story building of the school and its inlet
Bhimdhunga (27.73◦ N, 85.23◦ E; 1522 m a.s.l.) is located was 5 m above the ground. The AWS (Hobo Onset, USA)
on the Bhimdhunga pass on the western rim of the valley. It is was installed on the ground near the Bagmati River, ∼ 100 m
one of the lowest points on the north–south-running moun- away from the main measurement site.
tain ridge between the Kathmandu Valley to the east and a
valley of a tributary of the Trishuli River to the west. It is
situated about 5.5 km from the western edge of the KMC, in
a rural setting with very few rural houses scattered nearby.
Atmos. Chem. Phys., 18, 14113–14132, 2018 www.atmos-chem-phys.net/18/14113/2018/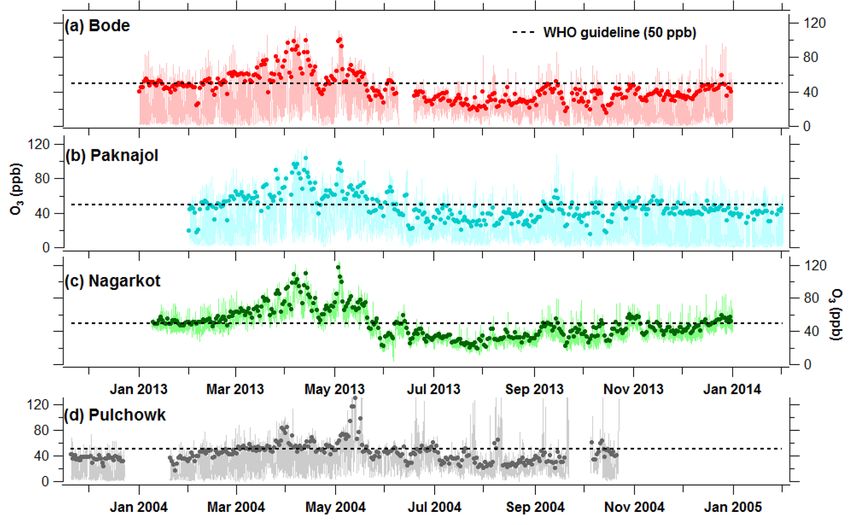
K. S. Mahata et al.: Ozone and carbon monoxide in the Kathmandu Valley                                                                                                                          14117

Table 1. Information on the sampling sites (of the SusKat-ABC campaign) used in this study. Sampling was carried out during 2013–2014
in the Kathmandu Valley. The altitude is in meters above mean sea level (m a.s.l.).

                         Site                    General setting of site                                                               Location, altitude (m a.s.l.)
                         Bode                    Suburban, tallest building with scattered houses sur-                                 27.69◦ N, 85.40◦ E, 1345
                                                 rounded by agricultural fields
                         Bhimdhunga              Rural, on the ridge, close to the pass separating                                     27.73◦ N, 85.23◦ E, 1522
                                                 the Kathmandu Valley from a valley of a tributary the
                                                 Trishuli River to the west
                         Paknajol                Urban, city center, the tallest building in the neighbor-                             27.72◦ N, 85.30◦ E, 1380
                                                 hood
                         Naikhandi               Rural, at outlet of Bagmati River in southwest corner of                              27.60◦ N, 85.29◦ E, 1233
                                                 the valley
                         Nagarkot                Rural, mountaintop site of the eastern valley rim, north-                             27.72◦ N , 85.52◦ E, 1901
                                                 facing towards the Kathmandu Valley

Table 2. Details of the instruments deployed at different sites during the observation period during January 2013–March 2014 in the Kath-
mandu Valley.

   Location           Instrument                              Parameters                             Inlet/sensor height        Duration                                            Group
                                                                                                     (above ground)
   Bode               Horiba APMA-370                         CO                                     20 m                       1 Jan–7 Jun 2013                                    ARIES
                      Teledyne 400E                           O3                                     20 m                       1 Jan–7 Jun 2013                                    ARIES
                      Thermo Scientific 49i                   O3                                     20 m                       18 Jun–31 Dec 2013                                  IASS
                      Picarro G2401                           CO                                     20 m                       6 Mar 2013–5 Mar 2014                               ICIMOD
                      Campbell AWS                            T, RH, SR, WS, WD, RF                  22 m                       1 Jan–30 Mar 2013                                   IASS
                      Davis AWS (Vantage Pro2)                T, RH, P, RF                           21 m                       30 May–Jul 2013                                     UVA
                      Ceilometer (Vaisala CL31)               MLH                                    20 m                       1 Mar 2013–28 Feb 2014                              JGUM
   Bhimdhunga         Thermo Scientific 48i TLE               CO                                     2m                         1 Jan–15 Jul 2013                                   UVA
                      AWS Hobo Onset                          T, RH, SR, WS, WD, P                   5m                         1 Jan–30 Jun 2013                                   UVA
   Naikhandi          Thermo Scientific 48i TLE               CO                                     5m                         3 Jan–6 Jun 2013                                    UVA
                      2B Tech. Model 205                      O3                                     5m                         1 Feb–25 May 2013                                   UVA
                      AWS Hobo Onset                          T, RH, SR, WS, WD, P                   2m                         3 Jan–25 Apr 2013                                   UVA
   Nagarkot           Thermo Scientific 48i TLE               CO                                     5m                         13 Feb–Apr 3 2013; 8 Jun–15 Jul 2013                UVA
                      Thermo Scientific 49i                   O3                                     5m                         9 Jan–30 Jun 2013                                   UVA
                      Campbell AWS                            T, RH, SR, WS, WD, RF                  7m                                                                             IASS
                      AWS (Vaisala WXT 520)                   T, RH, SR, WS, WD, RF, P               7m                         10 Feb–30 Jun 2013                                  RTS
   Paknajol           Thermo Environmental (49i)              O3                                     25 m                       1 Feb 2013–30 Jan 2014                              EV-K2-CNR
                      AWS (Vaisala WXT 425)                   T, RH, SR, WS, WD, RF, P               25 m                       1 Feb 2013–30 Jan 2014                              EV-K2-CNR
 Note: T – temperature, RH – relative humidity, SR – solar radiation, WS – wind speed, WD – wind direction, RF – rainfall, P – pressure and MLH – mixing layer height; ARIES – Aryabhatta Research
 Institute of Observational Sciences, India; ICIMOD – International Center for Integrated Mountain Development, Nepal; IASS – Institute for Advanced Sustainability Studies, Germany; UVA – University
 of Virginia, USA; JGUM – Johannes Gutenberg University Mainz, Germany; RTS – Real Time Solutions, Nepal; Ev-K2-CNR – Everest-Karakorum – Italian National Research Council, Italy.

   Nagarkot is located on a mountain ridge (27.72◦ N,                                                   away from the nearest edge of the city, respectively. Simi-
85.52◦ E; 1901 m a.s.l.), ca. 13 km east of Bode, in the east-                                          larly, Bode is located downwind of the city centers and thus
ern part of the valley. The site faces the Kathmandu Valley to                                          receives pollution outflow from nearby city centers of Kath-
the west and small rural town, Nagarkot, to the east. The in-                                           mandu and Lalitpur due to strong westerly and southwest-
struments were set up in a two-story building of the Nagarkot                                           erly winds (4–6 m s−1 ) during the daytime, and emissions
Health Post and their inlets were 5 m above the ground. The                                             from the Bhaktapur area to the east and southeast direction
AWS (Vaisala WXT520, Finland) was set up on the roof of                                                 by calm easterly winds (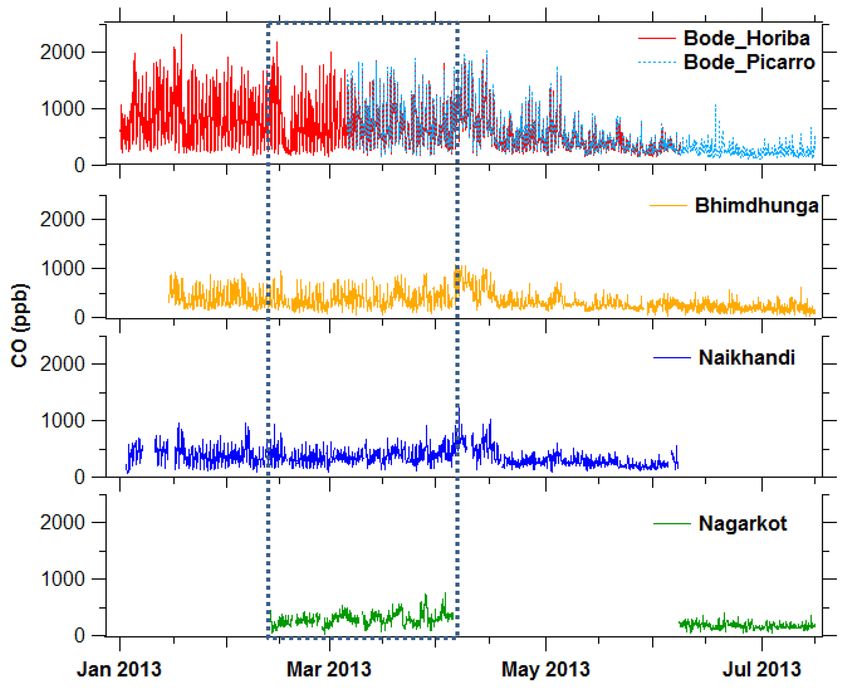
14118                                              K. S. Mahata et al.: Ozone and carbon monoxide in the Kathmandu Valley

compared with the bench model of the Horiba (APMA-370),
and the correlation (r) between them was 0.9 and slope was
1.09. The instrument was regularly maintained by running
auto-zero checks (Bhardwaj et al., 2018). Similarly, another
CO analyzer (Picarro G2401, USA), which is based on cav-
ity a ring-down spectroscopy (CRDS) technique, was also a
new factory-calibrated unit and was deployed in Bode along
with the Horiba APMA-370. The IR-based Horiba AP-370
was run simultaneously with a colocated Picarro CO analyzer
based on cavity ring-down spectrometry for nearly 3 months.
The correlation coefficient and slope between the two mea-
surements were found to be 0.99 and 0.96, respectively (Ma-
hata et al., 2017). This indicates that there was very little drift
in the IR-based CO values due to room temperature change,
within an acceptable range (i.e., within the measurement un-
certainties of the instruments). Therefore, we did not any ap-
ply correction in the IR-based CO data. All other CO analyz-
ers (Thermo Scientific, 48i TLE, USA), which are also based           Figure 2. Hourly average CO mixing ratios observed at a supersite
on IR absorption by CO molecules, deployed at Bhimd-                  (Bode) and three satellite sites (Bhimdhunga, Naikhandi and Na-
hunga, Naikhandi and Nagarkot, were set up for regular auto-          garkot) of the SusKat-ABC international air pollution measurement
matic zero checks on a daily basis. In addition, a span check         campaign during January to July 2013 in the Kathmandu Valley.
was also performed during the observations by using span              The dotted box represents a period (13 February–3 April 2013) dur-
gas of 1.99 ppm (Gts-Welco, PA, USA) on 8 March 2013 at               ing which data for all four sites were available.
Naikhandi and Nagarkot, and on 9 March at Bhimdhunga.
The IR-based CO instruments’ span drifts were within a 5 %
range.                                                                during the winter and premonsoon period than during the
   For the O3 monitor (Teledyne 400E, USA) at Bode, reg-              monsoon season at all sites. The monsoon rain generally
ular zero and span checks were carried out using the built-           starts in Nepal around mid-June. In 2013, however, there
in O3 generator and scrubber (Bhardwaj et al., 2018). This            were more frequent rain events in the month of May than
unit was used in Bode from 1 January to 9 June 2013.                  in previous years. The CO mixing ratios (measured in parts
New factory-calibrated O3 monitors (Thermo Scientific,                per billion by volume; hereafter the unit is denoted as ppb)
49i, USA) were used for the rest of the measurement pe-               of hourly averaged data over the total observation peri-
riod (18 June to 31 December 2013) at Bode, and for the full          ods at four sites and their standard deviation were Bode –
year of measurements at Nagarkot. A Thermo Environmen-                569.9 ± 383.5 ppb during 1 January–15 July, Bhimdhunga
tal O3 analyzer (Model 49i, USA) was used at the Paknajol             – 321.5 ± 166.2 ppb during 14 January–15 July, Naikhandi
site (Putero et al., 2015) with the same experimental setup as        – 345.4 ± 147.9 ppb during 3 January–6 June and Nagarkot
described in Cristofanelli et al. (2010). The working princi-         – 235.5 ± 106.2 ppb during 13 February–15 July (except
ple of all of the O3 instruments is based on the attenuation of       4 April to 7 June). Nagarkot had only about 3 months of
UV radiation by O3 molecules at ∼ 254 nm.                             CO data (due to a problem in zeroing of the instrument)
   In order to characterize observations across the seasons,          during the observation period. For the measurement period,
we considered the following seasons as defined in Shrestha            the CO mixing ratio at Nagarkot (∼ 13 km far from Bode)
et al. (1999) and used in other previous studies in the Kath-         showed small fluctuations compared with the other sites.
mandu Valley (Sharma et al., 2012; Chen et al., 2015; Ma-             High CO values in the Kathmandu Valley during the dry
hata et al, 2017): premonsoon (March, April, May), mon-               season (November–May) were also reported by Panday and
soon (June, July, August, September), postmonsoon (Octo-              Prinn (2009) based on their measurements during Septem-
ber, November), and winter (December, January, February).             ber 2004–May 2005 at Bouddha (∼ 4 km in northwest from
                                                                      Bode). The simultaneous episodes of high CO observed from
                                                                      1 to 15 April in Bhimdhunga, Bode and Naikhandi indicate
3     Results and discussion                                          the influence of regional sources, in addition to local sources.
                                                                      This is discussed further in Sect. 3.2.3.
3.1    CO mixing ratio at multiple sites

Figure 2 shows the time series of the hourly average CO mix-
ing ratios at the four sites (Bode, Bhimdhunga, Naikhandi
and Nagarkot). Fluctuations in CO mixing ratios were higher

Atmos. Chem. Phys., 18, 14113–14132, 2018                                             www.atmos-chem-phys.net/18/14113/2018/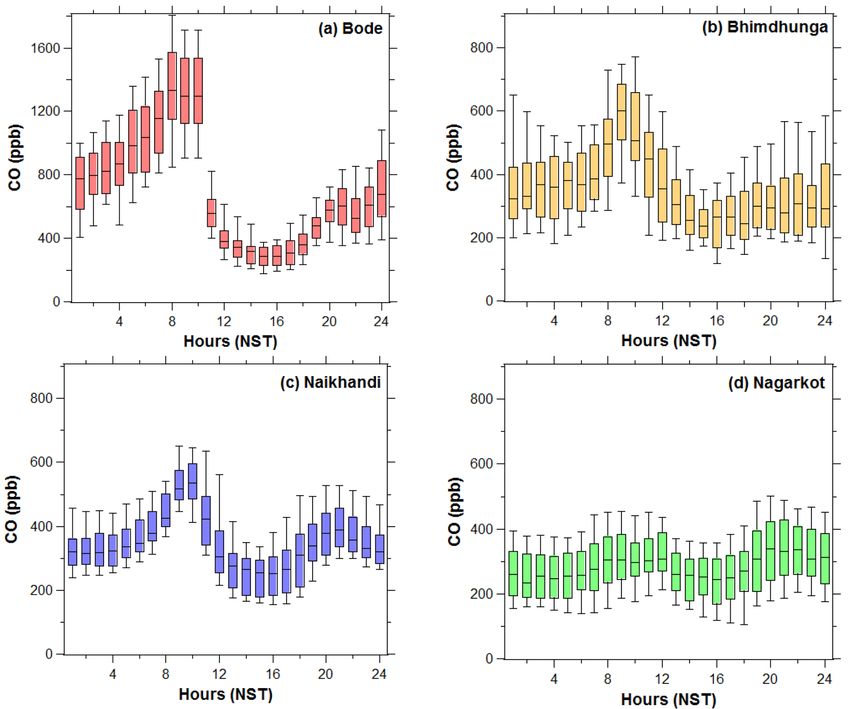
K. S. Mahata et al.: Ozone and carbon monoxide in the Kathmandu Valley                                                                14119

Figure 3. Diurnal variations of hourly average CO mixing ratios during the common observation period (13 February–3 April 2013) at Bode,
Bhimdhunga, Naikhandi and Nagarkot. The lower end and upper end of the whiskers represent the 10th and 90th percentile, respectively; the
lower end and upper end of each box represent the 25th and 75th percentile, respectively, and the black horizontal line in the middle of each
box is the median for each month. Note: the y-axis scale of Bode is twice that of the other three sites.

3.2     Diurnal and seasonal variations of CO                            in winter due to the use of the fires for providing warmth on
                                                                         colder days.
3.2.1    Diurnal pattern of CO at multiple sites                            The observed diurnal cycle of CO is similar to that re-
                                                                         ported in a previous study (Panday and Prinn, 2009) and is
                                                                         also similar to the diurnal pattern of black carbon (BC) in the
Figure 3 shows the diurnal cycles of CO mixing ratios at four            Kathmandu Valley (Sharma et al., 2012; Mues et al., 2017).
sites (plotted for the period of 13 February to 3 April 2013,            The diurnal cycles of these primary pollutants are closely
when the data were available from all four sites). The vari-             coupled with the valley’s boundary layer height, which is
ation in the mixing ratios during the day was characterized              about 1200 m during daytime and falls to approximately
by a pronounced morning peak, a weaker evening peak and                  200 m at nighttime in Bode (Mues et al., 2017). Nagarkot and
a daytime low, except at Nagarkot where peaks are less visi-             Bhimdhunga, both on mountain ridges, are generally above
ble. Multiple sources contribute to the morning and evening              the valley’s boundary layer, especially at night, and thus the
peaks, especially emission from vehicles, residential burning            diurnal profile especially at Nagarkot is distinct compared to
(fossil fuel and biomass), brick kilns and trash burning (Kim            other three sites, being relatively flat with a small dip during
et al., 2015; Sarkar et al., 2016; Mahata et al., 2017). Other           12:00–18:00 LT (local time).
studies conducted during the SusKat-ABC campaign have                       Distinct morning peaks were observed in Bode, Bhimd-
identified garbage (household waste and yard waste) burn-                hunga and Naikhandi at 08:00, 09:00 and 10:00 LT, re-
ing as a key source of various air pollutants, such as organic           spectively, i.e., the morning peak lags by 1–2 h in Bhimd-
carbon (OC), elemental carbon (EC) (Kim et al., 2015), poly-             hunga and Naikhandi compared to Bode. Bhimdhunga on the
cyclic aromatic hydrocarbons (PAHs) (Chen et al., 2015),                 mountain ridge may receive the Kathmandu Valley’s pollu-
and NMVOCs (Sarkar et al., 2016, 2017). Garbage burning                  tion due to upslope winds (∼ 2 m s−1 ) from the east direc-
is often done in small fires and quite sporadically, normally            tion in the morning hours after the dissolution of the val-
taking place in the evenings and mornings (partly chosen to              ley’s boundary layer due to radiative heating of the mountain
avoid attention from the responsible authorities). The rate of           slopes. However, Naikhandi is in close proximity to brick
waste (and also biomass) burning in the morning is higher

www.atmos-chem-phys.net/18/14113/2018/                                                  Atmos. Chem. Phys., 18, 14113–14132, 2018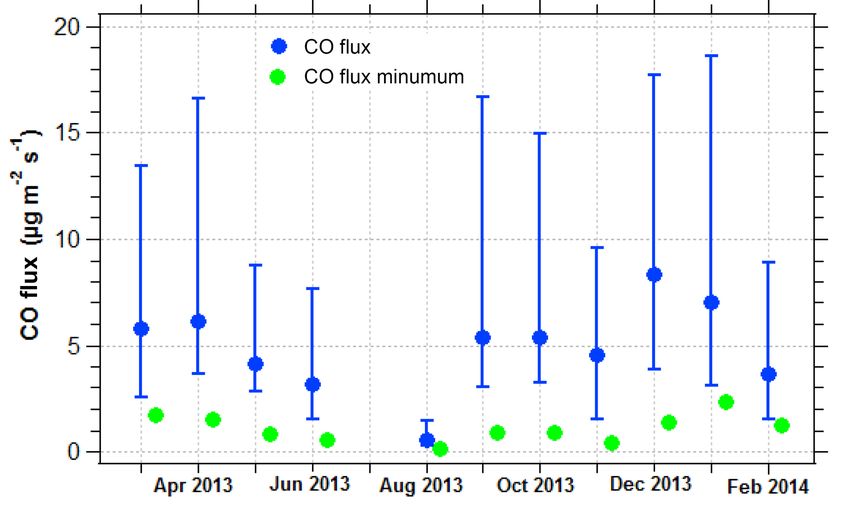
14120 K. S. Mahata et al.: Ozone and carbon monoxide in the Kathmandu Valley
kilns and could be impacted by their plumes being carried to
the site by northerly winds in the early morning (ca. 07:00-
10:00 LT, not shown). The evening peak values at Bode and
Bhimdhunga were less pronounced compared to the morn-
ing maxima. The morning peak at Bode was influenced by
nighttime accumulation of CO along with other pollutants
from nearby brick kilns (Sarkar et al., 2016; Mahata et al.,
2017; Mues et al., 2017) and recirculation of air from above
(Panday and Prinn, 2009). Similarly, the local pollution from
the nearby village and city area due to upslope winds from
the valley floor is expected to contribute to the morning
peak at Bhimdhunga. The evening peak at Naikhandi was
at 21:00 LT and was closer to the morning values in com-
parison to the large difference between morning and evening
peaks at Bode and Bhimdhunga. A nighttime buildup (lin-
ear increase) of various pollutants compared to the afternoon
minimum was typically observed in Bode during the SusKat-
ABC measurement period, including the main campaign pe-
riod (Sarkar et al., 2016; Mahata et al., 2017; Mues et al.,
2017). This is mainly associated with the persistent emis-
sions such as those from brick kilns, which are in close prox-
imity to the Bode measurement site under the stable bound-
ary layer. The isolated peak during the morning transition
phase at Bhimdhunga could be due to an elevated polluted
layer because of the slope wind (Panday et al., 2009). There
appears to be less influence of nighttime polluting sources at
Naikhandi and Bhimdhunga than at Bode.
The MLH starts increasing after radiative heating of the
surface by incoming solar radiation. The heating of the
ground causes thermals to rise from the surface layer, result-
ing in the entrainment of cleaner air from above the bound-
ary layer and leading to the dissolution of a nocturnal stable
boundary layer. Increasing wind speeds (4–6 m s−1 ) during
daytime also support turbulent vertical diffusion, as well as
flushing of the pollution by less polluted air masses from out-
side the valley, with stronger horizontal winds allowing sig-
nificant transport of air masses into the valley. In addition,
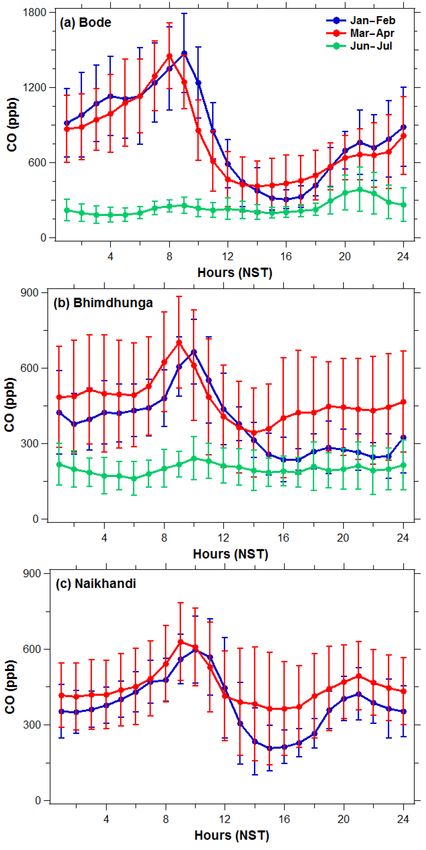
Figure 4. Comparison of diurnal variation of hourly average CO
reduced traffic and household cooking activities during day- mixing ratios for four seasons at Bode, Bhimdhunga and Naikhandi.
time compared to morning and evening rush hours contribute Due to the lack of continuous data at some sites, data of 1 month
to the reduced CO mixing ratios. in each season were taken for comparison as representative of the
winter (16 January–15 February), premonsoon (16 March–15 April)
3.2.2 CO diurnal variation across seasons and monsoon (16 June–15 July) season of 2013. Note: y-axis scale
of the top panel (Bode) is double that of the lower two panels
Due to the lack of availability of simultaneous CO data at (Bhimdhunga and Naikhandi).
all sites covering the entire sampling period, a 1-month pe-
riod was selected for each season to examine the diurnal vari-
ation across the seasons, and to get more insights into the valley, which is 60–90 % of the 1400 mm rainfall for a typical
mixing ratios at different times of the day, as reported in Ta- year (Nayava, 1980; Giri et al., 2006). Because of the rain-
ble 4. Figure 4 shows the diurnal variation of CO mixing ra- fall, the brick production activities are stopped in the valley
tios in Bode, Bhimdhunga and Naikhandi during the selected (usually they are operational from January-April every year).
periods for the three seasons. Further, the rainfall also diminishes many burning activities
The diurnal cycles during each season had different char- (forest fires, agro-residue and trash burning) within the val-
acteristics. The most prominent distinction was that the CO ley and surrounding region, and thus reduces CO emissions.
mixing ratio was low during the monsoon period over all sites Afternoon CO mixing ratios were higher in the premon-
(Fig. 4, Table 4) as a result of summer monsoon rainfall in the soon season than in the other two seasons in Bode, Bhimd-
Atmos. Chem. Phys., 18, 14113–14132, 2018 www.atmos-chem-phys.net/18/14113/2018/K. S. Mahata et al.: Ozone and carbon monoxide in the Kathmandu Valley 14121 hunga and Naikhandi (also see Table 4), with the most likely 3.2.3 Regional influence on CO in the valley sources being emissions from forest fires and agro-residue burning arriving from outside the valley during this season Recent studies have indicated the likelihood of regional long- (this will be discussed further in Sect. 3.2.3). Nighttime ac- range transport contributing to air pollution in different parts cumulation was observed in Bode and Bhimdhunga, but not of Nepal (Marinoni et al., 2013; Tripathee et al., 2014; Dhun- at Naikhandi, where the mixing ratio decreased slightly from gel et al., 2018; Rupakheti et al., 2017; Lüthi et al., 2015; about 20:00 until about 04:00 LT, after which the mixing ra- Wan et al., 2017, including the Kathmandu Valley, especially tios increased until the morning peak. The nighttime accumu- during the premonsoon period (Panday and Prinn, 2009; Put- lation of CO in Bode during premonsoon and winter is due to ero et al., 2015; Bhardwaj et al., 2018). During the premon- the influence of nearby brick kilns (Mahata et al., 2017) be- soon season, frequent agro-residue burning and forest fires cause of the calm easterly wind (refer Supplement Fig. S2 in are reported in the IGP region, including southern Nepal and Mahata et al., 2017). Previous studies carried out at the Bode the Himalayan foothills in India and Nepal (Ram and Sarin, site during the SusKat-ABC campaign have attributed over 2010; Vadrevu et al., 2012), as well as in the Kathmandu Val- a dozen brick kilns located near Bode as strong sources of ley. This season is also characterized by the strongest day- BC and EC (Kim et al., 2015; Mues et al., 2017), NMVOCs time local wind speeds (averaging 4–6 m s−1 ) in the Kath- (Sarkar et al, 2016, 2017), SO2 (Kiros et al., 2016), and CO mandu Valley (Mahata et al., 2017). Our study also observed (Mahata et al., 2017), and the enhanced concentrations were several episodes of days with both elevated CO mixing ratios observed during nighttime and mornings when winds blew (Fig. 2) and O3 mixing ratios (also measured in parts per bil- from the east and southeast, bringing emissions from the lo- lion by volume; hereafter the unit is denoted as ppb) (Fig. 5) cation of the brick kilns to the observation site. during April and May, especially during the late-afternoon Bhimdhunga is not near any major polluting sources such period. The influence of regional pollutants was investigated as brick kilns, and it is unclear whether the nighttime CO by comparing a 2-week period with normal CO levels (16– accumulation in Bhimdhunga is primarily due to ongoing lo- 30 March (hereafter “period I”) with an adjacent 2 week pe- cal residential pollution emissions and/or to pollution trans- riod (1–15 April) with episodically high CO mixing ratios ported from remote sources. The transition of the wind from (hereafter “period II”), which nicely fit with the “burst” in westerlies during the day to easterlies during the night, with regional fire activity presented by Putero et al. (2015) in their moderate wind speed (∼ 2–4 m s−1 ) at Bhimdhunga, may Fig. 9. The t tests of the two hourly data means of CO in pe- bring polluted air masses westwards that were initially trans- riod I and period II at Bode, Bhimdhunga and Naikhandi (as ported to the eastern part from the Kathmandu Valley during in Fig. 5) were performed at 95 % confidence level and the the daytime (Regmi et al., 2003; Panday and Prinn, 2009; differences were found to be statistically significant (p
14122                                           K. S. Mahata et al.: Ozone and carbon monoxide in the Kathmandu Valley

Figure 5. Comparison of hourly average CO mixing ratios during normal days (16–30 March), labeled as period I (faint color), and
episode days (1–15 April), labeled as period II (dark color), in 2013 at (a) Bode, Bhimdhunga and Naikhandi in the Kathmandu Valley.
The wind roses at Bode corresponding to two periods are also plotted (b) period I and (c) period II respectively.

nant during daytime at Bode (Fig. 5b, c). This suggests that        3.3   O3 in the Kathmandu Valley and surrounding
the elevation in CO levels was caused by additional emis-                 areas
sions in period II in the regions to the west and southwest of
the Kathmandu Valley, e.g., large-scale agricultural burning
                                                                    Figure 6 shows the hourly average and daily maximum 8 h
and forest fires during this period, as also noted by Putero
                                                                    average of O3 mixing ratios at Bode, Paknajol and Nagarkot
et al. (2015) (see their Fig. 9). Far away, in Lumbini in the
                                                                    from measurements during the SusKat campaign and after-
southern part of Nepal (Rupakheti et al., 2017) and Pantna-
                                                                    wards, along with O3 mixing ratios from a previous study
gar in northern IGP in India (Bharwdwaj et al., 2018), about
                                                                    (November 2003–October 2004; Pudasainee et al., 2006) at
220 km (aerial distance) to the southwest and 585 km to the
                                                                    the Pulchowk site (4 km away from Paknajol) in the Latit-
west of the Kathmandu Valley, respectively, CO episodes
                                                                    pur district. The daily maximum 8 h average O3 was cal-
were also observed during the spring season of 2013, pro-
                                                                    culated by selecting the maximum O3 mixing ratio from
viding a strong indication that the episode in period II was
                                                                    8 h running averages during each day. The nighttime mix-
indeed regional in nature.
                                                                    ing ratio of hourly O3 drops close to zero in Bode, Pak-
                                                                    najol and Pulchowk in the winter season. This is a typical
                                                                    characteristic of many urban areas where reaction with NO
                                                                    at night depletes O3 from the boundary layer (e.g., Talbot
                                                                    et al., 2005). In the premonsoon and monsoon months, the

Atmos. Chem. Phys., 18, 14113–14132, 2018                                           www.atmos-chem-phys.net/18/14113/2018/
K. S. Mahata et al.: Ozone and carbon monoxide in the Kathmandu Valley 14123 Figure 6. Time series of hourly average (faint-colored line) and daily maximum 8 h average (solid-colored circle) O3 mixing ratio at (a) Bode (semiurban), (b) Paknajol (urban) and (c) Nagarkot (hilltop) observed during 2013–2014, and (d) Pulchowk (urban) observed during Novem- ber 2003–October 2004 in the Kathmandu Valley. Black dotted line represents WHO guideline (50 ppb) for daily maximum 8 h average of O3 . titration is not as strong and the hourly O3 falls, but gener- most frequently during the premonsoon period and the win- ally remains above 10 ppb. Similar patterns of ozone mix- ter. During the observation period, the daily maximum 8 h ing ratios were observed at other sites in northern South average O3 exceeded the WHO guideline on 102 out of Asia. For example, higher O3 mixing ratios were observed 353 days of observation (29 %) at Bode, 132 out of 354 days in the afternoon (84 ppb) and lower during the night and (37 %) at Paknajol and 159 out of 357 days (45 %) at Na- early morning hours (10 ppb) at Kullu Valley, a semiurban garkot. The higher exceedance rate at Nagarkot is because it site located at 1154 m a.s.l., in the northwestern Himalayas is at higher altitude, which results in (i) greater exposure to in India (Sharma et al., 2013). A similar dip in O3 value in large-scale regional pollution, especially from forest fires in the dark hours was observed at Ahmedabad, India, by Lal et the Himalayan foothills and agro-residue burning in the IGP al. (2000). Nagarkot, in contrast, is above the valley’s bound- region, outside the Kathmandu Valley (Sinha et al., 2014; ary layer and has lesser NO for titration at night at this hill Putero et al., 2015); (ii) less titration of O3 by NOx , being station, as has been observed in another hill station in Hi- farther away from the main pollution sources; and (iii) ex- malayan foothills (Naja and Lal, 2002). Thus, the O3 level posure to O3 -rich free tropospheric air, including influences remains above 25 ppb during the entire year at Nagarkot. As from stratospheric intrusions. The diurnal profiles of O3 mix- also shown in Table 3, at all sites, the O3 mixing ratios were ing ratios (Fig. 7) at three sites (Bode and Paknajol in the highest in the premonsoon period, but the timing of the low- valley and Nagarkot, a hilltop site normally above the Kath- est seasonal values varied across the sites: postmonsoon in mandu Valley’s boundary layer) show, notably in the morn- Bode, winter in Paknajol and monsoon in Nagarkot. Such dif- ing hours, that the residual layer above the Kathmandu Val- ferences in minimum O3 across the sites can be anticipated ley’s mixing layer contains a significant amount of ozone. due to the locations of the sites (e.g., urban, semiurban, rural Based on the surface ozone data collected at Paknajol dur- and hilltop sites, with differing availabilities of O3 precursors ing 2013–2014, Putero et al. (2015) concluded that down- from different emission sources). The seasonal variations of ward mixing of ozone from the residual layer contributes O3 observed at Bode in this study are consistent with Putero to surface ozone in the Kathmandu Valley in the afternoon et al. (2015) and Pudasainee et al. (2006), who also observed hours (11:00–17:00 LT). It is likely that the same source has O3 maxima during the premonsoon period, but O3 minima also contributed to higher ozone mixing ratios at Nagarkot. during the winter season. Such mixing has been observed at other sites as well. Wang The daily maximum 8 h average O3 mixing ratio (solid et al. (2012) reported the increase in downward mixing of colored circles in Fig. 6) exceeded the WHO recommended O3 from the stratosphere to the middle troposphere (56 %) guideline of 50 ppb (WHO, 2006, black dotted line in Fig. 6) and the lower troposphere (13 %) in spring and summer in www.atmos-chem-phys.net/18/14113/2018/ Atmos. Chem. Phys., 18, 14113–14132, 2018
14124                                                           K. S. Mahata et al.: Ozone and carbon monoxide in the Kathmandu Valley

Table 3. Summary of the monthly average ozone mixing ratios (ppb) at four sites∗ in the Kathmandu Valley, Nepal during 2013–2014 and
two sites (Manora Peak and Delhi) in India. Avg – average, SD – standard deviation, Min. – minimum, Max. – maximum.

                                               Bode                           Paknajol                        Nagarkot             Manora                 Delhib
                                                                                                                                    Peaka
   Month                Avg ± SD (Min., Max.)              Avg ± SD (Min., Max.)                Avg ± SD (Min., Max.)          Avg ± SD       Avg (Min., Max.)
   January               23.5 ± 19.9 (1.4, 87.1)          16.9 ± 18.3 (0.1, 71.7)∗               46.7 ± 5.7 (36.4, 73.7)     37.3 ± 14.8        19.3 (10, 14.7)
   February              25.6 ± 20.4 (1.2, 94.5)           24.2 ± 20.1 (1.6, 91.7)               47.5 ± 7.5 (28.2, 83.6)     43.8 ± 16.8      25.3 (10.9, 55.7)
   March                37.4 ± 24.3 (1.2, 105.9)           37.7 ± 23.8 (1.6, 95.8)               62.4 ± 9.5 (40.5, 98.9)     56.6 ± 11.4        29.7 (13.8, 58)
   April                43.4 ± 26.6 (1.4, 116.2)          46.7 ± 26.8 (1.0, 115.5)            71.5 ± 15.5 (40.1, 121.0)      63.1 ± 11.7        33 (13.7, 64.3)
   May                  38.5 ± 21.2 (2.0, 111.1)          42.8 ± 20.6 (6.7, 103.3)            59.0 ± 20.6 (15, 0, 124.5)     67.2 ± 14.2        35.4 (19.8, 62)
   June                  27.8 ± 12.0 (1.7, 68.4)           27.5 ± 17.0 (0.6, 90.7)                34.2 ± 9.1 (4.6, 72.0)     44.0 ± 19.5      25.6 (12.8, 46.4)
   July                   21.1 ± 9.5 (1.7, 82.0)           20.5 ± 13.4 (2.0, 77.9)               25.9 ± 6.2 (11.1, 48.0)      30.3 ± 9.9       19.1 (9.4, 37.1)
   August                 20.3 ± 9.9 (2.0, 70.9)           20.1 ± 12.6 (0.8, 73.1)               28.3 ± 5.8 (15.5, 62.9)      24.9 ± 8.4       14.3 (9.7, 29.5)
   September             23.3 ± 14.9 (0.5, 85.9)          24.9 ± 17.4 (0.4, 108.1)               34.8 ± 9.6 (16.1, 79.7)      32.0 ± 9.1       17.7 (7.7, 37.7)
   October               19.4 ± 13.8 (0.1, 70.9)           22.6 ± 17.0 (0.6, 83.5)             35.2 ± 10.2 (18.0, 73.8)       42.4 ± 7.9         21.7 (9, 56.9)
   November              18.6 ± 15.1 (0.3, 67.7)           22.4 ± 20.9 (0.1, 84.0)               40.1 ± 8.1 (25.6, 73.3)      43.9 ± 7.6         22.6 (9, 55.1)
   December              21.7 ± 17.8 (1.0, 96.6)           19.5 ± 19.7 (0.1, 82.0)             43.8 ± 9.0 (24.8, 85.11)       41.6 ± 6.3       20.2 (9.1, 40.3)
   Season:
   Winter                24.5 ± 20.1 (1.2, 94.5)           20.2 ± 19.6 (0.1, 91.7)               45.8 ± 7.8 (24.8, 85.1)             40.9      21.6 (9.1, 55.7)
   Premonsoon           39.8 ± 24.2 (1.2, 116.2)          42.4 ± 24.0 (1.0, 115.5)            64.3 ± 16.7 (14, 9, 124.5)             62.3     32.7 (13.7, 64.3)
   Monsoon               22.7 ± 12.0 (0.5, 85.9)          23.2 ± 15.5 (0.4, 108.1)                30.8 ± 8.7 (4.6, 79.7)             32.8      19.2 (7.7, 46.4)
   Postmonsoon           19.0 ± 14.5 (0.1, 70.9)           22.5 ± 18.9 (0.1, 84.0)               37.6 ± 9.5 (18.0, 73.8)             39.4        22.2 (9, 56.9)
 a Kumar et al. (2010). b Ghude et al. (2008). ∗ O data of Paknajol on January was of 2014.
                                                  3

Table 4. Average CO mixing ratio (ppb) at different times of the day (daytime – 12:00–16:00 LT, and nighttime – 23:00–03:00 LT) and the
monthly average (total) at four sites in the Kathmandu Valley.

                       Winter (16 Jan–15 Feb)              Premonsoon (16 Mar–15 Apr)               Monsoon (16 Jun–15Jul)          Postmonsoon (16 Oct–15 Nov)
 Sites             Daytime      Nighttime        Total    Daytime      Nighttime        Total    Daytime   Nighttime       Total    Daytime   Nighttime     Total
 Bode                405.35        927.21      819.17       430.91         839.17     770.52      210.59      230.08   241.34        269.10      453.95    397.24
 Bhimdhunga          324.62        354.23      374.27       374.64         479.37     471.33      196.61      202.85   198.40
 Naikhandi           280.97        356.14      380.40       382.71         425.17     449.83
 Nagarkot                                                                                         141.68      158.78   160.41

Beijing. The downward flux was highest in the middle tro-                                 soon season, occurring 78 % (72 out of 92 days), 88 % (78
posphere (75 %) in winter. Similarly, Kumar et al. (2010)                                 out of 89 days) and 92 % (85 out of 92 days) of the time at
reported more than 10 ppb of stratospheric contribution at a                              Bode, Paknajol and Nagarkot, respectively. A study by Put-
high-altitude site (in Nainital) during January to April. How-                            ero et al. (2015), based on O3 mixing ratio measurements at
ever, there were no significant stratospheric intrusions seen                             Paknajol in the Kathmandu Valley, as a part of the SusKat-
in spring and summer (seen only in winter) at Nepal Climate                               ABC campaign, has reported that the dynamics (both by
Observatory – Pyramid (Putero et al., 2016).                                              horizontal and vertical winds) play a key role in increased
   During the SusKat-ABC campaign in 2013 and later in                                    O3 mixing ratios in the afternoon in the Kathmandu Valley.
2014, passive sampling of gaseous pollutants (SO2 , NOx ,                                 They estimated that the contribution of photochemistry var-
NH3 and O3 ) was carried out at 14 sites including ur-                                    ied as a function of the hour of the day, ranging from 6 to
ban/semiurban sites (Bode, Indrachowk, Maharajganj, Man-                                  34 %. Unfortunately, no viable NOx measurements were ob-
gal Bazar, Suryabinayak, Bhaisepati, Budhanilkantha, Kir-                                 tained at any site in the Kathmandu Valley and surrounding
tipur, and Lubhu) and rural sites (Bhimdhunga, Naikhandi,                                 mountain ridges during the SusKat-ABC campaign. Speci-
Sankhu, Tinpiple, and Nagarkot) in the Kathmandu Valley                                   ated VOCs were measured at Bode only for about 2 months
(Kiros et al., 2016). Similar to this study, they also ob-                                but NOx was not available for the same period. Therefore we
served higher O3 mixing ratios in rural areas than the ur-                                were not able to discern quantitatively proportional contribu-
ban/semiurban sites in the Kathmandu Valley. Exceedances                                  tions of NOx , VOCs and intrusion (chemistry vs. dynamics)
of the WHO standard are most common during the premon-                                    from the free troposphere or lower stratosphere to observed

Atmos. Chem. Phys., 18, 14113–14132, 2018                                                                    www.atmos-chem-phys.net/18/14113/2018/
K. S. Mahata et al.: Ozone and carbon monoxide in the Kathmandu Valley 14125
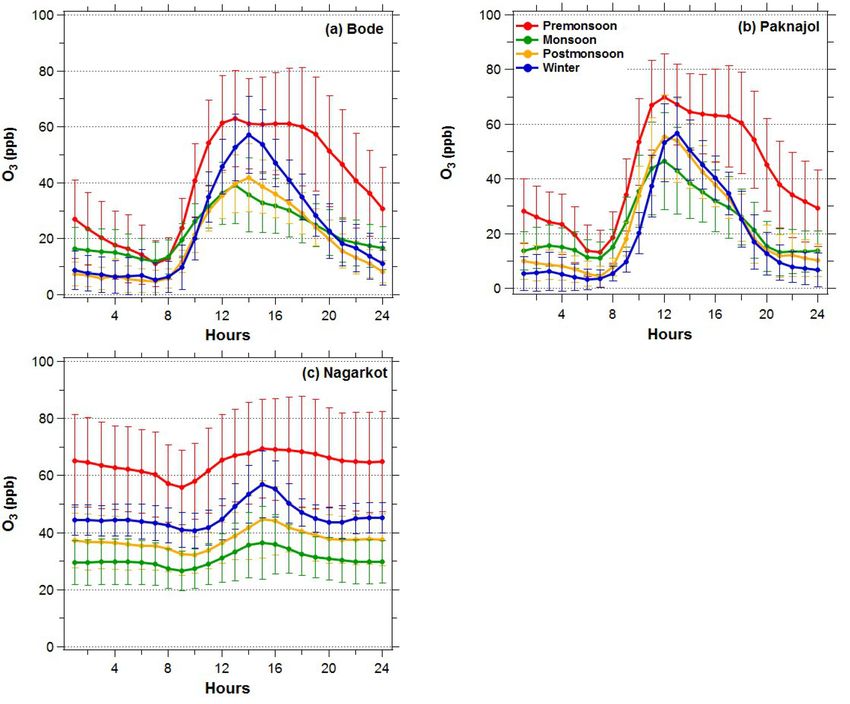
Figure 7. Diurnal pattern of hourly average O3 mixing ratio for different seasons during January 2013–January 2014 at (a) Bode, (b) Paknajol
and (c) Nagarkot in the Kathmandu Valley. The four seasons (described in the text) are defined as premonsoon (March–May), monsoon
(June–September), postmonsoon (October–November) and winter (December–February).
O3 concentrations at Nagarkot, Bode and other sites in the the decade between the observations because of the differ-
Valley. In the context of protecting public health, crops and ence in location and sampling height as well as a general dif-
regional vegetation, the O3 mixing ratios in the Kathmandu ference in instrument calibration. However, a clear similarity
Valley and surrounding areas clearly indicate the urgent need between the observations is that most of the exceedance took
for mitigation action aimed at reducing emissions of its pre- place during premonsoon season, during which both studies
cursor gases NOx and VOCs. However, air quality manage- have observations throughout the season (∼ 90 days). The
ment plans need to carefully consider the reduction strate- percentage of exceedance at Pulchowk during the premon-
gies of NMVOCs or NOx while aiming at mitigating the O3 soon season in 2003–2004 was 70 % (63 out of 90 days) and
pollution in the Kathmandu Valley. If the correct strategy at Paknajol in 2013 it was 88 % (78 out of 89 days). How-
(NMVOCs vs. NOx ) is not applied, then O3 mixing ratios ever, just like for the annual fraction of exceedances, due
could increase, for example as seen in Huszar et al. (2016) to inter-annual variability we cannot say that the 18 % (or
who reported that reducing NMVOCs in urban areas in cen- ca. 15 days) difference in the exceedances is significant. A
tral Europe leads to O3 reduction, whereas the focus on NOx longer term O3 record would be needed to really establish
reduction results in O3 increase. whether there is a trend in the ozone concentrations.
The SusKat-ABC O3 data can be compared to observa-
tions made about a decade ago by Pudasainee et al. (2006) 3.4 O3 seasonal and diurnal variation
at the urban site of Pulchowk, not far from Paknajol, as plot-
ted in Fig. 6d. The daily maximum 8 h average O3 had ex- The seasonal average O3 mixing ratios at Bode, Nagarkot
ceeded the WHO guideline at Pulchowk for 33 % (95 out and Paknajol are shown in Table 3. For comparison, the O3
of 292 days) of days during the observation from Novem- mixing ratios measured at two sites in India, (i) Manora Peak
ber 2003 to October 2004. The exceedance was 38 % (133 (1958 m a.s.l.), a site in rural mountain setting ca. 9 km from
out of 354 days) of days at Paknajol during February 2013– Nainital city, and (ii) Delhi, a highly polluted urban setting
March 2014. Due to inter-annual variability and differences in northwest IGP, are also listed in the Table, based on results
in the seasonal observation time periods at Pulchowk and from Kumar et al. (2010) and Ghude et al. (2008). There is
Paknajol, we cannot draw any conclusions about trends over a strong similarity between the urban and semiurban sites in
Nepal (i.e., Bode, Paknajol) and India (i.e., Delhi), as well
www.atmos-chem-phys.net/18/14113/2018/ Atmos. Chem. Phys., 18, 14113–14132, 201814126 K. S. Mahata et al.: Ozone and carbon monoxide in the Kathmandu Valley
as between the rural and mountain sites in Nepal (i.e., Na- served CO mixing ratio and ceilometer observations of the
garkot) and India (i.e., Manora Peak), with small differences. mixing layer height (MLH) in Bode for a period of 1 year
The peak mixing ratios were in the premonsoon period: at the (March 2013–February 2014). Using the approach used by
rural and mountain sites the peak ozone mixing ratio values Mues et al. (2017), the CO fluxes can be calculated from
were very similar (64 and 62 ppb for Nagarkot and Manora the increase in CO concentrations during the nighttime pe-
Peak, respectively) and are due to influences discussed ear- riod when the MLH is nearly constant, using the following:
lier for Nagarkot; at the suburban and urban sites the pre-
monsoon values are significantly lower (ca. 40, 42, 33 ppb 1CO × ave(MLH (tx ) , MLH(ty ))
FCO tx , ty =
for Bode, Paknajol, Delhi, respectively) due to fresh NOx 1t × 3600
emissions near the urban sites and the consequent titration of MLH(ty )
× , (1)
ozone with NO. The lowest O3 seasonal values at rural and MLH(tx )
mountain sites typically occur in the monsoon months, while
for semiurban and urban sites the minimum was observed where FCO(tx , ty ) is the CO emission flux (in µg m−2 s−1 )
during postmonsoon (Bode) and winter (Paknajol). between time tx and ty (in hours), 1CO is the change
Figure 7 shows the diurnal variation of O3 mixing ratios in CO mixing ratio (in µg m−3 ) between time tx and ty ,
at Bode, Paknajol and Nagarkot in the different seasons. The ave(MLH(tx ), MLH(ty )) are averages of the mixing layer
typical O3 maximum mixing ratio in the early afternoon at heights (in m) between time tx and ty , 1t is the time interval
the urban and semiurban sites is mainly due to daytime pho- between tx and ty , and MLH(ty )/MLH(tx ) is mixing layer
tochemical production as well as entrainment of ozone due to collapse factor, accounting for the small change in MLH be-
dynamics (both intrusion of ozone-rich free tropospheric air tween the night and the morning hours. The calculation of
into the boundary layer and regional-scale horizontal trans- the emission flux is based on mean diurnal cycle per month
port of ozone), as explained in the case of Paknajol by Putero of CO and MLH, and tx and ty represent the time with the
et al. (2015). minimum (tx ) and the maximum (ty ) CO concentration in
The ozone mixing ratios are relatively constant through- the night and morning (see Mues et al., 2017, for details).
out the day at Nagarkot (∼ 1901 m a.s.l.), which, being a This method of calculating the CO emission flux is based
hilltop site, is largely representative of the lower free tropo- on five main assumptions:
spheric regional pollution values; however, it is also affected
by ozone production from precursors transported from the i. CO is well-mixed horizontally and vertically within the
Kathmandu Valley due to westerly winds during the after- mixing layer in the region immediately surrounding the
noon hours. The dip in O3 at Nagarkot (Fig. 7) in the morn- Bode site.
ing transition hours indicates the upward mixing of air from
ii. The MLH remains fairly constant during the night so
the polluted (and ozone-depleted) nocturnal boundary layer
that the product of the CO concentration (µg m−3 ) and
as it is breaking up.
the MLH (m) represents CO mass per unit area within
the column, and any change in mass per unit area repre-
3.5 CO emission flux estimate
sents the net flux into the column.
It is possible to determine a top-down estimate of the aver- iii. The transport of air pollutants into and out of the sta-
age CO emission flux for the morning hours for the region ble nocturnal boundary layer of the valley is negligible,
around the Bode site by applying an approach that was de- which is supported by the calm winds (You can also read