Missing OH reactivity in the global marine boundary layer - atmos-chem-phys.net
←
→
Page content transcription
If your browser does not render page correctly, please read the page content below
Atmos. Chem. Phys., 20, 4013–4029, 2020
https://doi.org/10.5194/acp-20-4013-2020
© Author(s) 2020. This work is distributed under
the Creative Commons Attribution 4.0 License.

Missing OH reactivity in the global marine boundary layer
Alexander B. Thames1 , William H. Brune1 , David O. Miller1 , Hannah M. Allen2 , Eric C. Apel3 , Donald R. Blake4 ,
T. Paul Bui5 , Roisin Commane6 , John D. Crounse7 , Bruce C. Daube8 , Glenn S. Diskin9 , Joshua P. DiGangi9 ,
James W. Elkins10 , Samuel R. Hall3 , Thomas F. Hanisco11 , Reem A. Hannun11,12 , Eric Hintsa10,13 ,
Rebecca S. Hornbrook3 , Michelle J. Kim7 , Kathryn McKain10,13 , Fred L. Moore10,13 , Julie M. Nicely11,14 ,
Jeffrey Peischl10,15 , Thomas B. Ryerson15 , Jason M. St. Clair11,12 , Colm Sweeney10 , Alex Teng2 ,
Chelsea R. Thompson13,15 , Kirk Ullmann3 , Paul O. Wennberg7,16 , and Glenn M. Wolfe11,12
1 Department  of Meteorology and Atmospheric Science, The Pennsylvania State University, University Park, PA, USA
2 Division of Chemistry and Chemical Engineering, California Institute of Technology, Pasadena, CA, USA
3 Atmospheric Chemistry Observations & Modeling Laboratory, National Center for Atmospheric Research,

Boulder, CO, USA
4 Department of Chemistry, University of California, Irvine, CA, USA
5 Earth Science Division, NASA Ames Research Center, Moffett Field, CA, USA
6 Department of Earth and Environmental Sciences, Lamont–Doherty Earth Observatory,

Columbia University, Palisades, NY, USA
7 Division of Geological and Planetary Sciences, California Institute of Technology, Pasadena, CA, USA
8 Department of Earth and Planetary Sciences, Harvard University, Cambridge, MA, USA
9 Chemistry and Dynamics Branch, NASA Langley Research Center, Hampton, VA, USA
10 Global Monitoring Division, NOAA Earth System Research Laboratory, Boulder, CO, USA
11 Atmospheric Chemistry and Dynamics Laboratory, NASA Goddard Space Flight Center, Greenbelt, MD, USA
12 Joint Center for Earth Systems Technology, University of Maryland, Baltimore County, Catonsville, MD, USA
13 Cooperative Institute for Research in Environmental Sciences, University of Colorado, Boulder, CO, USA
14 Earth System Science Interdisciplinary Center, University of Maryland, College Park, MD, USA
15 Chemical Sciences Division, NOAA Earth System Research Laboratory, Boulder, CO, USA
16 Division of Engineering and Applied Science, California Institute of Technology, Pasadena, CA, USA

Correspondence: William H. Brune (whb2@psu.edu)

Received: 24 September 2019 – Discussion started: 16 October 2019
Revised: 30 January 2020 – Accepted: 2 March 2020 – Published: 2 April 2020

Abstract. The hydroxyl radical (OH) reacts with thousands     the calculated OH reactivity was below the limit of detec-
of chemical species in the atmosphere, initiating their re-   tion for the ATom instrument used to measure OH reactiv-
moval and the chemical reaction sequences that produce        ity throughout much of the free troposphere, the instrument
ozone, secondary aerosols, and gas-phase acids. OH reac-      was able to measure the OH reactivity in and just above the
tivity, which is the inverse of OH lifetime, influences the   marine boundary layer. The mean measured value of OH re-
OH abundance and the ability of OH to cleanse the at-         activity in the marine boundary layer across all latitudes and
mosphere. The NASA Atmospheric Tomography (ATom)              all ATom deployments was 1.9 s−1 , which is 0.5 s−1 larger
campaign used instruments on the NASA DC-8 aircraft to        than the mean calculated OH reactivity. The missing OH
measure OH reactivity and more than 100 trace chemical        reactivity, the difference between the measured and calcu-
species. ATom presented a unique opportunity to test the      lated OH reactivity, varied between 0 and 3.5 s−1 , with the
completeness of the OH reactivity calculated from the chem-   highest values over the Northern Hemisphere Pacific Ocean.
ical species measurements by comparing it to the measured     Correlations of missing OH reactivity with formaldehyde,
OH reactivity over two oceans across four seasons. Although   dimethyl sulfide, butanal, and sea surface temperature sug-

Published by Copernicus Publications on behalf of the European Geosciences Union.
4014                                                                               A. B. Thames et al.: Missing OH reactivity

gest the presence of unmeasured or unknown volatile organic        OH reactivity was missing, with missing OH reactivity in-
compounds or oxygenated volatile organic compounds asso-           creasing with temperature in a manner identical to the ex-
ciated with ocean emissions.                                       pected increase of forest monoterpene emissions. Since then,
                                                                   OH reactivity has been measured many times in various ur-
                                                                   ban, rural, and forest environments (Yang et al., 2016, and
1   Introduction                                                   references therein). The fraction of missing OH reactivity
                                                                   in different forests varies from less than 20 %, which is ap-
The primary fate of the thousands of trace gases emitted into      proximately the uncertainty in the measured and calculated
the atmosphere is chemical reaction with the hydroxyl radical      OH reactivity (Kaiser et al., 2016; Zannoni et al., 2016), to
(OH). While OH is produced primarily by the photolysis of          more than 50 % (Nölscher et al., 2012, 2016). Considering
ozone, followed by a reaction between excited-state atomic         the large numbers of trace gases emitted into the atmosphere
oxygen and water vapor, OH is lost at the rate determined by       (Goldstein and Galbally, 2007), it is possible that missing OH
the sum of the reaction frequencies with these trace gases.        reactivity comes from OH reactants that were not measured
This sum of loss frequencies is called the OH reactivity and       or not included in previously calculated totals of the OH reac-
has units of per second (s−1 ). If OH production remains con-      tivity sum. In some studies, the OH reactants have been only
stant, increases in OH reactivity will decrease the total atmo-    those that were measured, and in other studies unmeasured
spheric OH concentration. Thus, understanding global OH            but modeled OH reactants – such as organic peroxyl radicals
reactivity is a key to understanding global OH and the global      and oxygenated volatile organic compound (OVOC) prod-
atmospheric oxidation capacity.                                    ucts – have been included. A recent intercomparison of sev-
   An important example is methane (CH4 ), which is re-            eral OH reactivity instruments demonstrated that these large
moved from the atmosphere primarily by reaction with OH.           missing OH reactivity values are probably not due to instru-
Two estimates of the CH4 lifetime due to oxidation by OH           ment issues (Fuchs et al., 2017). These discrepancies have
are 9.7 ± 1.5 years (Naik et al., 2013) and 11.2 ± 1.3 years       yet to be resolved.
(Prather et al., 2012). A recent global inverse analysis of           One regime that has yet to be adequately investigated is
GOSAT satellite CH4 column emissions finds a CH4 life-             the remote marine boundary layer (MBL) and the free tro-
time of 10.8 ± 0.4 years for oxidation by tropospheric OH          posphere above it, which comprises 70 % of the global lower
(Maasakkers et al., 2019), which is within the uncertainties       troposphere. Two prior studies measured OH reactivity in the
of the other two estimates. Understanding the CH4 lifetime         MBL. The most recent was shipborne across the Mediter-
depends on understanding global spatial and temporal OH            ranean Sea, through the Suez Canal, and into the Arabian
distributions, which are strongly influenced by the spatial and    Gulf in summer 2017 (Pfannerstill et al., 2019). Several por-
temporal distribution of OH reactivity.                            tions of this journey were heavily influenced by petrochemi-
   OH reactivity is the inverse of the OH lifetime. It is calcu-   cal activity or ship traffic, while others were relatively clean.
lated as a sum of OH reactant concentrations multiplied by         Median measured OH reactivity for the different waterways
their reaction rate coefficients:                                  ranged from 6 to 13 s−1 , while median calculated OH reac-
        X                                                          tivity ranged from 2 to 9 s−1 . When more than 100 measured
kOH =        k
            i (OH+Xi )
                       [Xi ] ,                               (1)   chemical species were included in the calculated OH reactiv-
                                                                   ity, the difference between the measured and calculated OH
where k(OH+Xi ) represents some species X’s reaction rate          reactivity was reduced to being within measurement and cal-
coefficient with OH and [Xi ] is the concentration of that         culation uncertainty for some regions, but significant missing
species. If there is no OH production, then the equation for       OH reactivity remained for other regions. In the cleaner por-
the OH decay is                                                    tions of the Mediterranean and Adriatic seas, the calculated
d [OH]                                                             OH reactivity of ∼ 2 s−1 was below the instrument’s limit of
       = −kOH [OH] .                                        (2)    detection (LOD = 5.4 s−1 ).
   dt
                                                                      The other study involved airborne OH reactivity measure-
The first direct measurements of OH reactivity were made in        ments made during the Intercontinental Chemical Transport
Nashville, TN, in summer 1999 (Kovacs et al., 2003). The           Experiment Phase B (INTEX-B) study, a NASA airborne
measured OH reactivity exceeded the calculated OH reac-            campaign investigating Asian-influenced pollution over the
tivity by about 30 %, which was thought to come from short-        North Pacific Ocean in April–May 2006 (Mao et al., 2009).
lived highly reactive volatile organic compounds (VOCs) that       In this study, aged pollution plumes from Southeast Asia
were not measured in that study. The difference between the        were encountered within large regions of relatively clean
measured and calculated OH reactivity was referred to as the       air. At altitudes below ∼ 2 km, missing OH reactivity was
“missing” OH reactivity. For forest environments, the first        ∼ 2.4 s−1 , more than the calculated OH reactivity of 1.6 ±
evidence for missing OH reactivity came from direct OH re-         0.4 s−1 . It decreased to within measurement uncertainty
activity measurements in a northern Michigan forest in sum-        above 4 km. The correlation of missing OH reactivity with
mer 2000 (Di Carlo et al., 2004). As much as a third of the        formaldehyde (HCHO) suggested that the missing OH reac-

Atmos. Chem. Phys., 20, 4013–4029, 2020                                             www.atmos-chem-phys.net/20/4013/2020/
A. B. Thames et al.: Missing OH reactivity                                                                                  4015

tivity was due to highly reactive VOCs that had HCHO as a         at the instrument outlet. A movable wand at the center of a
reaction product. The confinement of the missing OH reac-         flow tube (7.5 cm diameter) injects OH into the flow tube at
tivity to the MBL and just above it suggested that the cause      different distances from an OH detection inlet and axis sim-
of the missing OH reactivity was ocean emissions of VOCs.         ilar to the one used to detect OH in the atmosphere. In the
   In this paper, we describe measurements of OH reactivity       wand, OH is generated in a flow of humidified carrier (N2
that were made during the NASA Atmospheric Tomography             or purified air), which is exposed to 185 nm radiation from
(ATom) campaign (ATom, 2016). This campaign took place            a Hg lamp that photolyzes the H2 O to make OH and HO2 .
in four month-long phases, each in a different season, be-        As the wand moves away from the detection axis, the sig-
tween August 2016 and May 2018 and covered nearly all lat-        nal observed of unreacted OH with the sample air decreases.
itudes over the Pacific and Atlantic oceans. Although the cal-    Assuming a constant decay rate, measured OH reactivity is
culated OH reactivity in the middle-to-upper troposphere is       determined by Eq. (3):
less than the OH reactivity instrument’s LOD of ∼ 0.3 s−1 at
68 % confidence, this instrument can measure OH reactivity                 ln [OH 0]
                                                                               [OH]
in and just above the MBL. The comprehensive instrument           kOH =                − koffset ,                          (3)
                                                                               1t
suite deployed aboard the NASA DC-8 airborne laboratory
allows a detailed examination of which trace gases most in-       where [OH] is the instantaneous OH concentration, [OH0 ] is
fluence measured OH reactivity.                                   the initial OH concentration, 1t is reaction time between the
                                                                  [OH] measurements (the distance the wand moves divided by
                                                                  the flow speed), and koffset is the instrument offset due to OH
2     Methods                                                     loss to the walls or to impurities in the carrier gas. The wand
                                                                  moves approximately 10 cm in total along its path from clos-
Here we discuss the ATom campaign, the OH reactivity in-          est point to farthest point from the detection axis. The sam-
strument and its measurement capabilities, the model used to      pling time step is synced with the Airborne Tropospheric Hy-
generate calculated OH reactivity, and the statistical analysis   drogen Oxides Sensor (ATHOS, an instrument used in tan-
that was used to find correlations with missing OH reactivity.    dem with the OHR instrument to measure in situ OH and
                                                                  HO2 ), which samples at 5 Hz. Depending on the ATom de-
2.1    ATom
                                                                  ployment, the wand takes 15 or 20 s to move 10 cm and back
The ATom campaign consisted of four deployments over all          to its starting position, where it rests for 5 or 10 s while the
four seasons, starting with Northern Hemisphere summer in         OH detection system switches the laser wavelength off res-
2016 and ending with Northern Hemisphere spring in 2018           onance with the OH absorption line to measure the signal
(Table 1).                                                        background. Flow speeds through the OHR instrument are
   Each deployment used the NASA DC-8 Airborne Science            measured with a hot-wire anemometer and are typically be-
Laboratory to profile the atmosphere by frequently ascending      tween 0.25 m s−1 at lower altitudes and 0.45 m s−1 at higher
and descending between 0.2 and 12 km on flights north from        altitudes, resulting in a typical total measured reaction time
California to Alaska, south over the Pacific to New Zealand,      between 0.40 and 0.22 s.
east over the Southern Ocean to Chile, north over the Atlantic       It is important to note that all OH reactivity instruments
Ocean to Greenland, west over the Arctic Ocean to Alaska,         measure the “instantaneous” OH reactivity, which is only the
and then back to California (yellow lines in Fig. 1). As shown    reactions that occur within the maximum reaction time ob-
in Table 2, the DC-8 carried a suite of instruments that mea-     served by that instrument. This maximum time is typically
sured over 100 different chemical constituents, aerosol parti-    less than 1 s. These instruments do not measure either subse-
cle properties and chemical composition, photolysis frequen-      quent OH reactivity or OH production if the time constants
cies, and meteorological variables (Wofsy et al., 2018; ATom,     for that chemistry are greater than the maximum reaction
2016).                                                            time. In relatively clean environments, no subsequent chem-
                                                                  istry affects the measured OH decay. However, in environ-
2.2    OH reactivity measurement                                  ments where NO is greater than a few parts per billion by
                                                                  volume (ppbv), the reaction HO2 + NO → OH + NO2 is fast
The OH reactivity concept and the basic instrument have           enough to convert HO2 to OH, thereby altering the observed
been described before for ground-based operation (Kovacs          OH decay. No high-NO environments were encountered in
and Brune, 2001) and for aircraft operation (Mao et al.,          ATom.
2009). The instrument used for ATom, called OH Reactivity            In all previous ground-based and aircraft-based studies,
(OHR), is a version of the one described by Mao et al. (2009).    high-purity N2 was used as the carrier gas in the wand. Dur-
A brief description of the concept and the instrument is pre-     ing aircraft-based studies, a cylinder of N2 gas was consumed
sented below.                                                     on each 8 h flight and accordingly had to be replaced before
  Sampled air is brought into the instrument during flight by     the next flight. It was not possible to position caches of N2
ram force at the 1.2 cm diameter inlet and the Venturi effect     cylinders at each of the ∼ 12 layovers during each ATom

www.atmos-chem-phys.net/20/4013/2020/                                              Atmos. Chem. Phys., 20, 4013–4029, 2020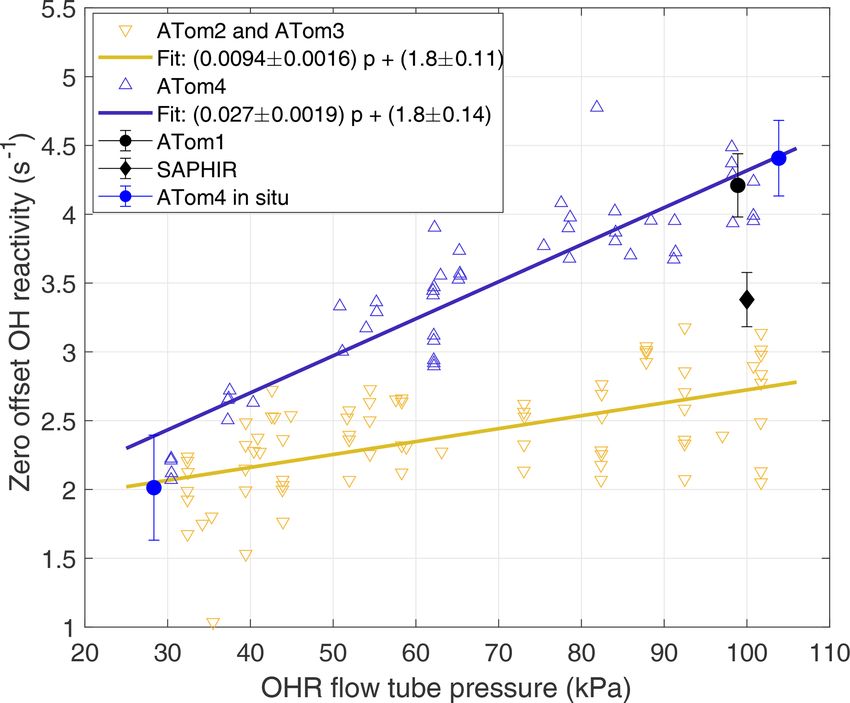
4016                                                                                          A. B. Thames et al.: Missing OH reactivity

Table 1. ATom campaign deployment seasons and start and end dates. Full details on stops can be found online (ATom, 2016).

                                 Deployment      ATom1            ATom2            ATom3           ATom4
                                 NH season       Summer           Winter           Fall            Spring
                                 Start date      28 Jul 2016      26 Jan 2017      28 Sep 2017     24 Apr 2018
                                 End date        22 Aug 2016      22 Feb 2017      26 Oct 2017     21 May 2018

Figure 1. Global ATom tracks (yellow lines) with indicators for the periods during which the DC-8 dipped into the boundary layer. Filled
blue circles indicate points used for analysis, filled red triangles indicate dips when over land, and unfilled blue circles indicate dips not used
for analysis due to instrument calibrations or downtime.

phase. Instead of N2 , air from a zero-air generator (Perma-                pre-flight conditions. These changes were tracked with mea-
Pure ZA-750-12) was used as the carrier gas in the laboratory               surements of the OHR instrument offset in the laboratory
prior to ATom. Before each mission, the zero-air generator                  and, for ATom4, in situ during several flights. For the lab-
medium (PermaPure ZA AR – activated carbon and alumina                      oratory calibrations, the internal pressure of the OHR in-
mixture) was replaced and the air produced by the unit was                  strument was varied between 30 and 100 kPa to simulate in-
verified to be pure by running it through a potential aerosol               flight conditions. For the in situ calibrations taken during the
mass chamber that rapidly oxidizes any VOCs to particles                    second half of ATom4, the OHR instrument was switched
(Lambe et al., 2011). No particles were seen, indicating that               from sampling the ambient flow to sampling high-purity N2
the air had negligible amounts of larger reactive VOCs. The                 from a reserve N2 cylinder. The flow rate out of the cylin-
results of this test were consistent with those obtained by sub-            der was adjusted to match the flow speed measured by the
stituting the air from the zero-air generator with high-purity              hot-wire anemometer just prior to the switch. During ascent
nitrogen. The exception to this procedure was during ATom4,                 and descent, the internal pressure and flow speed changed too
when the zero-air generator itself had to be replaced late in               quickly over the length of one decay to get good offset cal-
the instrument integration period. The medium was changed                   ibrations, so offset calibrations were taken only from stable
prior to the ATom4 integration and the research flights, but                altitude legs, predominantly at the low altitudes.
the air purity was unable to be checked until after the ATom4                  Two complete laboratory calibrations, the in situ calibra-
deployment had ended, when it was found that the OHR off-                   tion, and a calibration only at ∼ 100 kPa were used to de-
set was higher than in previous ATom deployments.                           termine koffset for the different ATom deployments (Fig. 2).
                                                                            The 2017 calibration applies to ATom2 and ATom3, while
2.3    OH reactivity measurement offset calibrations                        the 2018 calibration applies to ATom4. For ATom1, the off-
                                                                            set was calibrated at only 97 kPa prior to the mission, but
The OHR offset varied between the four ATom deployments                     it is in excellent agreement with the offset calibrated for
due to changes in the zero-air generator performance and                    ATom4. We can safely assume that the ATom4 offset slope
between research flights due to internal contamination from

Atmos. Chem. Phys., 20, 4013–4029, 2020                                                        www.atmos-chem-phys.net/20/4013/2020/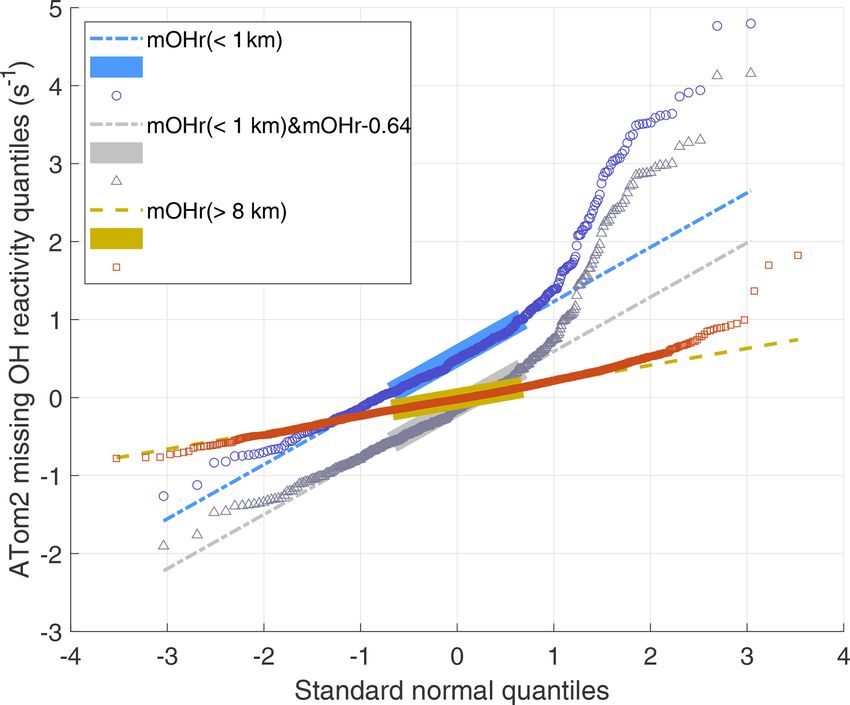
A. B. Thames et al.: Missing OH reactivity                                                                                                  4017

Table 2. Simultaneous measurements used to constrain the box model and calculate OH reactivity.

    Measurement                           Instrument                             Uncertainty (2σ confidence)   Reference
    T                                     Meteorological Measurement             ±0.5 C                        Chan et al. (1998)
    p                                     System (MMS)                           ±0.3 hPa
    H2 O                                  Diode Laser Hygrometer (DLH)           ±15 %                         Diskin et al. (2002)
    Photolysis frequencies                CCD Actinic Flux                       ± (12–25) %,                  Shetter and Mueller (1999)
    (30 measurements)                     Spectroradiometers (CAFS)              species dependent
    NO, NO2                               Nitrogen Oxides and Ozone (NOy O3 )    6.6, 34 pptv                  Ryerson et al. (2000)
    O3                                    NOy O3 ∗                               1.4 ppbv                      Ryerson et al. (2000)
                                          UAS Chromatograph for Atmospheric      ±1 % + 1.5 ppbv
                                          Trace Species (UCATS)
    CO                                    Quantum Cascade Laser                  3.5 ppbv                      Santorini et al. (2014)
                                          System (QCLS)∗
                                          NOAA Picarro                           3.6 ppbv                      Chen et al. (2013)
                                          UCATS                                  8.4 ppbv
    H2 O2 , CH3 OOH, HNO3                 Caltech Chemical                       ±30 % + 50 pptv               Crounse et al. (2006)
    CH3 CO3 H,                            Ionization Spectrometer
    SO2                                   (CIT CIMS)                             ±30 % + 100 pptv
    HCOOH, BrO                            NOAA Chemical Ionization               ±15 % + 50 pptv               Neuman et al. (2016)
                                          Spectrometer (CIMS)
    CH4                                   NOAA Picarro∗                          0.7 ppbv                      Karion et al. (2013)
                                          UCATS                                  23.6 ppbv
                                          PAN and Trace Hydrohalocarbon          34.6 ppbv
                                          ExpeRiment (PANTHER)
    HCHO                                  NASA In Situ Airborne                  ±10 %±10 pptv                 Cazorla et al. (2015)
                                          Formaldehyde (ISAF)
    Methyl nitrate, ethyl                 University of California, Irvine       ±10 %                         Colman et al. (2001)
    nitrate, isoprene, acetylene,         Whole Air Sampler (UCI WAS)
    ethylene, ethane, propane,
    i-butane, n-butane, i-
    pentane, n-pentane, n-
    hexane, n-heptane,
    benzene, toluene, methyl
    chloride, methylene
    chloride, chloroform,
    methyl bromide, methyl
    chloroform,
    perchloroethene, 1,2-
    dichloroethane, DMS
    Methanol, formaldehyde,               Trace Organic Gas Analyzer (TOGA)      ±15 %–50 %                    Apel et al. (2015)
    acetaldehyde, ethyl                                                          (acetaldehyde: ±20 %)
    benzene, toluene,
    methacrolein, methyl ethyl
    ketone, methyl tert-butyl
    ether, ethanol, acetone, 2-
    methylpentane, 3-
    methylpentane, 2,2,4-
    trimethylpentane,
    isobutene+1-butene,m-
    xylene+p-xylene, o-xylene,
    tricyclene, limonene+D3-
    carene, propanal, butanal,
    acrolein
   * Primary measurement. Other measurements fill gaps in primary measurement.

www.atmos-chem-phys.net/20/4013/2020/                                                           Atmos. Chem. Phys., 20, 4013–4029, 2020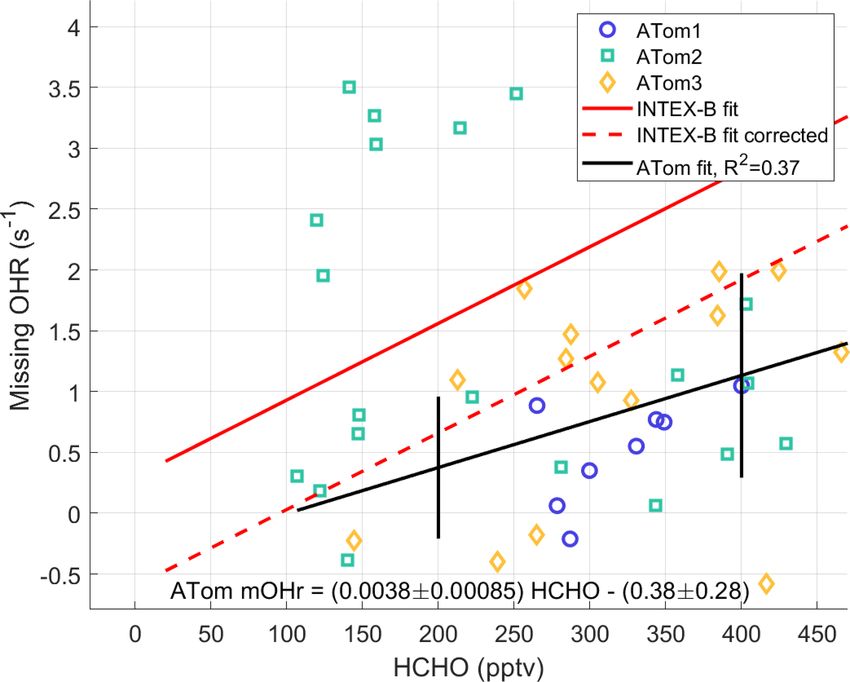
4018                                                                                    A. B. Thames et al.: Missing OH reactivity

                                                                        dependent, with an offset of 2.9 s−1 at high OHR flow tube
                                                                        pressure and 2.0 s−1 at low OHR flow tube pressure, nearly
                                                                        identical to the values used for ATom2 and ATom3.
                                                                           The difference in the linear fit to the offset calibration for
                                                                        ATom1 and ATom4 and the linear fit to the offset calibration
                                                                        for ATom2 and ATom3 is pressure dependent (Fig. 2). The
                                                                        standard volume airflow in the wand was constant, but the
                                                                        ambient volume flow in the flow tube decreased by a fac-
                                                                        tor of ∼ 2 as the flow tube pressure increased from 30 to
                                                                        100 kPa. As a result, the contamination concentration from
                                                                        the wand air also increased by a factor of ∼ 2 as flow tube
                                                                        pressure increased. This pressure-dependent contamination
                                                                        concentration explains much of the difference between the
                                                                        two fitted lines and provides evidence that contamination in
                                                                        the wand flow was a substantial contributor to the changes
                                                                        in the zero offset in ATom1 and ATom4 and that in ATom2
                                                                        and ATom3. The good agreement between the fit for ATom2
Figure 2. Laboratory and in situ calibrations of OHR offset over        and ATom3 and the offset calibrations of Mao et al. (2009),
1 min sums. The offset was calibrated only at ∼ 100 kPa around          who used ultra-high-purity N2 , suggests that the zero air for
ATom1 in 2015 and 2016 (black dot). The offset was measured with        ATom2 and ATom3 had negligible contamination.
a slightly different instrument configuration during the OH reactiv-       The OHR instrument zero offset varied slightly from
ity intercomparison study in 2015 (black diamond) (Fuchs et al.,        flight to flight because of the variable air quality produced
2017). Shown are offset calibrations performed in 2017 between          by the zero-air generator. This flight-to-flight variation was
ATom2 and ATom3 (yellow inverted triangles) and their linear fit        tracked and the OH reactivity offset was corrected by the
(yellow line), in 2018 at the end of ATom4 (blue triangles) and their   following procedure. The OH reactivity calculated from the
linear fit (blue line), and in flight (blue dots). Error bars are ±1
                                                                        model at the OHR instrument’s temperature and pressure (see
standard deviation of the mean. The ATom4 fit was used for ATom1
                                                                        Sect. 2.5) was 0.25–0.30 s−1 for the upper troposphere dur-
because the high-pressure laboratory calibrations were essentially
the same.                                                               ing all ATom deployments and latitudes. The offset calibra-
                                                                        tions were adjusted in the range of 0.34 ± 0.32 s−1 for each
                                                                        research flight by a pressure-invariant offset that was neces-
                                                                        sary to equate the mean measured and model-calculated OH
can be applied to ATom1 because all offset calibrations per-            reactivity values for data taken above 8 km altitude. If this
formed at low OHR flow tube pressures, even those of Mao                offset correction is not used for all altitudes, then the OH re-
et al. (2009), give ∼ 2 s−1 for the offset value. The difficulty        activity in the 2–8 km range varies unreasonably from flight
of maintaining steady calibration conditions in flight during           to flight, even going significantly negative at times. In effect,
ATom4 caused the large in situ calibration error. The stan-             we used the upper troposphere as a clean standard in order to
dard deviation of these in situ offset calibrations is 0.75 s−1 ,       fine-tune koffset , just as Mao et al. (2009) did.
which is 2.5 to 3 times larger than the standard deviation ob-             The OH signals in the upper troposphere were high enough
tained for ambient measurements in clean air for the same al-           to allow the slopes of the OH decays to be determined with
titude and number of measurements, indicating that the atmo-            good precision for each 20–30 s decay. However, at the low
spheric measurement precision is much better than could be              altitudes, quenching of the fluorescence signal by higher air
achieved in these difficult offset calibrations. Yet even with          and water vapor abundances reduced the OH signals. To
this lower precision, the mean in situ offset at high and low           compensate for this reduction, decays were binned into 1 min
pressure agrees with the linear fit of the laboratory calibra-          sums before the decay slopes were calculated. Three OH sig-
tions to within 20 % at low pressures and 3 % at high pres-             nal decays from low altitudes during ATom2 are shown in
sure. The excellent agreement between the laboratory and in             Fig. 3. When koffset is subtracted from the decays shown
situ offset calibrations for ATom4 confirms the finding of              in Fig. 3, their values become ∼ 5 (blue), ∼ 3 (teal), and
Mao et al. (2009) that laboratory offset calibrations before            ∼ 2 s−1 (yellow).
or after a campaign accurately capture the instrument offset
during the campaign.                                                    2.4   Missing OH reactivity uncertainty analysis
   This observed pressure dependence of the offset cal-
ibration is different from the behavior of the pressure-                The uncertainty for missing OH reactivity in the MBL at the
independent offset calibration used by Mao et al. (2009).               68 % confidence level comes from four components: the de-
However, a re-examination of the Mao et al. (2009) data in-             cay measurement itself; the offset as determined by the slope
dicates that the offset during INTEX-B was also pressure                and intercepts of the fits to the laboratory OH reactivity off-

Atmos. Chem. Phys., 20, 4013–4029, 2020                                                  www.atmos-chem-phys.net/20/4013/2020/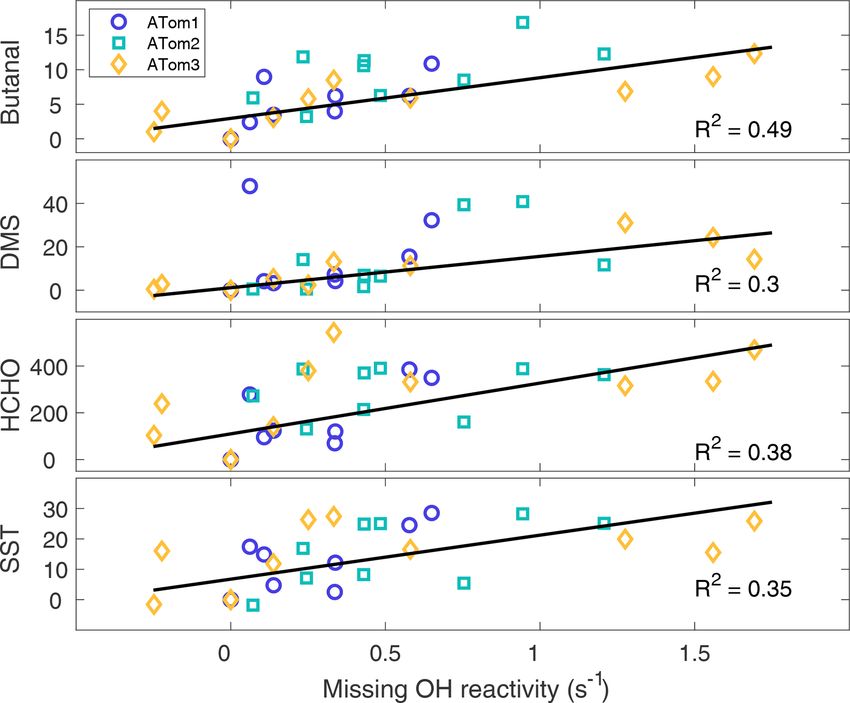
A. B. Thames et al.: Missing OH reactivity                                                                                          4019

                                                                         OHR instrument, as it would have for any OH reactivity in-
                                                                         strument; even the most precise instrument measuring in a
                                                                         chamber at its home laboratory has a LOD of ±0.2 s−1 (68 %
                                                                         confidence) for a measurement integration time of 60–160 s
                                                                         (Fuchs et al., 2017). If the same instrument were to sample
                                                                         air masses on an aircraft traveling 200 m s−1 , its precision
                                                                         would likely be degraded. From this perspective, the LOD
                                                                         on these ATom measurements is about as low as that for any
                                                                         other OH reactivity measurements.
                                                                            The analysis in the paper is focused on the first three
                                                                         ATom deployments. ATom4 is excluded from this analysis
                                                                         for two reasons. First, offset calibrations were performed
                                                                         during more than half of the low-altitude periods over the
                                                                         Atlantic, severely limiting the ambient measurements in the
                                                                         MBL. Second, the increased contamination during ATom4
                                                                         made the OH reactivity measurements 2–3 times noisier than
                                                                         during the previous ATom deployments.
Figure 3. Three in-flight decays for 1 min sums of the OH signals.
Decays were measured in the marine boundary layer, and the in-
dividual 5 Hz data were binned by reaction times for clarity. When       2.5   Photochemical box model
koffset is subtracted from the decays, their values become ∼ 5 (blue),
∼ 3(teal), and ∼ 2 (yellow) s−1 .                                        The photochemical box model used to calculate OH reactiv-
                                                                         ity is the Framework for 0-D Atmospheric Modeling (F0AM)
                                                                         (Wolfe et al, 2016). It uses the Master Chemical Mechanism
set calibrations (Fig. 2); the flight-to-flight offset variation as      v3.3.1 (MCMv331) for all gas-phase reactions (Jenkin et al.,
judged by fitting the measured OH reactivity to the model-               1997, 2003; Saunders et al., 2003). Both the F0AM model
calculated OH reactivity at 8–12 km altitude; and the model              framework and MCMv3.3.1 are publicly available. The re-
calculations. First, the uncertainty in decay fit is approxi-            actions of CH3 O2 + OH and C2 H5 O2 + OH were added to
mately ±7.5 %, which for a typical OH reactivity measure-                the model mechanism with rate coefficients from Assaf et
ment in the MBL of ∼ 2 s−1 would give an uncertainty of                  al. (2017). The model was run with the integration time set
±0.15 s−1 . Second, the uncertainty in the OH reactivity off-            to 3 d with a first-order dilution lifetime of 12 h, although the
set in the MBL is found from the sum of the slope uncer-                 calculated OH reactivity was the same to within a few percent
tainty multiplied by the OHR flow tube pressure, which is                for an order-of-magnitude change in these times. The model
∼ 100 kPa in the MBL, (±0.16 s−1 ) and the intercept uncer-              was constrained by the simultaneous measurements listed in
tainty (±0.11 s−1 ). The two uncertainties are assumed to be             Table 2. These measurements were taken from the 1 s merge
correlated. Third, the uncertainty in the flight-to-flight offset        file, averaged to 1 min values, and interpolated to a common
variation is the standard deviation of the mean for each high-           1 min time step. In cases where multiple measurements of
altitude level leg (±0.15 s−1 ). Fourth, the uncertainty of the          a chemical species exist (e.g., CO), a primary measurement
model-calculated OH reactivity was determined by Eq. (4):                was chosen and other measurements were used to fill gaps in
                 qX                                                     the primary measurement.
    calc −1
                        (ki 1xi )2 + (1ki xi )2 ,                           To compare measured and calculated OH reactivity, the

1kOH    (s ) =                                                  (4)
                                                                         model-calculated OH reactivity must be corrected to the
where ki are the reaction rate coefficients and xi are the               OHR flow tube pressure and temperature. For the rest of
OH reactant concentrations. The rate coefficient uncertain-              this paper, “calculated OH reactivity” will refer to these cor-
ties come from Burkholder et al. (2016), and the chemi-                  rected values. Equation (1) was then used to find the calcu-
cal species uncertainties come from Table 2 and Brune et                 lated OH reactivity. If the measured and calculated OH re-
al. (2020). For the 11 chemical species responsible for 95 %             activity agreed, then there was no missing OH reactivity to
of the total OH reactivity in the MBL, this uncertainty is               within the uncertainties for both the measured and the cal-
±0.08 s−1 . The square root of the sum of the squares of all             culated values. However, if there was missing OH reactivity
these uncertainties yields a total uncertainty for the MBL               in the flow tube, then the missing OH reactivity in the atmo-
missing OH reactivity of ±0.32 s−1 at the 68 % confidence                sphere may be different because the temperature dependence
level.                                                                   of its reaction rate coefficients is unknown. Fortunately, the
   The OH reactivity from the model at the ambient tem-                  focus of this study is in and just above the MBL, where the
perature and pressure rarely exceeded 2 s−1 in the plane-                flow tube pressures and temperatures are nearly identical to
tary boundary and was only 0.2 s−1 in the free troposphere.              atmospheric temperatures and pressures. The OH reactivity
These low values presented a significant challenge for our               calculated from the model output at the flow tube pressure

www.atmos-chem-phys.net/20/4013/2020/                                                     Atmos. Chem. Phys., 20, 4013–4029, 2020
4020                                                                              A. B. Thames et al.: Missing OH reactivity

and temperature is within ±10 % of that calculated at ambi-       ally in the MBL because its height was greater than 160 m
ent conditions. Thus, the missing OH reactivity at the flow       85 % of the time. The MBL height is the altitude below which
tube temperature and pressure is assumed to be equal to the       the potential temperature is constant. A per-dip bin occurred
atmospheric missing OH reactivity.                                roughly every hour of flight. The term “per-flight” means that
  If missing OH reactivity is found, a likely source is un-       the missing OH reactivity for all the dips in a flight was aver-
known VOCs or OVOCs, which we will call X. The abun-              aged together. Each per-flight bin is the mean of each flight’s
dance of X was determined from the missing OH reactivity          per-dip set. Each per-flight bin spanned only a few degrees
by Eq. (5):                                                       of latitude near the poles but as much as 50◦ of latitude in
                                                                  the tropics. Only the measurements made while flying over
       mOHR 109                                                   the ocean were included in the per-dip and per-flight aver-
X=              ,                                          (5)
       kX+OH M                                                    aging because the dips over land sampled terrestrial or ice
where X is the missing chemical species mixing ratio (ppbv),      emissions and not ocean emissions.
mOHR is the missing OH reactivity, kX+OH is the reaction             Individual measured or calculated meteorological param-
rate coefficient for the reaction X + OH → products, and M        eters and chemical species passed a preliminary correlation
is the air number concentration. We assume that kX+OH =           threshold for missing OH reactivity if the sign of each regres-
10−10 cm3 s−1 , which gives X a lifetime of about 1 h for the     sion was the same for ATom1, ATom2, and ATom3. Corre-
typical daytime [OH] of ∼ 3 × 106 cm−3 . For these assump-        lations that passed this preliminary filter had their R 2 values
tions, an X abundance of 400 pptv (parts per trillion by vol-     averaged between each deployment individually and grouped
ume) corresponds to a missing OH reactivity of 1 s−1 . This       together. The averaged correlation coefficients were then tal-
arbitrary rate coefficient approximates a rate coefficient for    lied and ranked from greatest to least R 2 . The top 10 % of
a reaction of a sesquiterpene with OH. If X is an alkane or       these correlations for both the per-dip and per-flight averages
alkene that has a lower reaction rate coefficient, then the re-   were combined into one data set. Because the missing OH
quired X abundance will be larger.                                reactivity showed some latitude dependence, the same multi-
   Simple X oxidation chemistry was added to the photo-           step technique was performed on all the chemical species and
chemical mechanism to test the impact of X on the mod-            meteorological parameters in different hemispheres: North-
eled OH and HO2 . This assumed additional chemistry is pro-       ern, Southern, Eastern, and Western. Both data sets were then
vided in Table 3. XO2 is used to designate the peroxy radical     combined into a single data set, and the strongest of these
formed from X. Rate coefficients for CH3 O2 and CH3 OOH           correlations were reported.
were assumed to apply to XO2 and XOOH. Case one as-
sumes that no OH is regenerated in the oxidation sequence
for X, while case two assumes that OH is regenerated for          3     Results
every oxidation sequence of X.
                                                                  The focus of these results is the OH reactivity measurements
2.6    Correlation analysis                                       in and just above the MBL. However, the OH reactivity mea-
                                                                  surements are shown for the entire range of altitudes, even
An analysis of correlations between missing OH reactivity         though the high-altitude (> 8 km) OH reactivity values were
and the chemical or environmental factors could indicate          set to the calculated OH reactivity that was corrected to the
possible causes of the missing OH reactivity. Linear regres-      OHR flow tube pressure and temperature.
sions were found for missing OH reactivity and every mea-
sured and calculated chemical species and meteorological          3.1    Global OH reactivity versus altitude
parameter. Calculated chemical species with abundances less
than 1 pptv were not included in the regressions. Sea surface     The average calculated global OH reactivity at the lowest
temperature (SST) and chlorophyll data come from NASA             altitudes is about an order of magnitude less than the av-
Earth Observations (2019). Correlations were performed on         erage OH reactivity in cities or forests (Yang et al., 2016),
the first three ATom deployments individually and the first       which is typically 10–50 s−1 . For ATom, calculated OH re-
three ATom deployments combined.                                  activity is less than 2 s−1 averaged over all latitudes and
   To reduce the noise in the missing OH reactivity values        seasons (Fig. 4). In different seasons and regions, this cal-
prior to doing any correlation analysis, the 1 min missing        culated OH reactivity consists of CO (30–40 %), CH4 (19–
OH reactivity values were averaged into “per-dip” bins and        24 %), methyl hydroperoxide (MHP) (5–16 %), aldehydes
“per-flight” bins. The term “per-dip” means that the missing      (11–12 %), H2 (6–7 %), O3 (2–5 %), HO2 (2–6 %), H2 O2 (0–
OH reactivity was averaged over each 5 min level-altitude leg     5 %), and CH3 O2 (0–7 %), with the remaining reactants total-
at 160 m. The standard deviation of the 1 min measurements        ing less than 10 %. The ordering of these reactants is similar
within each dip was typically 0.4 s−1 , while the standard de-    to that of Mao et al. (2009), although in their work the cal-
viation of the per-dip measurements in a flight was 0.25 s−1 .    culated OH reactivity due to CO was about 60 %, that due
The low-level legs used for the per-dip means were gener-         to CH4 about 15 %, and that due to all OVOCs about 16 %.

Atmos. Chem. Phys., 20, 4013–4029, 2020                                            www.atmos-chem-phys.net/20/4013/2020/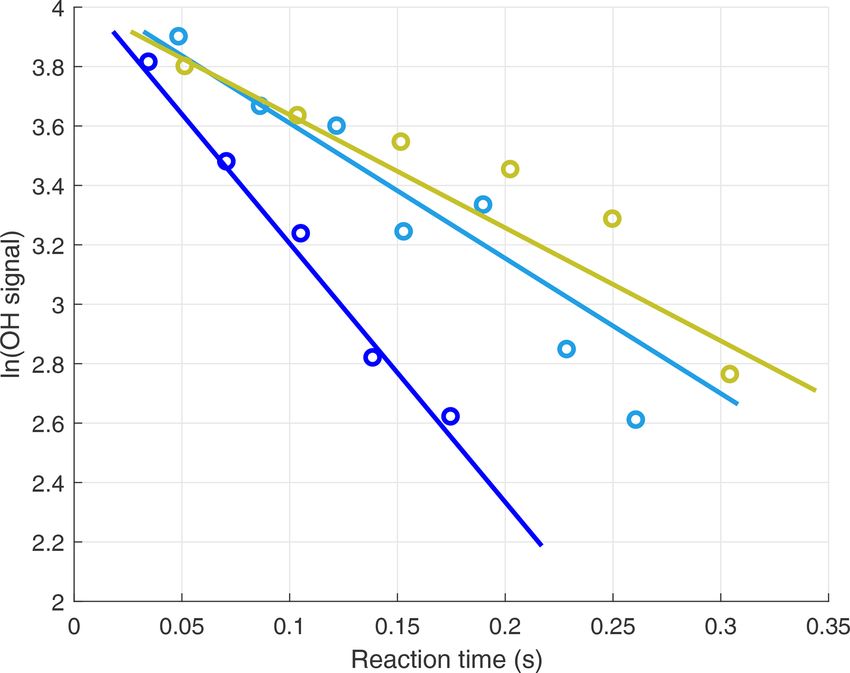
A. B. Thames et al.: Missing OH reactivity                                                                                        4021

Table 3. Simple X photochemistry added to the photochemical mechanism to test for effects of X on modeled OH and HO2 .

                                 Reaction                              Reaction rate coefficient (cm3 s−1 )
                                 Case one: X + OH → XO2                1 × 10⁻¹⁰
                                 Case two: X + OH → XO2 + OH
                                 X + O3 → XO2                          1 × 10⁻¹⁶
                                 XO2 + NO → HO2 + NO2 + prod           3 × 10⁻¹² exp(300/T )
                                 XO2 + HO2 → XOOH                      8.6 × 10⁻¹³ exp(700/T )
                                 XOOH+hυ → XO + OH                     JCH3 OOH (s−1 )
                                 XOOH + OH → XO2                       2.9 × 10⁻¹² exp(−160/T )

                                                                        3.2   Missing OH reactivity: statistical evidence

                                                                        A better approach is to find the missing OH reactivity for
                                                                        each measurement point and then compare the mean values.
                                                                        The missing OH reactivity is plotted as a function of alti-
                                                                        tude for ATom1, ATom2, and ATom3 (Fig. 5). The mean
                                                                        missing OH reactivity is set to 0 s−1 for 8–12 km, remains
                                                                        near to 0 from 8 to 2–4 km, and increases below 2–4 km. The
                                                                        1 min measurements are a good indicator of the measurement
                                                                        precision, which is ±0.35 s−1 for ATom1 and ±0.25 s−1 for
                                                                        ATom2 and ATom3.
                                                                           In the MBL, the mean missing OH reactivity is 0.4 s−1 for
                                                                        ATom1, 0.5 s−1 for ATom3, and 0.7 s−1 for ATom2. From
                                                                        a Student t test in which the MBL missing OH reactivity
Figure 4. OH reactivity versus altitude for ATom1 (August), ATom2
(February), and ATom3 (October). One-minute measured OH reac-
                                                                        is compared to the values in either the 6–8 or 8–12 km al-
tivity (gray dots), median measured OH reactivity (OHr meas) in         titude range, the differences in mean missing OH reactivity
1 km altitude bins (red circle and line), median calculated OH reac-    between the MBL and the higher altitudes is statistically sig-
tivity (OHr calc) in 1 km altitude bins (blue x’s and line), and ab-    nificant for a significance level, α, equal to 0.01, with p val-
solute OHR uncertainty (95 % confidence level) for measured and         ues < 10−15 . However, the mean MBL missing OH reactivity
calculated OH reactivity (dashed lines) are shown as a function of      values are close to the upper limit on the absolute missing OH
altitude.                                                               reactivity uncertainty (95 % confidence), which is 0.64 s−1
                                                                        (blue bar, Fig. 5). There is a small probability (2–10 %) that
                                                                        the mean MBL missing OH reactivity is due only to abso-
Part of this difference can be ascribed to more OVOC mea-
                                                                        lute error in the missing OH reactivity measurement that was
surements in ATom and the greater CO abundances in the
                                                                        derived in Sect. 2.4.
Northern Hemisphere, where INTEX-B occurred.
                                                                           The mean MBL missing OH reactivity contains measure-
   The calculated OH reactivity decreases from ∼ 1.5 in the
                                                                        ments for which the missing OH reactivity is 0 s−1 . The real
MBL to 0.25–0.30 s−1 in the upper troposphere (Fig. 4). The
                                                                        interest is in the missing OH reactivity that is greater than
mean measured OH reactivity has been matched to the mean
                                                                        can be explained by absolute missing OH reactivity mea-
calculated OH reactivity for altitudes above 8 km, but the two
                                                                        surement error or precision. From Fig. 5, it is clear that the
are independent at lower altitudes. The mean measured and
                                                                        positive scatter of data is much greater than the negative scat-
calculated OH reactivity agree to within combined uncertain-
                                                                        ter. The means of standard deviations of the negative values
ties for altitudes between 8 km and 2–4 km, but the mean
                                                                        and of the positive values were calculated for 1 km height
measured OH reactivity becomes increasingly greater than
                                                                        intervals (dashed lines). These lines and the individual data
the mean calculated OH reactivity below 2–4 km and espe-
                                                                        points both indicate skewness in the missing OH reactiv-
cially in the MBL. However, comparing the differences in
                                                                        ity, especially in the lowest 2–4 km altitude. A skewness test
the mean values is not the best way to understand these dif-
                                                                        shows that, in and just above the MBL, missing OH reac-
ferences between measured and calculated OH reactivity.
                                                                        tivity from ATom1 and ATom3 exhibits weak to moderate
                                                                        skewness (∼ 0.4), while missing OH reactivity from ATom2
                                                                        exhibits strong skewness (1.4).
                                                                           Quantile–quantile plots (Q–Q plots) provide a visual de-
                                                                        scription of the relationship between a sample distribution

www.atmos-chem-phys.net/20/4013/2020/                                                     Atmos. Chem. Phys., 20, 4013–4029, 2020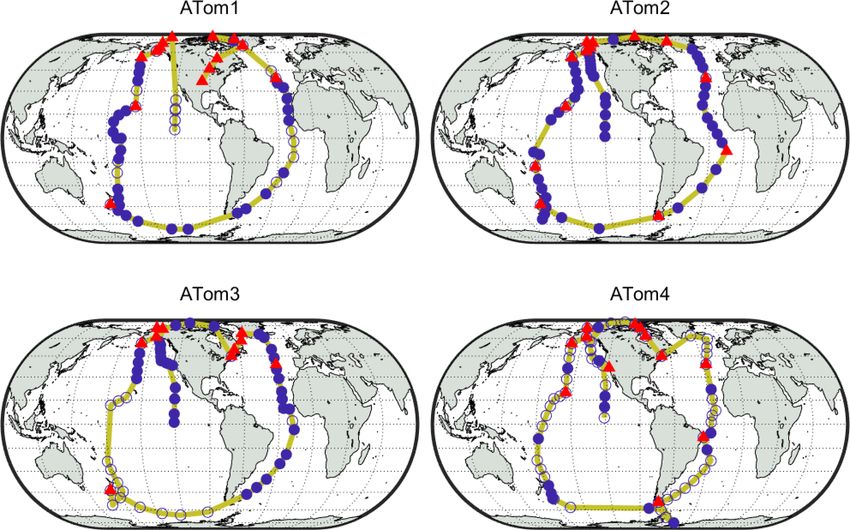
4022 A. B. Thames et al.: Missing OH reactivity
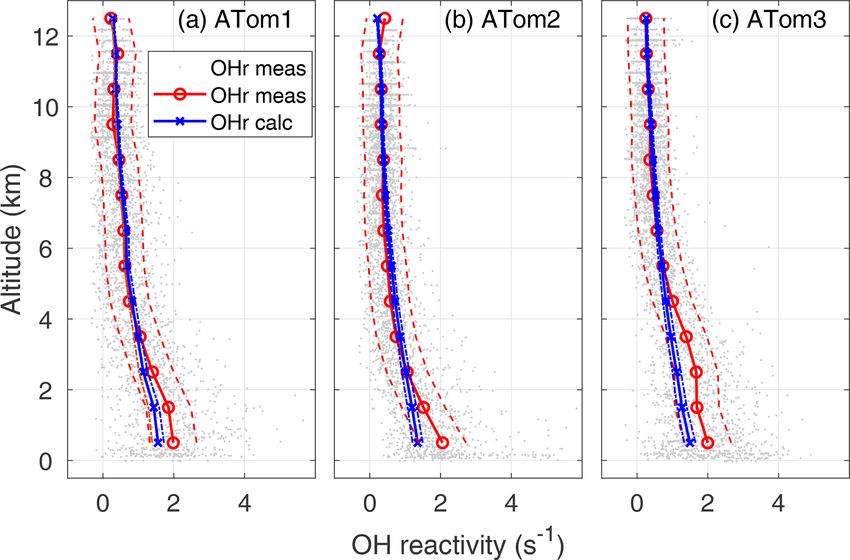
Figure 5. Missing OH reactivity (mOHr) against altitude for ATom1
(August), ATom2 (February), and ATom3 (October). Gray dots are
the OH reactivity calculated by subtracting calculated OH reactiv-
ity from measured OH reactivity. Median missing OH reactivity be-
low 1 km altitude (red circles and lines) is comparable to the abso- Figure 6. ATom2 quantile–quantile plot for 1 min missing OH reac-
lute uncertainty in the missing OH reactivity (blue bar, 95 % con- tivity values above 8 km (red squares) and below 1 km (blue circles)
fidence). The standard deviation of the negative missing OH reac- versus a normal distribution with a mean of 0 and a standard de-
tivity data for each 1 km of altitude (left of the zero line) and of viation of 1. The Q–Q plot for data taken below 1 km but with the
the positive missing OH reactivity data (right of the zero line) are median value shifted by 0.64 s−1 (gray triangles) shows the effect
shown at the 95 % confidence level and indicate the skewness in the of an incorrect absolute missing OH reactivity median. The values
missing OH reactivity data distribution below 2–4 km altitude. lie along the dashed lines if the missing OH reactivity values are
normally distributed. This Q–Q plot is for ATom2; the Q–Q plots
for ATom1 and ATom3 show less dramatic but similar behavior to
that of ATom2.
and a normal distribution. The standard normal quantiles are
plotted on the x-axis and the sample quantiles on the y-axis.
If the sample is perfectly normally distributed, then its values
will lie along a straight line. Data lying higher than the line the high-value data are more normally distributed; for mea-
for values on the right side of the normal distribution (posi- surement in the MBL, ∼ 20 % of high-value data are greater
tive standard normal quantiles) indicate more high-value data than expected.
than expected, while data higher than the line for values on All of these statistical tests provide strong evidence for an
the left side of the normal distribution (negative standard nor- abnormal amount of larger-than-expected missing OH reac-
mal quantiles) indicate fewer low-value data than expected. tivity in the MBL and up to 2–4 km altitude. It is possible that
Q–Q plots are shown for three ATom2 cases in Fig. 6. The some individual outliers of the 1 min data are due to anoma-
large boxes are the interquartile range between the first quar- lous OHR instrument issues. The few outlier data points at
tile (25 % of the data below it) and the third quartile (75 % higher altitude could be due to these instrument issues but
below). The missing OH reactivity data for altitudes greater may also be due to pollution plumes that were encountered.
than 8 km (red data) are normally distributed until the stan- However, it seems highly unlikely that ∼ 20 % of the higher-
dard normal quantile of 2, meaning that less than a few per- than-expected data at low altitudes could be caused by them.
cent of the data is higher than expected. On the other hand, Thus, OH reactivity in the MBL is likely missing and needs
the missing OH reactivity data in the MBL (blue data) are to be further investigated.
normally distributed between standard normal quantiles of
−2 and 1, meaning that a few percent of low-value data is 3.3 Global Missing OH reactivity in the marine
less than expected, but, more importantly, as much as 20 % boundary layer
of the high-value data is greater than expected. Also included
in Fig. 6 is the case for which we assume that the MBL miss- The frequent dips to below 200 m altitude gave ∼ 120 op-
ing OH reactivity zero value is actually greater by the missing portunities to examine the global distribution of missing OH
OH reactivity absolute uncertainty at 95 % confidence (gray reactivity. The measured OH reactivity averaged for each
data). Comparing these two MBL cases shows that changes dip (Fig. 7a, c, d) in the MBL (filled circles) is generally
in the mean missing OH reactivity values affect only the me- greater in the midlatitudes and tropics than in the higher lat-
dian value and not the distribution skewness. Q–Q plots for itudes, reaching as high as 4–5 s−1 over the Northern Hemi-
ATom1 and ATom2 (not shown) are less dramatic but still sphere Pacific Ocean. More typical calculated values are
have the same characteristics: for measurements above 8 km, 1.5 ± 0.6 s−1 , with relatively little variation. As a result, the
Atmos. Chem. Phys., 20, 4013–4029, 2020 www.atmos-chem-phys.net/20/4013/2020/A. B. Thames et al.: Missing OH reactivity 4023
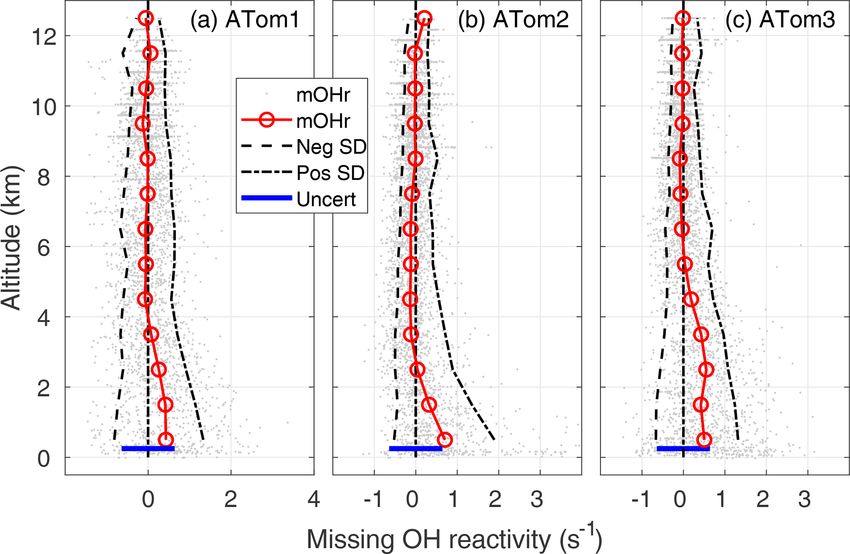
Figure 7. Global measured OH reactivity (a, c, e) and missing OH Figure 8. Missing OH reactivity averaged per-dip versus latitude
reactivity (b, d, f) for ATom1 (August), ATom2 (February), and over the Pacific Ocean (blue) and the Atlantic Ocean (gold).
ATom3 (October) at the per-dip time resolution. The black lines
trace the flight path during each deployment, identical to the yellow
tracks in Fig. 1. Color indicates the measured OH reactivity (−0.5 to except Fig. 8, they were not included in the correlation anal-
5 s−1 scale) and the missing OH reactivity (−0.5 to 2.5 s−1 scale), ysis described below.
while the yellow open circles indicate values in ATom2 above 2 s−1
that were not included in the correlation analysis. Triangles outlined 3.4 OH reactivity over land
by yellow are overland values for both measured OH reactivity and
missing OH reactivity. Of the approximately 120 dips in which OH reactivity mea-
surements were made, 14 % were over land (Fig. 7). The ma-
jority of these were made in the Arctic, with several being
over snow, ice, and tundra. As a result, the mean calculated
missing OH reactivity values reflect the measured OH reac- OH reactivity was only 1.35 s−1 , while the mean measured
tivity values. OH reactivity was 1.4 s−1 and the mean missing OH reac-
Missing OH reactivity varied from ∼ 0 to ∼ 2.5 s−1 tivity was −0.1 s−1 , which is essentially zero to well within
(Fig. 7b, d, f). The lowest values occurred predominantly in uncertainties. Note, however, that there is little missing OH
the polar regions but also occasionally in the midlatitudes and reactivity over most of the Arctic polar oceans as well as over
tropics. High values exceeding 1 s−1 occurred predominantly the Arctic land, which means that missing OH reactivity is
over the Northern Hemisphere Pacific Ocean. The highest generally low over the entire colder Arctic region. The great-
values occurred in ATom2, but values exceeding 2 s−1 were est measured missing OH reactivity was found in only one
also observed in ATom3. Missing OH reactivity appears to dip in ATom3 over the Azores, where the missing OH reac-
vary in both place and time. tivity was ∼ 2.5 s−1 .
A plot of missing OH reactivity as a function of latitude
shows these variations in place and time (Fig. 8). There is 3.5 Correlation of missing OH reactivity with other
a general tendency for missing OH reactivity to be greatest factors
over the midlatitudes and tropics and to decrease toward the
poles. A sampling bias (Fig. 7) may be the reason for near- From the procedure given in Sect. 2.6, missing OH reactivity
zero missing OH reactivity in the northern high latitudes and has the four strongest correlations with butanal (C3 H7 CHO),
not in the southern high latitudes. However, the high missing dimethyl sulfide (DMS, CH3 SCH3 ), formaldehyde (HCHO),
OH reactivity over the Northern Hemisphere Pacific Ocean and SST, as shown in Fig. 9. Missing OH reactivity also cor-
is exceptional. relates with some modeled pptv-level butanal products, but
A special note should be made regarding the North Pacific at these low levels these chemical species could not be the
data for ATom2. One flight (Anchorage, Alaska, to Kailua- source of the missing OH reactivity. Interestingly, missing
Kona, Hawai’i) accounts for missing OH reactivity values OH reactivity correlates only weakly with acetaldehyde and
greater than ∼ 2.5 s−1 . These points are anomalous in the chlorophyll. These correlations suggest that the missing OH
context of all ATom OH reactivity measurements, and they reactivity comes for an unknown VOC or OVOC that has
do not correlate with the modeled influence from fires, con- HCHO and butanal as products and is co-emitted with DMS.
vection, land, or the stratosphere. While present on all figures The correlation with SST suggests an ocean source, as a
www.atmos-chem-phys.net/20/4013/2020/ Atmos. Chem. Phys., 20, 4013–4029, 20204024 A. B. Thames et al.: Missing OH reactivity
Figure 10. Missing OH reactivity against HCHO for per-dip val-
Figure 9. The best correlations with missing OH reactivity for data
ues in the MBL over the Northern Hemisphere Pacific Ocean. The
at the per-flight resolution across all latitudes and hemispheres. The
ATom linear fit (black line) is shown with values for ATom1 (cir-
symbols are per-flight data for ATom1 (circles), ATom2 (squares),
cles), ATom2 (squares), and ATom3 (diamonds). The ATom linear
and ATom3 (diamonds). Black lines are least-squares fits to the per-
fit is compared to the linear fit for missing OH reactivity values
flight data (units are ppbv for butanal and DMS, pptv for HCHO,
of Mao et al. (2009) (red line) and to this linear fit with an offset
and ◦ C for SST).
correction (red dashed line; see text). Uncertainty bars are the ab-
solute uncertainty (95 % confidence) of the missing OH reactivity.
The statistical uncertainty in the slope and intercept of the linear fit
higher temperature implies more emissions. Either biologi- are given in the equation on the figure.
cal activity of phytoplankton in the sea surface microlayer
(Brooks and Thornton, 2017; Lana et al., 2011) or abiotic sea
surface interfacial photochemistry (Brüggemann et al., 2018) 68 % confidence level, the linear fits for missing OH reac-
could be the source of these VOCs and OVOCs. tivity against HCHO in ATom and INTEX-B agree to within
combined uncertainties. The ATom linear fit slope is only 2.7
3.6 Comparison to INTEX-B standard deviations from the INTEX-B slope, but it is 4.4
standard deviations from a line with zero slope, making it
HCHO is a good indicator of VOC photochemistry because it highly unlikely that missing OH reactivity is not correlated
is an oxidation product for many VOCs. Thus, HCHO should with HCHO. The INTEX-B and ATom slopes to the linear
correlate with missing OH reactivity. The ATom missing OH fits are not exactly the same. However, given the uncertain-
reactivity at the per-dip time resolution is compared to the ties, the HCHO dependence of the adjusted missing OH reac-
Mao et al. (2009) missing OH reactivity below 2 km for times tivity found in INTEX-B is consistent with that found for the
when NO is less than 100 pptv (Fig. 10). We use the per-dip ATom missing OH reactivity over the North Pacific Ocean.
time resolution of ∼ 5 min in this comparison rather than per-
flight time resolution to better align with the time resolution
in Mao et al. (2009) of 3.5 min. The anomalously high miss- 4 Discussion
ing OH reactivity from ATom2 is not included in the data
for the ATom linear fit. The INTEX-B correlation coefficient Mao et al. (2009) calculated the HO2 / OH ratio assuming
between missing OH reactivity and HCHO (R 2 = 0.58) is that the cycling between OH and HO2 was much greater than
better than the one found for ATom (R 2 = 0.35), but in the HOx production. That assumption is not valid for ATom be-
range of ATom HCHO (100–500 pptv) the ATom correlation cause the low NO and OH reactivity values reduce the recy-
coefficient is larger. cling to rates comparable to HOx production (Brune et al.,
The linear fit of the missing OH reactivity against HCHO 2020). On the other hand, by adding simple X photochem-
data from Mao et al. (2009) is given as the solid red line istry to the MCMv331 mechanism, as discussed in Sect. 2.5,
in Fig. 10. If instead the pressure-dependent offset is used it is possible to determine if the measured OH and HO2
for Mao et al. (2009), then the resulting missing OH reac- are consistent with observed missing OH reactivity. For case
tivity against HCHO follows the dashed red line. With the one, in which there is no OH produced in the X oxidation
absolute INTEX-B offset uncertainty at ±0.5 s−1 and the sequence, the modeled OH and HO2 become 30–40 % less
absolute ATom offset uncertainty at ±0.32 s−1 , both at the than observed at altitudes below 2 km. On the other hand,
Atmos. Chem. Phys., 20, 4013–4029, 2020 www.atmos-chem-phys.net/20/4013/2020/A. B. Thames et al.: Missing OH reactivity 4025
if XO2 and its products always autoxidize to produce OH 10−12 cm3 s−1 , then its mixing ratio will need to be more
(Crounse et al., 2013), then the modeled OH and HO2 be- than 10 ppbv.
come 10–20 % greater than observed. The optimum agree- If the unknown VOC is an alkane with a reaction rate coef-
ment between observed and modeled OH and HO2 would ficient with OH of 2.3×10⁻¹² cm3 s−1 , then an unlikely large
require a partial recycling of OH, but without knowing the oceanic source of 340 Tg C yr−1 will be necessary (Travis et
identity of X it is not possible to know the fraction of OH al., 2020). Adding this much additional VOC reduces global
that should be recycled in the chemical mechanism. Thus, modeled OH by 20–50 % along the ATom1 flight tracks, de-
this analysis neither supports nor refutes the missing OH re- grading the reasonable agreement with measured OH. How-
activity measurements. ever, if the VOC is an alkene for which OH is recycled in the
Several recent studies provide evidence for an unknown reaction sequence, then modeled OH will probably remain in
VOC or OVOC emitted into the atmosphere from the ocean. better agreement with measured OH. Large sources of long-
Oceanic sources have also been proposed for butanes and lived unknown VOCs, which do not have as large an impact
pentanes in some regions (Pozzer et al., 2010) and for on modeled OH, are also necessary to reduce but not resolve
methanol (Read et al., 2012). Measurements of biogenic the discrepancies between measured and modeled acetalde-
VOCs in coastal waters found monoterpenes, C12–C15 n- hyde, especially in the Northern Hemisphere summer. These
alkanes, and several higher aldehydes that could contribute issues between a global model and measured missing OH re-
to enhanced OH reactivity (Tokarek et al., 2019). activity and acetaldehyde need to be resolved.
Unexpectedly large abundances of acetaldehyde
(CH3 CHO) have been observed in the marine bound-
ary layer and the free troposphere (Singh et al., 2004; Millet
et al., 2010; Read et al., 2012; Nicely et al., 2016; Wang 5 Conclusions
et al., 2019), and the ocean is the suspected source. While
earlier measurements may have been compromised with Measured OH reactivity significantly exceeds calculated OH
interferences, recent measurements of unexpectedly large reactivity in the marine boundary layer during ATom. This
acetaldehyde abundances are supported by unexpectedly missing OH is most prominent over the tropical and North
large abundances of peroxyacetic acid, which is produced Pacific Ocean, where it had mean values of 0.4–0.7 s−1
almost exclusively through acetaldehyde oxidation (Wang for the different ATom deployments, but rose to more than
et al., 2019). Wang et al. observed that the ocean effects 2 s−1 at some locations. These higher values correspond to
on acetaldehyde were confined primarily to the MBL and ∼ 0.26 ppbv of a fast-reacting VOC, such as a sesquiterpene.
were able to approximately model the vertical distribution The correlation of missing OH reactivity with formaldehyde,
by using direct ocean emissions of acetaldehyde. However, butanal, dimethyl sulfide, and sea surface temperature and
it is possible that some of the observed acetaldehyde was the requirements for a smaller unknown reactive gas abun-
produced by rapid oxidation of VOCs or OVOCs emitted dance and ocean source strength suggest that an ocean source
from the ocean. of short-lived reactive gases, possibly VOCs or OVOCs, is re-
The missing OH reactivity is primarily in the MBL but sponsible. This missing OH reactivity is qualitatively consis-
often extends upward to as high as 2 to 4 km in some dips. tent with the observed unexpectedly large abundances of ac-
Above 4 km, the OH reactivity measurements are too near etaldehyde, peroxyacetic acid, and other oxygenated VOCs.
their LOD and thus too noisy to know if missing OH re- They may share the same cause. Finding this cause will re-
activity and acetaldehyde decrease the same way with alti- quire focused studies of detailed atmospheric composition in
tude, but it is possible that they do. A similar decrease with regions where missing OH reactivity and acetaldehyde ex-
altitude would imply that the unknown reactant lives long cesses are greatest.
enough to be distributed throughout the free troposphere. If,
on the other hand, the missing OH reactivity is only in and
just above the MBL, then the unknown reactant could have a Data availability. The data and model used in this paper are
much shorter lifetime. The lack of correlation between miss- publicly available: data: https://doi.org/10.3334/ORNLDAAC/1581
ing OH reactivity and acetaldehyde in the MBL suggests that (Wofsy et al., 2018); model framework: https://github.com/airchem/
F0AM (last access: 12 July 2019); and MCMv331 chemical mech-
the unknown reactant responsible for the missing OH reac-
anism: http://mcm.leeds.ac.uk/MCM/ (Rickard et al., 1997).
tivity is not necessarily connected only to an ocean source of
acetaldehyde.
From Eq. (5) and the measured missing OH reactivity, the
Author contributions. ABT, DOM, and WHB made the OH, HO2 ,
abundance of the chemical species X would typically be a and OH reactivity measurements; performed the model runs; ana-
few tenths of a ppbv, assuming that X is a sesquiterpene with lyzed the data; and wrote the manuscript. GMW provided support
a typical reaction rate coefficient of 1 × 10⁻¹⁰ cm3 s−1 . The of the use of the F0AM model framework used for the model runs.
mean value for X is 0.26±0.23 ppbv for the per-dip bins. If X WHB, DOM, ABT, HMA, DRB, TPB, RC, JDC, BCD, GSD, JPD,
is an alkane with a typical reaction rate coefficient of 2.3 × JWE, SRH, TFH, RAH, EH, MJK, KM, FLM, JMN, JP, TBR, JMS,
www.atmos-chem-phys.net/20/4013/2020/ Atmos. Chem. Phys., 20, 4013–4029, 2020You can also read