A field intercomparison of three passive air samplers for gaseous mercury in ambient air
←
→
Page content transcription
If your browser does not render page correctly, please read the page content below
Atmos. Meas. Tech., 14, 3657–3672, 2021
https://doi.org/10.5194/amt-14-3657-2021
© Author(s) 2021. This work is distributed under
the Creative Commons Attribution 4.0 License.

A field intercomparison of three passive air samplers for gaseous
mercury in ambient air
Attilio Naccarato1 , Antonella Tassone1 , Maria Martino1 , Sacha Moretti1 , Antonella Macagnano2 ,
Emiliano Zampetti2 , Paolo Papa2 , Joshua Avossa2 , Nicola Pirrone1 , Michelle Nerentorp3 , John Munthe3 ,
Ingvar Wängberg3 , Geoff W. Stupple4 , Carl P. J. Mitchell5 , Adam R. Martin5 , Alexandra Steffen4 , Diana Babi6 ,
Eric M. Prestbo6 , Francesca Sprovieri1 , and Frank Wania5
1 CNR-Institute of Atmospheric Pollution Research, Division of Rende, UNICAL-Polifunzionale,
87036 Arcavacata di Rende, CS, Italy
2 CNR-Institute of Atmospheric Pollution Research, Research Area of Rome 1, Via Salaria km 29,300,

00016 Monterotondo, Italy
3 IVL Swedish Environmental Research Institute, Gothenburg 41133, Sweden
4 Air Quality Processes Research Section, Environment and Climate Change Canada, Toronto, M3H 5T4, Canada
5 Department of Physical and Environmental Sciences, University of Toronto Scarborough, Toronto, M1C 1A4, Canada
6 Tekran Instruments Corporation, 330 Nantucket Boulevard, Toronto, Ontario, M1P 2P4, Canada

Correspondence: Attilio Naccarato (attilio.naccarato@iia.cnr.it) and Frank Wania (frank.wania@utoronto.ca)

Received: 12 November 2020 – Discussion started: 29 December 2020
Revised: 16 March 2021 – Accepted: 23 March 2021 – Published: 20 May 2021

Abstract. Passive air samplers (PASs), which provide              comparison with gaseous elemental mercury concentrations
time-averaged concentrations of gaseous mercury over the          recorded by Tekran 2537 automated mercury analyzers op-
timescale of weeks to months, are promising for filling a         erating alongside the PASs at both locations. The perfor-
gap in the monitoring of atmospheric mercury worldwide.           mance of the PASs was significantly better in Italy, with all of
Their usefulness will depend on their ease of use and ro-         them providing concentrations that are not significantly dif-
bustness under field conditions, their availability and afford-   ferent from the average concentrations of the Tekran 2537 in-
ability, and most notably, their ability to provide results of    struments. In Canada, where weather conditions were much
acceptable precision and accuracy. Here we describe a com-        harsher and more variable during the February through April
parative evaluation of three PASs with respect to their ability   deployment period, there are differences amongst the PASs.
to precisely and accurately record atmospheric background         At both sites, the MerPAS® is currently the most sensitive,
mercury concentrations at sites in both southern Italy and        precise, and accurate among the three PASs. A key reason
southern Ontario, Canada. The study includes the CNR-PAS          for this is the larger size and the radial configuration of the
with gold nanoparticles as a sorbent, developed by the Italian    MerPAS® , which results in lower blank levels relative to the
National Research Council, the IVL-PAS using an activated         sequestered amounts of mercury when compared to the other
carbon-coated disk, developed by the Swedish Environmen-          two PASs, which rely on axial diffusion geometries. Since
tal Research Institute, and the MerPAS® using a sulfur-           blank correction becomes relatively smaller with longer de-
impregnated activated carbon sorbent, developed at the Uni-       ployments, performance tends to be closer amongst the PASs
versity of Toronto and commercialized by Tekran. Detection        during deployments of 8 and 12 weeks.
limits are deduced from the variability in the amount of mer-
cury quantified in more than 20 field blank samples for each
PAS. Analytical and sampling precision is quantified through
22 triplicate deployments for each PAS, ranging in duration
from 2 to 12 weeks. Accuracy and bias are assessed through

Published by Copernicus Publications on behalf of the European Geosciences Union.
3658 A. Naccarato et al.: Comparing three passive air samplers for gaseous mercury
1 Introduction native or supplemental system to fill the gaps in worldwide
Hg monitoring. Compared to active sampling instruments,
Mercury (Hg) is a highly toxic pollutant, which due to its sig- passive air samplers (PASs) for gaseous Hg are relatively in-
nificant adverse impact on ecosystem and human health has expensive and thus can be deployed in large numbers, allow-
been added to the environmental political agenda at national, ing for the identification and characterization of Hg sources
regional, and global levels. In recent years, the adoption of through finely resolved spatial mapping (Huang et al., 2014;
the Minamata Convention has aimed to protect human health McLagan et al., 2016b; Pirrone et al., 2013). PASs are also
and the environment from Hg releases and emissions (UNEP, suitable for deployment at remote sites because they require
2013). Article 22 of the convention requires parties to for- no power supply and are based on the unassisted molecu-
mally assess, through the provision of “comparable moni- lar diffusion of gaseous Hg. Moreover, they are compact,
toring data on the presence and movement of mercury and portable, and easy to use. The adoption of PASs raises the
mercury compounds in the environment”, how effective the very real possibility of a sustainable, long-term global net-
structure and implementation of the convention is at meet- work of atmospheric Hg measurements that includes regions
ing its primary goal (Article 1). Article 19 of the Conven- not covered by existing efforts.
tion highlights the importance of environmental monitoring. Over the past few years, a number of mercury PASs have
While such efforts should build on existing monitoring net- been developed, each with different materials and geometries
works (UNEP, 2013), this will also require research and de- (Macagnano et al., 2018; McLagan et al., 2016a; Wängberg
velopment of monitoring technologies. et al., 2016). While each sampler has its merit, the perfor-
The accurate assessment of air pollutants has increas- mance of different designs has yet to be compared systemat-
ingly come into focus as the need to understand their trans- ically. This remains an impediment for understanding which
port and mechanisms of deposition to ecosystems grows PASs may be most appropriate for possible adoption in mon-
(Dinoi et al., 2017; Moretti et al., 2020; Naccarato et itoring networks or whether a mix of designs can be reliably
al., 2018, 2020; Tassone et al., 2020). Special attention is employed.
given to the atmosphere because it is a well-recognized In this paper, for the first time, we report the results of a
pathway for Hg distribution throughout various environmen- field-based intercomparison campaign and a controlled, blind
tal compartments (Driscoll et al., 2013). In this context, performance comparison among different Hg PASs. The per-
many regional atmospheric networks have been operating formance of three different PASs were evaluated at two mon-
since the mid-1990s, including the US National Atmospheric itoring sites, located in Italy and Canada, over a 3-month pe-
Deposition Network-Mercury Deposition Network (NADP- riod. The PASs involved in this study were developed by the
MDN) (Vermette et al., 1995), the Environment and Cli- Italian Institute of Atmospheric Pollution Research (CNR-
mate Change Canada Atmospheric Mercury Measurement IIA) (Macagnano et al., 2018), the Swedish Environmental
Network (ECCC-AMM), the Arctic Monitoring and As- Research Institute (IVL) (Wängberg et al., 2016), and the
sessment Programme (AMAP) group of long-term measure- University of Toronto (McLagan et al., 2016a). Data were
ments (Arctic Council, 1991), and the European Monitoring submitted for compilation to a blind third party to control for
and Evaluation Programme (EMEP) (Tørseth et al., 2012). In reporting bias. The PASs were assessed for accuracy through
2010, the Global Mercury Observation System (GMOS) was comparison with active sampling data, for precision via repli-
created in an attempt to establish a global atmospheric Hg cation, and for sensitivity through the assessment of blanks
measurement network, integrating EMEP and AMAP, with and detection limits, as well as in terms of the linearity of
more than 40 monitoring sites distributed worldwide. Since uptake over extended deployment periods.
their beginning, there has been a growing interest in improv-
ing global monitoring of Hg by increasing the spatial resolu-
tion of gaseous Hg data, especially in remote locations and in 2 Methods
developing countries (Pirrone et al., 2013), in order to meet
Minamata Convention objectives. 2.1 Passive air samplers (PASs)
Current methodologies, however, have a limited ability
to monitor Hg on a truly global scale. Indeed, the use of Characteristics of the three PAS designs included in the
active automated sampling systems based on sorbent traps comparison are summarized in Table 1. The CNR-IIA PAS
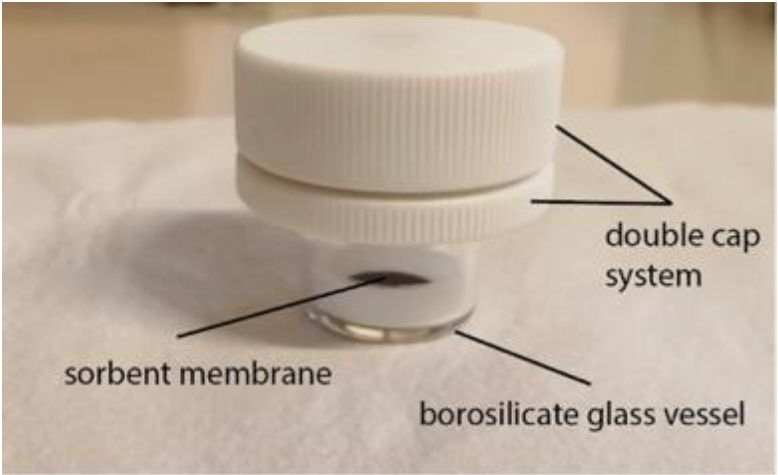
with gold amalgamation, which are desorbed at relatively (CNR-PAS) consists of a fibrous quartz filter coated with sor-
fine time resolution (3–5 min) for Hg quantification (Brown bent material, which is attached to the bottom of a borosili-
et al., 2010; Landis et al., 2002; Munthe et al., 2001; Stef- cate glass vessel equipped with a double cap system to mini-
fen et al., 2012; Wängberg et al., 2001), may be limited by mize operator handling and to avoid contamination that could
cost and the need for reliable electricity, consumables, and result from the cap opening (Macagnano et al., 2018). The
maintenance by well-trained operators (Huang et al., 2014; IVL-PAS consists of a disk coated with an activated car-
McLagan et al., 2016b; Pirrone et al., 2013). Given these con- bon sorbent that is inserted in a badge-type device (Wäng-
straints, passive sampling has been proposed as a viable alter- berg et al., 2016). The geometry of CNR-PAS and IVL-PAS
Atmos. Meas. Tech., 14, 3657–3672, 2021 https://doi.org/10.5194/amt-14-3657-2021
A. Naccarato et al.: Comparing three passive air samplers for gaseous mercury                                             3659

makes them both axial diffusion samplers. The MerPAS® ,            tion situated at few meters from the deployment area that
developed at the University of Toronto and commercialized          was equipped with a thermo-hygrometer (LSI LASTEM
by Tekran Instrument Corp., consists of sulfur-impregnated         DMA875) for the monitoring of temperature and relative hu-
activated carbon sorbent (HGR-AC, Calgon Carbon Corp.)             midity, a pluviometer (LSI LASTEM DQA030) for the ac-
housed in a stainless-steel mesh cylinder that is inserted         quisition of precipitation depth, and an anemometer (LSI
into a commercial white Radiello® (Sigma Aldrich) diffu-           LASTEM DNA821) for the acquisition of wind speed and
sive body (McLagan et al., 2016a). The MerPAS® is a radial         direction. In Rende, the weather conditions were charac-
sampler.                                                           terized by an average temperature of 12.0 ± 4.6 ◦ C (range
                                                                   0.9–30.6 ◦ C) and average relative humidity of 60.4 ± 18.1 %
2.2   Study design                                                 (range 13.6 %–97.9 %). Total rainfall over the study period
                                                                   was 1.71 mm and no precipitation fell as snow. The wind
The study design involved the side-by-side deployment of the       blew mainly from the south-southeast with an average speed
three PAS types in the vicinity of existing active air sampling    of 1.2 ± 0.9 m s−1 (range 0 and 6.9 m s−1 ). Meteorological
sites in Rende (Italy) and Toronto (Canada) during late winter     data in Toronto were obtained from a co-located integrated
and early spring of 2019. At both sites, 11 overlapping PAS        weather station (Vaisala WXT520) operated by the Ontario
deployment periods ranged in length from 2 to 12 weeks,            Ministry of Environment, Conservation and Parks. Tempera-
whereby each deployment involved triplicate PASs and one           ture was variable through the spring season with a mean tem-
unexposed PAS as a field blank, for a total of 88 PASs of each     perature of 0.6±6.6 ◦ C (range −15.8–21.5 ◦ C), average wind
type. In some cases, additional storage blanks were taken.         speed of 2.4 m s−1 (range of hourly averages 0 to 11 m s−1 ),
Each participating research group supplied their PASs along        and average relative humidity (based on raw, uncorrected
with deployment instructions, performed the chemical anal-         data) of 64.7 ± 15.7 % (range 18.5 %–92.1 %). The predom-
ysis, and reported volumetric air concentrations and basic         inant (20.5 % of the time) wind vector was from the west,
QA/QC results to an independent third party. Gaseous ele-          between 260 and 285◦ . Total precipitation during the PAS de-
mental mercury concentrations recorded by active air sam-          ployment period was 225 mm, of which 168 mm fell as rain
pling instruments, averaged for the 22 deployment periods,         and the remainder as snow.
were reported at the same time. After data submission, only
the following changes were made to the data: a typograph-          2.4   Active air sampling
ical error affecting the assumed uncertainty of the sampling
rate of the IVL-PAS was corrected. The blank correction for        At both sites, gaseous mercury concentrations were ob-
the CNR-PAS was performed using the average of the field           tained at 5 min intervals using Tekran 2537x and 2537a auto-
blanks at one location instead of using field blanks specific      mated mercury analyzers (Tekran Instruments Corporation,
for a deployment, in order to be consistent with the blank         Toronto, ON, Canada). In Toronto, two systems – both a
correction applied for the other two PASs. Additional sub-         Tekran 2537x and a Tekran 2537a (5037 and 0075 units, re-
mitted results for the MerPAS® with temperature-adjusted           spectively) were operated in parallel to quantify the dupli-
sampling rates were disregarded, as they were the only set         cate precision of the active air sampling technique. These
of results currently able to take into account this effect, and    systems collect air onto gold traps, which are thermally des-
temperature adjustment did not improve the accuracy of the         orbed for quantification of mercury by atomic fluorescence
MerPAS® results. Although the field sites were in Canada           spectroscopy (Ebinghaus et al., 2011). The sampling was per-
and Italy, respectively, none of the groups reporting the re-      formed with airflow rates of 1.5 and 1.0 L min−1 at Rende
sults for the PASs had prior knowledge of the results from         and Toronto, respectively. To ensure that the Tekran systems
the active measurement at either location.                         were operating consistently, flow verifications and calibra-
                                                                   tions were carried out before and during the intercompari-
2.3   Sampling sites                                               son campaign by external injections of mercury and by using
                                                                   the instrument’s internal mercury permeation source for au-
Two existing active air monitoring sites in Italy and Canada       tomatic calibration at 23 and 72 h intervals in Toronto and
were used for the performance evaluation of the three dif-         Rende, respectively, throughout the monitoring period.
ferent PASs. The Italian site was a monitoring station close          Calibration results and data acquisition were quality con-
to the CNR Institute of Atmospheric Pollution Research             trolled according to established quality assurance and qual-
(39◦ 210 27.200 N, 16◦ 130 53.700 E) in Rende. The Canadian site   ity control procedures (QA/QC). The GMOS-Data Quality
was located on the grounds of the Downsview office of En-          Management (G-DQM) approach (D’Amore et al., 2015)
vironment and Climate Change Canada in a northern sub-             was used to check the Tekran 2537x mercury concentration
urb of Toronto (43◦ 460 49.6500 N, 79◦ 280 2.4600 W). During the   data collected at the Rende site and to monitor the perfor-
campaign, air temperature, relative humidity, wind speed,          mance of the instrument in terms of baseline shifts, sample
and wind direction were measured at both sites. In Rende,          volume cell bias, and difference between gold traps, thus
meteorological data were recorded at a meteorological sta-         verifying that it adhered to standard procedures in a way

https://doi.org/10.5194/amt-14-3657-2021                                            Atmos. Meas. Tech., 14, 3657–3672, 2021
3660 A. Naccarato et al.: Comparing three passive air samplers for gaseous mercury
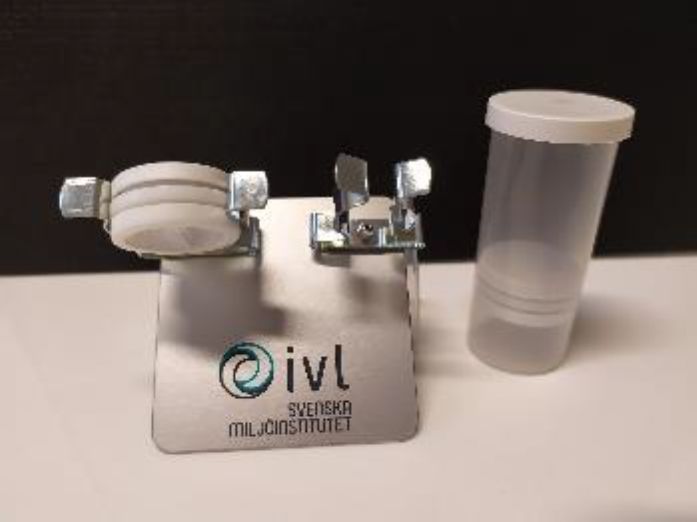
Table 1. Characteristics of the three passive air samplers for gaseous mercury that were compared in this study.
CNR-PAS IVL-PAS MerPAS®
Macagnano et al. (2018) Wängberg et al. (2016) McLagan et al. (2016a)
Photograph
Design principle Axial diffusion badge Axial diffusion badge Radial diffusion
Sorbent material TiO2 nanoparticles, Activated carbon impregnated 0.6 g of sulfur-impregnated
finely functionalized with with 75 µL 0.1 % iodine activated carbon (HGR-AC)
smaller gold nanoparticles solution (not reusable) (not reusable)
(reusable)
Sorbent carrier Fibrous quartz filter Activated carbon and cellulose Stainless-steel mesh
(Whatman) filters cylinder (reusable)
Diffusive barrier Nylon membrane Membrane FALP White Radiello® diffusive body,
porous high-density polyethylene
(reusable)
Overall sampler Height: 3.1 cm Height: 1.2 cm Height: 7.6 cm
dimensions Diameter: 2.4 cm (w/o the cap) Diameter: 2.5 cm Diameter: 7.2 cm
Effective diffusion 2.8 cm (3.1 cm2 ) 1.15 cm (4.9 cm2 ) 0.77 cm (without air boundary
pathlength (area) layer) (∼ 7.5 cm2 on outer
sorbent surface, ∼ 30 cm2 on
diffuser surface)
Shelter HDPP side shield with eight seats used Metallic disk top, Each sampler is integrated within
as PAS holder and for protection of no side shield, a compact PET protective shelter with
the samplers from atmospheric agents four seats (reusable) a downward-facing mesh-screened
and solar irradiation (reusable) lid (reusable)
Deployment Remove from double-sealed aluminum Open simple sealed bag, Open simple sealed bag, remove tape
bag, remove screw cap and store in remove sampler from canister from seal, replace solid screw cap
bag while sampler snaps into broom snap into broom style clip with mesh screen cap and install to
holder style clip mounted to rain mounted to rain hood. Travel mounting bracket with top threaded post
hood. Field blank sampler never blanks were taken to field and cap-nut. Field blank sampler never
opened, installed with cap for site, but not opened. opened and installed with solid cap
duration of sample. for duration of sample.
Storage and Double cap seal, heat- and Plastic tube placed in Integrated, compact PET protective
Transport zip-sealed aluminum bags a plastic bag shelter is used for storage and
containing scrubber transport. Solid lid is tape sealed
and sampler placed in plastic bag.
Hg analysis Thermal desorption, Wet-digestion with chemical Thermal desorption, gold amalgamation
method gold amalgamation reduction, gas–liquid separation, with CVAAS detection
with CVAFS detection gold amalgamation with (USEPA Method 7473)
CVAFS detection
Analytical CNR-custom-built thermal IVL-custom-built thermal Commercially available automated
equipment desorption units interfaced desorption unit interfaced total mercury analyzer
with a Tekran 2537 mercury with a Tekran 2500 mercury (e.g., NIC MA-3000,
vapor analyzer vapor analyzer Milestone DMA-80)
Sampling rate 0.0147 ± 0.0007 m3 d−1 0.030 ± 0.002 m3 d−1 0.111 ± 0.017 m3 d−1
Atmos. Meas. Tech., 14, 3657–3672, 2021 https://doi.org/10.5194/amt-14-3657-2021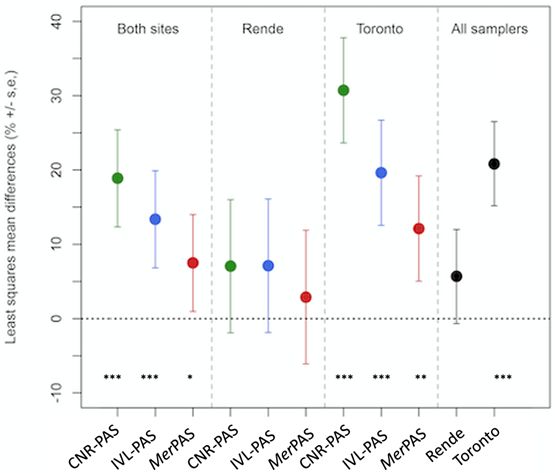
A. Naccarato et al.: Comparing three passive air samplers for gaseous mercury                                                 3661

that minimizes losses and inaccuracies in data production.          ments were in triplicate, with the addition of a field blank
The Toronto QA/QC system used to check all data collected           for each type of PAS to check the potential for contamina-
by Tekran analyzers was based on the research data man-             tion during transport, storage and handling of the samplers.
agement quality (RDMQ) standards defined in Steffen et              The CNR-PAS and MerPAS® field blanks were deployed in
al. (2012). These standards invalidate data based on cell bias      the field alongside each triplicate without opening their cap
and sample volume, while also monitoring for baseline shifts        or lid. The IVL-PAS field blanks were not deployed at the
and deviation amongst other warning flags.                          actual field locations, but were only briefly transported to the
                                                                    deployment site during a sample changeover. During the re-
2.5   PAS deployment                                                mainder of the 12 weeks of the study, they stayed in storage
                                                                    in indoor locations in Rende and Toronto. Additionally, five
Samplers were sent by international courier from each par-          storage blanks of the CNR-PAS in each of Rende and Toronto
ticipating laboratory to the two sampling locations shortly         were used to check for mercury contamination during the
before the first deployment period. Following instructions          PAS storage and transport. There were only five such stor-
provided by each participating research group, the samplers         age blanks of the MerPAS® in Rende, i.e., none in Toronto.
were deployed on a metal support rack at a height of about
4 m above ground to facilitate free air circulation (Fig. S1 in     2.6   Analysis of PAS sorbents for Hg
the Supplement). At both sites, all PASs were within 2 m of
each other and from the inlet of the active air sampler. When       Mercury in CNR-PASs was quantified using a CNR-IIA-
not deployed, samplers were stored on-site at room tempera-         designed thermal desorption system, comprising a glass
ture. Samplers were returned to the participating laboratories,     cylinder housed in a heater furnace connected to a mer-
again by international courier, shortly after the end of the last   cury vapor analyzer (Tekran 2537a) for Hg detection by
deployment.                                                         CVAFS. The sorbent membrane is placed into the cylin-
   While the three PASs were treated the same as much as            der, which is heated to 550 ◦ C to desorb the trapped mer-
possible, there were some unavoidable differences. The IVL-         cury (Macagnano et al., 2018). After analysis, the collec-
PASs made return air trips by international courier to both         tion surface of the CNR-PASs can be regenerated for reuse
sampling sites and were deployed at both sites by personnel         (Macagnano et al., 2018). The accuracy of the lab-made ana-
with no experience with this sampler. The CNR-PAS did not           lytical system was periodically verified using CNR-PAS with
need to undergo extended travel to the Rende site and the           a known Hg concentration, while the Tekran system was cal-
MerPAS® was only transported by car between different lo-           ibrated by automatic and manual procedures.
cations within the city of Toronto (Tekran facilities, Univer-         For mercury determination in IVL-PASs, the carbon fil-
sity of Toronto Scarborough Campus, ECCC sampling site in           ters were carefully removed from each sample and individ-
Downsview). At Rende, CNR-PASs were deployed by per-                ually boiled in an acid solution (HNO3 /H2 SO4 ) for 5–6 h.
sonnel with some familiarity working with this sampler; the         BrCl was added to the cold solution as an oxidant and sub-
same occurred at Toronto with the MerPAS® . In both loca-           sequent reduction was performed by adding SnCl2 prior to
tions, several personnel were involved in the deployment and        analysis. Excessive BrCl was reduced using hydroxylamine
retrieval of PASs over the 12 weeks of the study, but it was        hydrochloride prior to addition of SnCl2 . Liquid–gas sep-
always the same personnel who handled all three PASs at any         aration was performed using a purge system with Hg pre-
one of the seven deployment and retrieval dates.                    concentration on a gold trap. The sample gold trap was
   After removal of the top cap, CNR-PASs and IVL-PASs              analyzed in an IVL-custom made desorption system con-
were positioned in the seats of the shelter with the diffusive      nected to a CVAFS detector (Tekran 2500 unit) (Wängberg
membrane or steel mesh net facing downwards. After expo-            et al., 2016).
sure, CNR-PASs were removed from the seat, closed with                 Determination of mercury concentration in the activated
the top cap, and placed into an aluminum bag containing             carbon sorbent used in the MerPAS® was carried out at the
a mercury scrubber cartridge. IVL-PASs were similarly re-           Tekran laboratory in Toronto using a Nippon MA-3000 sys-
moved, placed in a plastic container, and then in a plastic         tem for automated combustion, amalgamation, and detection
bag. MerPAS® samplers were secured to the metallic sup-             by atomic absorption spectroscopy. Throughout the analysis,
port using the embedded screw and bolt dowel and the solid          standard reference materials and liquid Hg standards (2 to
lid was replaced with the screened lid. After exposure, the         8 ng) added to activated carbon were analyzed. Standard ref-
screened lid was replaced by a solid lid, and the device was        erence materials were bituminous coal (NIST 2684b, NIST
sealed with tape and placed in a Ziploc bag.                        2685) and an activated carbon sample generated in-house at
   The PASs were deployed from 5 February to 30 April               the University of Toronto.
2019, following a sampling plan that included four deploy-             For QA/QC of mercury analytical data during sorbent
ments of 2 weeks, three deployments of 4 weeks, two de-             analyses, both analytical and field blanks were used. Analyti-
ployments of 6 weeks, and one deployment each of 8 and              cal blanks were analyzed before deployment and sampling to
12 weeks (Table S1 in the Supplement). All PAS deploy-              ensure sorbent materials (HGR-AC, AuNPs-TiO2 NPs layer,

https://doi.org/10.5194/amt-14-3657-2021                                              Atmos. Meas. Tech., 14, 3657–3672, 2021
3662 A. Naccarato et al.: Comparing three passive air samplers for gaseous mercury
and activated carbon layer for MerPAS® , CNR-PAS, and first calculating the percentage concentration differences be-
IVL-PAS, respectively) were free from Hg contamination. tween actively sampled concentrations [Hg]Tekran , and those
The field blanks were used to ascertain whether there was derived from each of the paired PASs [Hg]PAS . These percent
contamination during sampler assembly, shipping, transport, concentration differences were calculated as
deployment, retrieval, and storage. Storage blanks were used
[Hg]Tekran − [Hg]PAS
to assess any contamination due to the transport and storage % difference = × 100 . (2)
only, i.e., not during the handling of the PASs during deploy- [Hg]Tekran
ment and retrieval operations. Based on these calculations, we then used absolute concen-
The samplers were deployed in triplicate during the cam- tration differences for subsequent analysis. First, we used a
paign to assess the precision of each PAS. Method detection variance partitioning analysis to quantify the proportion of
limits (MDLs) and practical quantification limits (PQLs) in the overall variability in absolute percentage concentration
ng were calculated as 3 and 10 times the standard deviation of difference values (calculated in Eq. 2), which is explained by
the amount of mercury in field blanks, respectively. The lim- (1) deployment site, (2) deployment time, (3) Tekran identity
its of detection (LOD) and quantification (LOQ) in ng m−3 (in the case of Toronto), and (4) PAS type. This variance par-
were obtained by dividing the MDL and PQL by the product titioning analysis was based on n = 99 total observations of
of sampling rate (SR) and deployment time (days). absolute percent concentration differences. To perform this
2.7 Determination of volumetric Hg concentration analysis, we first fit a linear mixed effects model to our data
using the “lme” function in the “nlme” R package (Pinheiro
The average Hg concentration in the atmosphere measured et al., 2017); in this model, absolute percent concentration
by each sampler (C; ng m−3 ) was obtained from the analyzed differences are predicted as a function of a single fixed ef-
mass of Hg in the sorbent material according to Eq. (1): fect (i.e., the model intercept, which represents the overall
mean percent concentration difference) and four random ef-
m
C= , (1) fects (i.e., four nested factors including (1) PAS type, within
t × SR (2) Tekran IDs, alternatively, the deployment location, within
where m is the mass of sorbed Hg (ng) corrected for the blank (3) deployment periods, within (4) deployment site, i.e., one
contamination, t is the deployment time of the PAS (days, of Rende or Toronto). Based on this model, we then used
”d”) and SR is the sampling rate of the PAS (m3 d−1 ). Be- the “varcomp” function in the “ape” R package (Paradis et
cause field blank levels were not significantly different be- al., 2004) to quantify the proportion of variation in concen-
tween different deployment periods, but were different be- tration differences that owes to each of the four nested fac-
tween Rende and Toronto, the average field blank contamina- tors.
tion at one location was used for blank correction. Constant Based on these results, we then sought to calculate and
and previously experimentally derived SR values were used compare mean absolute concentration percentage differences
for each PAS; these rates were not adjusted for deployment- across both PAS types and sites, while accounting for (1) the
specific meteorological conditions. For the CNR-PASs, the non-independence of samples, (2) unbalanced sample sizes
SR was 0.0147 m3 d−1 with an uncertainty of 0.0007 m3 d−1 . across sites and PASs, and (3) potentially confounding ef-
This value is slightly different from a previously reported one fects of (a) sampling deployment times and (b) sites. There-
(Macagnano et al., 2018) because it is the result of further im- fore, we parameterized a second linear mixed effects model
provements in CNR-PAS geometry. For the IVL-PASs, the where absolute concentration differences were predicted as
SR was 0.028 m3 d−1 in Rende and 0.029 m3 d−1 in Toronto a function of PAS type, site, and a PAS-by-site interac-
(calculated using the diffusivity for Hg according to Mass- tion term as fixed factors; this mixed model statistically ac-
man, 1999). The SR of the MerPAS® (0.111±0.017 m3 d−1 ) counted for the non-independence of samples by including
is higher than that of the other two PASs, which is a func- deployment period and Tekran identity as nested random
tion of the MerPAS® ’s radial design. This SR, which was effects. Based on this model, we then used the “lsmeans”
derived from a number of calibration experiments conducted and “difflsmeans” functions in the “lmerTest” R package
by Tekran, deviates slightly from previously published val- (Kuznetsova et al., 2017) to calculate and statistically com-
ues (McLagan et al., 2016a, 2018) because of small modifi- pare least square mean concentration difference values (and
cations between the MerPAS® and the original sampler. For associated standard errors) across each PAS type, site, and
each PAS type, the uncertainty of the SR is directly propa- PAS-by-site combination. This analysis therefore assessed
gated to the volumetric air concentration. whether least square mean concentration differences in any
of these groups differed significantly from one another or dif-
2.8 Statistical analysis fered significantly from zero.
All statistical analyses were performed using R v. 3.3.3 soft-
ware (R Foundation for Statistical Computing, Vienna, Aus-
tria). We evaluated the relative accuracy of different PASs, by
Atmos. Meas. Tech., 14, 3657–3672, 2021 https://doi.org/10.5194/amt-14-3657-2021A. Naccarato et al.: Comparing three passive air samplers for gaseous mercury 3663
3 Results and discussion
3.1 Mercury concentrations obtained by active
sampling
The concentration of gaseous mercury in ambient air was de-
termined by averaging the values recorded by the Tekran Hg
analyzers every 5 min during a specific PAS deployment pe-
riod. The complete series of valid Hg concentration data is
displayed in Fig. S2 in the Supplement. Interruptions are due
to instrument calibration or maintenance. As mentioned in
Sect. 2.4, the values obtained at Rende were validated against
the GMOS-Data Quality Management (G-DQM), resulting
in 98.9 % valid data. The average measured Hg concentration
at Rende over the 12 weeks was 1.72 ± 0.25 ng m−3 , with a
range from 0.88 to 8.80 ng m−3 . The mean Hg concentration
during the 11 PAS deployment periods was quite constant,
varying between 1.66 and 1.79 ng m−3 .
At Toronto, the use of the RDMQ standards for data qual-
ity assessment and measurement gaps during daily calibra-
tion periods, hourly standard additions, and instrument main-
tenance resulted in 82.5 % valid data coverage throughout Figure 1. Mean and standard deviation of field blank levels, method
the entire deployment period for the primary 2537x ana- detection limit (MDL), practical quantification limit (PQL), limit of
lyzer. The secondary co-located 2537a analyzer experienced detection (LOD), and limit of quantification (LOQ) for the three
an 8 % shift in the mass flow meter calibration during the passive air samplers deployed in Rende, Italy, and Toronto, Canada.
study. Since it was not possible to determine when the shift
occurred, data from this analyzer were not used for compar-
ison with the PAS (but were included in the statistical analy-
sis described in 2.8). The active Hg concentration ranged be- els between Rende and Toronto, whereas the CNR-PAS and
tween 1.17 and 34.6 ng m−3 , and averaged 1.57 ng m−3 with IVL-PAS showed a slight difference between the two sites. In
a standard deviation of 0.45 ng m−3 . Five short periods of the case of the MerPAS® and CNR-PAS where field blanks
elevated concentrations (over 4 ng m−3 ) were observed over were deployed together with samplers in the field for variable
the study period, the maximum reaching 34.6 ng m−3 . Al- lengths of time, there was no indication that the field blank
though unusual, the elevated values were observed on both contamination increased with deployment duration (Table S2
the primary and secondary analyzers, lasted between 10 and in the Supplement). This is consistent with blank contam-
35 min, and are therefore accepted as valid. The Toronto site ination arising during handling and transport and not dur-
is located in a northern suburb of Canada’s largest urban cen- ing placement at the deployment location. However, in the
ter and it is believed that these elevated episodes are a result case of the CNR-PAS, the storage blanks (0.066 ± 0.010 ng,
of nearby industrial mercury emissions. Similar to Rende, n = 5, Toronto; 0.042±0.009 ng, n = 5, Rende) have, in gen-
the mean Hg concentration for each deployment varied only eral, considerably lower levels than the field blanks (0.20 ±
slightly, between 1.51 and 1.63 ng m−3 . 0.07 ng, n = 5, Toronto; 0.15±0.02 ng, n = 5, Rende), which
implies that the deployment and retrieval of those samplers
3.2 Comparison of passive air sampler performance does introduce some contamination. The amount quantified
in MerPAS® storage blanks (0.187±0.009 ng, n = 5, Rende)
3.2.1 Blanks and detection limits is only marginally lower than the amount in field blanks
(0.23 ± 0.06 ng, n = 10, Rende).
The amount of Hg in the field blanks of the different passive The relative standard deviation (RSD) of levels in field
air samplers is summarized in Table S2 in the Supplement. blanks was also similar between the three samplers, being
The averages of those values are displayed in the top row of slightly lower in the IVL-PAS (∼ 18 %) than in the MerPAS®
panels in Fig. 1. The amounts in field blanks are similar be- and CNR-PAS (∼ 23 % on average). This may be a result of
tween the different passive samplers, ranging from generally the IVL-PAS field blanks all being treated the same, whereas
less than 0.2 ng in the CNR-PAS to slightly above 0.4 ng in the MerPAS® and CNR-PAS field blanks had slightly differ-
the IVL-PAS. The blank levels of the CNR-PAS are the low- ent handling processes, as they were deployed alongside the
est recorded during the campaign, especially for exposure in exposed samplers. The RSD of the CNR-PAS deployed in
Rende. The MerPAS® showed no difference in the blank lev- Rende was notably lower (12 %) than in Toronto (34 %).
https://doi.org/10.5194/amt-14-3657-2021 Atmos. Meas. Tech., 14, 3657–3672, 20213664 A. Naccarato et al.: Comparing three passive air samplers for gaseous mercury
The amount of mercury detected in field blanks was used the amount of Hg quantified in the PAS during the 22 dif-
for the calculation of the method detection limit (MDL), the ferent deployments. The precision of the quantified amount
practical quantification limit (PQL), the limit of detection in a PAS reported in this table is a combined measure of
(LOD), and limit of quantification (LOQ). Field blank lev- the consistency and reproducibility of PAS manufacturing,
els, MDLs, PQLs, LODs, and LOQs for the three samplers deployment, and handling as well as the laboratory analyti-
separated for the two locations are displayed in Fig. 1. The cal process. Table S6 in the Supplement reports the blank-
numerical results can be found in Table S3 in the Supple- adjusted amount of Hg in the PASs. The precision of the
ment. The MDL and PQL are derived from the variability in blank-corrected amounts reported in this table additionally
the field blank levels. Therefore, they are similar between the accounts for the consistency and reproducibility of the blank
three samplers (middle row of panels in Fig. 1). Even though contamination.
the RSD of the field blank levels is smaller for the IVL-PAS, The relative standard deviation in percent (RSD%) of the
the larger absolute SD means that it has slightly higher MDL mean amount of Hg quantified in three samplers is used as a
and PQL (∼ 0.25 and ∼ 0.83 ng, respectively) than the other measure of precision. Blank correction was performed using
two samplers (0.13 and 0.45 ng for the CNR-PAS on average, the average value of all field blanks deployed at one location,
0.16 and 0.54 ng for the MerPAS® ). because the field blanks did not show a dependence on de-
In terms of volumetric air concentrations, the LODs and ployment length for any sampler but did display differences
LOQs decrease with the sampled air volume, which, in turn, between Rende and Toronto deployments for some samplers.
increases with a sampler’s SR and deployment period. The The precision of the blank-corrected amount was calculated
bottom row of panels in Fig. 1 therefore displays the LODs by propagating the standard deviations of the amount in ex-
and LOQs for each of the five deployment times used in posed samplers and of the amounts in field blanks. Fig. 2 dis-
this study. Larger differences between the MerPAS® and the plays the replicate precision for the three samplers, averaged
other two PASs become apparent, because the former has for different deployment lengths, across the two locations,
a SR that is ∼ 4 to ∼ 8 times higher than that of the lat- and across all replicated deployments. Numerical results are
ter and accordingly samples Hg from a much larger air vol- presented in Table S7 in the Supplement.
ume during similar deployment times. This implies that even When judged based on the amount of Hg quantified in trip-
though the absolute amounts of Hg in field blanks are simi- licated samplers, MerPAS® , IVL-PAS, and CNR-PAS had
lar between the samplers, the amount in field blanks relative an average precision across all 22 replicated deployments of
to the amounts in exposed samplers is quite different (Ta- 3 %, 9 %, and 7 %, respectively. In the case of the MerPAS®
ble S4 in the Supplement). Field blank contamination in the this is consistent with previously reported replicated preci-
MerPAS® does not exceed 8 % of the quantified amount in sion, e.g., 3.6 % in a global study involving deployments in
an exposed sampler (range 1 % to 8 %), whereas that per- numerous locations (McLagan et al., 2018). Replicate pre-
centage in the IVL and CNR-PAS is similar and ranged be- cision was generally similar in Rende and Toronto deploy-
tween 7 %–47 %, with higher values during short periods ments; only the IVL-PAS had on average slightly poorer
of deployment. This means that during a two-week deploy- precision in Rende (∼ 11 %) than in Toronto (∼ 7 %). The
ment the MerPAS® has an LOD of 0.11 ng m−3 and an LOQ replicate precision of the MerPAS® improved slightly with
of 0.34 ng m−3 , which are ∼ 6 times lower than the LODs increasing deployment length (from ∼ 5 % for the 2-week
and LOQs of the IVL-PAS and the CNR-PAS. It is impor- samples to ∼ 2 % for the 12-week samples). In general, one
tant to stress that blank contamination and therefore also might expect larger amounts of Hg to be quantified more
MDL/PQL and LOD/LOQ are study specific and therefore reliably than smaller amounts, which would explain such a
need to be determined during every study anew. The two de- trend. The MerPAS® , for example, collected ca. 3 ng of Hg
ployments of the CNR-PAS in Toronto and Rende illustrate in a 2-week period but ca. 17 ng in a 12-week deployment.
this very effectively. The lower and more consistent blank The IVL-PAS followed a similar trend of improving preci-
levels of the CNR-PASs deployed in Rende compared to sion with longer deployment between the 4-week (∼ 13 %)
those deployed in Toronto translate into 4 times lower LODs and the 12-week samples (∼ 5 %). However, the relatively
(0.28 ng m−3 vs. 1.02 ng m−3 for a two-week deployment) good precision of the 2-week samples (∼ 7 %) does not fit
and LOQs (0.9 ng m−3 vs. 3.4 ng m−3 for a 2-week deploy- this pattern. The precision of the CNR-PAS was not related
ment). to deployment length, with the poorest precision for the 8-
week deployments (∼ 13 %) and the best precision for the
3.2.2 Precision 4-week deployments (∼ 5 %).
When judged based on the blank-corrected amounts in
The very large number of triplicate deployments in this study replicate samplers, precision was 4 %, 15 %, and 14 % for
allows for a thorough characterization of the precision of the MerPAS® , IVL-PAS, and CNR-PAS, respectively. This pre-
different PASs. Specifically, we assess the replicate preci- cision is inevitably worse than for the non-blank corrected
sion of three PASs deployed simultaneously, both before and amount, because the variability of the field blank levels adds
after blank correction. Table S5 in the Supplement reports uncertainty. The extent of this increase in uncertainty upon
Atmos. Meas. Tech., 14, 3657–3672, 2021 https://doi.org/10.5194/amt-14-3657-2021A. Naccarato et al.: Comparing three passive air samplers for gaseous mercury 3665
3.2.3 Accuracy
The average air concentration during each of the 22 deploy-
ment periods was derived by dividing the blank corrected
amounts in a PAS by the product of the deployment pe-
riod and the SR. These concentration values are reported in
Table S8 in the Supplement. The SR and its estimated un-
certainty for each PAS was provided by each participating
laboratory. Specifically, the uncertainty of the MerPAS® SR
was assumed to be 15 %, whereas that of the CNR-PAS was
4.7 %. The SR uncertainty of the IVL-PAS was assumed to be
6 % and 13 % during the deployments in Rende and Toronto,
respectively. The uncertainty of the concentration values in
Table S8 in the Supplement was obtained by propagating the
estimated uncertainty of the SR and the standard uncertainty
of the blank-corrected amounts (in Table S6 in the Supple-
ment). The average value of the relative uncertainty of the
volumetric concentrations is very similar among the three
PASs: 9 % for MerPAS® and CNR-PAS and 8 % for the IVL.
However, these values cannot be directly compared with each
other, as the self-reported uncertainty of the SRs was not es-
tablished the same way by the three study participants.
The accuracy of the PAS-derived time-averaged air con-
centrations in Table S8 in the Supplement was judged by
comparing them to the average value derived by the active
Tekran instruments operating alongside the PAS. The sam-
Figure 2. Precision expressed as the relative standard deviation in
pling rate of all three PASs used in this study had originally
percent of the amounts of mercury quantified in triplicate PASs,
both before (blue) and after blank correction (orange), averaged
been obtained in calibration studies involving active Tekran
over different deployment lengths, across different locations, and instruments, i.e., any uncertainties as to the precise specia-
over all replicated deployments. Note that in some cases a sampler tion of gaseous mercury being sampled by either a PAS or a
was lost and therefore some deployments were only duplicated. Tekran instrument would have affected calibration and evalu-
ation equally. A direct comparison therefore should be valid.
Tekran values were considered as a benchmark for pragmatic
blank correction depends very strongly on how large the reasons, knowing full well that this measurement itself may
blank contamination is relative to the amount in exposed provide biased results (Aspmo et al., 2005; Slemr et al., 2015;
samplers. This explains why the increase is much smaller for Temme et al., 2007). This is true even though flow and detec-
the MerPAS® than for the other two samplers and it also ex- tor accuracy audits of the active instruments were performed
plains why the increase is larger for shorter deployment pe- before, during, and after PAS deployments at both locations.
riods. As was already mentioned above, the blank correction The possible size of this bias was estimated from the data col-
for IVL-PAS and CNR-PAS deployed for 2 weeks is quite lected by the two Tekran systems operating side-by-side in
large, ranging from 28 % to 47 % of the amount quantified in Toronto, although the comparison was somewhat hampered
exposed samplers. Therefore, the uncertainty of the deducted by an inconsistency between measured flow at the beginning
amount adds notably to the uncertainty of the blank-corrected and end of the sampling period for the 2537a (unit 0075) (see
value. However, the CNR-PAS also illustrates how sampler Sect. 3.1). If we disregard that uncertainty, the 2537a (unit
precision can be greatly improved by consistent field blank 0075) instrument yielded values averaged over the deploy-
levels. The blank correction of the CNR-PASs deployed in ment periods that were consistently lower than those mea-
Rende adds far less uncertainty (from 7 % to 9 %) than sured by the 2537x (unit 5037) instrument that was chosen
the blank correction of the CNR-PASs deployed in Toronto as the reference. This bias was on average 3.2 % for the 11
(from 7 % to 19 %), which is a result of the much smaller sampling periods and ranged from a low of 1.0 % for the third
variability in the field blank levels measured in Rende (see 2-week period to a high of 6.5 % for the last 4-week period.
Fig. 1). Table 2 summarizes the average bias and the average abso-
lute difference between the average concentrations measured
by the Tekran instrument at each location and the various
PASs. This compilation reveals a number of features: the ac-
curacy of all three PASs is much better during the deploy-
https://doi.org/10.5194/amt-14-3657-2021 Atmos. Meas. Tech., 14, 3657–3672, 20213666 A. Naccarato et al.: Comparing three passive air samplers for gaseous mercury
Table 2. Average bias and average absolute discrepancy between the time-averaged volumetric air concentrations of Hg derived by the
passive air samplers and the Tekran instrument.
MerPAS® IVL-PAS CNR-PAS
Rende Bias (%) 2.8 −0.5 −1.4
(n = 11) Absolute discrepancy (%) 2.9 7.1 6.1
Toronto Bias (%) 10.2 17.0 −8.8
(n = 11) Absolute discrepancy (%) 10.2 17.8 24.9
ments in Rende than the deployments in Toronto. On aver-
age, the IVL-PAS and CNR-PAS results for Rende show no
bias, whereas the MerPAS® results are slightly biased high
(∼ 3 %). Also, the absolute discrepancies are quite small in
Rende, averaging ∼ 3 % for the MerPAS® and ∼ 7 % for
the other two samplers. In Toronto, the MerPAS® air con-
centrations are biased high, on average by 10 %. The IVL-
PAS also shows a positive bias (∼ 17 %), whereas the CNR-
PAS levels are on average 9 % lower than the Tekran results.
The average, absolute discrepancies range from 10 % for the
MerPAS® to 18 % for the IVL-PAS and 25 % for the CNR-
PAS.
Figure 3 displays the discrepancies of the PAS results from
the average concentrations measured by the Tekran analyz-
ers for each of the 22 sampling periods. This illustration re-
inforces the noticeable differences in sampler accuracy be-
tween deployments in Rende and Toronto. It additionally
shows that there is no apparent relationship between the ac-
curacy of the PASs and the length of the deployment period
in Rende. For the MerPAS® , there is also no relationship be-
tween discrepancies and deployment length in Toronto. The
high bias tends to be consistent, indicating that the SR was
likely higher than the applied value of 0.111 m3 d−1 . The dis-
crepancy of the IVL-PAS and CNR-PAS from the Tekran
results tend to be smaller during the longer deployments in Figure 3. Discrepancies of the time averaged air concentrations of
Toronto (6 weeks and up). In fact, for the IVL-PAS, the dis- Hg during 22 deployment periods as derived by the three PASs from
the average concentration obtained by an active Tekran system de-
crepancies tend to get smaller with increasing deployment
ployed at the same time. Deployments in Rende/Toronto are dis-
times. This makes sense considering that the uncertainty in- played in the upper/lower panel, respectively. Positive/negative dis-
troduced by the blank correction becomes much smaller with crepancies indicate a PAS-derived concentration higher/lower than
longer deployments. The three 4-week deployments of the the Tekran value, respectively.
CNR-PAS in Toronto are consistently biased very low (by
about 50 %), whereas the two sampling periods with very
high bias are both 2-week deployments, so it is difficult to PASs individually, and when the data are “pooled” among
decipher a consistent pattern in the discrepancies. all PASs, they are not significantly different from 0. On the
Our variance partitioning analysis, coupled with mixed ef- other hand, all of the mean concentration differences in the
fects models, confirmed that all PAS-derived concentrations Toronto site are significantly different from 0, again both
were significantly closer to the Tekran values for the de- for all PASs individually and when the data are “pooled”
ployments in Rende than they were for the deployments in among all PASs. When data from both sites and all PASs are
Toronto (Fig. 4). The asterisks in Fig. 4 designate the sig- “pooled” together, the mean concentration values differ sig-
nificance level by which the mean absolute concentration nificantly from 0, which is mainly driven by the poorer agree-
difference of a “dataset” differs significantly from 0, i.e., ment of values in Toronto. Note that we use here the terms
whether PAS-derived concentrations (based on Eq. 2) dif- “pooled” and “datasets”, even though the results in Fig. 4 are
fer significantly from Tekran concentrations. We can see that based on the single mixed effects model and are not the re-
the mean concentration differences in Rende, for all three sults of multiple t tests.
Atmos. Meas. Tech., 14, 3657–3672, 2021 https://doi.org/10.5194/amt-14-3657-2021A. Naccarato et al.: Comparing three passive air samplers for gaseous mercury 3667
concentrations significantly closer to Tekran values than did
the CNR sampler.
3.2.4 Linearity of uptake
A PAS’s performance depends on having an uptake capac-
ity that is sufficiently high for mercury to remain in a linear
uptake phase throughout the entire deployment period. We
can test this by assessing the linearity of uptake. While this
is sometimes done by plotting the blank-corrected amount
quantified in the samplers mPAS against the sampler deploy-
ment time 1t, this disregards the variability in the gaseous
mercury concentrations between different deployments. By
plotting the amount in a sampler against the product of
1t and the average air concentration during the deploy-
ment of that sampler Cair , we can eliminate the influence
of the gaseous mercury concentration variability (Restrepo
et al., 2015). We used the data from the Tekran instruments
Figure 4. Least square means and standard errors of the differences as the input for Cair in this analysis. Incidentally, using the
in concentrations measured by the PASs and by the Tekran units. data from this intercomparison study this way amounts to
Results are shown either for each PAS individually (colored mark- a sampler calibration, as the slope of the linear relationship
ers) or for the three PASs together (black markers). They are also between mPAS in ng and 1t × Cair in units of d ng m−3 cor-
shown either separately for the two sampling sites or both of them responds to the SR of the PAS in m3 d−1 .
together. The asterisks below each bar indicate whether or not the Figure 5 shows these uptake plots for all three samplers
least square mean concentration differences from that “dataset” dif- at the two sampling locations. Also shown are the linear re-
fered significantly from 0 (where ∗∗∗ denotes p ≤ 0.001, ∗∗ denotes
gression lines fitted to the displayed data. Table 3 reports the
p ≤ 0.01, and ∗ denotes p ≤ 0.05).
slopes with standard error of the regression line, which has
been forced through the origin, and the coefficient of corre-
lation r 2 . The slopes are also the SR applicable to the PASs
Of course, the same concentrations measured by different at the two locations during the time period of the study.
techniques should not be significantly different. It implies All uptake curves are linear with high r 2 values and small
that the uncertainty of the concentrations derived from all relative standard errors of the slope of the linear regressions
three PASs deployed in Toronto must have been underesti- (1 % for MerPAS® , 2 % to 3 % for IVL-PAS, and 2 % to 5 %
mated, i.e., the assumed uncertainty of the SR applied in the for CNR-PAS). A graphical inspection of Fig. 5 also con-
calculation of the concentrations must have been too small. firms that forcing the regression through the origin was jus-
We may surmise that if meteorological conditions during a tified, indicating that the blank correction was largely effec-
deployment deviate considerably from those prevailing dur- tive for all three samplers. Consistent with what should be
ing the calibration of a PAS (as they did for all three PASs expected from the sampler performance at the two locations,
during a Toronto winter), the SR incurs considerably higher the regressions are generally better for the Rende than for the
uncertainty than if calibration and application take place un- Toronto deployments. Overall, it is clear that all three sam-
der similar environmental conditions. plers perform as true linear uptake samplers at both locations
The variance decomposition analysis attributed roughly over a 3-month period.
half of the variance in percentage concentration differences Table 3 also compares the site- and deployment specific
to the PAS type (48.3 %) and most of the other half of total SRs obtained from the regressions with the generic a pri-
variance by differences observed between Toronto and Rende ori ones that were used in the calculation of the volumet-
(site = 46.8 %) (Table S9 in the Supplement). According to ric air concentrations from the PASs. Deviations between
the mixed effects model, there were significant differences these SRs should be roughly similar to the bias of the PAS-
for both site (Rende vs. Toronto; p < 0.001) and PAS type derived air concentrations reported in Table 2. In the case
(p = 0.006) (Table S10 in the Supplement). In the post hoc of the MerPAS® , they are indeed very similar (+2.8 % vs.
least squares comparison (Table S11 in the Supplement), dif- +3.1 % at Rende, +10.2 % vs. +12.3 % at Toronto). In the
ferences amongst PAS types were not significant at Rende case of the IVL-PAS (−0.5 % vs. −5.4 % at Rende, +17.0 %
(p = 0.458 to 0.992). At Toronto, the percentage difference vs. +3.0 % at Toronto) and CNR-PAS (−1.4 % vs. −5.7 % at
between Tekran and PAS concentrations was not significant Rende, −8.8 % vs. −10.7 % at Toronto) they are less similar,
between the IVL and MerPAS® samplers (p = 0.312), but although the direction of bias is the same. The deviations are
both the IVL (p = 0.013) and MerPAS® (p < 0.001) had not exactly the same, because the longer deployments have a
https://doi.org/10.5194/amt-14-3657-2021 Atmos. Meas. Tech., 14, 3657–3672, 20213668 A. Naccarato et al.: Comparing three passive air samplers for gaseous mercury
Table 3. Results of the linear regressions displayed in Fig. 5. The slope of the regression line corresponds to the sampling rate of a passive
air sampler.
Sampler Location SR Relative r2 A priori SR SR difference
(m3 d−1 ) SE (%) (m3 d−1 ) (%)
MerPAS® Rende 0.1144 ± 0.0006 0.5 0.9997 0.111 +3
Toronto 0.1247 ± 0.0014 1.1 0.9988 0.111 +12
IVL-PAS Rende 0.0284 ± 0.0006 2.2 0.9951 0.03 −5
Toronto 0.0309 ± 0.0009 3.0 0.9911 0.03 +3
CNR-PAS Rende 0.0139 ± 0.0003 2.2 0.9951 0.0147 −6
Toronto 0.0131 ± 0.0007 5.5 0.9710 0.0147 −11
in air with warmer temperatures can lead to a higher SR,
whereas an increase in wind speed can reduce the thickness
of the stagnant air boundary layer surrounding a PAS’s dif-
fusive barrier, therefore, also leading to a higher SR (McLa-
gan et al., 2017). Toronto was much colder than Rende dur-
ing the study period (average during the 12 weeks deploy-
ment period of 1 and 12 ◦ C, respectively), which would be
consistent with a lower SR in Toronto as was observed for
the CNR-PAS. On the other hand, wind speeds in Toronto
were approximately double those in Rende (average of 2.4
and 1.2 m s−1 , respectively), which would be consistent with
higher SR in Toronto as was observed by IVL-PAS and
MerPAS® .
3.2.5 Reasons for the different performance in Rende
and Toronto
Generally, the three PASs performed better in Rende than in
Toronto. This is most apparent in the assessment of accuracy
(Figs. 3 and 4). However, this did not apply to all perfor-
mance indicators. For example, the magnitude and variabil-
Figure 5. Plot of the blank-corrected amount of Hg quantified in ity in field blanks was comparable between the two sites for
three types a passive air sampler deployed in Rende or Toronto the MerPAS® and IVL-PAS, while the CNR-PAS had much
against the product of the deployment time of a sampler 1t and more variable field blank contamination in Toronto than in
the average air concentration during the deployment of that sam- Rende (Fig. 1). Also, replicate precision (prior to blank cor-
pler Cair , as determined independently by a Tekran active sampling rection) was very similar at the two sites (Fig. 2); in the case
system. of the IVL-PAS, the replicate precision was in fact better in
Toronto. This suggests that operator handling is unlikely to
be responsible for the differences in performance at the two
stronger impact on the slope of the lines in Fig. 5 than shorter sites.
ones, whereas when the average bias given in Table 2 was A major difference between the two sites is the harsh-
calculated, each sample counted the same, irrespective of de- ness of the weather conditions during the deployment period,
ployment length. which comprised the 3 months of February to April 2019.
We can also compare the relative size of the fitted SRs at Winter and early spring in Toronto can be very cold, can have
the two locations. Interestingly, for both the MerPAS® and large temperature fluctuations over short time periods, and
IVL-PAS, the SR was 9 % higher in Toronto than in Rende. can have precipitation in different forms (snow, freezing rain,
The SR of the CNR sampler shows an opposite behavior, sleet, and rain). As was discussed in the preceding section,
being 5 % lower in Toronto than in Rende. Meteorological temperature and wind speed can influence the rate of diffu-
factors can be responsible for differences in SR between de- sion to the passive sampling sorbent, causing variability in
ployments at different sites or during different time periods. the SRs. It is also conceivable that during inclement weather,
In particular, an increase in the molecular diffusivity of Hg hoarfrost forms on the surfaces of the diffusive barriers or
Atmos. Meas. Tech., 14, 3657–3672, 2021 https://doi.org/10.5194/amt-14-3657-2021You can also read