A reel-down instrument system for profile measurements of water vapor, temperature, clouds, and aerosol beneath constant-altitude scientific balloons
←
→
Page content transcription
If your browser does not render page correctly, please read the page content below
Atmos. Meas. Tech., 14, 2635–2648, 2021
https://doi.org/10.5194/amt-14-2635-2021
© Author(s) 2021. This work is distributed under
the Creative Commons Attribution 4.0 License.

A reel-down instrument system for profile measurements of water
vapor, temperature, clouds, and aerosol beneath
constant-altitude scientific balloons
Lars E. Kalnajs1 , Sean M. Davis2 , J. Douglas Goetz1 , Terry Deshler1 , Sergey Khaykin3 , Alex St. Clair1 ,
Albert Hertzog4 , Jerome Bordereau5 , and Alexey Lykov6
1 Laboratory for Atmospheric and Space Physics, University of Colorado at Boulder, Boulder, Colorado 80303, USA
2 NOAA    Chemical Sciences Laboratory, Boulder, Colorado 80305, USA
3 LATMOS/IPSL, UVSQ, Sorbonne Université, CNRS, Guyancourt, 78280, France
4 Laboratoire de météorologie dynamique, Sorbonne Université, Palaiseau, 91128, France
5 Laboratoire de météorologie dynamique, CNRS, Palaiseau, 91128, France
6 Central Aerological Observatory of Roshydromet, Dolgoprudny, 141700 Moscow Region, Russia

Correspondence: Lars E. Kalnajs (kalnajs@colorado.edu)

Received: 29 August 2020 – Discussion started: 27 October 2020
Revised: 9 February 2021 – Accepted: 23 February 2021 – Published: 6 April 2021

Abstract. The tropical tropopause layer (TTL; 14–18.5 km)        1   Introduction
is the gateway for most air entering the stratosphere, and
therefore processes within this layer have an outsized influ-    Super-pressure balloons are emerging as a practical platform
ence in determining global stratospheric ozone and water va-     for Earth science observations at altitudes from the upper tro-
por concentrations. Despite the importance of this layer there   posphere to the mid-stratosphere, carrying payloads ranging
are few in situ measurements with the necessary detail to re-    from a few up to thousands of kilograms with durations rang-
solve the fine-scale processes within this region. Here, we      ing from weeks to close to a year. The balloons, drifting on
introduce a novel platform for high-resolution in situ profil-   an isopycnic surface, provide measurements along a quasi-
ing that lowers and retracts a suspended instrument package      Lagrangian trajectory.
beneath drifting long-duration balloons in the tropics. Dur-        The Reeldown Aerosol Cloud Humidity and Tempera-
ing a 100 d circumtropical flight, the instrument collected      ture Sensor (RACHuTS) is an instrument system developed
over a hundred 2 km profiles of temperature, water vapor, and    to perform profile measurements of the atmosphere up to
aerosol at 1 m resolution, yielding unprecedented geographic     2 km below a super-pressure balloon (Fig. 1). The instru-
sampling and vertical resolution. The instrument system in-      ment system consists of three primary assemblies: a reel-
tegrates proven sensors for water vapor, temperature, pres-      ing system that is contained within the primary balloon gon-
sure, and cloud and aerosol particles with an innovative me-     dola, a smaller sub-gondola or profiler that is lowered from
chanical reeling and control system. A technical evaluation      the primary gondola, and a suite of sensors within the pro-
of the system performance demonstrated the feasibility of        filer that measure position, temperature, pressure, water va-
this new measurement platform for future missions with mi-       por, and aerosol and cloud particles. The RACHuTS instru-
nor modifications. Six instruments planned for two upcoming      ment was specifically designed for the Stratéole 2 field ex-
field campaigns are expected to provide over 4000 profiles       periment – a series of long-duration ballooning campaigns
through the TTL, quadrupling the number of high-resolution       to study the tropical tropopause layer (TTL) using a con-
aircraft and balloon profiles collected to date. These and fu-   stellation of super-pressure balloons circling the Earth at the
ture measurements will provide the necessary resolution to       Equator (Haase et al., 2018). The Stratéole 2 experiment is
diagnose the importance of competing mechanisms for the          comprised of three field missions: a recently completed en-
transport of water vapor across the TTL.                         gineering test campaign (November 2019–March 2020) with

Published by Copernicus Publications on behalf of the European Geosciences Union.
2636                                          L. E. Kalnajs et al.: Reel-down measurements below super-pressure balloons

eight balloons, the first science campaign in 2021 with 20         craft, with only a handful of aircraft experiments focusing on
balloons, and a second science campaign in 2024 in the oppo-       this region (Jensen et al., 2015; Krämer et al., 2020). The re-
site phase of the Quasi Biennial Oscillation (QBO), also with      gion is a thin, cold, and dry layer on top of the thick, warm,
20 balloons. A total of seven RACHuTS instruments will be          and wet tropical troposphere, making it difficult to observe
deployed during the experiment; one was deployed during            from satellites. Many of the processes within the TTL oc-
the engineering test campaign, and three will be deployed          cur at fine vertical scales, much smaller than is resolvable by
on each of the upcoming science campaigns. This work de-           spaceborne sensors (Randel and Jensen, 2013). Finally, many
scribes the RACHuTS instrument design and operation, the           of the countries in the equatorial belt are developing nations,
technical performance of the overall instrument system dur-        with few resources to allocate to making regular balloon-
ing the Stratéole 2 engineering test campaign, and the scien-      borne soundings of the TTL. As a result, there is only a single
tific performance of the sensors within the profiler.              tropical site performing routine water vapor soundings from
                                                                   Costa Rica (Selkirk et al., 2010), a few campaign measure-
1.1    Background                                                  ments over South America and the oceans (Fujiwara et al.,
                                                                   2010; Hasebe et al., 2013; Suzuki et al., 2013), and no mea-
The Stratéole 2 mission builds on the technical accomplish-        surements over equatorial Africa.
ments of three long-duration super-pressure balloon cam-              The Stratéole 2 experiment is designed to overcome many
paigns in the Antarctic and tropical lower stratosphere. The       of these limitations by making high-resolution in situ and
Vorcore experiment, in 2005, flew 27 super-pressure balloons       remote-sensing measurements of the TTL from a constella-
from McMurdo Station, Antarctica, at altitudes between 17.5        tion of super-pressure balloons circumnavigating the tropics.
and 19.5 km (Hertzog et al., 2007). The Concordiasi cam-           The Stratéole 2 balloon platform consists of 11 and 13 m di-
paign in 2010 flew 19 super-pressure balloons from Mc-             ameter super-pressure balloons each carrying two gondolas.
Murdo Station carrying more extensive instrument payloads          The upper gondola (the “Euros”), manufactured and operated
than used during Vorcore (Boullot et al., 2016; Hoffmann et        by the Centre National d’Etudes Spatiales (CNES), carries
al., 2017; Rabier et al., 2012). As part of the preparations for   the flight control and flight safety equipment. For safety rea-
the Concordiasi campaign, three engineering test flights were      sons the Euros is completely isolated from the lower gondola
conducted from the Seychelles during the pre-Concordiasi           (the “Zephyr”), designed and operated by the Laboratoire At-
campaign (Podglajen et al., 2014). Stratospheric winds near        mosphères, Milieux, Observations Spatiales (LATMOS), the
the Equator are primarily zonal, with the direction deter-         Laboratoire de Météorologie Dynamique (LMD), and Divi-
mined by the altitude and the phase of the QBO; thus bal-          sion Technique de l’INSU (DT-INSU), which hosts the sci-
loons released into the tropical lower stratosphere will tend      entific instruments. Each Zephyr can host two to three instru-
to circumnavigate the tropics (Baldwin et al., 2001). Pre-         ments, with a total instrument mass of 8 kg and a total aver-
Concordiasi validated the concept of flying super-pressure         age power consumption of 10 W. The Zephyr provides the in-
balloons in the tropics; each of the three balloons flew for       frastructure to host the instruments, including batteries, solar
longer than 3 months, with one making a circumnavigation           energy system, thermal regulation, and bi-directional com-
of the globe, while the other two balloons reversed course         munications, through an Iridium satellite link. The Stratéole
as the phase of the QBO reversed. These engineering flights        2 balloons fly at two density levels. The 11 m balloons fly at
served as the pathfinder for a dedicated equatorial balloon        a density level of 125 g m−3 , or approximately 18.5 km, and
experiment, Stratéole 2, with a focus on observing the TTL.        are targeted at in situ observations at the top edge of the TTL.
   The TTL is a region of particular scientific interest, but      The 13 m balloons fly at a density level of 100 g m−3 , or ap-
it also suffers from a scarcity of scientific observations. In     proximately 20.5 km, in the lower stratosphere and primarily
contrast to the abrupt transition from the troposphere to          host remote-sensing instruments. The balloons are expected
stratosphere that is typical of the midlatitude tropopause, the    to fly for 90–120 d and will circumnavigate the globe within
tropical tropopause layer is a 4 km thick transition region,       a flight domain of 20◦ S to 15◦ N.
having properties of both the troposphere and stratosphere            Given that Stratéole 2 balloons are designed to maintain
(Fueglistaler et al., 2009). The TTL forms a gateway to the        neutral buoyancy, in situ measurements are limited to a single
stratosphere, as most of the air that enters the global strato-    density level. RACHuTS is designed to overcome this restric-
sphere passes through the TTL; thus the TTL strongly im-           tion by probing the atmosphere down to 2 km below the flight
pacts the composition of the global stratosphere. The micro-       level of the balloon. Deployment of a reel-down sub-gondola
physics, thermodynamics, and dynamics of the TTL are com-          from a balloon in flight is complex both from a technical and
plex and inhomogeneous, driven by powerful tropical con-           regulatory stand point. There are few previous examples of
vection that impacts the TTL through detrainment, mixing,          this technology in the literature, and prior work is limited
and wave disturbances. While of great scientific importance,       to systems that were not deployed on an operational basis.
processes in the TTL are difficult to observe, leading to a        Hazen and Anderson (1985) describe a large winch system
scarcity of detailed measurements. The altitude of the TTL,        that was deployed on a zero-pressure balloon on at least two
14–18.5 km, is above the flight ceiling for most research air-     occasions, deploying a 62 kg payload 12 km below a drift-

Atmos. Meas. Tech., 14, 2635–2648, 2021                                             https://doi.org/10.5194/amt-14-2635-2021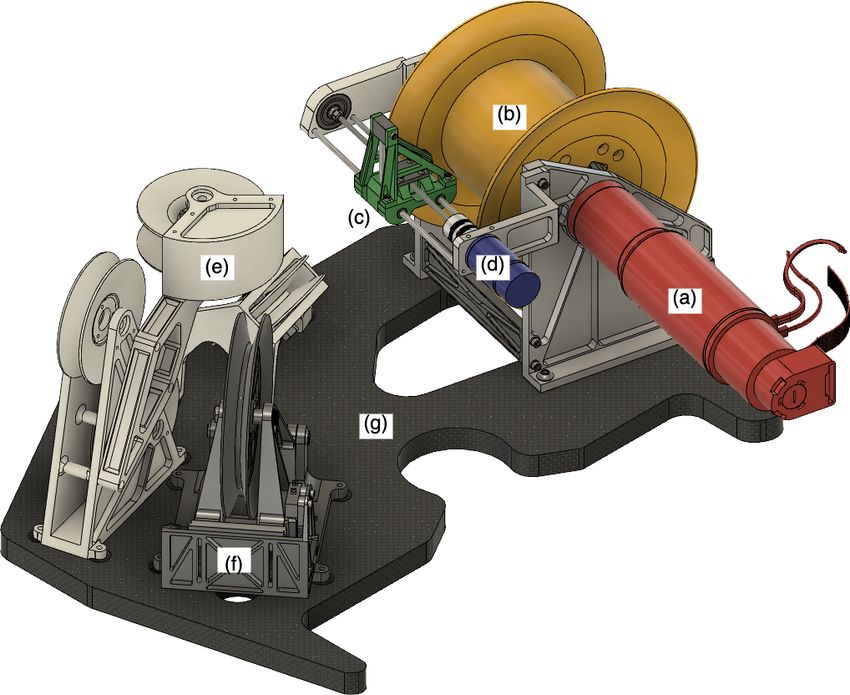
L. E. Kalnajs et al.: Reel-down measurements below super-pressure balloons                                                      2637

Figure 1. RACHuTS operational concept. The RACHuTS profiler is deployed from a super-pressure balloon at 18.5 km, down to an altitude
of 16.5 km, 3–5 times per night making measurements of water vapor, aerosol, cloud particles, temperature, and pressure.

ing zero-pressure balloon at an altitude of 39 km over Pales-        Rules of the Air govern the operation of “unmanned free bal-
tine, Texas. At about the same time, a smaller winch system          loons” in international airspace. There are negligible regu-
was developed in Japan to deploy a 22 kg payload 3 km be-            lations for the operation of an unmanned balloon above an
low a zero-pressure balloon in flight (Matsuzaka et al., 1985).      altitude of ∼ 18 km (FL 600), where the main Stratéole 2
Miniaturized instruments, advanced manufacturing and ma-             balloons fly. However, while the Zephyr will remain above
terials, and improvements in battery technology have made            18 km, the profiler will descend to 16 km, where it is subject
smaller, lighter, and less expensive reel-down systems a re-         to more stringent regulation. There is an exemption to many
ality for use on constellations of small balloons without the        of these regulations for lightweight balloon payloads such as
prospect of instrument recovery.                                     radiosondes. Thus, by meeting the standards for a lightweight
                                                                     instrument, the profiler is exempt from most restrictions be-
1.2   Design criteria                                                low 18 km. These standards applied to the profiler restrict the
                                                                     mass to less than 3 kg and the fiber, suspending the profiler,
The design of the RACHuTS instrument is a compromise                 to break at an impact force of 230 N.
between science requirements, logistical constraints of the             The deployment of the sub-gondola from the main gondola
Zephyr, regulatory requirements for international air space,         during flight has consequences for the operation and safety
and safety requirements from the balloon operator, CNES, to          of the overall balloon system that impose further require-
insure the survival and safe operation of the balloon system.        ments. The two primary concerns are (i) accidental loss of
The primary scientific requirements are high vertical resolu-        the profiler and (ii) drag or lift generated by the profiler from
tion, sufficient measurement sensitivity for the lower strato-       wind shear encountered during a profile. Loss of the profiler
sphere, and a vertical extent to cover as much of the TTL            has the potential to be catastrophic, forcing the balloon to
as possible, including spanning the cold-point tropopause.           lower ambient pressures and hence to a super-pressure envi-
The Zephyr has limited resources for allowable mass, power,          ronment exceeding the balloon design strength. A similar sit-
data, and thermal control. RACHuTS shares a Zephyr with              uation could occur if the deployed profiler encountered sig-
the Laboratory for Atmospheric and Space Physics (LASP)              nificant wind shear. Counterintuitively, wind shear on a ten-
particle counter (LPC), leaving RACHuTS a mass budget of             sioned line will cause lift (Alexander and Stevenson, 2001),
6 kg, daily average power of 5 W, and daily data downlink            reducing the load on the balloon leading to additional balloon
budget of 1.2 MB.                                                    overpressure. These concerns led to the following instrument
   The International Civil Aviation Organization (ICAO),             requirements. The profiler must withstand the highest loads
maintains the Convention on International Civil Aviation,            expected during flight, typically at launch or flight termina-
which includes internationally adopted Rules of the Air (An-         tion, estimated at 13 times gravity (g), without loss of the
nex 2) governing the operation of aircraft (ICAO, 2005). The         profiler, and the mechanical reeling system must be incapable

https://doi.org/10.5194/amt-14-2635-2021                                               Atmos. Meas. Tech., 14, 2635–2648, 2021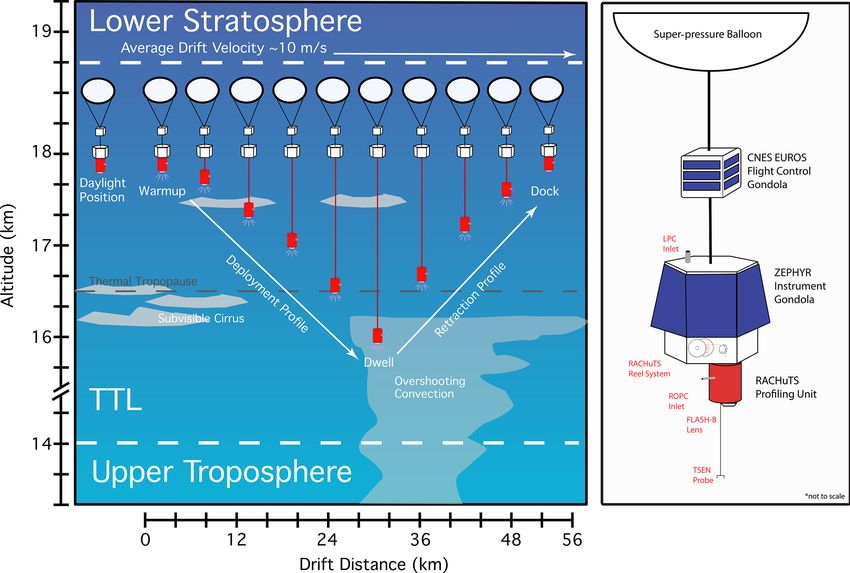
2638                                          L. E. Kalnajs et al.: Reel-down measurements below super-pressure balloons

of breaking the line. Finally, the deployment of the profiler
initially will be phased and occur in coordination with the
flight dynamics managers to allow for the impacts on balloon
overpressure to be assessed.

2     Instrument description

RACHuTS consists of three main subsystems: the reeling
system, the profiler gondola, and the profiler sensor suite,
consisting of a temperature and pressure sensor (TSEN,
Thermodynamical SENsor), water vapor sensor (FLASH-B,
Fluorescence Lyman-Alpha Stratospheric Hygrometer), and
cloud and aerosol sensor (ROPC, RACHuTS optical particle
counter).

2.1    Reeling system
                                                                   Figure 2. Rendering of the RACHuTS reel system. Major assem-
The reeling system is contained within the Zephyr, and con-        blies include the primary drivetrain (a, red), reel (b, yellow), level
sists of the mechanical assembly to unspool and spool the          wind carriage (c, green), level wind motor (d, blue), line redirection
profiler line, the electro-mechanical interface to the profiler,   pulley train (e, white), kinematic pulley (f, grey), and carbon fiber
and the electrical control and communications interface to         baseplate (g, black twill). The line, electronics box, and docking
the Zephyr (Fig. 2). The core of the reel system is a 6 cm di-     connector are not shown. The line is routed from the reel, through
                                                                   the level wind, around the redirection pulleys to align with the kine-
ameter by 12 cm long spool (Fig. 2b, yellow), which is 3-D
                                                                   matic pulley, exiting the gondola through the hole in the baseplate
printed using selectively laser-sintered (SLS) carbon fiber re-    (near f).
inforced nylon. The spool is designed to accommodate up to
3 km of line, but was loaded with 2.2 km for the Stratéole 2
engineering campaign. The spool is driven by the primary
drivetrain using a brushless DC servomotor and planetary           with a maximum yield strength of 204 N reached at −80 ◦ C.
gear box (Fig. 2 a, red) providing 2.4 N m of peak torque          This is below the ICAO mandated 230 N breaking strain but
at speeds up to 650 revolutions min −1. This translates to a       a factor of 10 above the nominal load from the profiler. To
maximum pulling force of 60 N with an empty spool, well            meet the flight safety requirement of withstanding a 13 g ac-
below the minimum breaking strain of the line and approxi-         celeration (a 260 N force on the line) the first 5 m of the
mately 3 times higher than the nominal gravitational load of       line were reinforced with a supplemental 1.2 mm diameter
22 N from the 2 kg profiler and line. An electromagnetic fric-     UHMWPE braid with a tensile strength in excess of 1 kN,
tion brake provides 4.8 N m of holding force to the reel. The      jacketing the primary line. The braided line enters the bot-
electromagnetic brake is failsafe; a current must be applied to    tom of the Zephyr through the profiler docking connector.
release the brake and in the event of a loss of power the brake    From there, the line passes over a large-diameter spring-
will engage, holding the profiler. A secondary drive (Fig. 2d,     loaded pulley (Fig. 2f, grey). This kinematic pulley serves
blue) is digitally slaved to the primary drive and powers a        two purposes: it provides a mechanism to dissipate shock,
level wind carriage (Fig. 2c, green), which oscillates back        as the UHMWPE has a high elastic modulus (low stretch),
and forth across the width of the reel, evenly distributing the    and it provides over- and underload detection. The pulley is
line on the reel.                                                  spring loaded in two directions; under a high-load situation
   The profiler is suspended by a 280 µm diameter ultra-           the pulley moves toward the exit orifice, actuating an over-
high molecular-weight polyethylene (UHMWPE, trade name             load microswitch. If the system becomes unloaded, risking
Spectra) braided line with a weight of 200 g km−1 . Multi-         tangling in the line, the pulley moves away from the exit ori-
ple sections of line were pull-tested to failure with a mean       fice tripping a second underload microswitch. The line and
breaking strain of 192 N at 25 ◦ C (SD 5.7 N). One prop-           motor systems were subject to extensive lifetime testing in
erty of particular importance to the measurement environ-          the laboratory. Using two RACHuTS reel systems on oppo-
ment is the glass transition temperature of UHMWPE and             site ends of 2 km of line, over 600 profiles were simulated
the temperature-dependent breaking strain, as the line will        by deploying the line from one reel, while reeling it onto the
be passing through the cold point at temperatures as low as        other reel and then reversing the process.
−90 ◦ C. The glass transition temperature −150 ◦ C is well be-        On the exterior of the bottom of the Zephyr is the pro-
low the lowest temperatures expected (Sobieraj and Rimnac,         filer docking connector. This unit provides both a mechanical
2009), and pull testing was repeated in a thermal chamber,         guide to steer the profiler into alignment with the Zephyr as

Atmos. Meas. Tech., 14, 2635–2648, 2021                                               https://doi.org/10.5194/amt-14-2635-2021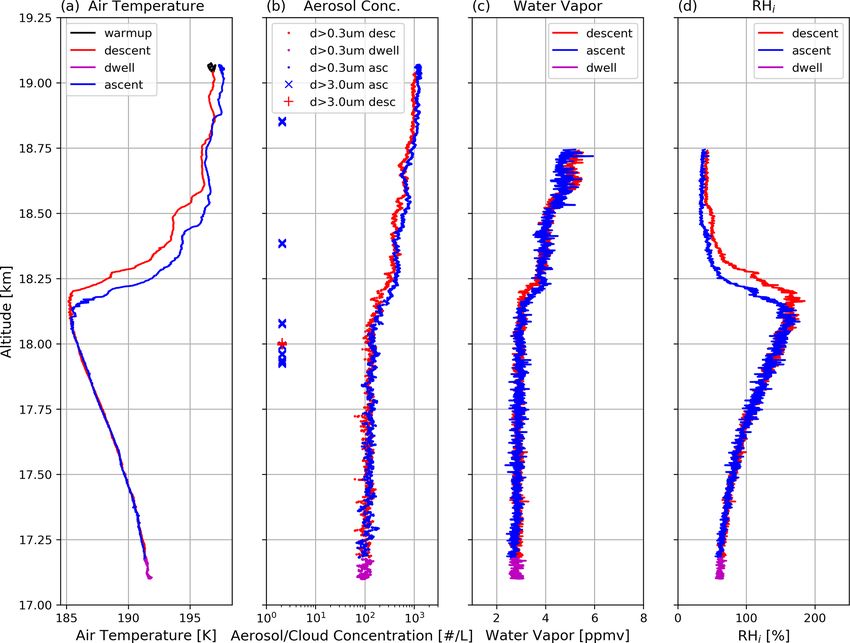
L. E. Kalnajs et al.: Reel-down measurements below super-pressure balloons                                                        2639

well as electrical connection to the profiler. Four gold rings
on the bottom of the Zephyr contact four concentric rings
of spring-loaded contact pins on the top of the profiler, pro-
viding power and communications with the profiler while
docked.
   The reel system is controlled by an ARM Cortex micro-
controller on the purpose-built motion control board (MCB).
The MCB enforces programmable limits on speeds, torques,
currents, and voltages to the motors while collecting perfor-
mance data for each profile. The interface between the MCB,
the profiler, and the Zephyr is provided by a second module,
the profiler interface board (PIB), also purpose-built around
an ARM Cortex microcontroller. The PIB initiates a profile
by sending commands to the docked profiler to begin making
measurements and then commanding the MCB to begin reel-
ing operations. At the completion of a profile the PIB offloads
the stored science data from the profiler, collects the reel per-
formance data from the MCB, and then sends the compressed
data on to the Zephyr for transmission to the ground station.

2.2     Profiler

The profiler, lowered from the Zephyr, obtains power and
communications from the Zephyr (through the PIB and dock-
ing connector) while docked. Figure 3 is a rendering of
the profiler comprised of FLASH-B (Fig. 3a, blue), TSEN
electronics (Fig. 3b, yellow), ROPC (Fig. 3c, black and
green), and rechargeable batteries (Fig. 3d, red) . The pro-
filer is housed in a 25 cm diameter by 28 cm tall expanded          Figure 3. Rendering of RACHuTS profiler. The FLASH-B water
polystyrene (EPS) cylindrical thermal housing with an over-         vapor sensor (a, blue), TSEN pressure sensor and electronics (b,
all weight of 1.8 kg. As the profiler is outside the Zephyr,        yellow), and ROPC aerosol and cloud particle detector (c, black and
thermal management is controlled internally.                        green) are visible. Other components include the lithium-ion battery
   Control and data storage for the profiler are provided by        pack (d, red) and the ROPC pump (e, silver). The TSEN temper-
an ARM Cortex microcontroller, which interfaces with each           ature sensor and main control board are not visible. The thermal
of the sensors via a serial connection and with the PIB when        housing and docking connector are omitted for clarity.
docked. The control board also includes a temperature mea-
surement system for temperature control and engineering
data, two temperature control loops, a GPS receiver, and a          below the profiler. Pressure is measured inside the pro-
flash memory card for data storage. Power for the profiler          filer using a board-mounted silicon pressure sensor, with
is provided by a lithium-ion battery pack, with sufficient          an integrated analog-to-digital converter. The temperature
capacity for five profiles and 24 h of thermal management.          of the pressure sensor is measured internally to provide a
The battery pack is charged from the Zephyr while docked.           temperature-compensated pressure measurement. The TSEN
Lithium batteries can be damaged through lithium plating            electronics are housed in the temperature-controlled environ-
when charged at temperature below 0 ◦ C (Petzl et al., 2015);       ment inside the profiler and report pressure and temperature
thus the battery pack is temperature controlled at 0 ◦ C, while     at 1 Hz both during the profiles and at flight level.
the rest of the profiler is controlled to −20 ◦ C.                     TSEN has a long flight heritage on super-pressure strato-
                                                                    spheric balloons and is well characterized in the lowermost
2.2.1    TSEN temperature and pressure sensor                       stratosphere. Prior generations of the TSEN instrument were
                                                                    deployed on multiple super-pressure balloons in a similar
Temperature and pressure measurements on the profiler are           configuration during the Vorcore campaign in Antarctica in
made using the Thermodynamical SENsor (TSEN) instru-                2005 (Hertzog et al., 2007), on the Concordiasi campaign
ment, developed and supplied by LMD in Paris, France                in Antarctica in 2010 (Ward et al., 2014; Hoffmann et al.,
(Hertzog et al., 2007). The instrument measures ambient             2017), and in the tropics during pre-Concordiasi also in 2010.
air temperature outside the profiler gondola with a small-          The version of TSEN used in the profiler is slightly evolved
diameter silver-coated thermistor suspended on a wire 5 m           from the Concordiasi instrument with an improved thermis-

https://doi.org/10.5194/amt-14-2635-2021                                               Atmos. Meas. Tech., 14, 2635–2648, 2021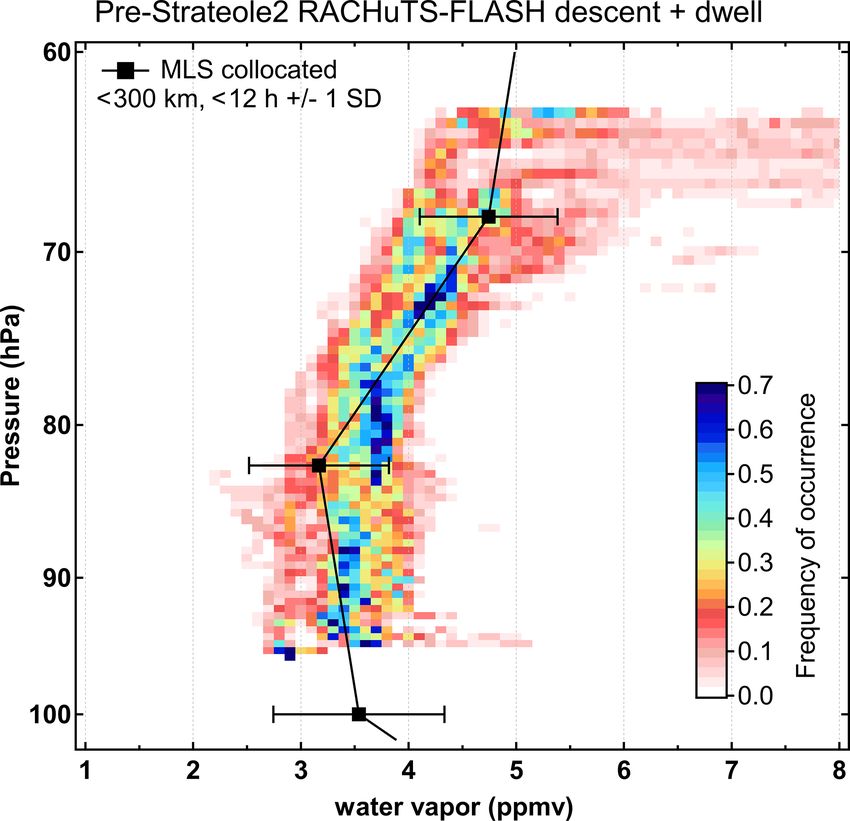
2640                                          L. E. Kalnajs et al.: Reel-down measurements below super-pressure balloons

tor with a reduced size to decrease solar bias. Furthermore,      al., 2016; Khaykin et al., 2013; Vömel et al., 2007), yield-
the TSEN in the profiler uses the much smaller and lighter        ing mean relative deviations of less than 2.4 % in the lower
MS5803 pressure sensor instead of the larger quartz crystal       stratosphere.
barometers used in the standard TSEN.                                Prior to delivery, the FLASH-B instrument is calibrated
   The TSEN temperature sensor accuracy and precision, de-        in a stratospheric simulation chamber at constant pressure
termined during prior flight campaigns, are 0.1 K at night        (50 hPa) and temperature (−40 ◦ C) over a wide range of mix-
and 0.25 K during the day when corrected for solar radiation      ing ratios (1–100 ppmv) against the reference dew point hy-
(Hertzog et al., 2004). For the RACHuTS profiles a precision      grometer MBW 373L. The detection limit for a 4 s integra-
of 0.1 K can be assumed as the profiles are collected at night,   tion time is of the order of 0.1 ppmv, while the accuracy is
and the sensor is ventilated by the vertical motion of the pro-   limited by the calibration error amounting to 4 %. The typi-
filer and any horizontal wind shear. The pressure sensor is       cal precision in the stratosphere is 5 %–6 %, whereas the to-
specified by the manufacturer to have an absolute accuracy        tal uncertainty is less than 10 % throughout the stratosphere.
of ±2 hPa and a precision of 0.01 hPa over the temperature        During profiles, the primary measurement data (i.e., the flu-
range inside the profiler. A higher absolute accuracy can be      orescence signal) is reported and stored at 1 Hz, whereas
obtained by performing cross-calibration with the TSEN in         housekeeping and diagnostic data are reported at 0.1 Hz.
the Euros gondola while the profiler is docked.
                                                                  2.2.3   RACHuTS optical particle counter
2.2.2   FLASH-B water vapor sensor
                                                                  The RACHuTS optical particle counter (ROPC) is a small
FLASH-B is a compact and lightweight version of the               eight-channel OPC optical head based on the MetOne 9722-1
FLASH (Fluorescence Lyman-Alpha Stratospheric Hygrom-             optical head. The ROPC is a closed-path instrument that uses
eter) instrument developed at the Central Aerological Ob-         a constant-volume rotary vane pump to draw 3.5 L min−1
servatory in Russia specifically for balloon-borne measure-       of air in through a 3 mm diameter inlet tube and through a
ments of water vapor in the upper troposphere and lower           laser beam. Particles in the airstream scatter light from the
stratosphere (Yushkov et al., 1998). The instrument senses        670 nm laser diode. The side-scattered light is collected over
water vapor by measuring the intensity of fluorescence from       a cone from 60–120◦ with an elliptical mirror which focuses
OH radicals that have been photodissociated from water            the scattered light pulses on a photodiode. The electrical sig-
molecules exposed to Lyman-alpha radiation (121.6 nm).            nal from the photodiode is digitized and the intensity of each
The Lyman-alpha is produced by an onboard hydrogen                pulse is divided and accumulated into eight bins by a pulse
lamp, whereas the fluorescence signal at 308–316 nm is mea-       height analyzer, representing eight size bins approximately
sured using a photomultiplier tube in photon-counting mode.       logarithmically spaced from 0.3–10 µm diameter. The rotary
The intensity of the fluorescence is directly proportional        vane pump is a constant-volume pump and thus pulse fre-
to the water vapor mixing ratio at stratospheric conditions       quency is easily converted to aerosol concentration. After
(Yushkov et al., 1998). FLASH-B uses a coaxial open-path          passing through the pump, the air passes through a 0.01 µm
optical layout, in which the measurement volume is located        filter to remove particles generated by the graphite vanes in
outside the instruments, 2–3 cm away from the lens of the         the pump, before being exhausted to the atmosphere. The
instrument. To reduce the background light and to avoid sat-      first size bin, 0.3 µm, is recorded at 1 Hz, while the larger
uration of the photomultiplier tube, FLASH-B can only be          channels have an 8 s integration time.
operated at night; thus RACHuTS profiles are only collected           The ROPC has a less extensive stratospheric heritage than
with a solar zenith angle (SZA) greater than 95◦ . FLASH-         the either TSEN or FLASH-B. A version of the MetOne
B is installed within the profiler housing with the lens fac-     9722 optical head is used in the LASP stratospheric total
ing downward. Since the lens assembly, exposed to ambient         aerosol counter (STAC – a balloon-borne condensation par-
temperature at one end, provides a thermally conductive path      ticle counter) and has been flown on sounding balloons nu-
for heat loss, FLASH-B is thermally isolated from the other       merous times over the past 3 years. Total aerosol concentra-
profiler components by an 8 mm thick aerogel blanket and          tion profiles from the STAC have agreed with similar profiles
provides its own thermal management, regulating to −20 ◦ C        from the University of Wyoming condensation nuclei (CN)
during operation.                                                 counter (Rosen and Hofmann, 1977; Campbell and Deshler,
   FLASH-B has a significant flight heritage on sounding          2014) within geophysical variations of CN profiles. An in-
balloons in the tropics (Khaykin et al., 2009) and in the Arc-    flight comparison was also made between the ROPC and the
tic (Khaykin et al., 2013), as well as in a previous long-        Wyoming laser particle counter (WLPC) (Ward et al., 2014)
duration balloon experiment (Lykov et al., 2014). The per-        in 2018 on a sounding balloon. Below 20 km the instruments
formance of FLASH-B has been extensively documented               agreed to within 20 %; however, the ROPC detection effi-
both in laboratory intercomparisons (Fahey et al., 2014) and      ciency decreased relative to the LPC above 20 km. Unlike the
through collocated balloon soundings with frost-point, tun-       STAC or WLPC, the ROPC does not use a filtered air sheath
able diode laser, and Lyman-alpha hygrometers (Ghysels et         flow to constrain the sample air jet, and it is possible that at

Atmos. Meas. Tech., 14, 2635–2648, 2021                                            https://doi.org/10.5194/amt-14-2635-2021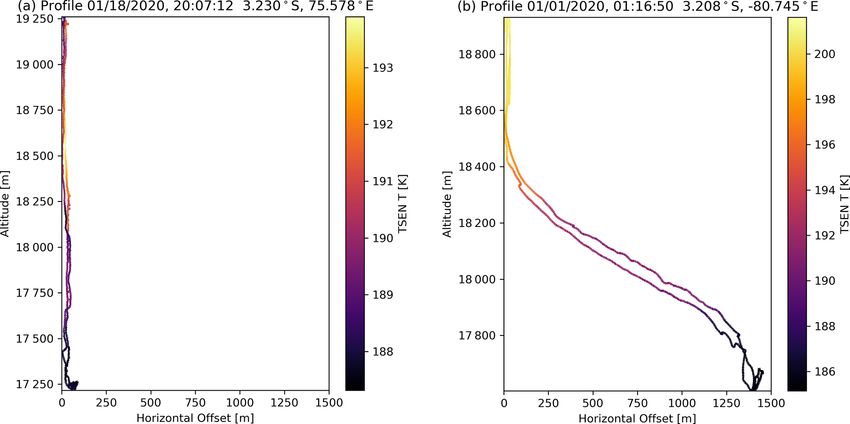
L. E. Kalnajs et al.: Reel-down measurements below super-pressure balloons                                                      2641

pressures below 50 hPa the air jet through the laser beam be-       Once granted, the profiler enters warmup mode, nominally
gins to diverge, lowering the counting efficiency. While this       15 min with all the instruments in the profiler running. Once
effect is unlikely to impact the RACHuTS measurements that          warmup is complete, the reel deploys 7500 revolutions, low-
are all below 20 km, the ROPC will require further valida-          ering the profiler 2 km below the Zephyr at a vertical speed
tion. Furthermore, the orientation of the ROPC inlet in rela-       of −1 m s−1 . At the completion of the reel-out, the instru-
tion to the relative wind speed during profiles is unknown;         ment enters a 15 min dwell period at the bottom of the pro-
thus the sampling efficiency of the inlet for larger particles is   file, and the reel performance data from the MCB are teleme-
not well characterized. The ROPC was primarily included in          tered to the ground. The profiler is then retracted 1.95 km at
the payload to detect super-micrometer cirrus cloud ice par-        1 m s−1 . The final 50 m approach to the gondola is performed
ticles, while the measurement of the number density of ice          at 0.1 m s−1 , until the torque feedback indicates the profiler is
particles needs further validation during flight; there is high     docked. At this point the profiler offloads the approximately
confidence in the ability to detect cloud particle (d>1 µm) at      200 kB of profiler data to the Zephyr, which sends them to
concentrations above 0.1 L−1 with limited quantitative con-         the ground along with the reel performance data from the
fidence.                                                            ascent. Once data offload is complete, power to the profiler
                                                                    is turned off and the battery is recharged for the next pro-
                                                                    file or for entering a daytime hibernate or charge mode if the
3   Stratéole 2 engineering flight                                  SZA < 115◦ .
                                                                       The mission specification for the RACHuTS flights is
The first field activity of the Stratéole 2 experiment took         three to four cycles per night, yielding six to eight profiles
place in October to December 2019 at the Seychelles In-             through the TTL as data are collected both on descent and as-
ternational Airport on the island of Mahé in the Seychelles         cent. Unfortunately, due to the intermittent communications
(4.67◦ S, 55.52◦ E). This campaign was an engineering test          through the docking connector and a compounding software
and proof of concept for the two primary science campaigns          error, all the cycles during the engineering flight were com-
scheduled to occur in 2021 and 2024. During the campaign,           manded manually using TCs from the ground. Fifty-five full
one of each balloon configuration was flown, with some ad-          cycles were completed over the course of the flight, yielding
ditional tests for a total of eight balloon flights. RACHuTS        110 profiles through the TTL and meeting the goals of the
was hosted on the “TTL3” configuration of the Zephyr, shar-         engineering campaign by demonstrating the instrument func-
ing the gondola with an LPC and using an 11 m diameter              tionality and assessing the performance of the measurements.
super-pressure balloon. The TTL3 flight was launched at             Had the profiler operated nominally in automatic collection
19:20 UT on 18 November and reached a stable float altitude         mode, there would have been 300–400 full cycles.
of 18.8 km the following day. The flight lasted 101 d and was
terminated on 28 February 2020 off the east coast of Ecuador        3.1   Reel system performance
(3.33◦ S, 81.42◦ W) after completing 1.5 circumnavigations
of the Earth (Fig. 4).                                              As an entirely new and complex system, validating the per-
   Due to calm winds at launch, necessitating the rapid             formance of the RACHuTS reeling system was one of the pri-
movement of the gondola, the release of the Zephyr was              mary goals of the engineering test flight. Motor performance
more dynamic than planned, leading to minor damage to the           data for all one hundred and ten 2 km motions were consis-
RACHuTS docking connector. The profiler oscillated below            tent with pre-flight engineering analysis and laboratory tests.
the gondola as the launch team had to both hold the gon-            During the ascent portion of each cycle, reel power consump-
dola high and pivot the balloon, ascending over the release         tion averaged 39 W with a motor current of 2.6 A at a nom-
point, towards them. As a result of this damage, and from           inal voltage of 15 V. During the descent phase of each cycle
possible ice build-up on the connector during ascent through        the reel motor acts as a retarder, counteracting the gravita-
dense clouds, multiple manual tele-commands (TCs) and re-           tional acceleration on the profiler and generating net counter-
docking procedures were required to re-establish commu-             electromotive force. This generated power was shunted to a
nications with the profiler unit. Communications were re-           large power resistor on the electronics box housing to be dis-
established on 21 November, and instrument commission-              sipated as heat and to limit the increase in motor voltage. A
ing began with phased manual profiles. No negative con-             possible concern identified before the flight was the ability to
sequences were observed for the dynamics of the balloon             dissipate this heat in the low-pressure stratospheric environ-
system, and the first full 2 km long science profile was per-       ment; however the reverse current flow in flight was lower
formed on 23 November.                                              than expected (∼ 0.1 A) and did not negatively impact ambi-
   The instrument operational plan specified switching to an        ent temperature within the gondola.
automatic profiling mode soon after commissioning. In auto-            The motor diagnostics, including motor current and tem-
matic mode, RACHuTS would autonomously begin profiling              perature, were used as indicators of reel system degradation
when the SZA surpassed 95◦ . To begin a profile, the profiler       over the course of the engineering flight. Deterioration of the
requests permission from the Zephyr to commence profiling.          motors, bearings, or pulley train would appear as an increase

https://doi.org/10.5194/amt-14-2635-2021                                              Atmos. Meas. Tech., 14, 2635–2648, 2021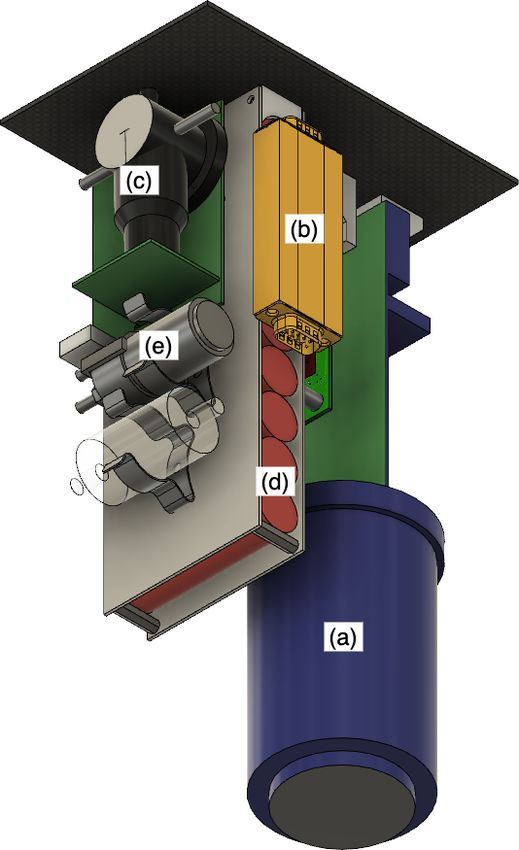
2642 L. E. Kalnajs et al.: Reel-down measurements below super-pressure balloons
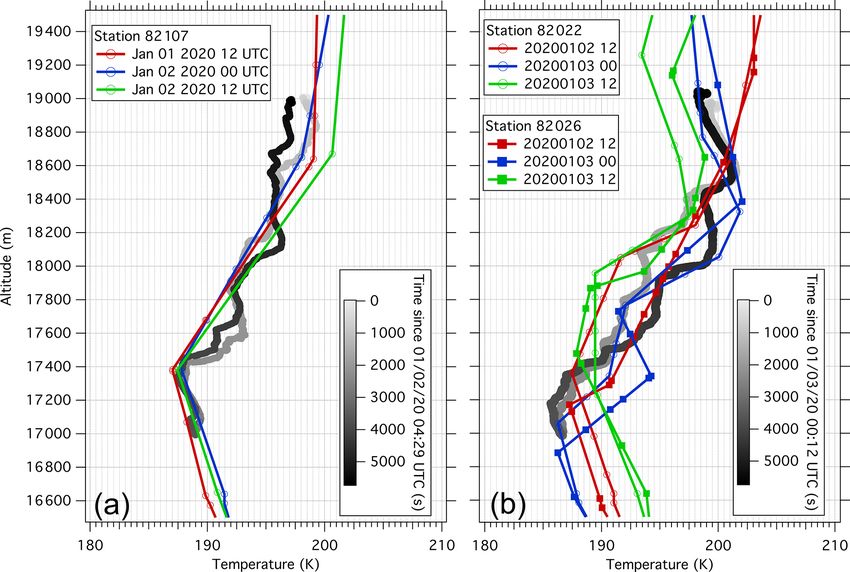
Figure 4. Flight trajectory of the TTL3 balloon during the Stratéole 2 engineering test. The trajectory represents 101 d of flight, each point
is the position of a 2 km RACHuTS profile. Locations of the profiles in Figs. 5, 6, and 8 are marked. Base map courtesy of NASA Visible
Earth.
in the torque, and therefore the current, in the main motor and The issues with the damage and intermittent communica-
level wind motors. These diagnostics showed no significant tion through the profiler docking connector and erratic sen-
change in reel system performance while in flight, and there sor readings are being addressed for future deployments. The
was no evidence that the reel system would degrade under connector has been redesigned to use more robust spring
the planned sampling regime of four profiles per night over pins, and an additional fixture has been added to the spring
90 d. pins to provide enhanced mechanical support. A long-range
Motor torque can also provide insight into lift generated by (LoRa) radio link will be added between the profiler and the
the profiler line under high wind shear conditions, where reel PIB to provide continuous communications with the profiler,
motor torque below nominal levels would correspond to pro- independent of the mechanical docking. In addition to redun-
files exhibiting decreased gravitational loads. During the en- dant docked communications, the LoRa link also provides
gineering flight, we did not observe decreased torque during continuous communications during a profile, decreasing the
any of the profiles, and while we do not have a direct mea- latency of downlinking profile data. The temperature sens-
surement of wind speed from the profiler, the horizontal off- ing system in the reel system and profiler have been revised
set of the profiler relative to the Zephyr provides a proxy for to use digital temperature sensors to reduce erroneous read-
the integrated wind shear over the length of the profile. Com- ings, and the firmware has been modified to prevent erro-
paring motor torques for profiles with horizontal displace- neous readings from triggering safety interlocks.
ments 1000 m indicates that the impact on the reel system is not 3.2 TSEN performance
statistically significant with a 1σ variability in motor torque
of 4.7 % (Fig. 5). It should also be noted that the CNES flight
The performance of the sensors in the profiling unit is as-
team did not observe significant changes in the TTL3 flight
sessed based on two criteria: the technical operation of the
level during an active RACHuTS profile, further demonstrat-
sensor and, where possible, a comparison of the scientific
ing that wind-shear-induced lift is not a concern for future
measurement with independent measurements. The profiler
Stratéole 2 missions.
TSEN operated nominally throughout the flight, both dur-
Two significant anomalies were observed: the previously
ing profiles and while docked. TSEN collected 3.1 million
mentioned damage to the docking connector and anomalous
measurements of pressure and temperature while docked and
sensor readings causing the reel to default to a safe mode.
300 000 measurements during profiles. No anomalies were
The damage to the docking connector led to intermittent fail-
identified in the instrument operation, and missing data from
ures in the docking procedure after profiles, which necessi-
the flight are due to communications issues with the profiler
tated manual intervention from the ground station to rectify
rather than to the TSEN instrument.
and often required several days for recovery. Intermittent, but
The measurement performance of TSEN is well charac-
persistent, erratic sensor readings in the reel control system
terized from prior long-duration flights. Two comparisons
caused the reel to enter a safe mode, again requiring inter-
have been identified for the RACHuTS TSEN: comparison
vention from the ground to rectify. The operational impact
with the TSEN located on the Euros gondola for flight level
of these two anomalies was the inability to use the automatic
data and comparisons with nearby radio soundings for profile
mode and a significant reduction (∼ 75 %) in the total num-
data. Both comparisons have limitations. The positioning of
ber of profiles collected relative to the operational plan.
the TSEN temperature sensor on the Euros gondola was dic-
tated by logistical constraints and was not optimal for tem-
Atmos. Meas. Tech., 14, 2635–2648, 2021 https://doi.org/10.5194/amt-14-2635-2021L. E. Kalnajs et al.: Reel-down measurements below super-pressure balloons 2643 Figure 5. Horizontal offset of the profiling unit relative to the Zephyr gondola as a function of GPS altitude, color-coded by ambient temperature. (a) A low wind shear example demonstrating 95◦ ) the relative bias drops to −0.46 K. The pressure detail than is available from the sounding, but the position of sensor used in the RACHuTS TSEN had a 3.84 hPa mean the cold-point tropopause (CPT) agrees within 50 m, as well positive bias relative to the high-accuracy Quartz barometer as a second inflection at 18.6 km. on the Euros TSEN after applying the manufacturer’s sup- plied calibration to the docked TSEN data. The RACHuTS 3.3 FLASH-B performance TSEN pressure sensor was operated outside the specified am- bient temperature and pressure range to obtain optimum ac- The technical performance of FLASH-B throughout the curacy, leading to a decrease in absolute accuracy. The offset flight was highly stable and within specification. The instru- of the RACHuTS TSEN pressure measurement is a strong ment was located outside the primary thermal housing and function of the temperature of the pressure sensor module. performed its own thermal control, with the lamp tempera- After applying an empirical linear correction to the pressure ture reaching the nominal operation range within the 15 min sensor as a function of the temperature of the sensing ele- pre-flight warmup period. The voltage and current supply to ment and accounting for the 7 m vertical separation between the hydrogen lamp were stable throughout the flight, indica- the sensors, the mean offset between the two pressure sen- tive of highly stable Lyman-alpha emission, which is criti- sors was reduced to 0.08 hPa with a 1σ variance of 0.55 hPa. cal to the measurement. As was expected, the initial mea- This correction was then applied to all the RACHuTS TSEN surements from FLASH-B showed anomalously high water pressure measurements. vapor in the vicinity of the balloon (within several hundred Comparisons between RACHuTS profiles and radioson- meters) (Fig. 7). This water vapor contamination is due to des were rare due to the scarcity of radiosonde sites within water vapor outgassing from the balloon and gondola sur- the tropics. Fortuitously, two RACHuTS profiles over Brazil faces and is unsurprising given the low-ventilation environ- were within 300 km of three operational radiosonde sound- ment (Ghysels et al., 2016; Zander, 1966). The TTL3 bal- ing sites (Fig. 6). The profile collected on 3 January 2020 loon was launched into heavy cloud cover and it is suspected (Fig. 6b) was within 300 km of two radiosonde soundings; that the balloon was coated in ice during ascent. A coincident however there was significant horizontal and temporal vari- launch of the NOAA frost-point hygrometer (FPH) measured ability in the TTL as is evident in the difference between the a total column water vapor of 52 mm and measured a deep, RACHuTS descent and ascent profiles, which were spaced saturated layer in the upper troposphere, which likely exacer- https://doi.org/10.5194/amt-14-2635-2021 Atmos. Meas. Tech., 14, 2635–2648, 2021
2644                                            L. E. Kalnajs et al.: Reel-down measurements below super-pressure balloons

Figure 6. Comparison between RACHuTS temperature profiles and radiosonde soundings as a function of geometric (GPS) altitude. (a)
RACHuTS profile collected at 04:50 on 1 January 2020 (1.08, −68.75) and the three closest in time radiosonde soundings from São Gabriel
da Cachoeira, Brazil (−0.12, −66.97, 239 km from profile). (b) RACHuTS profile collected at 00:12 on 3 January 2020 (2.10, −58.66) and
the three closest in time radiosonde soundings from Boa Vista, Brazil (2.83, −60.70, 240 km from profile) and Tirios, Brazil (2.22, −55.95,
302 km from profile).

bated the expected water vapor contamination. However, the
water vapor contamination was largely limited to measure-
ments early in the flight and to pressures below 67 hPa. Dur-
ing deployments, the profiler is ventilated by its own vertical
motion as well as by wind shear encountered below the bal-
loon. The measurements during the ascent of the profiler are
more affected by outgassing as the downward-looking optics
of FLASH-B sense the air coming down from the instrument
surfaces.
   The scientific performance of FLASH-B can be as-
sessed through comparison with collocated Microwave Limb
Sounder (MLS) measurements. Figure 7 shows a compari-
son of the relative frequency of FLASH-B water mixing ra-
tio measurements during the descent phase of the profile to
the mean water vapor mixing ratio derived from MLS pro-
files within 300 km and 24 h of the RACHuTS profiles. More
than 90 % of the FLASH-B measurements lie within the 1σ
variability of the MLS profiles, in spite of the limited verti-
cal resolution of the MLS water vapor retrievals. Evidence of
water vapor contamination from the balloon and gondola is
present at pressures less than 67 hPa and potential tempera-            Figure 7. Comparison of the frequency of FLASH-B water vapor
tures greater than 425 K.                                               measurements from the 44 descent profiles with the average of the
                                                                        closest Microwave Limb Sounder water vapor measurements within
                                                                        12 h of each profile. The positive bias of FLASH-B at pressures
3.4    ROPC performance
                                                                        below 67 hPa is attributed to outgassing of water vapor from the
                                                                        balloon and gondola.
ROPC operated nominally throughout all the profiles, col-
lecting approximately 300 000 measurements during the
warmup, profile, and dwell periods. The only technical is-

Atmos. Meas. Tech., 14, 2635–2648, 2021                                                   https://doi.org/10.5194/amt-14-2635-2021
L. E. Kalnajs et al.: Reel-down measurements below super-pressure balloons 2645
Figure 8. RACHuTS profile measurement collected in the eastern Pacific. All plots are a function of GPS altitude (left to right). (a) TSEN
air temperature; note the clear cold point (185 K) at 18.2 km and wave-driven temperature structures near 18.4 and 18.9 km on ascent. (b)
ROPC aerosol or cloud concentration; note the presence of large particles (d>3.0 µm), likely cirrus cloud ice particles, near the cold point
(18.2 km) associated with negative temperature anomalies at 18.4 and 18.9 km. (c) FLASH-B water vapor mixing ratio; note the relatively
constant mixing ratio across the cold point (18.2 km). (d) Calculated relative humidity over ice; near the cold-point supersaturations exceed
150 % suggesting minimal dehydration through cloud formation.
sue related to ROPC was an occasional erroneous tempera- altitude and was 0.25 the concentration of the LPC 1.0 µm
ture reading from the thermistor on the rotary vane pump that channel. If the LPC size distributions are re-binned at sizes
required correction in post-processing. ∼ 20 % larger than the ROPC nominal channels, ROPC is
Independent in-flight validation of the ROPC is difficult 0.85 times LPC for the 0.3 µm channel and 1.05 times for the
to achieve as satellites cannot retrieve aerosol size distri- 1.0 µm channel, well within the ROPC uncertainty. This sug-
butions and balloon-borne aerosol soundings are not rou- gests that ROPC is slightly undersizing particles relative to
tinely performed in the tropics. However, the LPC instru- the LPC.
ment (flow rate ∼ 20 L m−1 ) was also hosted on the same
gondola as RACHuTS and measured particle size distribu-
tions from 0.3–24 µm in 32 channels every hour at the bal- 4 Example of the scientific measurements
loon flight level. LPC provides an in situ comparison for the
As mentioned above, in spite of the engineering difficul-
ROPC while it is docked at flight level in the warmup pre-
ties encountered the profiler completed 55 descent and as-
ceding each profile. Six measurement periods were identified
cent profiles beneath the Zephyr, which maintained an alti-
when both LPC and ROPC were operating nominally and
tude near 19 km throughout the flight. The location of these
made measurements within 15 min of each other. The size
profiles, which span the central Pacific to Indian oceans, are
distributions from LPC were re-binned to match the chan-
shown in Fig. 4. An example profile collected in the east-
nels from ROPC and the concentrations for each ROPC chan-
ern Pacific illustrates several features of scientific interest
nels were compared. The total ROPC concentration (all par-
and relevant to the scientific mission. Figure 8 displays the
ticles >0.3 µm) was on average 0.54 of the concentration of
temperature, aerosol or cloud, water vapor, and ice supersat-
particles >0.3 µm from LPC. The 1.0 µm channel was the
uration which were measured on this profile. The RACHuTS
largest ROPC channel to routinely detect particles at float
profiler descends to ∼ 800 m below the CPT; Fig. 8a. The
https://doi.org/10.5194/amt-14-2635-2021 Atmos. Meas. Tech., 14, 2635–2648, 20212646 L. E. Kalnajs et al.: Reel-down measurements below super-pressure balloons
descent and ascent each require 30 min and the dwell at the Author contributions. LEK led the instrument design, assembly,
bottom lasted 15 min. In that time the profiler moved 37 km and test and wrote the paper. AH and JB provided the TSEN sen-
to the northeast. The temperature of the upper troposphere is sor. AL and SK provided the FLASH-B sensor. JDG assisted in in-
very homogeneous throughout this area, and the temperature strument design and assembly and led the laboratory testing of the
offset above the tropopause is consistent with the isentropic instrument. SMD, LEK, and TD conceptualized the instrument and
analyzed instrument data. ASC developed the instrument firmware
gradient between the ascent and descent profiles. Above the
and assisted with assembly and the test. LEK, TD, JDG, SMD, SK,
CPT, two temperature perturbations are evident in the ascent ASC, AH, and JB participated in the field campaign. AH is scien-
profile at 18.4 and 18.9 km. Collocated with the cold phase of tific lead of the Stratéole 2 project.
these wave-driven temperature perturbations there is an en-
hancement of large (d>3 µm) particles (Fig. 8b), most likely
cirrus cloud ice particles, confirming the wave-driven cir- Competing interests. The authors declare that they have no conflict
rus cloud formation observations obtained during ATTREX of interest.
(Kim et al., 2016). Further cirrus cloud ice particles are ob-
served near the CPT on both descent and ascent, suggesting
the presence of a sub-visible cirrus cloud near the CPT with Acknowledgements. The authors gratefully acknowledge the sup-
significant horizontal extent. Surprisingly, water vapor mix- port of the Stratéole 2 science teams, the LATMOS/LMD gondola
ing ratios are essentially constant across the CPT (Fig. 8c); engineering team, the CNES balloon team, and the Seychelles Me-
instead significant supersaturations with respect to ice are ob- teorological Agency. This work was funded by the NSF under award
served (Fig. 8d). A detailed analysis of the scientific results 1643022, with kind support provided by CNES and CNRS. Special
from the campaign will be presented in forthcoming publica- thanks to Philippe Cocquerez and Stephanie Venel for making the
flight of this unorthodox instrument possible on a CNES balloon.
tions.
5 Summary Financial support. This research has been supported by the Na-
tional Science Foundation, Directorate for Geosciences (grant no.
The successful deployment of the RACHuTS instrument on 1643022).
Stratéole 2 engineering test campaign in 2019–2020 demon-
strates the value of profiling instruments for use on long-
duration balloons. In spite of the campaign being focused on Review statement. This paper was edited by Alyn Lambert and re-
engineering data and testing, the RACHuTS instrument pro- viewed by Masatomo Fujiwara and one anonymous referee.
duced an unprecedented number (110) of vertical profiles of
water vapor, temperature, and clouds or aerosol through the
TTL. These research quality measurements not only validate
References
the instrument concept but also directly address the science
questions that motivated the design of the instrument. Alexander, K. and Stevenson, J.: Kite equilibrium
The technical issues observed in the RACHuTS instrument and bridle length, Aeronaut. J., 105, 535–541,
during the campaign have been addressed with minor design https://doi.org/10.1017/S0001924000017991, 2001.
revisions that will be implemented prior to the first Stratéole Baldwin, M. P., Gray, L. J., Dunkerton, T. J., Hamilton, K., Haynes,
2 science campaign in 2021. Three more RACHuTS instru- P. H., Randel, W. J., Holton, J. R., Alexander, M. J., Hirota, I.,
ments are in production for launch in 2021, and a further Horinouchi, T., Jones, D. B. A., Kinnersley, J. S., Marquardt, C.,
three instruments are planned for the second science cam- Sato, K., and Takahashi, M.: The quasi-biennial oscillation, Rev.
paign in 2024. Geophys., 39, 179–229, https://doi.org/10.1029/1999RG000073,
2001.
Boullot, N., Rabier, F., Langland, R., Gelaro, R., Cardinali,
C., Guidard, V., Bauer, P., and Doerenbecher, A.: Observa-
Code availability. The instrument operating code was
tion impact over the southern polar area during the Concor-
developed by the authors and is publicly available at
diasi field campaign, Q. J. Roy. Meteor. Soc., 142, 597–610,
https://doi.org/10.5281/zenodo.4645916 (St. Clair, 2021).
https://doi.org/10.1002/qj.2470, 2016.
Campbell, P. and Deshler, T.: Condensation nuclei measurements in
the midlatitude (1982–2012) and Antarctic (1986–2010) strato-
Data availability. At the time of publication, the Stratéole 2 data sphere between 20 and 35 km, J. Geophys. Res.-Atmos., 119,
set is still under a 1-year embargo and not yet publicly available. 137–152, https://doi.org/10.1002/2013JD019710, 2013.
Future publications from this campaign will include a link to the Fahey, D. W., Gao, R.-S., Möhler, O., Saathoff, H., Schiller, C.,
data set. Ebert, V., Krämer, M., Peter, T., Amarouche, N., Avallone, L. M.,
Bauer, R., Bozóki, Z., Christensen, L. E., Davis, S. M., Durry, G.,
Dyroff, C., Herman, R. L., Hunsmann, S., Khaykin, S. M., Mack-
rodt, P., Meyer, J., Smith, J. B., Spelten, N., Troy, R. F., Vömel,
Atmos. Meas. Tech., 14, 2635–2648, 2021 https://doi.org/10.5194/amt-14-2635-2021L. E. Kalnajs et al.: Reel-down measurements below super-pressure balloons 2647 H., Wagner, S., and Wienhold, F. G.: The AquaVIT-1 intercom- Hlavka, D. L., Lait, L. R., Schoeberl, M. R., Bergman, J. W., parison of atmospheric water vapor measurement techniques, At- Selkirk, H. B., Alexander, M. J., Kim, J.-E., Lim, B. H., Stutz, J., mos. Meas. Tech., 7, 3177–3213, https://doi.org/10.5194/amt-7- and Pfeilsticker, K.: The NASA Airborne Tropical Tropopause 3177-2014, 2014. Experiment: High-Altitude Aircraft Measurements in the Trop- Fueglistaler, S., Dessler, A. E., Dunkerton, T. J., Folkins, I., Fu, Q., ical Western Pacific, B. Am. Meteorol. Soc., 98, 129–143, and Mote, P. W.: Tropical tropopause layer, Rev. Geophys., 47, https://doi.org/10.1175/BAMS-D-14-00263.1, 2015. RG1004, https://doi.org/10.1029/2008RG000267, 2009. Khaykin, S., Pommereau, J.-P., Korshunov, L., Yushkov, V., Fujiwara, M., Vömel, H., Hasebe, F., Shiotani, M., Ogino, S.- Nielsen, J., Larsen, N., Christensen, T., Garnier, A., Lukyanov, Y., Iwasaki, S., Nishi, N., Shibata, T., Shimizu, K., Nishi- A., and Williams, E.: Hydration of the lower stratosphere by moto, E., Valverde-Canossa, J. M., Selkirk, H. B., and Olt- ice crystal geysers over land convective systems, Atmos. Chem. mans, S. J.: Seasonal to decadal variations of water vapor in the Phys., 9, 2275–2287, https://doi.org/10.5194/acp-9-2275-2009, tropical lower stratosphere observed with balloon-borne cryo- 2009. genic frostpoint hygrometers, J. Geophys. Res., 115, D18304, Khaykin, S. M., Engel, I., Vömel, H., Formanyuk, I. M., Kivi, R., https://doi.org/10.1029/2010JD014179, 2010. Korshunov, L. I., Krämer, M., Lykov, A. D., Meier, S., Nae- Ghysels, M., Riviere, E. D., Khaykin, S., Stoeffler, C., Amarouche, bert, T., Pitts, M. C., Santee, M. L., Spelten, N., Wienhold, N., Pommereau, J.-P., Held, G., and Durry, G.: Intercomparison F. G., Yushkov, V. A., and Peter, T.: Arctic stratospheric de- of in situ water vapor balloon-borne measurements from Pico- hydration – Part 1: Unprecedented observation of vertical re- SDLA H2O and FLASH-B in the tropical UTLS, Atmos. Meas. distribution of water, Atmos. Chem. Phys., 13, 11503–11517, Tech., 9, 1207–1219, https://doi.org/10.5194/amt-9-1207-2016, https://doi.org/10.5194/acp-13-11503-2013, 2013. 2016. Kim, J.-E., Alexander, M. J., Bui, T. P., Dean-Day, J. M., Haase, J., Alexander, M., Hertzog, A., Kalnajs, L., Deshler, Lawson, R. P., Woods, S., Hlavka, D., Pfister, L., and T., Davis, S., Plougonven, R., Cocquerez, P., and Venel, S.: Jensen, E. J.: Ubiquitous influence of waves on tropical Around the world in 84 days, EOS T. Am. Geophys. Un., 99, high cirrus clouds, Geophys. Res. Lett., 43, 5895–5901, https://doi.org/10.1029/2018EO091907, 2018. https://doi.org/10.1002/2016GL069293, 2016. Hasebe, F., Inai, Y., Shiotani, M., Fujiwara, M., Vömel, H., Krämer, M., Rolf, C., Spelten, N., Afchine, A., Fahey, D., Jensen, Nishi, N., Ogino, S.-Y., Shibata, T., Iwasaki, S., Komala, N., E., Khaykin, S., Kuhn, T., Lawson, P., Lykov, A., Pan, L. L., Peter, T., and Oltmans, S. J.: Cold trap dehydration in the Riese, M., Rollins, A., Stroh, F., Thornberry, T., Wolf, V., Woods, Tropical Tropopause Layer characterised by SOWER chilled- S., Spichtinger, P., Quaas, J., and Sourdeval, O.: A microphysics mirror hygrometer network data in the Tropical Pacific, At- guide to cirrus – Part 2: Climatologies of clouds and humid- mos. Chem. Phys., 13, 4393–4411, https://doi.org/10.5194/acp- ity from observations, Atmos. Chem. Phys., 20, 12569–12608, 13-4393-2013, 2013. https://doi.org/10.5194/acp-20-12569-2020, 2020. Hazen, N. L. and Anderson, J. G.: A new reeling technique for very Lykov, A., Khaykin, S., Yushkov, V., Efremov, D., Formanyuk, I., long extension scanning in the stratosphere, Adv. Space Res., 5, and Astakhov, V.: Fluorescence Lyman-Alpha Stratospheric Hy- 45–48, https://doi.org/10.1016/0273-1177(85)90422-3, 1985. grometer (FLASH): application on meteorological balloons, long Hertzog, A., Basdevant, C., Vial, F. and Mechoso, C. R.: The accu- duration balloons and unmanned aerial vehicles, 40th COSPAR racy of stratospheric analyses in the northern hemisphere inferred Scientific Assembly, 2–10 August 2014 Moscow, Russia PSB.1- from long-duration balloon flights, Q. J. Roy. Meteor. Soc., 130, 23-14, 2014. 607–626, https://doi.org/10.1256/qj.03.76, 2004. Matsuzaka, Y., Yamagami, T., Yamanaka, M. D., and Nishimura, Hertzog, A., Cocquerez, P., Guilbon, R., Valdivia, J.-N., J.: Development of balloon-borne reel-down and -up winch sys- Venel, S., Basdevant, C., Boccara, G., Bordereau, J., Brioit, tem, Adv. Space Res., 5, 41–44, https://doi.org/10.1016/0273- B., Vial, F., Cardonne, A., Ravissot, A. and Schmitt, 1177(85)90421-1, 1985. É.: Stratéole/Vorcore—Long-duration, Superpressure Balloons Petzl, M., Kasper, M., and Danzer, M. A.: Lithium plat- to Study the Antarctic Lower Stratosphere during the ing in a commercial lithium-ion battery – A low- 2005 Winter, J. Atmos. Ocean. Tech., 24, 2048–2061, temperature aging study, J. Power Sources, 275, 799–807, https://doi.org/10.1175/2007JTECHA948.1, 2007. https://doi.org/10.1016/j.jpowsour.2014.11.065, 2015. Hoffmann, L., Hertzog, A., Rößler, T., Stein, O., and Wu, X.: Podglajen, A., Hertzog, A., Plougonven, R., and Žagar, N.: As- Intercomparison of meteorological analyses and trajectories in sessment of the accuracy of (re)analyses in the equatorial the Antarctic lower stratosphere with Concordiasi superpres- lower stratosphere, J. Geophys. Res.-Atmos., 119, 11166–11188, sure balloon observations, Atmos. Chem. Phys., 17, 8045–8061, https://doi.org/10.1002/2014JD021849, 2014. https://doi.org/10.5194/acp-17-8045-2017, 2017. Rabier, F., Cohn, S., Cocquerez, P., Hertzog, A., Avallone, L., Desh- International Civil Aviation Organisation (ICAO): Rules of the Air, ler, T., Haase, J., Hock, T., Doerenbecher, A., Wang, J., Guidard, 10th Edn., Annex 2 to the Convention on International Civil Avi- V., Thépaut, J.-N., Langland, R., Tangborn, A., Balsamo, G., ation, ICAO, Canada, 2005. Brun, E., Parsons, D., Bordereau, J., Cardinali, C., Danis, F., Jensen, E. J., Pfister, L., Jordan, D. E., Bui, T. V., Ueyama, R., Escarnot, J.-P., Fourrié, N., Gelaro, R., Genthon, C., Ide, K., Singh, H. B., Thornberry, T. D., Rollins, A. W., Gao, R.-S., Fa- Kalnajs, L., Martin, C., Meunier, L.-F., Nicot, J.-M., Perttula, T., hey, D. W., Rosenlof, K. H., Elkins, J. W., Diskin, G. S., Di- Potts, N., Ragazzo, P., Richardson, D., Sosa-Sesma, S., and Var- Gangi, J. P., Lawson, R. P., Woods, S., Atlas, E. L., Navarro gas, A.: The Concordiasi Field Experiment over Antarctica: First Rodriguez, M. A., Wofsy, S. C., Pittman, J., Bardeen, C. G., Results from Innovative Atmospheric Measurements, B. Am. Toon, O. B., Kindel, B. C., Newman, P. A., McGill, M. J., https://doi.org/10.5194/amt-14-2635-2021 Atmos. Meas. Tech., 14, 2635–2648, 2021
You can also read