Extinction of North American Cuvieronius (Mammalia: Proboscidea: Gomphotheriidae) driven by dietary resource competition with sympatric mammoths ...
←
→
Page content transcription
If your browser does not render page correctly, please read the page content below
Paleobiology, 46(1), 2020, pp. 41–57
        DOI: 10.1017/pab.2020.7

        Article

        Extinction of North American Cuvieronius (Mammalia: Proboscidea:
        Gomphotheriidae) driven by dietary resource competition with
        sympatric mammoths and mastodons

        Gregory James Smith                and Larisa R. G. DeSantis

        Abstract.—The gomphotheres were a diverse and widespread group of proboscideans occupying Eurasia,
        North America, and South America throughout the Neogene. Their decline was temporally and spatially
        heterogeneous, and the gomphotheres ultimately became extinct during the late Pleistocene; however, the
        genus Cuvieronius is rarely represented in late Pleistocene assemblages in North America. Two alternative
        hypotheses have been invoked to explain this phenomenon: (1) competitive exclusion by sympatric mam-
        moths and mastodons or (2) ecologic displacement due to an environmental transition from closed forests
        to open grasslands. To test whether competition for resources contributed to the demise of North Ameri-
        can Cuvieronius, we present herein a large collection of stable isotope and dental microwear data from
        populations occupying their Pleistocene refugium in the Atlantic Coastal Plain. Results suggest that
        Cuvieronius consumed a wide range of resources with variable textural and photosynthetic properties
        and was not specialized on either grasses or browse. Further, we document evidence for the consumption
        of similar foods between contemporaneous gomphotheres, mammoths, and mastodons. The generalist
        feeding strategy of the gomphotheres likely facilitated their high Miocene abundance and diversity. How-
        ever, this “jack of all trades and master of none” feeding strategy may have proved challenging following
        the arrival of mammoths and likely contributed to the extirpation of Cuvieronius in North America.

        Gregory James Smith. Department of Earth and Environmental Sciences, Vanderbilt University, Nashville,
          Tennessee 37240, U.S.A. E-mail: gxs258@gmail.com
        Larisa R. G. DeSantis. Department of Biological Sciences, Vanderbilt University, Nashville, Tennessee 37232,
           U.S.A.; and Department of Earth and Environmental Sciences, Vanderbilt University, Nashville, Tennessee
           37240, U.S.A. E-mail: larisa.desantis@vanderbilt.edu

        Accepted: 4 January 2020
        Data available from the Dryad Digital Repository: https://doi.org/10.5061/dryad.6djh9w0x1

                                  Introduction
                                                                                    (ca. 0.3–0.012 Ma sensu Bell et al. 2004) (Car-
           Gomphotheres (subfamily Gomphotheriinae                                  rasco et al. 2005). The success of the mammoth
        sensu lato) are temporally and spatially prolific;                           radiation and its temporal correlation with the
        the clade became dominant in North America                                  demise of the gomphotheres in North America
        in the Miocene and emigrated to South Amer-                                 has led some to argue that competition from
        ica from North America after the closure of                                 early mammoths caused the extirpation of the
        the Isthmus of Panama between 2.5 and 0.125                                 gomphotheres (i.e., competitive exclusion;
        Ma (Webb 1985; Reguero et al. 2007; Wood-                                   Kurtén and Anderson 1980). However, others
        burne 2010; Mothé et al. 2017). Their dietary                               have argued that cooling climates and the
        flexibility is hypothesized to have facilitated                              emergence of steppe/prairie habitats would
        their successful migration in contrast to mam-                              have displaced the gomphotheres from North
        moths and mastodons, which remained in Cen-                                 America even in the absence of competition
        tral and North America despite the continental                              (i.e., ecological displacement; Dudley 1996).
        connection (Pérez-Crespo et al. 2016). On the                               These two competing hypotheses have yet to
        other hand, gomphothere abundance, diver-                                   be fully tested or resolved.
        sity, and geographic range in North America                                    The competitive exclusion principle attests
        rapidly drops off after the arrival of mam-                                 that when closely related species with similar
        moths, and the gomphotheres are rarely repre-                               niches coexist, one of these taxa will either out-
        sented in Rancholabrean faunal assemblages                                  compete the other or they will partition their

        © 2020 The Paleontological Society. All rights reserved. This is an Open Access article, distributed under the terms of the
Downloaded  from https://www.cambridge.org/core.
         Creative  Commons Attribution licence     IP address: 46.4.80.155, on 01 Nov 2020 at 10:04:31, subject to the Cambridge
                                                          (http://creativecommons.org/licenses/by/4.0/),                  which Core terms of
                                                                                                                                 permits      use, available at
                                                                                                                                           unrestricted
https://www.cambridge.org/core/terms. https://doi.org/10.1017/pab.2020.7
        re-use, distribution, and reproduction in any medium, provided the original work is properly cited.                                0094-8373/20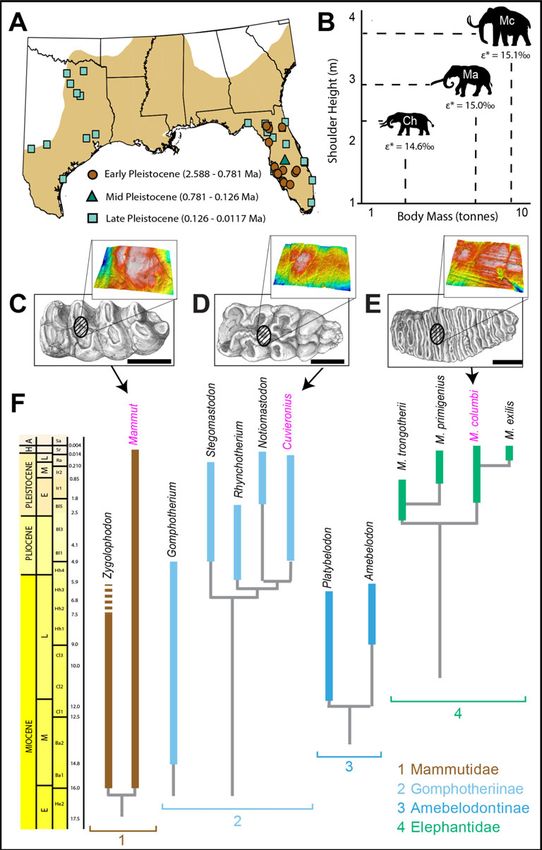
42                                   GREGORY JAMES SMITH AND LARISA R. G. DESANTIS

     niches to exploit different resources (Hardin                              (Hulbert 2001). Mastodons, represented by the
     1960). Niche partitioning studies in fossil ungu-                          genus Zygolophodon, and gomphotheres,
     lates are commonly carried out through a                                   including the genus Gomphotherium, have
     reconstruction of diet using methods similar                               been recovered from Miocene sites in both Flor-
     to those implemented here and often show                                   ida and Texas (Lambert and Shoshani 1998).
     the alteration of dietary preference by one or                             Later representatives of these clades, including
     multiple organisms to facilitate coexistence                               the mastodon Mammut and the gomphothere
     with other organisms (e.g., in bovids, camelids,                           Rhynchotherium, are found extensively in the
     and horses; MacFadden et al. 1999; Bibi 2007;                              southern latitudes of North America and Cen-
     DeSantis et al. 2009; Yann and DeSantis 2014).                             tral America beginning in the early Pliocene
     Similarly, studies of proboscidean dietary                                 (Lambert and Shoshani 1998; Lucas and Alvar-
     niche partitioning often indicate high dietary                             ado 2010; Pasenko 2012). Cuvieronius—the only
     flexibility among focal taxa (e.g., Calandra                                gomphothere genus found in North America,
     et al. 2008; Rivals et al. 2015; Pérez-Crespo                              South America, and Central America—appears
     et al. 2016). Most paleoecological studies on                              in Florida by ca. 2 Ma (Arroyo-Cabrales et al.
     gomphotheres suggest that they were already                                2007; Lucas 2008; Lucas and Alvarado 2010).
     highly flexible in their dietary choices, capable                           The mammoth specimens recovered from the
     of fluctuating between grazing, browsing, and                               ACP are coeval with some of the earliest Mam-
     mixed-feeding habits (e.g., MacFadden and                                  muthus records in North America from the Rio
     Cerling 1996; Koch et al. 1998, 2004; MacFad-                              Grande valley of southern New Mexico (Lucas
     den 2000; Fox and Fisher 2001, 2004; Sánchez                               et al. 2017). Cuvieronius is known in Florida
     et al. 2004; Calandra et al. 2008; DeSantis et al.                         until ca. 0.5 Ma (Lucas 2008); however, some
     2009; Rivals et al. 2015; Pérez-Crespo et al.                              of the youngest Cuvieronius records known in
     2016; Zhang et al. 2017; González-Guarda                                   North America come from the Big Cypress
     et al. 2018). However, on a smaller spatial and                            Creek site of east Texas (Lundelius et al. 2013,
     temporal scale, gomphotheres tended to restrict                            2019). Mammuthus and Mammut are last
     their dietary preferences due to abiotic (cli-                             known from North America in late Pleistocene
     matic) or biotic (competitive) factors; for                                sites between 14 and 10 ka (Bell et al. 2004; Bar-
     example, South American populations of Notio-                              nosky et al. 2014). Thus, the samples used in
     mastodon showed an adaptive trend toward                                   this study include some of the earliest and latest
     either grazing or browsing habits in the late                              examples of these proboscidean taxa in the
     Pleistocene due to habitat differentiation (Sán-                           ACP.
     chez et al. 2004; Mothé and Avilla 2015),                                     This study aims to fill an important spatial
     South China populations of Sinomastodon                                    and temporal gap in the paleoecological record
     were restricted to the consumption of browse                               of proboscideans. In this paper, we present a
     due to competition with co-occurring Stegodon                              quantitative analysis of dietary differences
     (Zhang et al. 2017), and the East Asian gom-                               among Pleistocene proboscideans in North
     photherid Protanancus was competitively dis-                               America using the integration of stable isotope
     placed by the amebelodont Platybelodon                                     geochemistry and dental microwear texture
     (Wang et al. 2015). Recognizing this pattern of                            analysis (DMTA). The design of this study
     dietary restriction in smaller populations, we                             allows for both a regional comparison over
     therefore limit our analysis herein to Pleisto-                            time (from the early to late Pleistocene) and
     cene populations of gomphothere (Cuvieronius                               local, site-based assessments. Specifically, mul-
     hyodon), mammoth (Mammuthus columbi), and                                  tiproxy data are used to test the following
     mastodon (Mammut americanum) occupying                                     hypotheses: (1) North American Cuvieronius
     the Atlantic Coastal Plain (ACP) physiogeo-                                consumed similar resources as sympatric Mam-
     graphic province of North America (Fig. 1A).                               muthus and/or Mammut; and (2) Cuvieronius,
        While both the mastodon and the gom-                                    Mammuthus, and Mammut altered their dietary
     phothere families were present in the ACP                                  habits in the ACP throughout the Pleistocene.
     since the middle Miocene, the earliest mam-                                Evidence for the consumption of similar
     moths did not arrive until the early Pleistocene                           resources by Cuvieronius and Mammuthus or

Downloaded from https://www.cambridge.org/core. IP address: 46.4.80.155, on 01 Nov 2020 at 10:04:31, subject to the Cambridge Core terms of use, available at
https://www.cambridge.org/core/terms. https://doi.org/10.1017/pab.2020.7
DIETARY RESOURCE COMPETITION IN PROBOSCIDEANS 43 Downloaded from https://www.cambridge.org/core. IP address: 46.4.80.155, on 01 Nov 2020 at 10:04:31, subject to the Cambridge Core terms of use, available at https://www.cambridge.org/core/terms. https://doi.org/10.1017/pab.2020.7
44                                   GREGORY JAMES SMITH AND LARISA R. G. DESANTIS

     Mammut, as inferred via stable isotopes and                                enamel hydroxyapatite were removed from
     dental microwear textures, may suggest that                                well-preserved proboscidean samples from
     competition was a primary driver of the extir-                             the Texas Memorial Museum (TMM) in Austin,
     pation of North American gomphotheres.                                     Texas, and the Florida Museum of Natural His-
                                                                                tory (FLMNH) in Gainesville, Florida. All
                                                                                sampled teeth were drilled by hand using a
                      Materials and Methods
                                                                                variable-speed rotary drill with carbide dental
         Fossil Populations.—Our study uses speci-                              burrs (1 mm burr width), which was used to
     mens recovered from numerous fossil mammal                                 create a 1 cm × 1 mm sample transect oriented
     sites in the ACP of the United States (Fig. 1A).                           parallel to the growth axis of the tooth. Because
     We first compiled all published bulk stable iso-                            sampling was not automated, the depth to
     tope data (MacFadden and Cerling 1996; Koch                                which each sample was drilled varied, but
     et al. 1998; Feranac and MacFadden 2000;                                   was typically ∼1–2 mm. Due to the nature of
     Hoppe 2004; Koch et al. 2004; DeSantis et al.                              enamel growth in proboscidean teeth, this
     2009; Yann and DeSantis 2014; Yann et al.                                  averages the dietary and environmental signal
     2016; Smith and DeSantis 2018; Lundelius                                   accrued in enamel tissue across multiple sea-
     et al. 2019) and DMTA data previously analyzed                             sons (Dirks et al. 2012; Metcalfe and Longstaffe
     on the confocal microscope located at Vanderbilt                           2012). While prior work has shown that stable
     University (Green et al. 2017; Smith and DeSan-                            isotope values differ significantly in mammoth,
     tis 2018) for proboscideans from this area (Sup-                           mastodon, and gomphothere teeth due to sea-
     plementary Table 1). Focusing on localities                                sonal changes in diet and environment (sum-
     from below 35°N limits the possible inclusion                              marized in Metcalfe 2017), the use of large
     of C3 grass, which increases in abundance in                               sample size for each time bin should overcome
     more northern and western regions with                                     these deviations and better capture the average
     decreased growing season temperatures (Teeri                               dietary tendencies in each organism.
     and Stowe 1976; Stowe and Teeri 1978; Still                                   The collected enamel powder was pretreated
     et al. 2003). All late Pleistocene samples in this                         with 30% H2O2 to remove organics, rinsed with
     study come from sites in east Texas and Florida.                           distilled water, treated with 0.1 N acetic acid for
     These regions likely had similar plant communi-                            18 hours to remove secondary carbonates (simi-
     ties due to physiogeographic similarities; com-                            lar to Koch et al. 1997), and rinsed with distilled
     parable precipitation amounts, mean annual                                 water again. Samples were left to air dry, and
     temperatures, and moisture sources; and low                                1 mg per sample was analyzed on a VG Prism
     abundances of C3 grasses and C4 shrubs, as                                 stable isotope ratio mass spectrometer with an
     reflected in 13C-enriched enamel in mammals                                 in-line ISOCARB automatic sampler in the
     from both regions. New targeted samples of pri-                            Department of Geological Sciences at the Uni-
     marily      undersampled        Cuvieronius   and                          versity of Florida. The standard deviation (1σ)
     co-occurring Mammuthus and/or Mammut                                       of the laboratory standard included with these
     from the same locality were added to published                             samples was
DIETARY RESOURCE COMPETITION IN PROBOSCIDEANS 45
Stable carbon isotopes recorded in mamma- Stable oxygen isotopes reflect environmental
lian enamel reflect the photosynthetic signature factors, including temperature and precipita-
of foods consumed (e.g., Cerling et al. 1997). tion, and are useful for identifying spatially
Carbon values from enamel (δ13Cenamel ) are or temporally mixed assemblages or for separ-
reported relative to VPDB (Coplen 1994). Con- ating glacial and interglacial periods. The oxy-
sumer δ13Cenamel values were converted to the gen isotopes reported here (δ18Oenamel ) are
carbon isotope value of vegetation consumed those recorded in enamel and reflect multiple
(δ13Cveg) using enrichment factors (ε*) of compounding factors impacting each individ-
15.1‰, 15.0‰, and 14.6‰ for Mammuthus ual proboscidean, including temperature,
columbi, Mammut americanum, and Cuvieronius humidity, altitude, and latitude (Dansgaard
hyodon, respectively. These enrichment factors 1964; also see Supplementary Appendix 1).
were obtained using the regression equation Oxygen isotope values are reported relative to
for hindgut fermenters from Tejada-Lara et al. VSMOW. Previously published δ18Oenamel
(2018): ln ε* = 2.42 + 0.032 * (BM), where BM is values reported relative to VPDB were
body mass in kilograms and is log- converted using the following equation:
transformed. Average body mass for each pro- δ18OVSMOW = 1.03086 * δ18OVPDB + 30.86 (Fried-
boscidean taxon was derived from volumetric man and O’Neil 1977).
method estimates reported by Larramendi Dental Microwear Texture Analysis.—Micro-
(2016); the body-mass values we used are wear molds were collected from the jaws and
9500 kg for M. columbi, 8000 kg for M. ameri- isolated teeth of proboscidean fossils held at
canum, and 3500 kg for C. hyodon (Fig. 1B). To TMM (n = 13) and FLMNH (n = 104). Sampling
correct for the effects of differing atmospheric methods for DMTA followed procedures out-
carbon isotope (δ13Catm) values over time on lined in prior studies (Green et al. 2017; Smith
δ13Cveg values, we used estimates of past and DeSantis 2018). Briefly summarized here,
δ13Catm values from benthic foraminifera (Tip- the wear facets of mammoth, mastodon, and
ple et al. 2010) to convert paleodietary vegeta- gomphothere molars were cleaned with acet-
tion to their modern equivalent values one and then sampled with Regular Body Pre-
(δ13Cvmeq) based on an A.D. 2000 δ13Catm of sident’s Jet to create a mold. We prioritized
−8‰ (following methods outlined in Kohn sampling the central enamel bands for all speci-
2010). Sample age came from site age estimates mens (Fig. 1C–E) to maintain consistency with
(see section on biochrons); we used the esti- past studies of DMTA in proboscideans (Green
mates of minimum and maximum site age et al. 2017; Zhang et al. 2017; Smith and DeSan-
(Supplementary Table 1) to calculate average tis 2018) and because sampling these areas
δ13Catm value over the age range of the sample. reduces the amount of variation in microwear
This value was inserted into eq. 3 from Kohn features attributable to differences in the direc-
(2010) and used to calculate Δ. We then calcu- tion of the power stroke during mastication
lated δ13Cvmeq using the following linear (e.g., Laub 1996; Todd et al. 2007; von Koenigs-
regression equation, obtained using the data wald 2016). The molds were then cast at Van-
set in the supplemental material from Kohn derbilt University using a high-resin epoxy
(2010): δ13Cvmeq = −0.9543 * Δ − 8.3617. The (Epotek 301) and dried in a fume hood for at
δ13Cvmeq values reported here reflect isotopic least 72 hours before analysis.
values of C3 shrubs/trees and C4 grasses, All specimens were scanned in three dimen-
respectively, and are thus indicative of brows- sions in four adjacent fields of view for a total
ing, grazing, and mixed-feeding habits. Here sampled area of 204 × 276 μm2 using the Plu
we assume that δ13Cvmeq values less than NEOX white-light microscope with confocal
−25.1‰ indicate diets of at least 85% C3 vegeta- capabilities at Vanderbilt University. Scans
tion while values greater than −16.0‰ indicate were analyzed using scale-sensitive fractal ana-
at least 85% C4 vegetation; values in between lysis software (ToothFrax and SFrax, Surfract
suggest a mix of both C3 and C4 resources (Cer- Corporation, www.surfract.com), which char-
ling et al. 1997; Kohn 2010; also see Supplemen- acterizes wear surfaces according to variables
tary Appendix 1). including complexity (Asfc), anisotropy
Downloaded from https://www.cambridge.org/core. IP address: 46.4.80.155, on 01 Nov 2020 at 10:04:31, subject to the Cambridge Core terms of use, available at
https://www.cambridge.org/core/terms. https://doi.org/10.1017/pab.2020.746 GREGORY JAMES SMITH AND LARISA R. G. DESANTIS
(epLsar), textural fill volume (Tfv), and hetero- gomphotheriids from Florida from Bl5 or
geneity of complexity (HAsfc). Complexity is a younger to be C. hyodon. We therefore include
quantification of the change in surface rough- the samples originally referred to Rhynchother-
ness with increasing scale and is used to distin- ium in MacFadden and Cerling (1996) and
guish taxa that consume hard/brittle foods refer them to C. hyodon. Site ages were used to
from those that eat softer/tougher foods bin samples to the following biochrons, with
(Ungar et al. 2003, 2007; Scott et al. 2005; Pri- ages from Bell et al. (2004): Bl5 (late Blancan),
deaux et al. 2009; Scott 2012; DeSantis 2016). minimum age = 1.6 Ma, maximum age = 2.5
Anisotropy is the degree to which surface fea- Ma; Ir1 (early Irvingtonian), minimum age =
tures share a similar orientation, such that a 0.85 Ma, maximum age = 1.6 Ma; Ir2 (late
predominance of parallel striations leads Irvingtonian), minimum age = 0.3 Ma, max-
toward highly anisotropic surfaces—typical in imum age = 0.85; Ra (Rancholabrean), min-
grazers and other consumers of tough food imum age = 0.010 Ma, maximum age = 0.3 Ma.
items (Ungar et al. 2003, 2007; Prideaux et al. Statistical Analyses.—All published and new
2009; Scott 2012; DeSantis 2016; Hedberg and data were combined for statistical comparisons.
DeSantis 2017). Textural fill volume is a meas- We carried out two statistical comparisons of
ure of the total volume of square cuboids of a δ13Cvmeq, δ18Oenamel, and DMTA attributes for
given scale that fill surface features and is use- each genus: first, within each biochron to test
ful for distinguishing deeper microwear fea- for consumption of similar foods in sympatric
tures (such as gouges from pits), which has populations; and second, across biochrons to
the potential to distinguish between consump- assess whether dietary niche was conserved
tion of foods with different fracture properties over time for each taxon. Our tests for the late
(e.g., leaves vs. fruit pits) (Scott et al. 2006; Pleistocene combined samples from Florida
Ungar et al. 2007, 2008). Heterogeneity of com- and east Texas based on the assumption that
plexity is calculated by splitting individual the paleoenvironment was broadly similar in
scanned areas into smaller sections with equal the two regions at that time; however, we also
numbers of rows and columns (from 2 × 2 up excluded samples from Texas and reran statis-
to 11 × 11) and comparing Asfc values between tical comparisons between δ13Cvmeq and
subregions (Scott et al. 2006). Low values in δ18Oenamel to ensure that this was a valid
heterogeneity have been shown to be indicative assumption. When comparing between nor-
of either high grit loads or grass consumption mally distributed attributes, parametric tests
(Scott 2012; Merceron et al. 2016). We report (e.g., t-test or analysis of variance) were
heterogeneity at two scales, 3 × 3 (HAsfc3×3) employed; otherwise, nonparametric equiva-
and 9 × 9 (HAsfc9×9), as has been the practice lent tests (e.g., Mann-Whitney U or Kruskal-
in previous studies (e.g., Green et al. 2017; Wallis) were used. For all tests, the Bonferroni
Smith and DeSantis 2018). correction factor was withheld, as it can result
Assignment to Biochronologic Intervals (“Bio- in an increase in type II errors (Cabin and
chrons”).—Each proboscidean individual Mitchell 2000; Nakagawa 2004). p-Values of
sampled for stable isotopes or DMTA wasDIETARY RESOURCE COMPETITION IN PROBOSCIDEANS 47
TABLE 1. Stable isotope summary statistics for all proboscidean samples analyzed. n, number of specimens; Min, minimum; Max, maximum; SD, 1 standard deviation (1σ); SE,
Table 2). Further, Mammut consistently has
p-value
stable carbon isotope signature of paleodiet; δ18Oenamel, stable oxygen isotope signature of enamel; Bl5, late Blancan (2.6–1.8 Ma); Ir1, early Irvingtonian (1.8–0.85 Ma), Ir2, late
standard error of the mean (σ/√n); p-value is that associated with a Shapiro-Wilk test (bold values indicate a nonnormal distribution); δ13Cvmeq, modern equivalent vegetation
0.058
0.873
0.343
0.929
0.302
0.670
0.640
0.600
0.428
lower δ13Cvmeq values than both Cuvieronius
and Mammuthus through time, while Mam-
muthus has significantly greater δ13Cvmeq
0.3
0.1
0.5
0.2
0.2
0.5
0.3
0.1
0.1
SE
values than Cuvieronius during the Rancholab-
SD (1σ) rean (note, δ13Cvmeq values are indistinguishable
1.1
0.6
1.3
0.9
0.5
1.0
1.3
1.0
1.3
when compared with the early Irvingtonian
δ18Oenamel VSMOW (‰)
values).
Range
Oxygen isotope values of Cuvieronius are sig-
5.1
2.4
3.2
3.3
1.2
2.7
5.0
3.8
7.4
nificantly greater during the early Irvingtonian
than both the late Blancan and Rancholabrean
Max
32.9
32.6
30.6
31.6
32.8
33.8
32.6
31.8
33.3
(Table 1). In contrast, Mammut has significantly
higher δ18Oenamel values during the late Irving-
Min
27.8
30.2
27.4
28.3
31.6
31.1
27.6
28.0
25.9
tonian than both the early Irvingtonian and
Rancholabrean. Mammuthus has the highest
Median
δ18Oenamel values during the late Irvingtonian
29.4
31.4
28.5
29.9
32.2
31.9
29.7
29.8
29.9
followed by the early Irvingtonian and Rancho-
labrean (all significantly different from one
Mean
29.6
31.5
28.6
30.0
32.2
32.2
30.0
29.9
29.7
another, Supplementary Table 2). Overall, all
proboscideans examined have indistinguish-
able δ18Oenamel values from one another during
p-value
0.389
0.231
0.081
0.853
0.530
0.157
0.004
0.03448 GREGORY JAMES SMITH AND LARISA R. G. DESANTIS
TABLE 2. Dental microwear texture analysis (DMTA) summary statistics for all proboscideans analyzed, broken down by
biochronologic interval. Asfc, area-scale fractal complexity; epLsar, anisotropy; Tfv, textural fill volume; HAsfc3×3, HAsfc9×9,
heterogeneity of complexity in a 3 × 3 and 9 × 9 grid, respectively. See Table 1 for definitions of other abbreviations. Bold
values indicate a nonnormal distribution (Shapiro-Wilk; p < 0.05 is significant).
Age Taxon n Statistic Asfc epLsar Tfv HAsfc3×3 HAsfc9×9
Bl5 Cuvieronius hyodon 23 Mean 2.648 0.0028 11,033.23 0.52 0.97
Median 1.799 0.0021 11,093.20 0.46 0.88
SD 1.976 0.0018 2592.72 0.24 0.41
Min 0.734 0.0009 3848.99 0.16 0.37
Max 8.932 0.0070 15,524.80 1.14 2.08
Range 8.198 0.0061 11,675.81 0.98 1.71
p (normal)DIETARY RESOURCE COMPETITION IN PROBOSCIDEANS 49
Table 2. Continued.
Age Taxon n Statistic Asfc epLsar Tfv HAsfc3×3 HAsfc9×9
Min 0.456 0.0005 739.31 0.16 0.33
Max 6.471 0.0092 32,491.46 1.66 2.10
Range 6.015 0.0087 31,752.15 1.50 1.77
p (normal) 0.001 0.10150 GREGORY JAMES SMITH AND LARISA R. G. DESANTIS
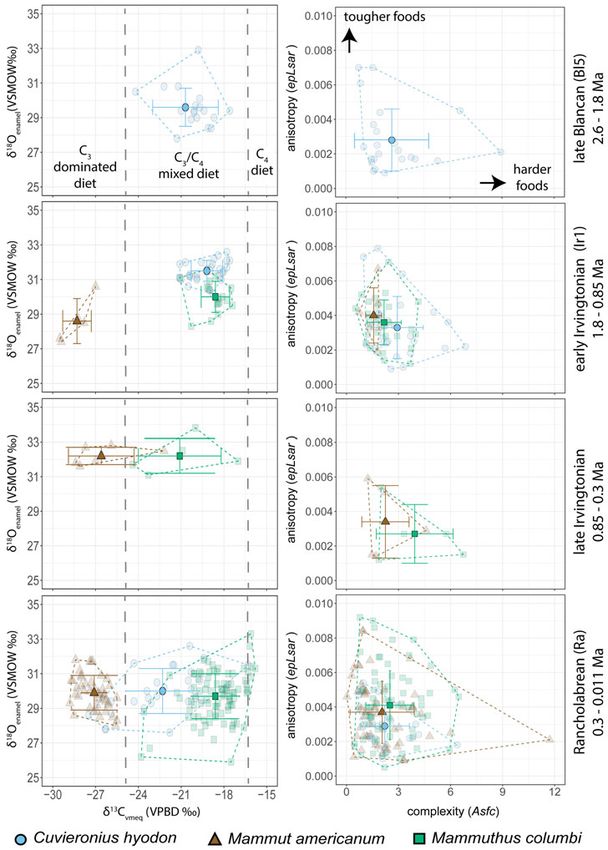
(C. hyodon) populations consumed foods of high degree of niche partitioning among the
similar geochemical and textural properties mammalian community, facilitated by the abun-
during the early Irvingtonian (1.6–1.0 Ma), dance of C4 grass and the diversity of C3 dietary
when mammoths first appear in North resources, may have contributed to the high
America. Specifically, mean δ13Cvmeq values mammalian diversity of the LSPLF (DeSantis
of −19.2‰ and −18.6‰ for Cuvieronius and et al. 2009). Our results corroborate this sugges-
Mammuthus, respectively, indicate a predomin- tion and specifically indicate that Cuvieronius
ately C4 grazing signature supplemented with and Mammuthus were able to coexist during
C3 resources (Table 1), while moderate Asfc the early Irvingtonian despite consuming
and epLsar values that both have a high range foods of similar geochemical and textural prop-
similarly suggest a highly generalized mixed- erties. This suggests that there must have been
feeding signature for both proboscideans an abundance of dietary resources in the ACP,
(Table 2). All of these proxy data (i.e., δ13Cvmeq, as both proboscideans were large monogastric-
Asfc, and epLsar) are statistically indistinguish- caecalid grazers with high dietary resource
able for gomphotheres and mammoths. We intake requirements (Guthrie 1984). As large
interpret these results to show that, upon arriv- mammalian herbivores are primarily food lim-
ing in the ACP, Mammuthus began to exploit ited (Sinclair 1975) (as opposed to predator lim-
similar resources as endemic Cuvieronius. ited [e.g., Sinclair et al. 2003; Fritz et al. 2011]),
All early Irvingtonian samples in our data set warm climates and long growing seasons likely
come from two assemblages from Florida—the produced a diverse floral habitat with consider-
Leisey Shell Pit Local Fauna (LSPLF) (Morgan able local heterogeneity needed to support such
and Hulbert 1995) and the Punta Gorda Local a high abundance of closely related and eco-
Fauna (PGLF) (Webb 1974). The LSPLF was logically similar taxa (a “vegetative mosaic”
deposited during an interglacial period ca. [Guthrie 1984]).
1.6–1.0 Ma, as supported by magnetic polarity The second line of evidence in support of the
dates; strontium isotope values on marine competitive exclusion hypothesis is niche plas-
bivalves; stratigraphic evidence of a high-stage ticity in Cuvieronius populations occupying the
sea-level stand; vertebrate chronology, includ- ACP. While stable isotope and dental micro-
ing the presence of warm-adapted vertebrates wear data do support the hypothesis of shifting
such as alligators; and 18O-enriched values in dietary habits over time, the magnitude and
mammalian herbivore enamel, consistent with direction of this shift varies by taxon. Mammut
a drier climate (Morgan and Hulbert 1995; exhibits the narrowest dietary niche of the three
DeSantis et al. 2009). Our data show no statistic- proboscideans, with the smallest range in
ally significant difference in δ18Oenamel values δ13Cvmeq values of all taxa in each NALMA
between LSPLF and PGLF Cuvieronius (mean (Table 1) and statistically unchanging DMTA
δ18Oenamel = 31.5‰ and 31.4‰, respectively; attribute values for all NALMAs (Table 2, Sup-
p = 0.867) or Mammuthus (mean δ18Oenamel = plementary Table 2). Further, Mammut
30.1‰ and 29.9‰, respectively; p = 0.534). δ13Cvmeq values are consistently significantly
This may indicate that a similar climatic setting lower than either Cuvieronius or Mammuthus
was experienced by both faunas, which would values, implying a persistent preference for C3
support the inference by Morgan and Hulbert dietary resources over time—interpreted here
(1995) that the two sites are of similar ages. as woody-browse. Because of the high abun-
DeSantis et al. (2009) reported significant differ- dance of Mammut remains recovered in the
ences in the δ13C signatures of browsers (Palaeo- ACP, our interpretation of these data is that
lama, Tapirus, Mammut, Odocoileus), mixed mastodons successfully dominated the “large
feeders (Mylohyus, Platygonus, Hemiauchenia), monogastric browser” niche up until the end-
and grazers (Equus, Mammuthus, Cuvieronius) Pleistocene, even during periods of resource
of the LSPLF, but noted no significant differ- limitation. Similarly, Mammuthus δ13Cvmeq,
ences when browsers were compared with one Asfc, and epLsar values do not change signifi-
another or when grazers were compared with cantly from the early Irvingtonian to the Ran-
one another. The authors suggested that the cholabrean, suggesting a similar dietary niche
Downloaded from https://www.cambridge.org/core. IP address: 46.4.80.155, on 01 Nov 2020 at 10:04:31, subject to the Cambridge Core terms of use, available at
https://www.cambridge.org/core/terms. https://doi.org/10.1017/pab.2020.7DIETARY RESOURCE COMPETITION IN PROBOSCIDEANS 51
of C4 grazing supplemented with C3 resources geographic ranges of mammals, as is currently
of varying textural properties; thus, mammoths occurring in modern biotas (Graham 2005; Post
are interpreted as having occupied the “large 2013). Further, there is evidence from an ∼60
monogastric grazer” niche. Because mam- kyr palynological record from south Florida
moths lacked a rumen (and could therefore that ACP pollen changes and the warming
not avoid absorbing toxic plant defenses effects of D-O events were out of sync with
including alkaloids and cyanogens into the the rest of North America (Grimm et al. 1993,
bloodstream [Guthrie 1984]), they likely 2006; Arnold et al. 2018). Heterogeneous cli-
would have required a diet consisting of grass matic and environmental changes in North
as a staple and supplemented by other plant America served to break down the Pleistocene
species with complementary nutrients and vegetative mosaics that had supported the
less toxic defenses. In contrast to mammoths coevolution of a high diversity of specialized
and mastodons, Cuvieronius populations show groups of organisms (Graham and Lundelius
a statistically significant decrease in δ13Cvmeq 1984; Graham and Grimm 1990). As seasonal
values from the early Irvingtonian to the Ran- mixed feeders, proboscideans depend on the
cholabrean while more than doubling the right composition of low-quality grass and
standard deviation of mean δ13Cvmeq values high-quality (but chemically defended) browse
(Table 1). During the Rancholabrean, Cuviero- emerging at the right time of year (e.g., Janzen
nius populations in the ACP consumed a diet and Martin 1982; Guthrie 1984; Owen-Smith
that was geochemically intermediate between 1988; Teale and Miller 2012; Metcalfe 2017); dis-
Mammut and Mammuthus diets and texturally ruption of this timing would have limited the
indistinguishable from either (Fig. 2). Rancho- abundance of these dietary resources at critical
labrean gomphothere δ13Cvmeq values are stat- times, potentially leading to increased intra-
istically equitable to their late Blancan and interspecific competition.
δ13Cvmeq values. Our interpretation of these The large body size of mammoths and mas-
data is that late Pleistocene gomphotheres in todons may have provided these taxa with a
the ACP were mixed-feeding C3/C4 generalists competitive advantage over sympatric gom-
(similar to gomphotheres in the early Pleisto- photheres. Cuvieronius hyodon was the smallest
cene, before the arrival of mammoths), cover- of the three proboscidean taxa in the ACP—on
ing a dietary spectrum that was overlapped average, between 57% and 68% less massive
by mammoths on the grazing end and masto- than M. columbi and 48% to 62% less massive
dons on the browsing end. than Mammut based on volumetric estimates
During the Pleistocene, rapid climate of body mass (Larramendi 2016). Mammut
changes may have disturbed vegetative and Mammuthus were also considerably higher
mosaics and led to floral community restruc- at the shoulder than Cuvieronius (Fig. 1B) (Lar-
turing, resulting in periodic resource scarcity ramendi 2016). As a result, gomphothere popu-
and affecting niche partitioning among large lations were more likely to suffer from both
mammalian herbivores. Pleistocene glacial– interference competition and exploitative com-
interglacial dynamics became especially pro- petition with mammoths and mastodons. Mod-
nounced beginning ca. 70–60 ka, with the ern African elephants (Loxodonta africana) are
onset of 2–3 kyr warm–cool oscillations known to aggressively attack and kill smaller
(Dansgaard-Oescher, or D-O, events) punctu- large herbivores such as rhinoceroses, particu-
ated by abrupt (∼1 kyr) cool phases character- larly when adult males enter musth (a periodic
ized by Heinrich events (i.e., the fracturing of condition characterized by a sharp rise in
ice shelves into the North Atlantic) (Heinrich aggressive behavior, temporin secretion, and
1988; Dansgaard et al. 1993; Bond and Lotti the continuous discharge of urine) (Poole
1995; Elliot et al. 1998; Alley et al. 2003). 1987; Berger and Cunningham 1998; Slotow
These climatic changes likely led to pheno- and van Dyk 2001). Mammoths and mastodons
logical shifts in plant communities (e.g., earlier likely engaged in similar violence; fossil evi-
flowering or emergence dates) and individual- dence of the kind of male-on-male violence typ-
istic shifts in the reproductive habits and ical of musth includes two bull mammoths that
Downloaded from https://www.cambridge.org/core. IP address: 46.4.80.155, on 01 Nov 2020 at 10:04:31, subject to the Cambridge Core terms of use, available at
https://www.cambridge.org/core/terms. https://doi.org/10.1017/pab.2020.752 GREGORY JAMES SMITH AND LARISA R. G. DESANTIS
FIGURE 2. Bivariate plots of stable isotope values and dental microwear attributes for proboscidean samples from the
Atlantic Coastal Plain. Circles (blue online), Cuvieronius hyodon; triangles (brown online), Mammut americanum; squares
(green online), Mammuthus columbi. Mean values for each population are shown with error bars for the standard deviation;
individual sample values are slightly transparent. Convex hulls overlay the range of values for each taxon.
died after their tusks became locked during et al. 2019]) consistent with tusk strikes from
combat (Agenbroad and Mead 1994) and path- another bull. Additionally, low rates of dentin
ologies on the mandible of the holotype of the apposition in the tusks of mammoths in the
Pacific mastodon (Mammut pacificus [Dooley Great Lakes and southern California suggest
Downloaded from https://www.cambridge.org/core. IP address: 46.4.80.155, on 01 Nov 2020 at 10:04:31, subject to the Cambridge Core terms of use, available at
https://www.cambridge.org/core/terms. https://doi.org/10.1017/pab.2020.7DIETARY RESOURCE COMPETITION IN PROBOSCIDEANS 53
that some males regularly fasted, as modern that competition between mammoths, masto-
elephants do during musth (Fisher 2004; El dons, and the gomphothere Cuvieronius was
Adli et al. 2015). Exploitative competition was prevalent in the ACP of North America
also likely; assuming dietary intake scales throughout the Pleistocene. Cuvieronius may
with body mass at a rate of BM0.75 (according have migrated into South America in the late
to the Jarman-Bell principle [Geist 1974]), Mam- Pleistocene tracking a preferred environmental
muthus and Mammut would have consumed habitat (Mothé et al. 2017), but populations in
significantly more food than Cuvieronius. the ACP of North America experienced heavy
Using regression equations based on modern competition with Mammuthus and Mammut
herbivores (Müller et al. 2013) and body-mass before disappearing entirely. Using multiple
estimates from Larramendi (2016), we estimate dietary proxies from sympatric megaherbivores,
that Mammuthus and Mammut consumed interspecific interactions including niche parti-
roughly twice as much dry matter per day as tioning and competition can be inferred and
Cuvieronius (49.9 ± 4.5 kg/day and 43.7 ± 4.9 here provide compelling evidence for gom-
kg/day for Mammuthus and Mammut, respect- photheres being competitively excluded in
ively, as compared with ∼23.3 kg/day in North America during the late Pleistocene
Cuvieronius). This may have created food scar- megafaunal extinctions.
city during resource-limited intervals if mam-
moth and mastodon abundances remained
high; for example, modern African elephants Acknowledgments
with large population densities have been Funding included a Geological Society of
shown to impact the foraging patterns of America student research grant, the Paleonto-
black rhinoceroses (Diceros bicornis), with rhi- logical Society Stephen Jay Gould Award, and
nos switching from a diet composed of mostly the Theodore Roosevelt Memorial Fund to
browse to one consisting of mostly grass during G.J.S., as well as National Science Foundation
seasons of resource scarcity, when elephants grant no. 1053839 and Vanderbilt University
have monopolized their food sources (Land- funds to L.R.G.D. We thank the collections man-
man et al. 2013). This reduced intake of preferred agers and curators of the Texas Memorial
foods and change in diet along the grass–browse Museum and the Florida Museum of Natural
continuum may have reduced gomphothere diet History for access to and assistance with the col-
quality, causing reduced body mass and/or lections, especially R. Hulbert, E. Lundelius, and
reduced fecundity (as has been shown to occur C. Sagebiel. B. Engh sketched the molars in Fig-
in modern ungulates [Simard et al. 2008; Chris- ure 1, and J. Curtis analyzed new stable isotope
tianson and Creel 2009]). samples at the University of Florida. Thanks to
D. Mothé, J. El Adli, and V. A. Pérez-Crespo
for providing helpful reviews that greatly
Conclusions
improved this article.
In conclusion, dietary proxy data from pro-
boscideans indicate that the early Pleistocene Literature Cited
coexistence of mammoths and gomphotheres
Agenbroad, L. D., and J. I. Mead. 1994. The Hot Springs Mammoth
was potentially made possible by both probos- Site: a decade of field and laboratory research in the paleontology,
cideans exhibiting a generalist mixed-feeding geology, and paleoecology. Mammoth Site of South Dakota, Inc.,
dietary habit permitted by abundant resources, Hot Springs, S.Dak.
Alley, R. B., J. Marotzke, W. D. Nordhaus, J. T. Overpeck,
but that dramatic climatic and ecologic changes D. M. Peteet, R. A. Pielke, R. T. Pierrehumbert, P. B. Rhines, T.
in the late Pleistocene may have limited F. Stocker, L. D. Talley, and J. M. Wallace. 2003. Abrupt climate
resource availability and led to increased inter- change. Science 299:2005–2010.
Arnold, T. E., A. F. Diefendorf, M. Brenner, K. H. Freeman, and
specific competition. Gomphotheres were part A. A. Baczynski. 2018. Climate response of the Florida peninsula
of a highly coevolved ecological food web to Heinrich events in the North Atlantic. Quaternary Science
that began to experience disruption due to dra- Reviews 194:1–11.
Arroyo-Cabrales, J., O. J. Polaco, C. Laurito, E. Johnson, M. T. Alberdi,
matic climatic and ecologic changes in the Pleis- and A. L. V. Zarmora. 2007. The proboscideans (Mammalian) of
tocene. The results of this study demonstrate Mesoamerica. Quaternary International 169–170:17–23.
Downloaded from https://www.cambridge.org/core. IP address: 46.4.80.155, on 01 Nov 2020 at 10:04:31, subject to the Cambridge Core terms of use, available at
https://www.cambridge.org/core/terms. https://doi.org/10.1017/pab.2020.754 GREGORY JAMES SMITH AND LARISA R. G. DESANTIS
Barnosky, A. D., M. Holmes, R. Kirchholtes, E. Lindsey, Mammuthus columbi from dental histology. Quaternary Inter-
K. C. Maguire, A. W. Poust, M. A. Stegner, J. Sunseri, B. Swartz, national 255:79–85.
J. Swift, N. A. Villavicencio, and G. O. U. Wogan. 2014. Prelude Dooley, A. C., E. Scott, J. L. Green, K. B. Springer, B. S. Dooley, and
to the Anthropocene: two new North American Land Mammal G. J. Smith. 2019. Mammut pacificus sp. nov., a newly recognized
Ages (NALMAs). Anthropocene Review 1:225–242. species of mastodon from the Pleistocene of western North America.
Bell, C. J., E. L. Lundelius, A. D. Barnosky, R. W. Graham, and PeerJ 7:e6614. https://doi.org/10.7717/peerj.6614.
E. H. Lindsay. 2004. The Blancan, Irvingtonian, and Rancholab- Dudley, J. P. 1996. Mammoths, gomphotheres, and the Great
rean mammal ages. Pp. 232–314 in M.O. Woodburne, ed. Late American Faunal Interchange. Pp. 289–295 in J. Shoshani and
Cretaceous and Cenozoic mammals of North America: biostratig- P. Tassy, eds. The Proboscidea: evolution and paleoecology of ele-
raphy and geochronology. Columbia University Press, phants and their relatives. Oxford University Press, New York.
New York. El Adli, J. J., M. D. Cherney, D. C. Fisher, J. M. Harris, A. B. Farrell,
Berger, J., and C. Cunningham. 1998. Behavioural ecology in and S. M. Cox. 2015. Last years of life and season of death of a
managed reserves: gender-based asymmetries in interspecific Columbian mammoth from Rancho La Brea. Natural History
dominance in African elephants and rhinos. Animal Conserva- Museum of Los Angeles County Science Series 42:65–80.
tion 1:33–38. Elliot, M., L. Labeyrie, G. Bond, E. Cortijo, J. L. Turon, N. Tisnerat,
Bibi, F. 2007. Dietary niche partitioning among fossil bovids in late and J. C. Duplessy. 1998. Millennial-scale iceberg discharges in
Miocene C3 habitats: consilience of functional morphology the Irminger Basin during the last glacial period: relationship
and stable isotope analysis. Palaeogeography, Palaeoclimatology, with the Heinrich events and environmental settings. Paleocea-
Palaeoecology 253:529–538. nography 13:433–446.
Bond, G. C., and R. Lotti. 1995. Iceberg discharges into the North Feranac, R. S., and B. J. MacFadden. 2000. Evolution of the grazing
Atlantic on millennial time scales during the last glaciation. Sci- niche in Pleistocene mammals from Florida: evidence from stable
ence 267:1005–1010. isotopes. Palaeogeography, Palaeoclimatology, Palaeoecology
Bond, W. J. 1993. Keystone species. Pp. 237–253 in E.D. Schulze and 162:155–169.
H.A. Mooney, eds. Biodiversity and ecosystem function. Fisher, D. C. 2004. Season of musth and musth-related mortality
Springer, Berlin. in Pleistocene mammoths. Journal of Vertebrate Paleontology
Cabin, R. J., and R. J. Mitchell. 2000. To Bonferroni or not to Bonfer- 24 (Suppl. to No. 003):58A.
roni: when and how are the questions. Bulletin of the Ecological Fisher, D. C. 2018. Paleobiology of Pleistocene Proboscideans.
Society of America 81:246–248. Annual Review of Earth and Planetary Sciences 46:229–260.
Calandra, I., U. B. Göhlich, and G. Merceron. 2008. How could Fox, D. L., and D. C. Fisher. 2001. Stable isotope ecology of a Late
sympatric megaherbivores coexist? Example of niche partitioning Miocene population of Gomphotherium productus (Mammalia,
within a proboscidean community from the Miocene of Europe. Proboscidea) from Port of Entry Pit, Oklahoma, USA. Palaios
Naturwissenschaften 95:831–838. 16:279–293.
Carrasco, M. A., B. P. Kraatz, E. B. Davis, and A. D. Barnosky. 2005. Fox, D. L., and D. C. Fisher. 2004. Dietary reconstruction of Mio-
Miocene Mammal Mapping Project (MIOMAP). University of cene Gomphotherium (Mammalia, Proboscidea) from the Great
California Museum of Paleontology, Berkeley. https://ucmp. Plains region, USA, based on the carbon isotope composition of
berkeley.edu/miomap, accessed 19 May 2019. tusk and molar enamel. Paleogeography, Paleoclimatology,
Cerling, T. E., J. M. Harris, B. J. MacFadden, M. G. Leakey, J. Quade, Paleoecology 206:311–335.
V. Eisenmann, and J. R. Ehleringer. 1997. Global vegetation Friedman, I., and J. R. O’Neil. 1977. Compilation of stable isotope
change through the Miocene/Pliocene boundary. Nature fractionation factors of geochemical interest. Professional Paper
389:153–158. 440- KK. U.S. Government Printing Office, Washington, D.C.
Cerling, T. E., J. M. Harris, and M. G. Leakey. 2003. Isotope paleo- https://doi.org/10.3133/pp440KK.
ecology of the Nawata and Nachukui Formations at Lothagam, Fritz, H. 1997. Low ungulate biomass in west African savannas:
Turkana Basin, Kenya. Pp. 605–624 in M. G. Leakey and primary production or missing megaherbivores or large predator
J. M. Harris, eds. Lothagam: the dawn of humanity in eastern species? Ecography 20:417–421.
Africa. Columbia University Press, New York. Fritz, H., P. Duncan, I. J. Gordon, and A. W. Illius. 2002. Megaher-
Christianson, D., and S. Creel. 2009. Effects of grass and browse bivores influence trophic guilds structure in African ungulate
consumption on the winter mass dynamics of elk. Oecologia communities. Oecologia 131:620–625.
158:603–613. Fritz, H., M. Loreau, S. Chamaille-Jammes, M. Valeix, and
Coplen, T. B. 1994. Reporting of stable hydrogen, carbon, and J. Clobert. 2011. A food web perspective on large herbivore com-
oxygen isotopic abundances. Pure and Applied Chemistry munity limitation. Ecography 34:196–202.
66:273–276. Geist, V. 1974. On the relationship of social evolution and ecology
Dansgaard, W. 1964. Stable isotopes in precipitation. Tellus 16:273– in ungulates. American Zoologist 14:205–220.
276. González-Guarda, E., A. Petermann-Pichincura, C. Tornero,
Dansgaard, W., S. J. Johnsen, H. B. Clausen, D. Dahl-Jensen, L. Domingo, J. Agustí, M. Pino, A. M. Abarzúa, J. M. Capriles,
N. S. Gundenstrup, C. U. Hammer, C. S. Hvidberg, N.A. Villavicencio, R. Labarca, V. Tolorza, P. Sevilla, and
J. P. Steffensen, A. E. Sveinbjörnsdottir, J. Jouzel, and G. Bond. F. Rivals. 2018. Multiproxy evidence for leaf-browsing and
1993. Evidence for general instability of past climate from a 250 closed habitats in extinct proboscideans (Mammalia, Probos-
kyr ice-core record. Nature 364:218–220. cidea) from Central Chile. Proceedings of the National Academy
DeSantis, L. R. G. 2016. Dental microwear textures: reconstructing of Sciences USA 115(37):9258–9263.
diets of fossil mammals. Surface Topography: Metrology and Graham, R. W. 2005. Quaternary mammal communities: relevance
Properties 4:1–12. of the individualistic response and non-analogue faunas. Pale-
DeSantis, L. R. G., R. S. Feranec, and B. J. MacFadden. 2009. Effects ontological Society Papers 11:141–158.
of global warming on ancient mammalian communities and their Graham, R. W., and E. C. Grimm. 1990. Effects of global climate
environments. PLoS ONE 4(6):e5750. https://doi.org/10.1371/ change on the patterns of terrestrial biological communities.
journal.pone.0005750. Trends in Ecology and Evolution 5:289–292.
Dirks, W., T. G. Bromage, and L. D. Agenbroad. 2012. The duration Graham, R. W., and E. L. Lundelius. 1984. Coevolutionary disequi-
and rate of molar plate formation in Palaeoloxodon cypriotes and librium and Pleistocene extinctions. Pp. 223–249 in P. S. Martin
Downloaded from https://www.cambridge.org/core. IP address: 46.4.80.155, on 01 Nov 2020 at 10:04:31, subject to the Cambridge Core terms of use, available at
https://www.cambridge.org/core/terms. https://doi.org/10.1017/pab.2020.7DIETARY RESOURCE COMPETITION IN PROBOSCIDEANS 55
and R. G. Klein, eds. Quaternary extinctions: a prehistoric revolu- L. Seymour, eds. Palaeoecology and palaeoenvironments of Late
tion. University of Arizona Press, Tuscon. Cenozoic Mammals: tributes to the career of C. S. (Rufus)
Grant, P. R., and B. R. Grant. 2006. Evolution of character displace- Churcher. University of Toronto Press, Toronto.
ment in Darwin’s finches. Science 313:224–226. Lister, A. M. 2013. The role of behaviour in adaptive morphological
Green, J. L., L. R. G. DeSantis, and G. J. Smith. 2017. Regional vari- evolution of African proboscideans. Nature 500:331–334.
ation in the browsing diet of Pleistocene Mammut americanum Lucas, S. G. 2008. Taxonomic nomenclature of Cuvieronius and
(Mammalia, Proboscidea). Palaeogeography, Palaeoclimatology, Haplomastodon, proboscideans from the Plio-Pleistocene of the
Palaeoecology 487:59–70. new world. New Mexico Museum Natural History and Science
Grimm, E. C., G. L. Jacobson, W. A. Watts, B. C. S. Hansen, and 44:409–415.
K. A. Maasch. 1993. A 50,000-year record of climate oscillations Lucas, S. G., and G. E. Alvarado. 2010. Fossil proboscidea from the
from Florida and its temporal correlation with the Heinrich upper Cenozoic of Central America: taxonomy, evolutionary and
events. Science 261:198–200. paleobiogeographic significance. Revista Geológica de América
Grimm, E. C., W. A. Watts, G. L. Jacobson, B. C. S. Hansen, H. Central 42:9–42.
R. Almquist, and A. C. Diffenbacher-Krall. 2006. Evidence for Lucas, S. G., R. H. Aguilar, and J. A. Spielmann. 2011.
warm wet Heinrich events in Florida. Quaternary Science Stegomastodon (Mammalia, Proboscidea) from the Pliocene of Jal-
Reviews 25:2197–2211. isco, Mexico and the species-level taxonomy of Stegomastodon.
Guthrie, R. D. 1984. Mosaics, allelochemics and nutrients: an New Mexico Museum Natural History and Science 53:517–553.
ecological theory of Late Pleistocene Megafaunal Extinctions. Pp. Lucas, S. G., G. S. Morgan, D. W. Love, and S. D. Connell. 2017. The
259–298 in P. S. Martin and R. G. Klein, eds. Quaternary extinctions: first North American mammoths: taxonomy and chronology of
a prehistoric revolution. University of Arizona Press, Tuscon. early Irvingtonian (early Pleistocene) Mammuthus from New
Hardin, G. 1960. The competitive exclusion principle. Science Mexico. Quaternary International 443:2–13.
131:1292–1297. Lundelius, E. L., V. M. Bryant, R. Mandel, K. J. Thies, and
Hedberg, C., and L. R. G. DeSantis. 2017. Dental microwear texture A. Thomas. 2013. The first occurrence of a toxodont (Mammalia,
analysis of extant koalas: clarifying causal agents of microwear. Notoungulata) in the United States. Journal of Vertebrate Paleon-
Journal of Zoology 301:206–214. tology 33:229–232.
Heinrich, H. 1988. Origin and consequences of ice-rafting in the Lundelius, E. L., K. J. Thies, R. W. Graham, C. J. Bell, G. J. Smith, and
northeast Atlantic Ocean during the last 130,000 years. Quater- L. R. G. DeSantis. 2019. Proboscidea from the Big Cypress Creek
nary Research 29:142–152. fauna, Deweyville Formation, Harris County, Texas. Quaternary
Hoppe, K. A. 2004. Late Pleistocene mammoth herd structure, International 530–531:59–68.
migration patterns, and Clovis hunting strategies inferred from MacArthur, R., and R. Levins. 1967. The limiting similarity, conver-
isotopic analyses of multiple death assemblages. Paleobiology gence, and divergence of coexisting species. American Naturalist
30:129–145. 101:377–385.
Hulbert, R. C., Jr. 2001. Mammalia 7: Proboscideans. Pp. 307–321 in MacFadden, B. J. 2000. Middle Pleistocene climate change recorded
R. C. Hulbert Jr., ed. The fossil vertebrates of Florida. University in fossil mammal teeth from Tarija, Bolivia, and upper limit of the
Press of Florida, Gainesville. Ensenadan Land-Mammal Age. Quaternary Research 54:121–131.
Janzen, D. H., and P. S. Martin. 1982. Neotropical anachronisms: MacFadden, B. J., and T. E. Cerling. 1996. Mammalian herbivore
the fruits the gomphotheres ate. Science 215:19–27. communities, ancient feeding ecology, and carbon isotopes: a
Koch, P. L., N. Tuross, and M. L. Fogel. 1997. The effects of sample 10-million year sequence from the Neogene of Florida. Journal
treatment and diagenesis on the isotopic integrity of carbonate in of Vertebrate Paleontology 16:103–115.
biogenic hydroxylapatite. Journal of Archaeological Sciences MacFadden, B. J., N. Solounas, and T. E. Cerling. 1999. Ancient
24:417–429. diets, ecology, and extinction of 5-million-year-old horses from
Koch P. L., K. A. Hoppe, and S. D. Webb. 1998. The isotope ecology Florida. Science 283:824–827.
of late Pleistocene mammals in North America, Part 1. Florida. May, R. M. 1974. On the theory of niche overlap. Theoretical Popu-
Chemical Geology 152:119–138. lation Biology 5:297–332.
Koch, P. L., N. S. Diffenbaugh, and K. A. Hoppe. 2004. The effects May, R. M., and R. H. MacArthur. 1972. Niche overlap as a function
of late Quaternary climate and pCO2 change on C4 plant abun- of environmental variability. Proceedings of the National Acad-
dance in the south-central United States. Palaeogeography, emy of Sciences USA 69:1109–1113.
Palaeoclimatology, Palaeoecology 207:331–357. Merceron, G., A. Ramdarshan, C. Blondel, J. R. Boisserie,
Kohn, M. J. 2010. Carbon isotope compositions of terrestrial C3 N. Brunetiere, A. Francisco, D. Gautier, X. Milhet, A. Novello,
plants as indicators of (paleo)ecology and (paleo)climate. Pro- and D. Pret. 2016. Untangling the environmental from the diet-
ceedings of the National Academy of Sciences USA 107:19691– ary: dust does not matter. Proceedings of the Royal Society of
19695. London B 283:20161032. https://doi.org/10.1098/rspb.2016.1032.
Kurtén, B., and E. Anderson. 1980. Pleistocene mammals of North Metcalfe, J. Z. 2017. Proboscidean isotopic compositions provide
America. Columbia University Press, New York. insight into ancient humans and their environments. Quaternary
Lambert, D. W., and J. Shoshani. 1998. Proboscidea. Pp. 606–621 in International 443:147–159.
C. Janis, K. Scott, and L. L. Jacobs, eds. Evolution of Tertiary Metcalfe, J. Z., and F. J. Longstaffe. 2012. Mammoth tooth enamel
mammals of North America, Vol. 1. Terrestrial carnivores, ungu- growth rates inferred from stable isotope analysis and histology.
lates, and ungulate-like mammals. Cambridge University Press, Quaternary Research 77:424–432.
New York. Morgan, G. S., and R. C. Hulbert. 1995. Overview of the geology
Landman, M., D. S. Schoeman, and G. I. H. Kerley. 2013. Shift in and vertebrate biochronology of the Leisey Shell Pit local fauna,
black rhinoceros diet in the presence of elephant: evidence for Hillsborough County, Florida. Bulletin of the Florida Museum
competition? PLoS ONE 8(7):e69771. https://doi.org/10.1371/ of Natural History 37:1–92.
journal.pone.0069771 Mothé, D., and L. S. Avilla. 2015. Mythbusting evolutionary issues
Larramendi, A. 2016. Shoulder height, body mass, and shape of on South American Gomphotheriidae (Mammalia: Proboscidea).
proboscideans. Acta Paleontologica Polonica 61:537–574. Quaternary Science Reviews 110:23–35.
Laub, R. S. 1996. The masticatory apparatus of the American mas- Mothé, D., L. S. Avilla, L. Asevedo, L. Borges-Silva, M. Rosas,
todon (Mammut americanum). Pp. 375–405 in K. M. Stewart and K. R. Labarca-Encina, R. Souberlich, E. Soibelzon, J.
Downloaded from https://www.cambridge.org/core. IP address: 46.4.80.155, on 01 Nov 2020 at 10:04:31, subject to the Cambridge Core terms of use, available at
https://www.cambridge.org/core/terms. https://doi.org/10.1017/pab.2020.756 GREGORY JAMES SMITH AND LARISA R. G. DESANTIS
L. Roman-Carrion, S. D. Ríos, A. D. Rincon, G. C. Oliveira, and R. analysis shows within-species diet variability in fossil hominins.
P. Lopes. 2017. Sixty years after “The mastodonts of Brazil”: the Nature Letters 436:693–695.
state of the art of South American proboscideans (Proboscidea, Scott R. S., P. S. Ungar, T. S. Bergstrom, C. A. Brown, B. D. Childs,
Gomphotheriidae). Quaternary International 43:52–64. M. F. Teaford, and A. Walker. 2006. Dental microwear texture
Müller, D. W. H., D. Codron, C. Meloro, A. Munn, A. Schwarm, analysis: technical considerations. Journal of Human Evolution
J. Hummel, and M. Clauss. 2013. Assessing the Jarman-Bell prin- 51:339–349.
ciple: scaling of intake, digestibility, retention time and gut fill Simard, M. A., S. D. Cote, R. B. Weladji, and J. Huot. 2008. Feedback
with body mass in mammalian herbivores. Comparative Bio- effects of chronic browsing on life-history traits of a large herbi-
chemistry and Physiology A 164:129–140. vore. Journal of Animal Ecology 77:678–686.
Nakagawa, S. 2004. A farewell to Bonferroni: the problems of low Sinclair, A. R. E. 1975. The resource limitation of trophic levels in
statistical power and publication bias. Behavioral Ecology tropical grassland ecosystems. Journal of Animal Ecology
15:1044–1045. 44:497–520.
Owen-Smith, R. N. 1988. Megaherbivores: the influence of very Sinclair, A. R. E., S. Mduma, and J. S. Brashares. 2003. Patterns of
large body size on ecology. Cambridge University Press, predation in a diverse predator-prey system. Nature 425:288–290.
Cambridge. Slotow, R., and G. van Dyk. 2001. Role of delinquent young
Pasenko, M. R. 2012. New remains of Rhynchotherium falconeri “orphan” male elephants in high mortality of white rhinoceros
(Mammalia, Proboscidea) from the earliest Pleistocene 111 in Pilanesberg National Park, South Africa. Koedoe 44(1):85–94.
Ranch, Arizona, U.S.A. with a discussion on sexual dimorphism Smith, G. J., and L. R. G. DeSantis. 2018. Dietary ecology of Pleisto-
and paleoenvironment of rhynchotheres. Palaeodiversity 5:89–97. cene mammoths and mastodons as inferred from dental microwear
Pérez-Crespo, V. A., J. L. Prado, M. T. Alberdi, J. Arroyo-Cabrales, textures. Palaeogeography, Palaeoclimatology, Palaeoecology
and E. Johnson. 2016. Diet and habitat for six American Pleisto- 492:10–25.
cene proboscidean species using carbon and oxygen stable iso- Still, C. J., J. A. Berry, G. J. Collatz, and R. S. DeFries. 2003. Global
topes. Ameghiniana 53:39–51. distribution of C3 and C4 vegetation: carbon cycle implications.
Pianka, E. R. 1976. Competition and niche theory. Pp. 114–141 in Global Biogeochemical Cycles 17:1006.
R. M. May, ed. Theoretical ecology—principles and applications. Stowe, L. G., and J. A. Teeri. 1978. The geographic distribution of
Blackwell Scientific, Oxford. C4 species of the Dicotyledonae in relation to climate. American
Poole, J. H. 1987. Rutting behavior in African elephants: the phe- Naturalist 112:609–623.
nomenon of musth. Behaviour 102:283–316. Teale, C. L., and N. G. Miller. 2012. Mastodon herbivory in mid-
Post, E. 2013. Life history variation and phenology. In E. Post., ed. latitude late-Pleistocene boreal forests of eastern North America.
Ecology of climate change: the importance of biotic interactions. Quaternary Research 78:72–81.
Monographs in Population Biology 52:54–95. Princeton Univer- Teeri, J. A., and L. G. Stowe. 1976. Climatic patterns and the distri-
sity Press, Princeton, N.J. bution of C4 grasses in North America. Oecologia 23:1–12.
Prideaux, G. J., L. K. Ayliffe, L. R. G. DeSantis, B. W. Schubert, Tejada-Lara, J. V., B. J. MacFadden, L. Bermudez, G. Rojas,
P. F. Murray, M. K. Gagan, and T. E. Cerling. 2009. Extinction R. Salas-Gismondi, and J. J. Flynn. 2018. Body mass predicts iso-
implications of a chenopod browse diet for a giant Pleistocene tope enrichment in herbivorous mammals. Proceedings of the
kangaroo. Proceedings of the National Academy of Sciences Royal Society of London B 285:20181020. https://doi.org/10.
USA 106:11646–11650. 1098/rspb.2018.1020.
Rabosky, D. L. 2013. Diversity-dependence, ecological speciation, Tipple, B. J., S. R. Meyers, and M. Pagani. 2010. Carbon isotope
and the role of competition in macroevolution. Annual Review ratio of Cenozoic CO2: a comparative evaluation of available geo-
of Ecology, Evolution, and Systematics 44:481–502. chemical proxies. Paleoceanography 25:PA3202. https://doi.
Reguero, M. A., A. M. Candela, and R. N. Alonso. 2007. Biochronol- org/10.1029/2009PA001851.
ogy and biostratigraphy of the Uquía formation (Pliocene-early Todd, N. E., N. Falco, N. Silva, and C. Sanchez. 2007. Dental micro-
Pleistocene, NW Argentina) and its significance in the great wear variation in complete molars of Loxodonta africana and Ele-
American biotic interchange. Journal of South American Earth phas maximus. Quaternary International 169–170:192–202.
Sciences 23:1–16. Ungar, P. S., C. A. Brown, T. S. Bergstrom, and A. Walker. 2003. A
Rivals, F., D. Mol, F. Lacombat, A. M. Lister, and G. M. Semprebon. quantification of dental microwear by tandem scanning confocal
2015. Resource partitioning and niche separation between mam- microscopy and scale-sensitive fractal analyses. Scanning 25:185–
moths (Mammuthus rumanus and Mammuthus meridionalis) and 193.
gomphotheres (Anancus arvernensis) in the Early Pleistocene of Ungar, P. S., G. Merceron, and R. S. Scott. 2007. Dental microwear
Europe. Quaternary International 379:167–170. texture analysis of Varswater bovids and Early Pliocene paleoen-
Sánchez, B., J. L. Prado, and M. T. Alberdi. 2004. Feeding ecology, vironments of Langebaanweg, Western Cape Province, South
dispersal, and extinction of South American Pleistocene gom- Africa. Journal of Mammalian Evolution 14:163–181.
photheres (Gomphotheriidae, Proboscidea). Paleobiology Ungar, P. S., F. E. Grine, and M. F. Teaford. 2008. Dental microwear
30:146–161. and diet of the Plio-Pleistocene hominin Paranthropus boisei. PLoS
Sanders, W. J. 2007. Taxonomic review of fossil Proboscidea (Mam- ONE 3:e2044. https://doi.org/10.1371/journal.pone.0002044.
malia) from Langebaanweg, South Africa. Transactions of the von Koenigswald, W. 2016. The diversity of mastication patterns in
Royal Society of South Africa 62(1):1–16. Neogene and Quaternary proboscideans. Palaeontographica
Schluter, D. 2000. Ecological character displacement in adaptive Abteilung A 307:1–41.
radiation. American Naturalist 156:S4–S16. Wang, S., T. Deng, T. Tang, G. Xie, Y. Zhang, and D. Wang. 2015.
Schoener, T. W. 1974. Resource partitioning in ecological communi- Evolution of Protanancus (Proboscidea, Mammalia) in East Asia.
ties. Science 185:27–38. Journal of Vertebrate Paleontology 35(1):e881830. https://doi.
Schoener, T. W. 1982. The controversy over interspecific competi- org/10.1080/02724634.2014.881830.
tion. American Naturalist 70:586–595. Webb, S. D. 1974. Chronology of Florida Pleistocene mammals. Pp.
Scott, J. R. 2012. Dental microwear texture analysis of extant Afri- 5–31 in S. D. Webb, ed. Pleistocene mammals of Florida. Univer-
can Bovidae. Mammalia 76:157–174. sity of Florida Press, Gainesville.
Scott, R. S., P. S. Ungar, T. S. Bergstrom, C. A. Brown, F. E. Grine, Webb, S. D. 1985. Late Cenozoic mammal dispersals between the
M. F. Teaford, and A. Walker. 2005. Dental microwear texture Americas. In F. G. Stehil and S. D. Webb, eds. The Great American
Downloaded from https://www.cambridge.org/core. IP address: 46.4.80.155, on 01 Nov 2020 at 10:04:31, subject to the Cambridge Core terms of use, available at
https://www.cambridge.org/core/terms. https://doi.org/10.1017/pab.2020.7You can also read