Modelling the Brumadinho tailings dam failure, the subsequent loss of life and how it could have been reduced - NHESS
←
→
Page content transcription
If your browser does not render page correctly, please read the page content below
Nat. Hazards Earth Syst. Sci., 21, 21–37, 2021
https://doi.org/10.5194/nhess-21-21-2021
© Author(s) 2021. This work is distributed under
the Creative Commons Attribution 4.0 License.

Modelling the Brumadinho tailings dam failure, the subsequent
loss of life and how it could have been reduced
Darren Lumbroso, Mark Davison, Richard Body, and Gregor Petkovšek
HR Wallingford, Howbery Park, Wallingford, Oxfordshire OX10 8BA, UK

Correspondence: Darren Lumbroso (d.lumbroso@hrwallingford.com)

Received: 12 May 2020 – Discussion started: 4 June 2020
Revised: 11 November 2020 – Accepted: 13 November 2020 – Published: 7 January 2021

Abstract. In recent years the number of tailings dams fail-      2017). There are three principal methods via which tailings
ures has increased. On 25 January 2019, the Brumadinho           dams are constructed: upstream, downstream and centreline.
tailings dam in Brazil suddenly failed, releasing a mudflow      These are shown in Fig. 1. The upstream method has the
over 10 m deep comprising some 107 m3 of mining waste            lowest initial cost, owing to the minimal amount of fill ma-
which killed between 270 and 320 people. This paper details      terial required for the initial construction and subsequent
the use of an agent-based model, known as the Life Safety        raising, which normally consists entirely of the coarse frac-
Model (LSM), to estimate the risk to people downstream of        tion of the tailings (Martin and McRoberts, 1999). Martin
the Brumadinho tailings dam and to assess if the number of       and McRoberts (1999) describe upstream tailings dams as
fatalities could have been reduced if a warning had been re-     “unforgiving structures” with any one or a combination of
ceived prior to or at time the dam failed. The LSM mod-          improper design, construction and operation resulting in a
elling indicates that even if a warning had been issued as the   catastrophic failure (Martin and McRoberts, 1999).
dam failed, the number of fatalities could have been reduced.       In recent years the number of tailings dam failures has
Agent-based modelling tools such as the LSM can help to in-      increased. Around half of the significant tailings dam fail-
form and improve emergency plans for tailings dams, which        ures in the last 70 years occurred between 1990 and 2010
will help to reduce the risks posed by them in the future.       (Azam and Li, 2010). In South America there are around
                                                                 1200 mines currently in operation which have tailings dams
                                                                 and many thousands of tailings dams which have been aban-
                                                                 doned and/or which are no longer operational (Azam and
1   Introduction                                                 Li, 2010). In 2001 the International Commission On Large
                                                                 Dams (ICOLD) stated that “the mining industry has a less
Tailings dams are earth embankments used to store waste          than perfect record when tailings dam failures are reviewed”
materials, known as tailings, from mining operations. They       (ICOLD, 2001). Although this statement was made almost
can be more than 100 m high and in some cases several kilo-      20 years ago, the probability of a tailings dam failing is still
metres long (Kossoff et al., 2014). Tailings dams are often      high in the context of long-lived infrastructure (Bowker and
constructed from readily available materials, and over their     Chambers, 2017; Lyu et al., 2019). In Brazil there have been
operating life they are frequently raised as the quantity of     12 major tailings dam failures since 1986, which have re-
stored tailings increases (Lumbroso et al., 2019).               sulted in over 1000 deaths and adversely affected the liveli-
   Tailings dams are long-lived infrastructure which are of-     hoods of millions of people, as well as causing environmental
ten required to be in place in perpetuity (Lumbroso et al.,      damage to thousands of kilometres of rivers (Palú and Julien,
2019). In the context of long-lived infrastructure the rate      2019).
of failure of tailings dams is high, owing to inadequate de-        Dam “B1” of the Córrego do Feijão mine, referred to in
sign regulations, as well as less rigorous construction and      this paper as the Brumadinho tailings dam, was a tailings
supervision methods than for normal water-retaining dams,        dam 86 m high with a crest length of 700 m and storage vol-
especially in low-income countries (Bowker and Chambers,

Published by Copernicus Publications on behalf of the European Geosciences Union.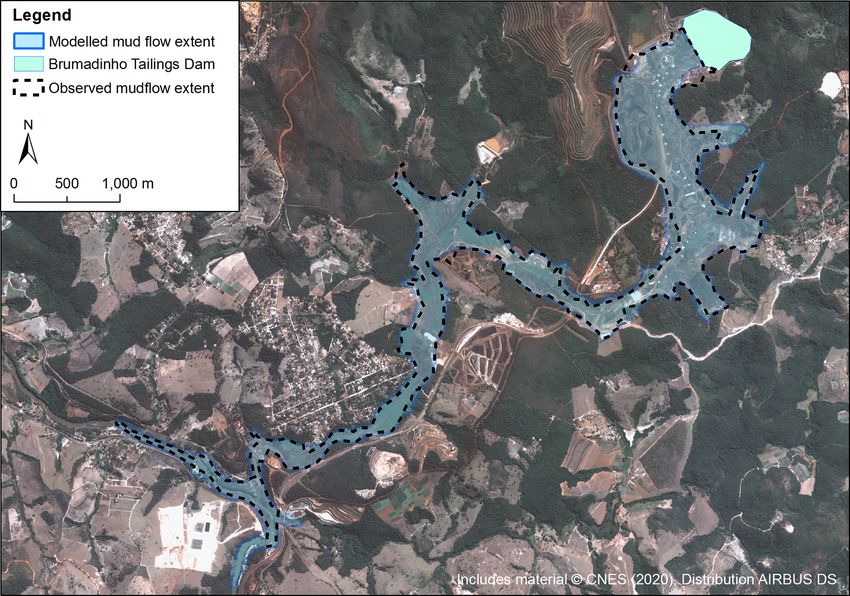
22 D. Lumbroso et al.: Modelling the Brumadinho tailings dam failure and the subsequent loss of life
atively shallow failure to develop (Robertson et al., 2019).
This was then followed by a series of retrogressive failures
that released the large volume of mine waste (Robertson et
al., 2019).
The failure of the Brumadinho tailings dam led to hun-
dreds of people losing their lives and immense damage to the
environment, as well as people’s livelihoods. There is some
anecdotal evidence to suggest that it took the mudflow be-
tween 1.5 and 2 h to reach the Paraopeba River some 10 km
downstream of the tailings dam (Xinhua, 2020). The location
of the Brumadinho tailings dam and the extent of the mud-
flow, as well as other key locations related to the event, are
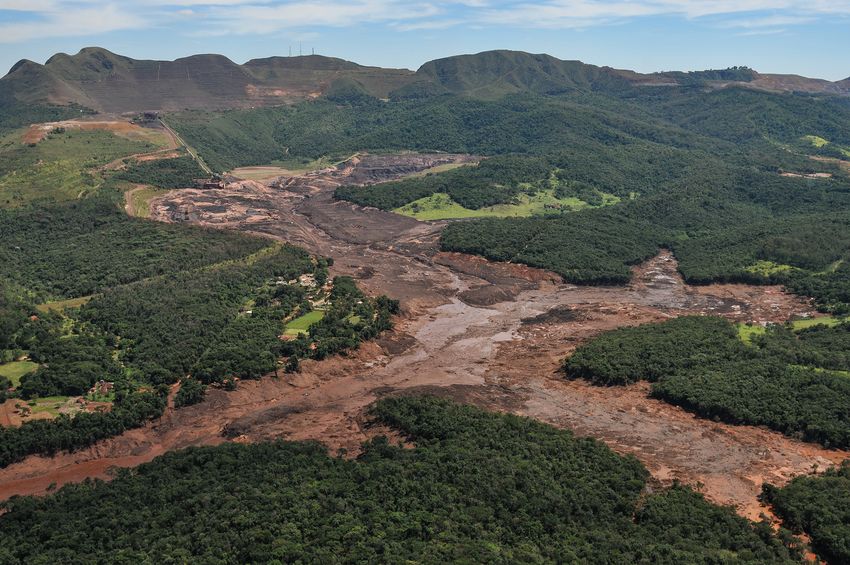
shown in Fig. 4. A photograph of the aftermath of the failure
taken on 1 February 2019 is shown in Fig. 5.
Mining developments, including tailings dams, often grow
gradually over long periods of time, and as a result the re-
sponsibility for the direct and indirect risks posed by these
operations to downstream communities and the environment
is often avoided (Downing, 2014; Owen et al., 2020). Fol-
Figure 1. Different methods of construction for tailings dams lowing recent tailings dam failures there has been a renewed
(source: adapted from Vick, 1990).
sense of urgency from industry, civil society and the investor
community to understand the types of risks posed by tailings
dams (Owen et al., 2020).
ume of approximately 12×106 m3 , located 9 km north-east The main objectives of this work were to:
of the town of Brumadinho in the state of Minas Gerais in – highlight the use of an agent-based model and other
Brazil (Palú and Julien, 2019; Robertson et al., 2019). The modelling tools to estimate the risk to people down-
dam was built using the upstream construction method over stream of the Brumadinho tailings dam;
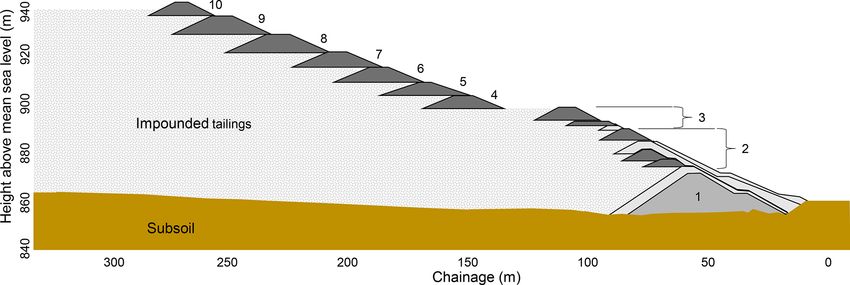
a period of 37 years in 10 raises (Robertson et al., 2019).
A cross section through Brumadinho tailings dam is shown – assess if the number of fatalities could have been re-
in Fig. 2. The last time the dam was raised was in 2013, and duced if a warning had been received prior to or at time
tailings disposal ceased in July 2016 (Robertson et al., 2019). the dam failed, albeit one with a short lead time1 ;
The Brazilian Institute of Water Management of Mines (In- – demonstrate how these modelling tools can help to in-
stituto Mineiro de Gestão das Águas) and the National Min- form emergency plans for tailings dams.
ing Agency (Agência Nacional de Mineração) had evaluated
and classified the dams probability of failure as being “low” Three separate models were used in this research as follows:
(Porsani et al., 2019). – a dam breach model known as EMBREA-MUD, spe-
At 12:28 LT (local time) on 25 January 2019, the Bru- cially developed to model tailings dam breaches, which
madinho tailings dam suffered a sudden failure, releasing a was used to help to generate an outflow hydrograph of
mudflow over 10 m deep which moved rapidly downstream the tailings;
(Robertson et al., 2019). The failure extended across much of
the face of the dam, and its collapse was complete in less than – a two-dimensional hydrodynamic model of the non-
10 s. Around 9.7×10⁶ m3 of material were released, approx- Newtonian mudflow which provided depths and veloci-
imately 75 % of the stored tailings (Robertson et al., 2019). ties of the mudflow at 5 s intervals;
The ∼ 107 m3 of tailings material flowed out of the Brumad- – an agent-based model of people and vehicles, called the
inho tailings dam within about 5 min (Robertson et al., 2019). Life Safety Model (LSM), which was used to assess the
Information derived from a YouTube video of the event in- loss of life and how warnings of the imminent failure
dicates that the maximum velocity of the mudflow may have could have reduced the death toll.
been as high as 33 m s−1 (Petley, 2019). Three stills from the
YouTube video of the dam failure, together with the local
time at which they were taken, are shown in Fig. 3. 2 Modelling of the Brumadinho tailings dam failure
The official report on the Brumadinho tailings dam fail-
ure found that it occurred as a result of static liquefaction A two-fluid dam breach model, known as EMBREA-MUD,
(Robertson et al., 2019). The investigation deduced that the was initially used to model the Brumadinho tailings dam
failure initiated close to the crest of the dam but very rapidly 1 The lead time is the time between a warning being issued and
progressed through the entire structure, allowing a compar- an event occurring.
Nat. Hazards Earth Syst. Sci., 21, 21–37, 2021 https://doi.org/10.5194/nhess-21-21-2021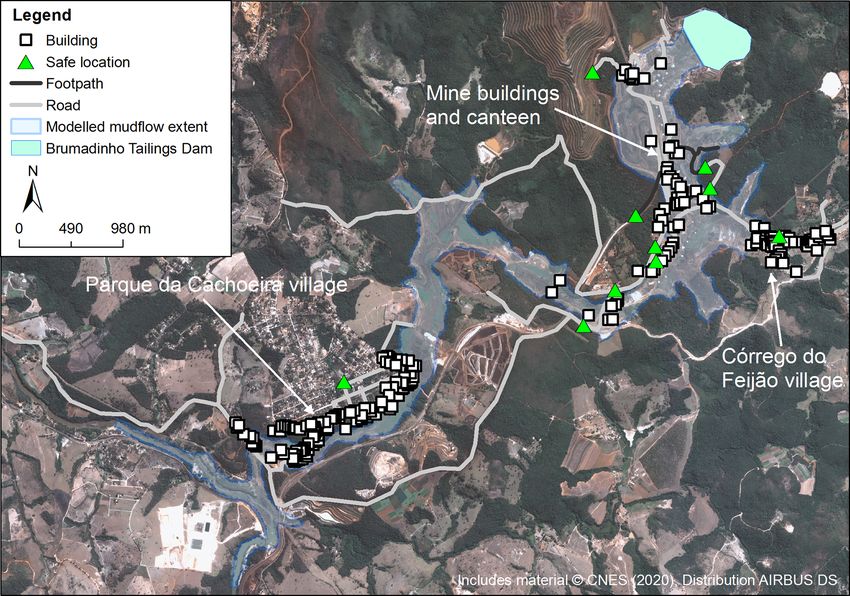
D. Lumbroso et al.: Modelling the Brumadinho tailings dam failure and the subsequent loss of life                                           23

Figure 2. Cross section of the Brumadinho tailings dam and the stages in which it was raised (source: adapted from Robertson et al., 2019).

                                                                        against a number of dam failures case studies including the
                                                                        Orós dam in Brazil in 1961, the Banqiao dam in China
                                                                        in 1975 (Morris, 2011) and the Teton dam in USA in 1976
                                                                        (Mohamed et al., 2002).
                                                                           EMBREA-MUD predicts the growth of a breach in tail-
                                                                        ings dams via a range of processes, as well as the quan-
                                                                        tity of water and tailings released from the dam in the form
                                                                        of a hydrograph (Mohamed et al., 2002; Petkovšek et al.,
                                                                        2020). Both processes, breaching and outflowing, are simu-
                                                                        lated simultaneously based on the characteristics of the dam
                                                                        material, predicting the evolution of a breach opening with-
                                                                        out the need to make assumptions regarding the dimensions
                                                                        of the breach. EMBREA-MUD has been validated against
                                                                        two tailings dams failures, the Merriespruit tailings dam fail-
                                                                        ure in South Africa in 1994 and the Mount Polley tailings
                                                                        dam failure in British Columbia in Canada in August 2014
                                                                        (Petkovšek et al., 2020).
                                                                           The EMBREA-MUD breach model of the Brumadinho
                                                                        tailings dam comprised three layers as follows:

                                                                           – water layer including eroded tailings and dam material
                                                                             in suspension, which behaves as a Newtonian fluid2 ;

                                                                           – mud layer with a viscoplastic non-Newtonian behaviour
                                                                             representing the liquefied tailings;

                                                                           – solid comprising material making up the tailings dam.

                                                                        Soon after the Brumadinho tailings dam failed in Jan-
Figure 3. Stills from the YouTube video of the Brumadinho dam           uary 2019, EMBREA-MUD was used to develop two breach
failure (source: YouTube (2020), provided to the Brumadinho dam         scenarios: a “base” scenario and an “extreme” scenario. Both
investigation by the National Mining Agency of Brazil).                 these scenarios were based on a total mobilized volume of
                                                                        material of ∼ 7.2 × 10⁶ m3 . Both breach scenarios were as-
                                                                        sumed to have taken place over 2 min. The base scenario had
                                                                        a peak flow of 160 000 m3 s−1 , and the extreme scenario had
failure. EMBREA-MUD models water and tailings and pro-                  a peak flow of 350 000 m3 s−1 . In December 2019 Robert-
vides times series of water and tailings outflows in the form           son et al. (2019) released their expert panel report on the
of hydrographs which can be used as the input to a down-                technical causes of the Brumadinho tailings dam failure (see
stream model of the subsequent mudflow. EMBREA-MUD                      Robertson et al., 2019). This report indicated that the quantity
is based on the EMBREA model, developed over a 20-
year period by HR Wallingford, which simulates embank-                      2 A Newtonian fluid is a fluid in which the viscous stresses aris-
ment dam breaches and was first developed by Mohamed                    ing from its flow, at every point, are linearly correlated to the local
et al. (2002) under the name HR BREACH and validated                    strain rate, the rate of change of its deformation over time.

https://doi.org/10.5194/nhess-21-21-2021                                             Nat. Hazards Earth Syst. Sci., 21, 21–37, 2021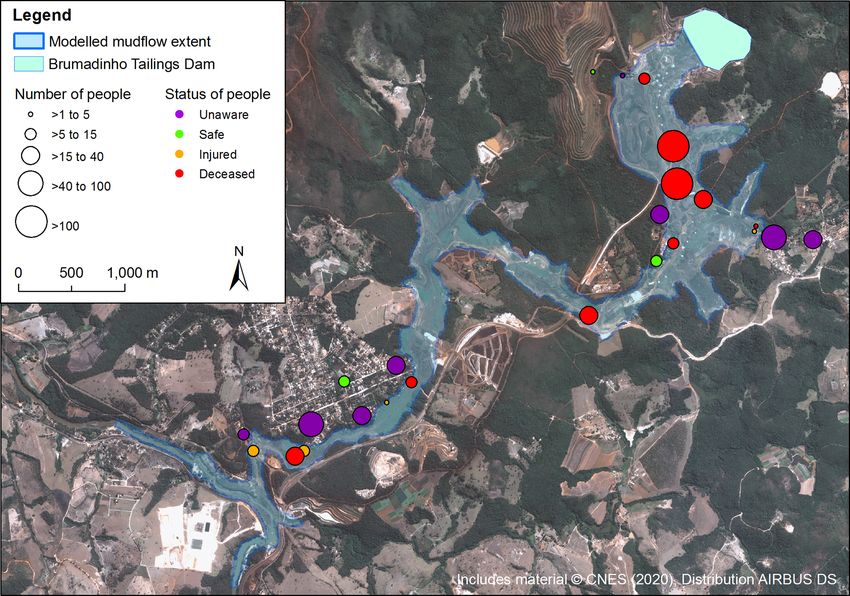
24                      D. Lumbroso et al.: Modelling the Brumadinho tailings dam failure and the subsequent loss of life

Figure 4. Location of the Brumadinho tailings dams and the extent of the mudflow (source: European Space Agency Copernicus Sentinel-
2A-L1C Satellite image and © OpenStreetMap contributors 2019; distributed under a Creative Commons BY-SA license; the image contains
modified Copernicus Sentinel data 2019).

Figure 5. Photograph taken on 1 February 2019 showing the af-         Figure 6. Assumed outflow breach hydrograph developed for the
termath of the Brumadinho dam failure directly downstream of the      Brumadinho tailings dams failure in January 2019.
site (source: Felipe Werneck, Instituto Brasileiro do Meio Ambiente
e dos Recursos Naturais Renováveis; reproduced under a Wikime-
dia Commons CC-BY-SA-2.0 licence).                                    the expert report and representing the progressive failure of
                                                                      the dam. The maximum mudflow discharge of 90 000 m3 s−1
                                                                      is reached within 5 s. The discharges produced by the sud-
                                                                      den failure of tailings dams tend to be very high. Studies
of material was about 35 % higher than had originally been
                                                                      carried out for the failure of various tailings dams have es-
assumed in the EMBREA-MUD model (i.e. ∼ 9.7 × 10⁶ m3 )
                                                                      timated that the peak discharges can be between 25 000 and
and that it took around 5 rather than 2 min for all the mobi-
                                                                      500 000 m3 s−1 , depending on their size, shape and how
lized material to leave the location of the failure (location A
                                                                      quickly the dam fails (Martin and Akkerman, 2017; Mi-
in Fig. 4). In terms of the fully formed breach geometry, the
                                                                      lanović, 2019). The shape of the outflow hydrograph, shown
whole of the tailings dam failed so this was assumed to be
                                                                      in Fig. 6, was based on information in the expert panel re-
the same as the sides of the valley
                                                                      port, which stated that the dam failed progressively and also
   Utilizing the information in the expert panel report a
                                                                      the velocity at which the mudflow travelled based on a high-
breach hydrograph was developed based on the simplified
                                                                      quality YouTube video of the incident (see YouTube, 2020).
shape of the extreme scenario modelled using EMBREA-
MUD but using the mobilized material volume specified in

Nat. Hazards Earth Syst. Sci., 21, 21–37, 2021                                         https://doi.org/10.5194/nhess-21-21-2021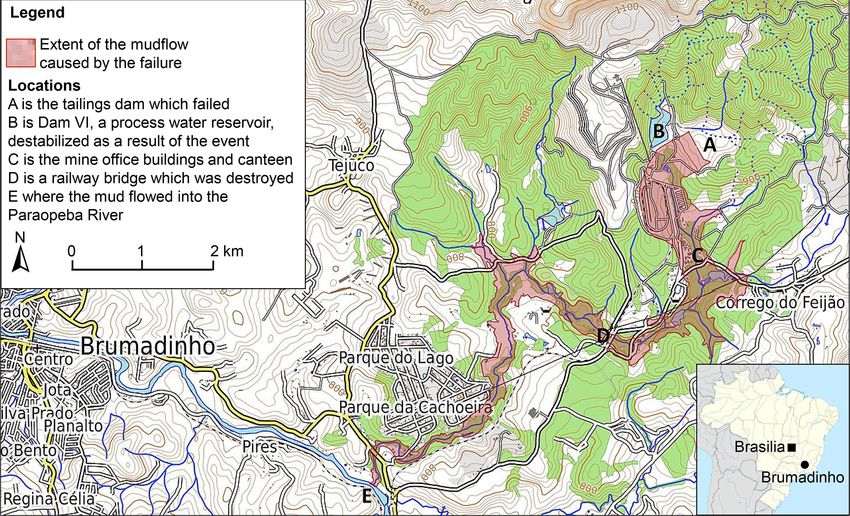
D. Lumbroso et al.: Modelling the Brumadinho tailings dam failure and the subsequent loss of life                             25

3    Modelling of the mudflow resulting from the                  Table 1. Manning’s M roughness values used in the mudflow
     Brumadinho tailings dam failure                              model.

Outflow from the Brumadinho tailings dam was a mixture                     Type of land use    Manning’s   Equivalent
of the dam itself, tailings and water (Robertson et al., 2019).                                 M value    Manning’s n
This mixture did not behave in the same manner as floodwa-                 Forest and jungle           6       0.167
ter; it behaved as a rheological material. Rheological flows               Pasture                    16       0.063
are gravity-driven mass flows whose dynamic behaviour is                   Mine workings              32       0.031
akin to a non-Newtonian fluid (De Blasio, 2011) and which                  Buildings                   4       0.250
are characterized by changes in viscosity in response to the
strain rates within the fluid. The use of a method, which uses
the Bingham plastic rheological model, has been shown to be            yield stresses (i.e. > 1500 N m−2 ) prevented the flows
a good approximation for the flow of liquefied tailings (Jeya-         from reaching the Paraopeba River. Conversely, yield
palan et al., 1983).                                                   stresses < 500 N m−2 resulted in flows reaching the
   The mudflow generated by the Brumadinho tailings dam                Paraopeba River too quickly. Values of between 750 and
failure was modelled using MIKE 21. MIKE 21 is a two-                  1000 N m−2 meant that time of the mudflow arrival at
dimensional hydrodynamic model which can model mud-                    the Paraopeba River matched those reported.
flows. The mudflow flow model extended from the loca-
tion of the Brumadinho tailings dam (location A in Fig. 4)         3. Bingham fluid viscosity. The mudflow model was run
to the confluence with the Paraopeba River (location E in             with two fluid viscosity values, 30 and 100 kg m−1 s−1 .
Fig. 4), a distance of some 10 km in total. MIKE 21 uses              The results showed that the higher value gave a better
the full Bingham model (Bingham, 1916), which is based on             match between the observed and modelled mudflow ex-
the 2006 work by Naef et al. (2016). The model determines             tents.
the flow resistance term τ0 /ρgh from the following equation      In addition to the above parameters the roughness of the
(Naef et al., 2006):                                              floodplain needed to be set. The MIKE 21 mudflow model
                µB q                                            uses “Manning’s M” as an input parameter for roughness.
2τ03 − 3 τy + 2 2 τ02 + τy3 = 0,                            (1)   Manning’s M is the inverse of Manning’s n roughness coef-
                  h
                                                                  ficient (i.e. n1 ). The values of Manning’s M and their equiva-
where q is the flux in terms of discharge per unit width, h is    lent n values used in the model are given in Table 1.
the fluid depth, µB is the Bingham fluid viscosity, τy is the        The roughness values in Table 1 are based on those in stan-
yield stress and τ0 is the shear stress                           dard texts such as Chow (1959).
   MIKE 21 solves the equation numerically to give τ0 as a           The Airbus WorldDEM Digital Terrain Model (DTM)
function of τy (the yield stress), τB (the Bingham viscosity),    which represents a bare-earth surface on a 0.4 arcsec grid
h and q. The three inputs to the MIKE 21 model are fluid          (approximately 12 m) was used to represent the topog-
density in kg m−3 , yield stress in N m−2 and the dynamic         raphy of the downstream valley. The accuracy of this
viscosity in kg m−1 s−1 . There were no field or laboratory       earth-observation-based DTM surpasses that of any global
measurements available for the Brumadinho mudflow, so the         satellite-based elevation model available. Previous modelling
rheological properties of mudflows were derived using infor-      of the Brumadinho mudflow used the HEC-RAS (Hydrologic
mation from the expert panel report (Robertson et al., 2019),     Engineering Center’s River Analysis Stream) hydrodynamic
a high-quality video of the event and remote sensing infor-       modelling software, which can only model Newtonian flows
mation which showed the maximum extent of the mudflow.            and used a less accurate 30 m grid DTM (see Raman and Liu,
   The selection of the three key parameters for the MIKE 21      2019). In the MIKE 21 mudflow model, a flexible triangu-
mudflow model are discussed below:                                lar mesh was used with a maximum element area of 150 m2 .
    1. Fluid density. MIKE 21 only allows a single fluid den-     The mesh comprised a total of some 169 000 elements, which
       sity to be used. A value of 1800 kg m−3 was found to       covered the area from the toe of the Brumadinho tailings dam
       be appropriate because this density reflects the com-      (location A in Fig. 4) to the Paraopeba River (location E in
       bination of the tailings, the embankment and the flu-      Fig. 4). The inflows to the two-dimensional mudflow model
       ids within the tailings dam. Values were derived from      were applied at the base of Brumadinho tailings dam (loca-
       the expert panel into the dam failure (Robertson et al.,   tion A in Fig. 4).
       2019), as well as the work done by Rickenmann (1999)          This Brumadinho tailings dam failure was a rarity in that
       and Rickenmann et al. (2006).                              there are high-quality video images of the event, which pro-
                                                                  vide an insight into the failure mechanism, the speed at which
    2. Yield stress. The mudflow model was tested using a         the mudflow initially moved downstream and the approxi-
       range of yield stresses between 400 and 4000 N m−2 .       mate time at which some of the buildings were destroyed.
       The mudflow model results showed that using high           The results of the mudflow modelling showed that the out-

https://doi.org/10.5194/nhess-21-21-2021                                      Nat. Hazards Earth Syst. Sci., 21, 21–37, 2021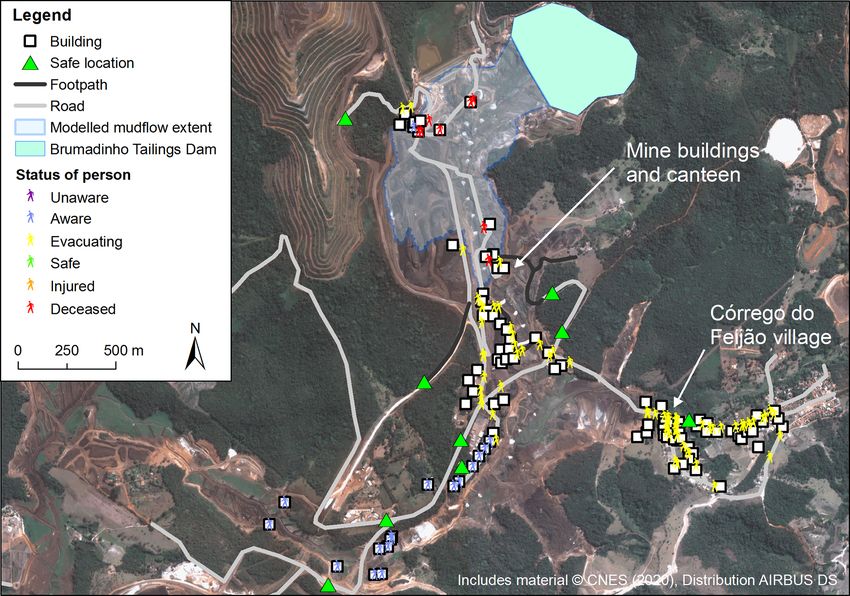
26                     D. Lumbroso et al.: Modelling the Brumadinho tailings dam failure and the subsequent loss of life

Figure 7. Comparison of the maximum modelled mud extent and the observed maximum mud extent downstream of the Brumadinho tailings
dams.

Table 2. Modelled mudflow depths and arrival times at key loca-    4     Loss-of-life and evacuation modelling
tions.

  Location           Location    Modelled arrival   Modelled       4.1    Introduction
                     in Fig. 4     time of the      maximum
                                  mudflow after     depth of
                                   the failure      mudflow        At least 270 people perished as a result of the collapse, most
                                   (h: min: s)        (m)          of them employees of the mine. The mine’s canteen and ad-
                                                                   ministrative offices, as well as three locomotives and some
  Canteen               C           00:01:30          18.7         130 wagons, were buried in the mine plant area (Porsani,
  Railway bridge        D           00:09:10          16.6
                                                                   2019). The mudflow destroyed some parts of the Córrego
  Paraopeba River       E           01:26:05          11.6
                                                                   do Feijão district, including a nearby inn and several rural
                                                                   properties, as well as sections of a railway bridge and about
                                                                   100 m of railway track. Agricultural areas in the valley below
puts provided a good representation of the actual event both       the dam were also damaged by the failure (Porsani, 2019). It
in terms of reproducing the maximum mudflow envelope and           is essential that the risks to people associated with tailings
the velocity at which the flow moved based on the video of         dams be evaluated rigorously and managed proactively at all
the event and other evidence available.                            stages of their lives so that the risks posed by a failure re-
   Figure 7 shows a comparison between the maximum mod-            mains “as low as reasonably practicable” (ALARP) (Bowles,
elled mudflow and the maximum extent estimated from re-            2003). This section of the paper describes the modelling of
mote sensing data, and Table 2 provides the modelled mud-          the risk to people using an agent-based model and investi-
flow depths and arrival times at key locations. The mudflow        gates if the risk to people could have been reduced via the
maximum extent agreed well with the observed extent from           use of warnings and designated evacuation routes.
the remote sensing data. Where there are differences these
are mainly a result of the DTM and the challenges in esti-
mating the exact maximum mudflow extent from the remote            4.2    Background to the Life Safety Model (LSM) and
sensing data available at the time of the disaster. The mud-              people at risk modelling
flow model was run using a 5 s time step which provides a
suitable fine temporal resolution for the loss-of-life and evac-
uation modelling carried out as part of this work.                 To model the loss of life and how this could have been
                                                                   reduced, an agent-based model called the Life Safety
                                                                   Model (LSM) was employed. The LSM is an agent-based

Nat. Hazards Earth Syst. Sci., 21, 21–37, 2021                                       https://doi.org/10.5194/nhess-21-21-2021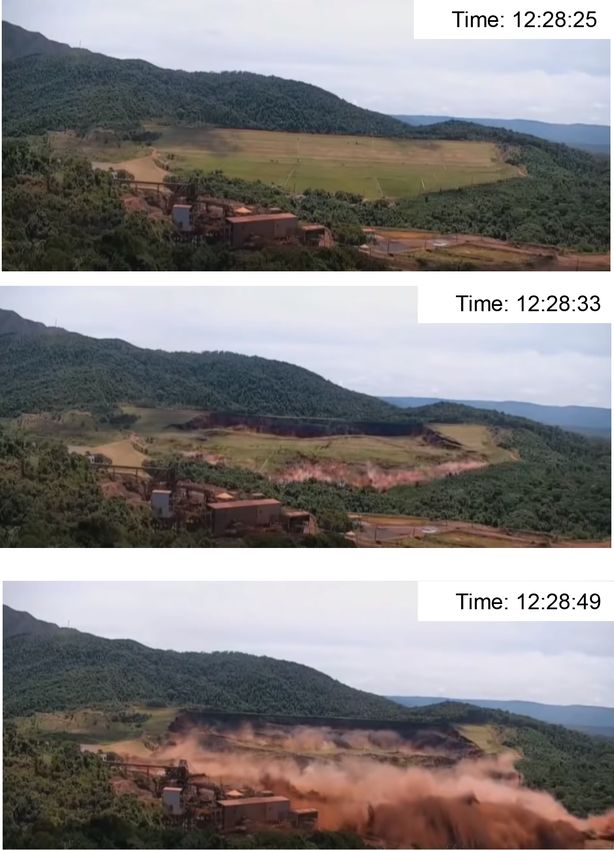
D. Lumbroso et al.: Modelling the Brumadinho tailings dam failure and the subsequent loss of life                                       27

model3 which allows for the behaviour of each person at risk                 – The number and location of residential buildings at risk
to be represented. The initial development of the LSM com-                     was estimated from remote sensing data and the max-
menced in 2002 by BC Hydro, a Canadian electricity utility,                    imum observed mudflow extent. It was estimated that
and Canada’s National Research Council, and since 2009 it                      there were 51 houses at risk and that at the time of the
has been further developed by HR Wallingford.                                  dam collapse each house was assumed to have had two
   Prior to the development of the LSM, simple empirical                       people in it.
methods, such as those developed by the US Bureau of
                                                                           The LSM has a function which relates the damage and possi-
Reclamation (see Graham, 1999; USBR, 2014), were mainly
                                                                           ble collapse of buildings to the velocity and depth of the flow.
used to assess the risk to people from dams. These mod-
                                                                           The majority of buildings in the LSM model were considered
els are based on limited data sets, include few large dams
                                                                           to be of an average masonry construction, which means that
(i.e. greater than 15 m high) and also have a mix cases of
                                                                           significant damage and collapse will only commence after
where warnings were and were not received (Assaf and Hart-
                                                                           the combination of the maximum velocity and depth of the
ford, 2001), and, although commonly used, owing to their
                                                                           flow exceeds 10 m2 s−1 . The mine buildings were assumed
limitations they are not particularly helpful in formulating
                                                                           to be constructed of “average concrete”, which means that
emergency plans; however, they are useful as a screening tool
                                                                           significant damage and failure will commence after the com-
to prioritize structures which pose the greatest risk. The LSM
                                                                           bination of the maximum velocity and depth of the flow ex-
simulates the interaction of people with the modelled flood or
                                                                           ceeds 20 m2 s−1 . At the location of the mine buildings, the
mudflow. This allows for various scenarios to be investigated
                                                                           maximum combination of mudflow depth and velocity was
that could help to reduce the risk to people (e.g. improve-
                                                                           in excess of 50 m2 s−1 , meaning that all the buildings would
ments in warnings, development of new evacuation routes
                                                                           have collapsed. In the LSM it is assumed that when a build-
and sensitivity of people’s response times to warnings). The
                                                                           ing collapses, anybody still inside it dies instantaneously.
LSM has been validated for a number of historical dam fail-
                                                                              The LSM modelling considered evacuation routes both by
ures (see Lumbroso et al., 2011; Johnstone and Garret, 2014)
                                                                           vehicle and on foot. These possible evacuation routes were
and used to assess the risks to people and improve emer-
                                                                           digitized from remote sensing data. The pathways and trails
gency planning in 12 countries worldwide (Lumbroso and
                                                                           were set up in the LSM to only allow pedestrian access, and
Di Mauro, 2008; Lumbroso et al., 2010; Lumbroso and Davi-
                                                                           only existing roads were set up to take vehicles. The evacu-
son, 2018).
                                                                           ation routes used in the LSM were based on existing paths
   The number of people at risk before the Brumadinho tail-
                                                                           and roads. In the LSM the evacuation route from each build-
ings dam collapsed was estimated to be 502. This number
                                                                           ing is determined by the shortest route to a safe location
included the number of people working in the mine’s build-
                                                                           (i.e. the “least-cost path”). However, the LSM is dynamic,
ings including the canteen directly downstream of the dam,
                                                                           and so when evacuation routes are inundated and become im-
as well as people residing in houses in villages further down-
                                                                           passable, this leads to a recalculation of the least-cost path.
stream. The number of people at risk was an estimate based
                                                                           People evacuating are then directed to the next-closest safe
on the best available information from media reports. It is
                                                                           location.
important to note that there is likely to be a relatively high
                                                                              Safe locations were placed at heights above the maxi-
degree of uncertainty in the estimated number of people at
                                                                           mum flood depth at the end of each evacuation route. The
risk (e.g. ±25 %). However, the objective of this work was
                                                                           location of the buildings, evacuation routes and safe loca-
not to predict the actual number of fatalities to within ±10 %
                                                                           tions are shown in Fig. 8. More information on the techni-
but to investigate how the loss of life could have been signif-
                                                                           cal details of the LSM are available in Lumbroso and Davi-
icantly reduced.
                                                                           son (2018) together with various other publications available
   The number of people at risk was built up as follows:
                                                                           at http://www.lifesafetymodel.net/publications.html (last ac-
  – The dam failed at lunchtime, and many of the work-                     cess: 4 January 2021).
    ers were eating in the staff canteen. It was assumed that                 Two evacuation scenarios were considered in the mod-
    there were 200 people in the canteen at the time of the                elling as follows:
    incident. Media reports point to the canteen being the                   – Everybody at risk evacuates from the area at risk on
    worst hit in terms of fatalities.                                          foot.
  – In addition, it was assumed that there were 10 people                    – Half of the 400 mine workers evacuate by vehicle and
    in each of the other site buildings, most of which were                    half by foot, with villagers downstream evacuating on
    located near to the canteen, giving a total of 400 people                  foot. In this scenario it was assumed that there were
    on the site.                                                               40 pickup trucks available and that each one had the
   3 An agent-based model comprises a collection of autonomous
                                                                               capacity for five mine workers.
decision-making entities called agents. Each agent individually as-        Velocities and depths from the two-dimensional mudflow
sesses its situation and makes decisions on the basis of a set of rules.   model were used to provide the hazard posed to the modelled

https://doi.org/10.5194/nhess-21-21-2021                                               Nat. Hazards Earth Syst. Sci., 21, 21–37, 2021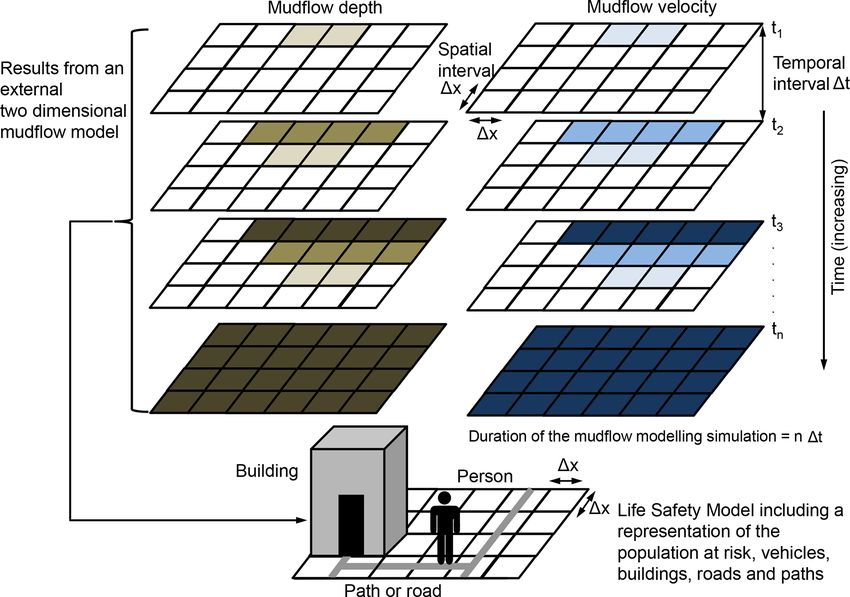
28                     D. Lumbroso et al.: Modelling the Brumadinho tailings dam failure and the subsequent loss of life

Figure 8. Location of buildings, safe locations and evacuation routes downstream of the Brumadinho tailings dams.

Figure 9. Schematic diagram showing how results from a two-dimensional fully hydrodynamic mudflow model are linked to the LSM.

agents (e.g. people, vehicles and buildings) in the LSM. Fig-          time step affects the loss of life and the evacuation times.
ure 9 shows how the results of the external hydraulic model            For this modelling a time step of 5 s was used. This is con-
are linked to the LSM.                                                 siderably smaller than the time step to meet the mudflow
   When developing the two-dimensional mudflow model                   modelling stability criteria; however, a time step that is too
and the LSM, both models need to be discretized at suitable,           large (e.g. 5 min) will result in people moving a large dis-
regular temporal (1t) and spatial intervals (1x), as shown             tance (e.g. ∼ 250 to ∼ 500 m on foot and several kilometres
in Fig. 9. This is because as the mudflow evolves, the in-             in a vehicle) during each temporal interval, thus escaping the
teraction of people and vehicles with the mudflow at each              advancing mudflow, which may not be the case if a shorter

Nat. Hazards Earth Syst. Sci., 21, 21–37, 2021                                           https://doi.org/10.5194/nhess-21-21-2021
D. Lumbroso et al.: Modelling the Brumadinho tailings dam failure and the subsequent loss of life                                29

Figure 10. An example of an output from the LSM emergency planning modelling 90 s after the Brumadinho tailings dam failure assuming
a warning is issued at the time of the breach.

time step is used. Similarly if the spatial discretization (1x)        Figure 10 shows an example of the output from one time
of the mudflow model is too large (e.g. > 15 m), then the ve-       step of the Brumadinho LSM modelling. Table 3 provides
locities and depths at each time step are averaged over a large     the results of the LSM modelling showing people’s differ-
area leading to a loss of resolution of the hazard, which also      ent states. Five scenarios were modelled, including the ac-
adversely impacts the accuracy of the results (Lumbroso and         tual event together with scenarios where warnings were ex-
Davison, 2018).                                                     actly at the point of failure and 5, 10 and 15 min before the
   Each person (i.e. agent) in the LSM can have six states as       dam failed. Animations of the LSM modelling for three of
follows:                                                            the modelled scenarios and some of the GIS (geographic in-
  – “unaware” – the person does not know that the mudflow           formation system) files used in the modelling are available
    is happening either because it has not reached them or          to download (see Lumbroso, 2020). Two methods of evacua-
    because they have not received a warning;                       tion were considered, (i) on foot only and (ii) a combination
                                                                    of vehicles and on foot.
  – “aware” – the person is conscious that the dam break has           The reported number of fatalities as a result of the Bru-
    occurred either because they have received a warning in         madinho tailings dam failure was probably between ∼ 270
    advance or the mudflow has reached them;                        and ∼ 310 (Mining Journal, 2020; Keaveny, 2019). The re-
  – “evacuating” – the person is making a conscious effort          sults of the LSM model indicated that with no warning there
    to reach safety (i.e. a defined location outside the area       would 456 fatalities out of the 502 people assumed to be at
    at risk) by a designated evacuation route;                      risk, a 91 % fatality rate; with a warning at the exact time the
                                                                    dam failed there would have been 354 fatalities. Figure 11
  – “safe” – the person has reached safety and is no longer         shows the distribution of the fatalities and the status of the
    at risk;                                                        people at risk for the representation of the January 2019 dis-
                                                                    aster with no warning. The diameter of each circle in Fig. 11
  – “injured” – the person has been knocked over by the
                                                                    is in proportion to the number of people at each of the spe-
    flow but is not fatally injured; however, they are immo-
                                                                    cific locations. The actual event is probably best represented
    bile;
                                                                    by a combination of a no-warning scenario on the mining
  – “deceased” – the person has died as a result of the mud-        site and a warning at the time of breach because the people
    flow.                                                           in the villages further downstream became aware of the dis-
Further details on the LSM model can be found in Lumbroso           aster without an official warning, and many of them escaped
and Davison (2018), Lumbroso et al. (2011), Di Mauro and            the mudflow. There is some indication from media that there
Lumbroso (2008), and Johnstone (2012).                              were between 5 and 20 deaths in the village of Parque da

https://doi.org/10.5194/nhess-21-21-2021                                        Nat. Hazards Earth Syst. Sci., 21, 21–37, 2021
30 D. Lumbroso et al.: Modelling the Brumadinho tailings dam failure and the subsequent loss of life
Figure 11. Results of the LSM modelling showing the distribution of modelled fatalities for the January 2019 incident.
Table 3. Results of the Life Safety Model (LSM).
Estimated number of
Estimated number of fatalities with people
fatalities with people escaping on foot and
escaping on foot only in vehicles
Mining Villages Total Mining Villages Total
Scenario modelled site site
No warning 382 74 456 382 74 456
Warning at the time of the breach 350 4 354 295 4 299
Warning 5 min before failure 256 0 256 186 0 186
Warning 10 min before failure 200 0 200 100 0 100
Warning 15 min before failure 0 0 0 0 0 0
Cacheira and evidence that 66 buildings were destroyed in emergency management interventions can make a significant
this location (Diario Do Nordeste, 2020; Terra, 2020). The difference in reducing the likely fatalities should the worst
LSM model indicated that there would be 42 fatalities with happen (Lumbroso and Davison, 2018). This information can
no warning in the village of Parque da Cacheira and that then be used to inform emergency plans to make them more
43 houses collapsed or were badly damaged. effective.
Producing “accurate” estimates of fatalities caused by tail- If a warning had been received at the exact time the dam
ings dam failures is challenging to achieve given the un- failed and assuming that people took 1 min to react and knew
certainty associated with natural variability, dependent on where to evacuate to, the number of fatalities could have been
chance (US Department of Homeland Security, 2011), to- reduced from a total of 456 to 354 or 299 depending on the
gether with the spatial location of people when the event oc- method via which people were assumed to have evacuated.
curs. In the case of the Brumadinho event there was only This is a reduction in the death toll of between 102 to 157. A
anecdotal evidence available with respect to the number of warning 5 min before the dam failed could have reduced the
mine workers in the canteen and other buildings, as well number of fatalities by between 200 and 270, and a warn-
as the number of people in houses downstream that were ing received 15 min before the failure could have reduced the
at risk. The value of using complex loss-of-life models is number of deaths to zero.
not to estimate the exact number of deaths but to assess if
Nat. Hazards Earth Syst. Sci., 21, 21–37, 2021 https://doi.org/10.5194/nhess-21-21-2021D. Lumbroso et al.: Modelling the Brumadinho tailings dam failure and the subsequent loss of life 31
Table 4. Results of the Life Safety Model (LSM) showing how the delay in response time affects the number of fatalities downstream of the
Brumadinho tailings dam assuming a warning is issued at the time of its failure.
Number of fatalities at different locations
Delay in Mining site Village of Unnamed Unnamed Village of
response and adjacent Córrego village 1 village 2 Parque da
time (min) houses do Feijão Cachoeira
0 346 0 0 0 0
1 354 0 0 0 0
2 363 0 0 0 0
5 390 2 4 0 0
10 390 2 4 14 0
15 390 2 4 18 0
30 390 2 4 18 0
45 390 2 4 18 0
60 390 2 4 18 16
75 390 2 4 18 18
The Brumadinho tailings dam was monitored using in situ richness in the data output from the LSM means that they can
instruments. Whether additional instrumentation of the dam help to inform and improve emergency plans.
could have provided a 15 min warning time is debatable.
However, Rotta et al. (2020) in a paper entitled “The Bru-
madinho tailings dam collapse: Possible cause and impacts 5 Discussion
of the worst human and environmental disaster in Brazil”
published in April 2020 found that “A time series analysis The probability of a tailings dam failing is relatively high
of satellite-driven soil moisture index showed that the wa- compared to other pieces of infrastructure that pose similar
ter accumulated over the Brumadinho dam surface during a risks to people and for which the consequences of a failure
protracted period increased its moisture contents and accel- are also high. In addition, even if there are no people directly
erated seepage erosion (piping) through the fill. We provide at risk, the pollutants released into the environment can have
solid evidence of the seepage erosion from the top through health implications for those living further downstream, as
the fill, which chronically weakened the structure and likely well as impact the environment and people’s livelihoods. For
led to the collapse of the dam”. Remote sensing data could example, in 1998 the failure of a tailings dam at Boliden
have potentially flagged up issues with the structure several Apirsa’s mine in southern Spain led to over 40 km river be-
weeks or even months in advance of the failure (see Lum- ing polluted and 2600 ha of agricultural land being covered
broso et al., 2019, 2020), allowing people to have been put with tailings (Emery, 2005). The lack of an emergency plan
on a high state of alert or to be moved out of the danger zone. addressing this particular situation meant that the clean-up
However, the main reason for running the LSM with a 15 min operation was not effective as it could have been because re-
warning time was to find the warning time required in order sponsibilities and objectives were established after the event
for there to be no fatalities. (Emery, 2005). The lack of a coherent plan led directly to
As part of the research a sensitivity analysis was under- five fatalities on public roads during the clean-up operation
taken of the time it takes people to respond to a warning. The (Emery, 2005).
results of this sensitivity analysis are shown in Table 4. Al- It is often not possible to reduce the risk posed by a tail-
though the results in Table 4 are intuitively obvious (i.e. the ings dam to zero. In many countries the philosophy adopted
longer it takes people to respond to a warning, the higher to risk is reducing risks to as low as reasonably practica-
the number of fatalities) they are useful to formulate emer- ble (ALARP). The ALARP principle is founded on the obli-
gency management plans. For example, people in the village gation of tailings dam owners to reduce risks to the point
of Parque da Cachoeira could have delayed their response for that additional risk reduction would “cost” “disproportion-
over 45 min after the dam had failed and avoided any fatali- ally” more than the risk reduction (i.e. benefit) achieved
ties. The number of people at risk in the village of Parque da (Bowles, 2003). To evaluate if the ALARP principle has been
Cachoeira is relatively low; however, there are many cases met for a tailings dam it is necessary to firstly quantify the
worldwide where there are tailings dams with a significant risk and then to assess any “physically possible” structural
number of people at risk living 5 to 10 km downstream. The or non-structural options that could further reduce the risk
(Bowles, 2003). The ALARP principle is an important con-
sideration in the US Bureau of Reclamation’s Public Protec-
https://doi.org/10.5194/nhess-21-21-2021 Nat. Hazards Earth Syst. Sci., 21, 21–37, 202132 D. Lumbroso et al.: Modelling the Brumadinho tailings dam failure and the subsequent loss of life
tion Guidelines (USBR, 2003) and an important factor in the – they make claims that the event being planned for is un-
UK’s Health and Safety Executive’s decision-making pro- derstood and can be controlled;
cess (HSE, 2001) with respect to societal risk.
Societal risk is defined as the relationship between fre- – there is a failure to consider human factors, for example
quency (or probability) of an event occurring and the num- how age, gender, culture, disability and socio-economic
ber of people suffering from a specified level of harm in a status affect people’s response to different emergencies;
given population from the realization of specified hazards
(Jones, 1992). The assessment of societal risk is concerned – the risks are not fully or sufficiently well assessed and
with the estimation of the probabilities of more than one in- described;
dividual being harmed simultaneously by an incident (HSE,
– the coherence of the organizational coordination and the
2009). Societal risk can be represented by “F –N curves”,
simplicity of society are often overstated;
which are plots of the cumulative frequency (F ) or probabil-
ity of various accident scenarios occurring against the num- – the plan describes a rational sequence of events during
ber (N) of fatalities associated with the modelled incidents a disaster which is not necessarily the case.
(HSE, 2009). Figure 12 shows four F –N curves for the ac-
ceptable societal risk for dam failures and major accidents in In November 2015 a tailings dam near the town of Bento Ro-
Australia, the UK and the USA. Given that the annual prob- drigues in the state of Minas Gerais in Brazil failed, releas-
ability of failure of a tailings dam is approximately 1 × 10⁻² ing more than 30×106 m3 of water and mine waste, killing
and that when these structures do fail they often lead to at 19 people and polluting water for hundreds of kilometres
least one direct or indirect fatality, it can be seen that the risks (Agurto-Detzel et al., 2016). An emergency plan had been
they pose to society are “unacceptable” and ”intolerable”. developed for the dam. However, the risks that were in-
Effective emergency plans can help to reduce the risks corporated in the plan were not sufficiently assessed. The
posed by tailings dam failures. The effectiveness of an emer- emergency plan for the dam, submitted to the Brazilian en-
gency plan depends on the scenarios studied and how well vironmental authorities, stated that in the event of a fail-
the plan is disseminated. Dam owners in Brazil are responsi- ure the mudflow would only reach the town of Bento Ro-
ble for preparing the emergency action plans; however, these drigues 2.5 km downstream of the dam (De Carvalho, 2019).
are often not checked by the relevant government authori- In reality the tailings released from the dam polluted some
ties (Sampaio, 2016). It is important that an emergency plan 700 km of watercourses downstream of the mine (De Car-
is based on evidence-based dam break scenarios and inun- valho, 2019).
dation maps of possible extents of the mudflow, as well as The production of ineffective emergency plans is not
the social, economic and environmental impacts (Sampaio, something that is unique to Brazil, as numerous disasters
2016). Plans need to be revised periodically, and procedures worldwide have shown. For emergency plans for tailings
should be established so that if a failure is likely to or has dams to be effective they need to be realistic and meaning-
occurred, a warning can be effectively disseminated to the ful to regulators and stakeholders. In preparing emergency
people affected and the area can be evacuated to minimize plans there is sometimes a philosophy of “this will never hap-
the number of victims. In Brazil a federal law related to emer- pen, so why do we need to care?”. This is especially true for
gency planning for dams only came into effect in 2010 (Sam- events that are perceived to have a low probability of occur-
paio, 2016). This law established a National Dam Safety Pol- rence. This can lead to some organizations suffering from a
icy and created the National Dam Safety Information System “it can’t happen here” mentality (McConnell and Drennan,
(Sampaio, 2016). Tailings dam owners in Brazil have to pro- 2006) and for the “worst-case scenarios” not to be consid-
duce an Emergency Action Plan for each of their dams (Sam- ered because they are perceived to be purely “hypothetical”
paio, 2016). (Clarke, 2006). However, things that have never happened
There is a real danger that emergency plans for tail- before happen all the time (Sagan, 1993).
ings dams are not realistic or effective. In his book Mis- Research has found that in France and the UK tools to as-
sion improbable: Using fantasy documents to tame disasters, sess evacuation times and loss of life for floods appear to
Lee Clarke points out that for many emergency planners, it be rarely used by emergency planners (Lumbroso and Vinet,
can be easier to produce symbolic, “fantasy” documents than 2012). This means that these risks and the way they can be
to engage in forthright admissions of the real dangers and the reduced are rarely evaluated in a quantitative manner using
uncertainties that they create (Clarke, 1999). Fantasy emer- a phenological, rather than empirical, approach that provides
gency planning documents are characterized by the follow- a transparent basis for making and interpreting the various
ing: outcomes. In Brazil and in many other countries emergency
plans for tailings dam are often not a high priority. The inad-
– they make statements or promises which will never be equate planning for the 2015 Bento Rodrigues tailings dam
fulfilled; disaster, included the absence of response planning and the
lack of an effective alarm system, as well as no quantitative or
Nat. Hazards Earth Syst. Sci., 21, 21–37, 2021 https://doi.org/10.5194/nhess-21-21-2021D. Lumbroso et al.: Modelling the Brumadinho tailings dam failure and the subsequent loss of life 33 Figure 12. Graphs showing the acceptable risk in terms of the annual probability of failure and loss of life for dams in Australia and the USA and major hazards in the UK (sources: ANCOLD, 2003; HSE, 2001; NSW Department of Planning, 2011; USACE, 2011). qualitative description of the worst-case scenarios (De Car- mental damage; 3. Cost of physical damage; and 4. Social valho, 2019). In Brazil there has been a lack of clarity about impact including public perception” (ICOLD, 2011). the minimum contents required for emergency plans, and The employment of models of breach, inundation and rather than being an essential tool for risk management and agent-based risk to people (i.e. the Life Safety Model – LSM) response planning they end up being “a mere bureaucratic allow for the risks to people from tailings dam failures to formality” (De Carvalho, 2019). be quantified and, more importantly, strategies for reducing The level of detail and aspects addressed in an emer- this risk to be evaluated in an evidence-based manner. Work gency plan for a tailings dam need to be commensurate with on tsunamis has shown that, despite the short lead time for the potential consequences if an emergency occurs. For tail- a near-field tsunami, there is still value in providing rapid ings dams with potentially large consequences, such as ones warnings to the people at risk providing that people know constructed using the upstream method, the risks should be where to evacuate to (National Research Council, 2011), and comprehensively assessed in a transparent manner via active these are useful for saving lives. This research has shown that engagement with the potentially affected stakeholders. The this is also the case for tailings dam. ICOLD Bulletin 139 on improving the safety of tailings dams The sirens designed to warn nearby communities and states that the “the consequential damage from a tailings dam workers of any problems with the Brumadinho dam did not failure [should be] generally assessed in terms of its potential sound. However, if they had sounded as the dam failed, this effect on the four categories of: 1. Loss of life; 2. Environ- research has shown that even a warning just as the dam was https://doi.org/10.5194/nhess-21-21-2021 Nat. Hazards Earth Syst. Sci., 21, 21–37, 2021
34                    D. Lumbroso et al.: Modelling the Brumadinho tailings dam failure and the subsequent loss of life

failing could have saved between 100 and 150 lives. On the        be used to gain a better understanding of how the dangers
morning of 27 January 2019, 2 d after the disaster, sirens        posed by these facilities to downstream communities can be
were sounded at the site because there were concerns regard-      reduced.
ing the stability of Dam VI (location B in Fig. 4), a process
water reservoir, adjacent to the structure which had failed,
owing to the detection of increased water levels. As a result     Data availability. Animations of the LSM and mudflow modelling
of the risk posed by this structure, approximately 24 000 res-    outputs, together with GIS files of the mudflow extent and files used
idents downstream of the site were successfully evacuated         in the LSM modelling such as roads and building locations can
(Vale, 2020). There is a large body of evidence showing that      be downloaded from https://doi.org/10.5281/zenodo.3872788 (see
                                                                  Lumbroso, 2020).
sirens are an effective method of warning of possible dam
failures provided that they are tested regularly, that the test
soundings are different from the emergency signal and that
                                                                  Supplement. The supplement related to this article is available on-
people know where to evacuate to when they hear them (Gra-        line at: https://doi.org/10.5194/nhess-21-21-2021-supplement.
ham, 2008; Tudor et al., 2012).

                                                                  Author contributions. All authors contributed to the research car-
6    Conclusions and recommendations                              ried out as part of this study. MD developed and ran the Life Safety
                                                                  Model. RB developed and ran the mudflow model. GP provided ad-
For emergency plans to be effective it is important that they     vice on tailings dam breaching and ran the EMBREA-MUD model.
incorporate foresight about the changing nature of risk and       DL co-ordinated the research, provided advice on loss-of-life and
facilitate evidence-based action, before people are harmed.       hydraulic modelling, and wrote the text.
There have been a number of models and frameworks devel-
oped (see Tagg et al., 2012) that can be employed to esti-
mate risks to people from dam failures. For example, there        Competing interests. The authors declare that they have no conflict
are some simple, empirically based equations which allow          of interest.
elementary estimates of the risks to people from tailings dam
failures to be made. Although these equations may be suit-
able for simple risk-screening exercises, they do not provide     Acknowledgements. The authors would like to acknowledge the
                                                                  Satellite Applications Catapult in the UK and the UK Space
the ability to model each individual person, how they inter-
                                                                  Agency’s International Partnership Programme for supporting this
act with the mudflow and the effects of measures such as          work.
improvements in early warnings, as well as improvements
to evacuation routes. Agent-based models, such as the LSM,
provide the ability to simulate each person, building and ve-     Review statement. This paper was edited by Paolo Tarolli and re-
hicle at risk and their interaction with the mudflow based on     viewed by Derek Sakamoto, Bruce Feinberg, and Carlos Anto-
fundamental physical equations. Often agent-based models          nio da Silva Junior.
are seen by government regulators and mine owners as be-
ing “expensive” to implement compared to simple empiri-
cal methods. However, agent-based models can be an effec-
tive tool in helping to reduce the loss of life and injuries to   References
people caused by tailings dams by making evidence-based           Agurto-Detzel, H., Bianchi, M., Assumpção, M., Schimmel, M.,
contributions to emergency plans, especially with respect to        Collaço, B., Ciardelli, C., Barbosa, J. R., and Calhau, J.: The tail-
evacuation planning and risk management. The LSM agent-             ings dam failure of 5 November 2015 in South-East Brazil and
based model provides a useful tool via which this can be            its preceding seismic sequence, Geophys. Res. Lett., 43, 4929–
done and provides an evidence-based way of exploring ways           4936, https://doi.org/10.1002/2016GL069257, 2016.
of reducing risks to people and improving emergency plan-         ANCOLD – Australian National Committee On Large Dams:
ning. Recent tailings dam tragedies, such as Brumadinho,            Guidelines on risk assessment, published by the Australian Na-
have prompted institutional investors active in extractive in-      tional Committee on Large Dams, Tatura, Victoria, Australia,
dustries, including major asset owners and asset managers,          2003.
                                                                  Assaf, H. and Hartford, D. N. D.: Physically-based modelling of
to call for an improvement in the safety of tailings dams
                                                                    life safety considerations in water resource decision-making,
(Church of England, 2020). As part of a review, led by insti-       World Water and Environmental Resources Congress, 20 to
tutional investors, a new independent and publicly accessible       24 May 2001, The Rosen Plaza Hotel, Orlando, Florida, USA,
international standard for tailings dams, based upon the con-       2001.
sequences of failure, has been called for (Church of England,     Azam, S. and Li, Q.: Tailings dam failures: A review of the last
2020). In the future, for high-risk tailings dams, it is recom-     one hundred years, Geotechnical News, December 2010, 50–53,
mended that agent-based models, such as the LSM, should             available at: http://ksmproject.com/wp-content/uploads/2017/

Nat. Hazards Earth Syst. Sci., 21, 21–37, 2021                                        https://doi.org/10.5194/nhess-21-21-2021
D. Lumbroso et al.: Modelling the Brumadinho tailings dam failure and the subsequent loss of life 35 08/Tailings-Dam-Failures-Last-100-years-Azam2010.pdf (last Graham, W. J.: The Teton Dam failure – An effective warning and access: 27 March 2020), 2010. evacuation, 2008 available at: https://www.google.com/search? Bingham, E. C.: An investigation of the laws of plas- q=TheTetonDamfailure-Aneffectivewarningandevacuation& tic flow, Bull. Bureau Standard., 13, 309–353, cad=h&safe=active&ssui=on# (last access: 3 September 2020), https://doi.org/10.6028/bulletin.304, 1916. 2008. Bowker, L. N. and Chambers, D. M.: In the dark shadow HSE – Health and Safety Executive: Reducing risks, protecting of the supercycle tailings failure risk and public li- people: HSE’s decision-making process, Risk Assessment Pol- ability reach all-time highs, Environments 4, 75, icy Unit, HSE Books, Her Majesty’s Stationery Office, London, https://doi.org/10.3390/environments4040075, 2017. UK, 2001. Bowles, D.: ALARP evaluation: Using cost effectiveness and dis- HSE – Health and Safety Executive: Societal risk: Initial briefing proportionality to justify risk reduction, Proceedings of the to Societal Risk Technical Advisory Group, published by Her Australian Committee on Large Dams Risk Workshop, Octo- Majesty’s Stationery Office, Norwich, UK, 2009. ber 2003, Launceston, Tasmania, Australia, 2003. ICOLD – International Commission On Large Dams: Bul- Chow, V. T.: Open-channel hydraulics, McGraw-Hill, New York, letin 121: Tailings dams: Risk of dangerous occurrences, lessons USA, 1959. learnt from practical experiences, United Nations Environmen- Church of England: Investor mining and tailings safety ini- tal Programme (UNEP), Division of Technology, Industry and tiative, 2020, available at: https://www.churchofengland.org/ Economics (DTIE) and International Commission on Large investor-mining-tailings-safety-initiative last access: 10 Novem- Dams (ICOLD), Paris, France, 2001. ber 2020. ICOLD – International Commission On Large Dams: Bulletin 139: Clarke, L. Mission improbable: Using fantasy documents to tame Improving tailings dam safety – Critical aspects of management, disasters, published by the University of Chicago Press, Chicago, design, operation and closure, ICOLD, Paris, France, 2011. USA, 1999. Jeyapalan, J. K., Duncan, J. M., and Seed, H. B.: Analyses of flow Clarke, L.: Worst cases: Terror and catastrophe in the popular imag- failures of mine tailings dams. J. Geotech. Eng.-ASCE, 109, ination, published by the University of Chicago Press, Chicago, 150–171, 1983. USA, 2006. Johnstone, W. M.: Life safety modelling framework and perfor- De Blasio, F. V.: An introduction to the physics of landslides: Lec- mance measures to assess community protection systems: Appli- ture notes on the dynamics of mass wasting, Springer, Dordrecht, cation to tsunami emergency preparedness and dam safety man- the Netherlands, ISBN 978-94-007-1121-1, 2011. agement, Doctor of Philosophy, University of British Columbia, De Carvalho, D. W.: The ore tailings dam rupture disaster in Mari- British Columbia, Canada, October 2012. ana, Brazil 2015: What we have to learn from anthropogenic dis- Johnstone, W. M. and Garrett, M.: Return to Malpasset: Using the asters, Nat. Resour. J., 59, available at: https://digitalrepository. Life Safety Model to assess the effectiveness of community evac- unm.edu/nrj/vol59/iss2/5 (last access: 4 January 2021), 2019. uation plans, in: ASDSO Annual Conference, 21–24 Septem- Diario Do Nordeste: Um ano após catástrofe, Bru- ber 2014, San Diego, USA, 2014. madinho segue paralisada, available at: https:// Jones, D.: Nomenclature for hazard and risk assessment in diariodonordeste.verdesmares.com.br/editorias/pais/online/ the process industries, 2nd Edn., IChemE, Rugby, UK, um-ano-apos-catastrofe-brumadinho-segue-paralisada-1. ISBN 9780852952979, 1992. 2201581, last access: 22 April 2020. Keaveny, P.: Brumadinho dam collapse: Mining indus- Di Mauro, M. and Lumbroso, D.: Hydrodynamic and loss of life try needs radical change to avoid future disasters, modelling for the 1953 Canvey Island flood, Flood Risk Manage- 8 March 2019, The Conversation, 2019, available at: ment, Proceedings of FLOODrisk, Oxford University, Oxford, https://theconversation.com/brumadinho-dam-collapse-mining- UK, 2008. industry-needs-radical- (last access 8 April 2020), 2019. Downing, T. E.: Does the Kosovo Power Project’s proposed Kossoff, D., Dubbin, W. E., Alfredsson, M., Edwards, S. J., Mack- forced displacement of Kosovars comply with international lin, M. G., and Hudons-Edwards, K. A.: Mine tailings dams: involuntary resettlement standards?, The Kosovo Civil So- characteristics, failure, environmental impacts and remediation, ciety Consortium for Sustainable Development, available Appl. Geochem., 51, 229–245, 2014. at: https://www.researchgate.net/publication/309285168_ Lumbroso, D.: Brumadinho tailings dam, Brazil model animations Does_the_Kosovo_Power_Project’s_Proposed_Forced_ of mudflow and risk to people plus GIS files, Version 1, Zenodo, Displacement_of_Kosovars_Comply_with_International_ https://doi.org/10.5281/zenodo.3872788, 2020. Involuntary_Resettlement_Standards (last access: 4 Jan- Lumbroso, D. and Davison, M.: Use of an agent-based model and uary 2021), 2014. Monte Carlo analysis to estimate the effectiveness of emergency Emery, A.: Good practice in emergency prepared- management interventions to reduce loss of life during extreme ness and response, International Council on Min- floods, J. Flood Risk Manage., 11, S419–S433, 2018. ing and Minerals, available at: https://www.icmm. Lumbroso, D. and Di Mauro, M. Recent developments in loss of life com/website/publications/pdfs/health-and-safety/ and evacuation modelling for flood event management in the UK, good-practice-emergency-preparedness-and-response (last in: International Conference on Flood Recovery, Innovation and access: 4 January 2021), September 2005. Response (FRIAR), 2–3 July 2008, London, UK, 2008. Graham, W. J.: A procedure for estimating loss of life caused by Lumbroso, D. and Vinet, F.: Tools to improve the production of dam failure DSO-99-06, US Department of Interior Bureau of emergency plans for floods: are they being used by the people Reclamation Dam Safety Office Denver, Colorado, USA, 1999. that need them?, J. Contingen. Cris. Manage., 20, 149–165, 2012. https://doi.org/10.5194/nhess-21-21-2021 Nat. Hazards Earth Syst. Sci., 21, 21–37, 2021
You can also read