Identifying Spatial Relationships between Built Heritage Resources and Short-Term Rentals before the Covid-19 Pandemic: Exploratory Perspectives ...
←
→
Page content transcription
If your browser does not render page correctly, please read the page content below
sustainability

Article
Identifying Spatial Relationships between Built
Heritage Resources and Short-Term Rentals before
the Covid-19 Pandemic: Exploratory Perspectives on
Sustainability Issues
Irene Rubino * , Cristina Coscia               and Rocco Curto
 Department of Architecture and Design, Politecnico di Torino, 10125 Torino, Italy; cristina.coscia@polito.it (C.C.);
 rocco.curto@polito.it (R.C.)
 * Correspondence: irene.rubino@polito.it

 Received: 21 March 2020; Accepted: 29 May 2020; Published: 3 June 2020

 Abstract: Built heritage resources (BHRs) are multidimensional assets that need to be conceived under
 a sustainability and circular economy framework. Whereas it is essential that their conservation,
 management, and enjoyment are sustainable, it is also necessary that the environmental, cultural,
 and socio-economic contexts in which they are integrated are sustainable too. Like other amenities,
 BHRs can improve the quality of the urban environment and generate externalities; additionally,
 they may influence sectors such as real estate, hospitality, and tourism. In this framework,
 this contribution aims to identify spatial relationships occurring between BHRs and short-term
 rentals (STRs), i.e., a recent economic phenomenon facilitated by platforms such as Airbnb. Through
 the application of Exploratory Spatial Data Analysis techniques and taking Turin (Italy) as a case
 study, this article provides evidence that spatial correlation patterns between BHRs and STRs exist,
 and that the areas most affected by STRs are the residential neighborhoods located in the proximity of
 the historic center of the city. Relations with other sets of socio-economic variables are highlighted
 too, and conclusions suggest that future studies are essential not only to monitor sustainability issues
 and reflect on new housing models and sustainable uses of buildings, but also to understand the
 evolution of the phenomenon in light of the pandemic Covid-19.

 Keywords: sustainability; built heritage; spatial analysis; GIS; life cycle; Airbnb; short-term
 rentals; Covid-19

1. Introduction
     Built heritage resources can be considered as cultural, social, as well as economic assets. If their
existence firstly depends on the intrinsic values that are attributed to them by individuals and
communities [1–3], the current socio-economic conditions require that the maintenance, management,
and use of these resources be performed in light of the multidimensional sustainability and circular
economy frameworks [4–11]. This implies that actions regarding built heritage should pursue not only
specific objectives (e.g., restoration, re-use, valorization, etc.) but also environmental, economic, cultural,
and social sustainability. Overall, these dimensions should not be considered as separate, but rather
as intertwined and sometimes even reciprocally influencing: For instance, retrofit interventions can
in some cases facilitate environmental and economic sustainability [12,13], but also extend the life
cycle and usability of the buildings, generally increasing their multidimensional and long-term value
for society.
     Given that monuments, historical buildings, and other architectural entities with cultural
significance are usually not excludible, at least for their exterior components, and they are thus

Sustainability 2020, 12, 4533; doi:10.3390/su12114533                            www.mdpi.com/journal/sustainability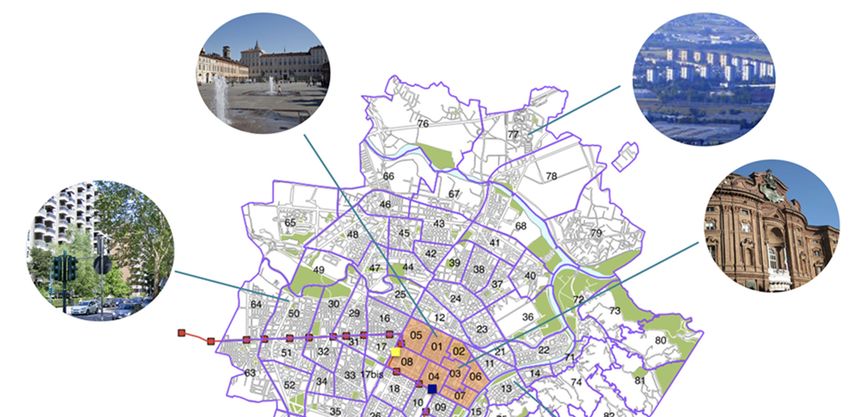
Sustainability 2020, 12, 4533                                                                         2 of 22

particularly likely to generate externalities [14,15], it is then also necessary to evaluate whether
the socio-economic contexts directly or indirectly enabled by built heritage are overall sustainable.
If, on the one hand, the presence of built heritage can function as a driver for the economy and
particularly stimulate tourism [16], on the other one, it is known that over-tourism may lead to
negative consequences, such as displacement of inhabitants, alteration of the social fabric, decrease
of the quality of life of residents, loss of authenticity, and also damage to local resources [17–20].
These positive and negative phenomena are related to the role played by built heritage, especially
in urban contexts: In fact, it has been widely acknowledged that built heritage resources frequently
represent urban amenities able to contribute to the quality of the environment and to the appeal of
an urban area [21]. Additionally, these resources may also have the power to attract other facilities
such as restaurants, cafés, and shops, as well as high-skilled, high-income workers and professionals;
possible consequences might be constituted by knowledge-led spillover effects [22], but also by social
segregation problems [23,24] and increase of real estate prices [25].
     With reference to the tourism sector, academics have pointed out that the location of built heritage
resources and of urban amenities in general affects where hotels are positioned too [26]. Two traditional
interpretative approaches are, for instance, the tourist-historic city model and mono-centric models.
The former was developed with special regard to medium-sized Western European provincial
towns, and it identifies proximity to the business district or to the historic city center as particularly
appealing for both the offer and demand side [27]. The latter—in line with a traditional vision
of “monocentrality”—describes the city in simplified terms, i.e., as formed by concentric rings,
where distance from the city center determines values and land-use patterns. The theory underpinning
this model is the bid rent theory, i.e., a geographic economic theory assuming that people compete
for using the land close to the city center/to the central business district, since it is easily accessible,
it presents a high density of potential customers, and thus results in being more profitable. In the
case of hotels, it is assumed that customers (and especially tourists) are open to pay more for easy
access to the city center, and that consequently, hotels prefer to locate near the center in order to
obtain higher revenues. More articulated perspectives have then recognized that contemporary cities
actually present multiple nodes: In this case too, built heritage resources may function as one of the
points of attraction and influence hotel location [26]. However, it must be mentioned that a key role in
determining hotel location is also played by the presence of public transports and of other facilities that
enable a convenient mobility towards the city and throughout the city itself. In this perspective, areas
that are well and easily connected with desired urban destinations (e.g., neighborhoods characterized
by urban quality thanks to the presence of built heritage resources) may become desirable hospitality
venues for urban tourists too.
     With the spread of digitally-mediated peer-to-peer accommodation systems—such as the leading
Airbnb (www.airbnb.com)—another accommodation domain that can be affected by the location of built
heritage resources and urban amenities is the one of short-term rentals. Peer-to-peer online platforms
have in fact facilitated the encounter of hosts (i.e., people willing to temporarily rent their real-estate
property or sub-portions of the unit) and guests (i.e., people seeking a short-term accommodation
in private houses), greatly contributing to the expansion of the short-term rental market [28,29].
News and academic contributions have recently highlighted that this exponential growth is leading to
unsustainable phenomena: With reference to the European urban context, the situation in tourism
capital cities such as Lisbon, Madrid, Barcelona, Amsterdam, Florence, Venice, and others is actually
contributing to the pressure on historic city centers, fostering alteration of the local social fabric,
displacement of residents, and stress on local resources [30–38].
     In light of this framework, this piece of research aims to shed light on possible spatial relationships
occurring between short-term rentals and built heritage resources, taking the city of Turin (Italy) as a case
study. Through the elaboration of choropleth maps and the application of ESDA—Exploratory Spatial
Data Analysis techniques [39], the study intends to interpret in both qualitative and mathematical
terms the distribution of short-term rentals in Turin, making reference to a time frame prior to the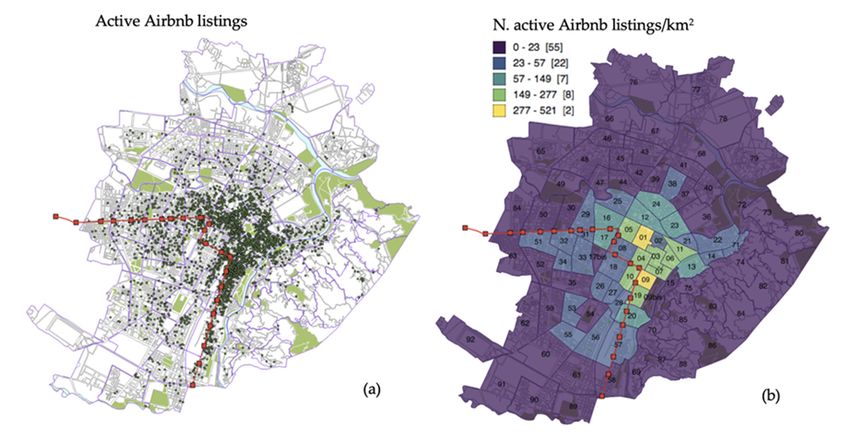
Sustainability 2020, 12, 4533                                                                            3 of 22

spread of the Covid-19 pandemic; in this process, socio-economic variables and the presence of built
heritage resources are taken into account. Overall, the goal of the study is to investigate whether
patterns of spatial proximity between built heritage resources and short-term rentals also exist in a
city that is not a tourism capital (such as Barcelona, Amsterdam, etc.) but that has actually started
to affirm itself as a tourist destination since the 2006 Winter Olympic Games [40–42]. Results do not
have relevance only for this specific reality, since they contribute to the overall debate on short-term
rentals and sustainability. In fact, even though results stemming from the exploration and analysis of
geographic data should be considered as descriptive of the specific area under study [43] (p. 336) and
generalizations should thus not be made, the replication of the study in different study-areas could
nonetheless help researchers find differences and similarities among cities, supporting them in the
potential elaboration of more general principles and tendencies.
      The rest of the article is structured in the following way. Section 2 provides greater insight on
the literature exploring the location of Airbnb listings in relation to historic centers; additionally,
it introduces the main characteristics of Turin (Italy), making brief reference to local built heritage
resources, tourism trends, socio-economic characteristics, and real estate features. Section 3 describes
materials and methods, paying particular attention to data sources, data processing, and Exploratory
Spatial Data Analysis techniques. Section 4 illustrates and discusses the main results of the research.
Section 5 presents final remarks, identifies the limits of the study, and suggests future steps of research,
also in light of the pandemic Covid-19.

2. Background

2.1. Short-Term Rentals and Historic Centres
      Airbnb is a digitally-enabled peer-to-peer accommodation system which facilitates the contact
between hosts (i.e., people willing to temporarily rent their real-estate property or sub-portions of
a housing unit) and guests (i.e., people seeking for a short-term accommodation in private houses).
Since its rise in 2008, this service has experienced a tremendous growth [44]: According to official
figures, in the first months of 2020, more than 7 million listings were present on the platform, with an
average number of guests per night exceeding 2 million [45]. According to the same sources, listings are
distributed over more than 220 countries and 100,000 cities worldwide [45]. Even though short-term
rentals are found in different contexts (e.g., seaside areas, mountain and lake regions, etc.), it is possible
to state that this phenomenon has greatly interested cities and urban realms in general. The reasons
behind this spread are various and are related both to global and local socio-economic trends (e.g., new
behavioral and consumption patterns, transformations concerning mobility, housing habits and real
estate investments, new uses of the urban environment, etc.). Among the variety of factors that have
facilitated the spread of this reality, it is possible to mention at least two of them. Firstly, the increase of
short-term rentals in cities can be ascribed to the extensive growth of urban tourism: In fact, tourist
flows have generally increased in recent years, and some studies focusing on Italian main tourist cities
have highlighted that a positive relationship exists between the number of Airbnb listings in a given
year and the number of tourists registered in the previous year [35]. Secondly, short-term rentals are
more profitable for owners than long-term rentals [46–49], especially during peak seasons and given a
minimum level of demand.
      Given the interrelation of short-term rentals with the tourism, hospitality, real estate, and social
domains, the Airbnb phenomenon has recently started to be analyzed by different perspectives,
such as—for instance—competition with the more traditional hotel sector [50,51], influence on the
rental and real estate markets [52–54], socio-economic issues [38,55], market segmentation and users’
profiling [56], guests’ preferences and opinions [57–59], and regulations and legal aspects [60,61]. In this
framework, the analysis of listings’ location in tourism destinations is currently acquiring increasing
importance. Even though peer-to-peer accommodation systems introduce themselves as sharing
economy platforms favoring the discovery and the economic development of urban portions usually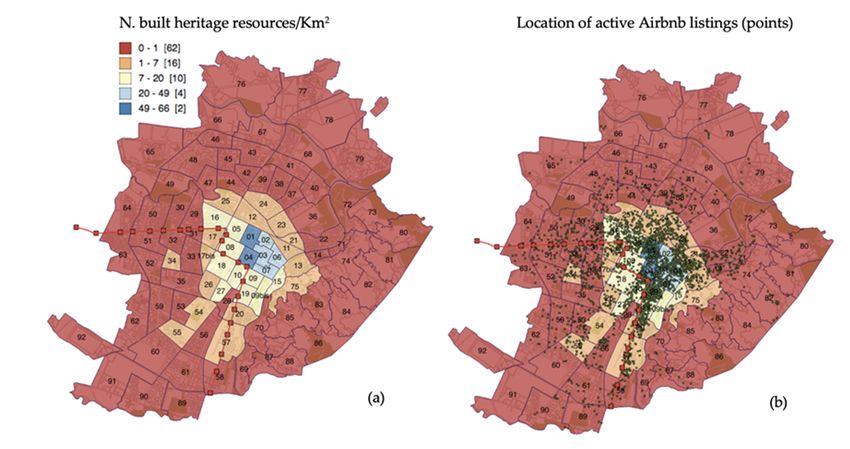
Sustainability 2020, 12, 4533                                                                        4 of 22

out of tourists’ most beaten tracks, recent empirical evidence concerning European tourism capitals
suggests that these digital intermediaries may actually favor central areas, contributing to challenge
the carrying capacity of these spots and to make permanent residency unaffordable and difficult.
Some empirical examples have emerged throughout the years directly from the news. For instance,
in Barcelona (Spain) residents have protested against the uncontrolled rise of tourists favored by digital
platforms such as Airbnb [32]; in Venice (Italy), short-term rentals have been interpreted by residents
as a phenomenon contributing to the touristification of the city, and the excessive tourist pressure
has led to the banning of new accommodations in historic areas [32,33]; in Amsterdam (Netherlands),
Airbnb and other platforms are bringing more and more tourists right into the central areas of its urban
realm [37], and the spread of short-term rentals has recently induced the local Municipality to identify
policies to limit the phenomenon, including the banning of buy-to-rent behaviors [30]. In general
terms, location near the most central and/or attractive areas of the city can represent an important
competitive advantage, since it is known that tourists prefer to stay in areas located at walking distance
from the desired points of attraction [34,62]. As a consequence, the presence of Airbnb accommodation
in residential areas conveniently located near historic centers could induce tourists to stay right in
those zones, with possible consequences on local socio-economic sustainability.
      Given this trend, the academic literature as well has recently started to investigate this reality,
paying particular attention to the spatial distribution of accommodations. In London (UK), Airbnb
listings have been mainly concentrated in central areas, even though their location can spread up to
16 Km [36]. In Paris (France)—where the largest amount of Airbnb listings can be found—short-term
rentals interest a great part of the city, but scholars have nevertheless noted that they are particularly
located in district 18 (Montmartre) and 11 (Nation) [63]. In qualitative terms, it can be added that
both districts are positioned on the Rive Droite, they are characterized by different points of interest
(e.g., Montmartre cemetery, Moulin Rouge, Place de la Bastille, historical churches . . . ), and present
among the highest population densities of the city. On the basis of maps reported for Madrid [31],
short-term rentals seem to be present especially in areas located on a central North-South axis. Then,
at least up to 2016, Berlin’s Airbnb listings were mainly located in inner-city neighborhoods [53].
High concentrations of short-term rentals either in central areas or in their immediate vicinity were
found, for instance, also in Hamburg (Germany) [64], Warsaw (Poland) [65], Valencia (Spain) [55],
and Florence (Italy) [35]. With reference to other Italian cities, a more scattered distribution emerged
in Milan [35], whereas Rome presented a mixed model [35]. In Budapest (Hungary), short-term
rentals were found in correspondence of areas characterized by tourist attractiveness and services [66].
Finally, a study focusing on Barcelona (Spain) analyzed the distribution of short-term rentals in relation
with the location of points of interest favored by tourists; this last piece of research interestingly
highlighted that Airbnb listings mainly followed a concentric scheme around the central hub of the
city (i.e., Plaza de Cataluña) [34].
      If discourses generally referring to historic and city centers have overall started to appear not
only in the news but also in the academic literature, structured reflections specifically considering built
heritage resources are nonetheless lacking. As a consequence, they will be specifically addressed in
this study, with empirical reference to the city of Turin (Italy). As thoroughly described in Section 3,
the methods adopted to perform the analyses will include ESDA techniques, coherently with the
approaches experimented by other authors [31,34,67].

2.2. The City of Turin (Italy) As a Case-Study
    Turin is a city located in the North-West of Italy, spreading over a surface of around 130 square
kilometers [68] and counting—on 1st January 2018—a population of 882,523 inhabitants [69].
Once a typical one-company town related to the automotive sector, the city has started to significantly
appear among tourist destinations since 2006, when it hosted the XX Winter Olympic Games [40–42].
Coherently with the general increased attractiveness of urban contexts and thanks to the restoration
works, cultural initiatives, and infrastructure interventions that have taken place since the 2000s,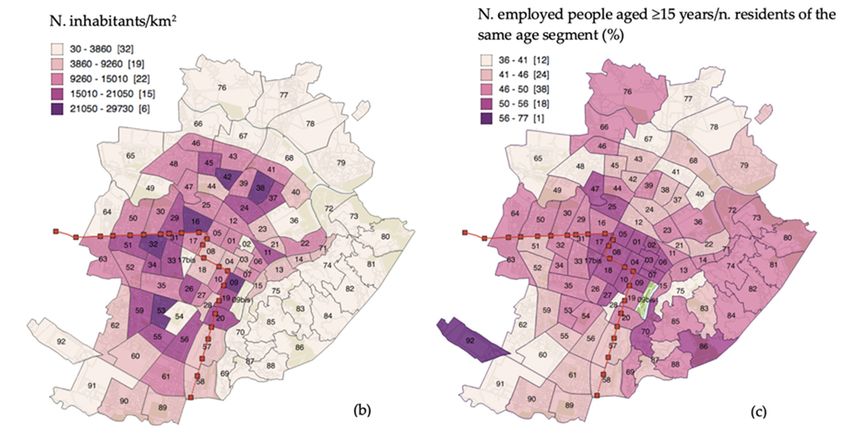
Sustainability 2020, 12, 4533                                                                           5 of 22

the city has experienced a progressive growth in the number of tourists visiting it: For instance,
the number of arrivals from 2002 to 2017 has more than doubled, shifting from 574,078 to 1,263,290 in
2017 [70]. Even though Turin is now trying to diversify its offer (e.g., through fairs, performing arts
festivals, its wine and gastronomic scenery, and so on), museums, built heritage resources, and its
contemporary art brand have greatly contributed to its allure so far. The built heritage of the city
is varied, and it includes archaeological relics and ancient buildings dating back to Roman times,
some Medieval and Renaissance remains, religious, civil and royal buildings belonging to the Baroque
period (17th–18th centuries), as well as examples of modern and contemporary architecture. Relevant
heritage sites and buildings are to some extent scattered throughout the city, but they are mostly
concentrated in central areas. This is coherent with the extension of the CHUZ—Central Historic
Urban Zone (ZUCS-Zona Urbana Centrale Storica in Italian) defined by the general regulatory plan of
Turin and basically corresponding to the statistical zones (i.e., sub-portions of the city serving statistical
purposes) numbers 01, 02, 03, 04, 05, 06, 07, and 08 (see Appendix A for the complete nomenclature
of the 94 statistical zones existing in the city). Figure 1a outlines the extension of the CHUZ, making
reference to relevant statistical zones (SZs). The CHUZ particularly includes the so called “Roman
Quadrilateral”—i.e., the part of the city that was settled in Roman times and that presents a particularly
intense continuity of life and settlement—the urban form mainly resulting from the interventions
implemented in the Baroque period and some urban spaces defined in the 19th century. Overall, it is
agreed that in the case of Turin, the value brought by architecture stems from the complexity of the
historical process and consequently not only from the quality of the building types, but also from
their variety [71] (p. 31). As pointed out by scholars, the present image of Turin is also due to the
regulations progressively implemented by the Municipality, which—at least up to the 1930s—has
fostered the development of a city with homogeneous characteristics, especially with regard to the
shape and volumes of the buildings, the design of the façades, the building materials, and the colors
and the decorations [71,72]. The contribution of architecture to the appeal of the city has been also
confirmed by surveys [73]: In fact, visitors tend to visit Turin to generally explore the city and perform
sightseeing, in line with what suggested by the literature on urban tourism [16].
      In order to better contextualize the CHUZ, it must be mentioned that, at present, its attractiveness
is increased by a high density of museums, shops, cafés, and restaurants. More specifically,
the neighborhoods in the proximity of the “Roman Quadrilateral” have been interested by a
gentrification process, and they are now one the favorite spots of the local nightlife scenery [74,75], as is
the San Salvario area (SZ 09) [76]. As evidenced by the research group of the Polytechnic of Turin who
is studying the relationships occurring between the local real estate market and the socio-economic
characteristics of the city by the means of spatial statistics [77–79], these SZs are overall characterized
by a certain degree of urban vibrancy, together with other SZs especially located in the central historical
areas and along the route of the underground [79].
      From a socio-economic perspective, central areas tend to be characterized by moderate population
density values (also in light of the public nature of some buildings and open spaces existing in
these zones), high employment rates, and high education levels [80]. The northern part is the most
vulnerable from a socio-economic point of view: It shows the greatest incidence of foreign residents, it is
characterized by lower education and employment levels, and it also manifests signs of vulnerability
for what concerns the conditions of the building stock [77,78]. With specific reference to this one, it is
possible to add that some of the northern and southern areas are still occupied by active or inactive
industrial buildings, whereas the western and central zones are particularly devoted to residential
and service functions. Coherently with urban stratification processes and the development of the
city, the main construction period of the buildings located in central areas is antecedent to 1918,
as clearly evidenced and mapped in other contributions [81]. Additionally, central zones present an
extremely low percentage of buildings constructed during the building quantitative expansion of the
1950–1970s [77]; the highest percentages are found in some semi-peripherical and peripherical SZs
located in the northern, southern, and western parts of the city instead, as highlighted and graphically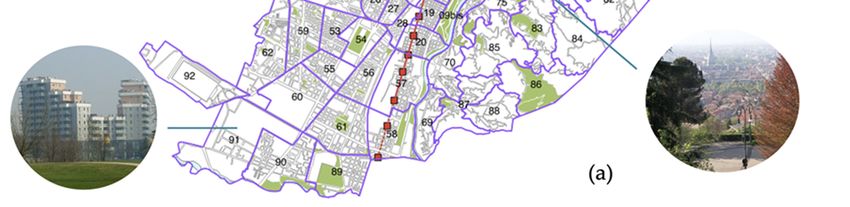
Sustainability 2020, 12, 4533 6 of 22
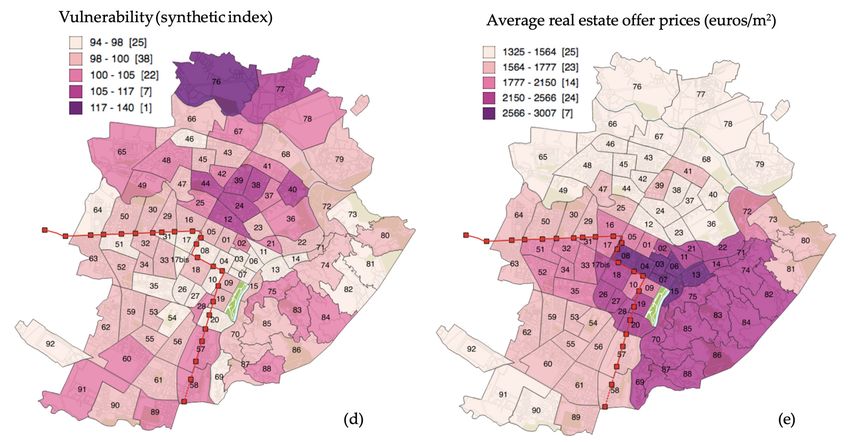
mapped in articles specifically devoted to the topic [77]. Figure 1 shows the main characteristics of
the areas; (a) illustrates the subdivision of the Municipality in 94 SZs, highlighting the CHUZ; (b), (c),
(d), and (e) are choropleth maps elaborated on the basis of ISTAT data instead [80]. (b) represents
population density, (c) employment rate, (d) the vulnerability index (all referred to the last national
census, i.e., 2011), and (e) average real estate offer prices (updated to 2016).
Figure 1a also highlights the trajectory and stops of Turin’s underground, as well as the location of
the two main railway stations of the city, i.e., Torino Porta Nuova (SZ 10) and Torino Porta Susa (SZ 08).
The underground connects the center and the two main railway stations with the South and the West
zones. Both Torino Porta Nuova and Torino Porta Susa are centrally located and can be considered
as multifunctional transport hubs, with railway, underground, and urban and extra-urban bus lines
conveying there. Additionally, they are located in the proximity of parking lots, taxi stops, and sharing
mobility facilities. Last but not least, it must be mentioned that the complete re-design and renewal of
Porta Susa occurred in recent years was performed to allow the transit and stop of high-speed trains,
in the context 2020,
Sustainability of a 12,
major
x FORurban transformation that has significantly re-shaped the area.
PEER REVIEW 6 of 25
Given that real estate prices are frequently recognized as a proxy for social, economic,
(all referred to
environmental, thebuilding
and last national census,
quality, i.e., of
in light 2011), and1e,
Figure (e)itaverage real estate
is possible offer
to state thatprices (updated
the SZs to
more valued
2016).
by the real estate market are the ones located in central areas (and well connected to the main transport
Figure 1a also highlights the trajectory and stops of Turin’s underground, as well as the location
hubs), followed by the upscale buildings and villas located in the panoramic eastern hillside. A sort of
of the two main railway stations of the city, i.e., Torino Porta Nuova (SZ 10) and Torino Porta Susa
clear separation appears in correspondence of SZ 12-Borgo Dora-Valdocco, which hosts the biggest
(SZ 08). The underground connects the center and the two main railway stations with the South and
daily open-air market in Europe and presents a certain degree of multidimensional vulnerability:
the West zones. Both Torino Porta Nuova and Torino Porta Susa are centrally located and can be
Starting from this
considered SZ, northern areas
as multifunctional overall
transport manifest
hubs, low average
with railway, real estateand
underground, offer prices.
urban andAbout
extra- this
point, recent studies adopting a spatial statistics approach have found that indicators
urban bus lines conveying there. Additionally, they are located in the proximity of parking lots, taxi of vulnerability
suchstops,
as lowand education and presence
sharing mobility of African
facilities. Last butand not American population
least, it must negatively
be mentioned affect
that the average
complete re- real
estate offerand
design prices [78]; negative
renewal effects
of Porta Susa on prices
occurred are exerted
in recent years was by the vulnerability
performed to allowof the
thetransit
housing andstock
too stop
[77], of
whereas
high-speedindicators of the
trains, in vibrancy
context(such as theurban
of a major cultural offer) usually
transformation thatpositively affect the
has significantly re- real
shaped
estate market theprices
area. [79].
Figure 1. Cont.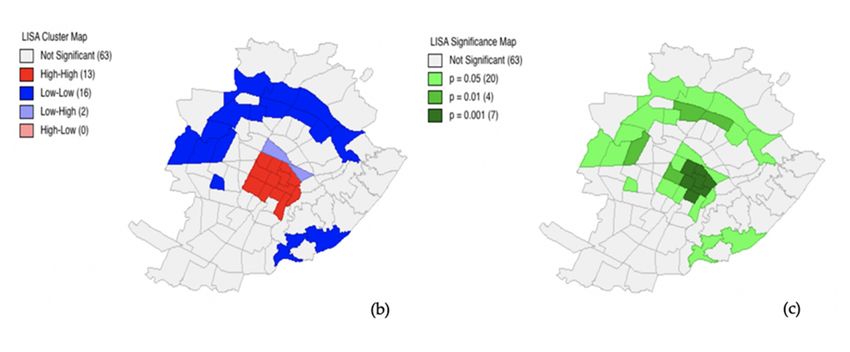
Sustainability 2020, 12, 4533                                                                                               7 of 22
    Sustainability 2020, 12, x FOR PEER REVIEW                                                                        7 of 25

          Figure
      Figure      1. The
               1. The     city
                       city  ofofTurin:
                                  Turin:(a)
                                         (a)Subdivision
                                             Subdivision into
                                                           into94
                                                                94Statistical
                                                                    StatisticalZones, with
                                                                                 Zones, withillustrative pictures
                                                                                                illustrative      of the
                                                                                                             pictures  of the
          city (the red line  and  squares  represent the underground     trajectory and stops,   respectively;
      city (the red line and squares represent the underground trajectory and stops, respectively; the blue     the blue
          square
      square      indicates
               indicates  thethe  underground
                               underground       andrailway
                                               and    railwaystation
                                                               stationof
                                                                       ofPorta
                                                                           PortaNuova;
                                                                                  Nuova; the
                                                                                          the yellow
                                                                                               yellow square
                                                                                                       square indicates
                                                                                                                indicates the
          the underground and railway station of Porta Susa; light orange areas refer to the extension of the
      underground and railway station of Porta Susa; light orange areas refer to the extension of the CHUZ
          CHUZ (Central Historic Urban Zone) instead); (b) population density; (c) employment rate; (d)
      (Central Historic Urban Zone) instead); (b) population density; (c) employment rate; (d) vulnerability
          vulnerability index; (e) average real estate offer prices. (b), (c), (d) and (e) visualize data according to
      index; (e) average real estate offer prices. (b), (c), (d) and (e) visualize data according to the Jenks
          the Jenks classification method. (Source: Authors’ elaboration on [80] and Geoportal of the
      classification method. (Source: Authors’ elaboration on [80] and Geoportal of the Municipality of Turin
          Municipality of Turin data (http://geoportale.comune.torino.it/web/cartografia). (a) includes images
      datalicensed
            (http://geoportale.comune.torino.it/web/cartografia).
                    from Creative Commons 0 and free Wikipedia images).
                                                                            (a) includes images licensed from Creative
      Commons 0 and free Wikipedia images).
          Given that real estate prices are frequently recognized as a proxy for social, economic,
3. Materials and Methods
    environmental, and building quality, in light of Figure 1e, it is possible to state that the SZs more
    valued by the real estate market are the ones located in central areas (and well connected to the main
3.1. Data Sources and Data Processing
    transport hubs), followed by the upscale buildings and villas located in the panoramic eastern
      In order
    hillside.    to address
              A sort          the research
                     of clear separation    objectives
                                         appears         of the study,ofgeo-referenced
                                                  in correspondence                       and spatial which
                                                                          SZ 12-Borgo Dora-Valdocco,    data were
    hosts
firstly    the biggest
         collected fromdaily open-air
                          different   market Geo-referenced
                                    sources.  in Europe and presents    a certain degree
                                                                 data concerning         of multidimensional
                                                                                    Airbnb   accommodations in
    vulnerability:
Turin               Starting from
        (years 2009–2017)     were this SZ, northern
                                    acquired  from the areas  overall
                                                          private     manifestAirdna
                                                                   company      low average  real estate offer
                                                                                       (www.airdna.co),      which
    prices.  About   this point, recent  studies adopting    a spatial statistics approach
provided data in csv format. Data were cleaned and filtered, and more than 3500 active      have  found    thatwere
                                                                                                     listings
identified for the year 2017. Spatial data on Turin’s city borders, urban form, internal subdivisions,
and characteristics were freely downloaded from the Geoportal of the Municipality of Turin (http: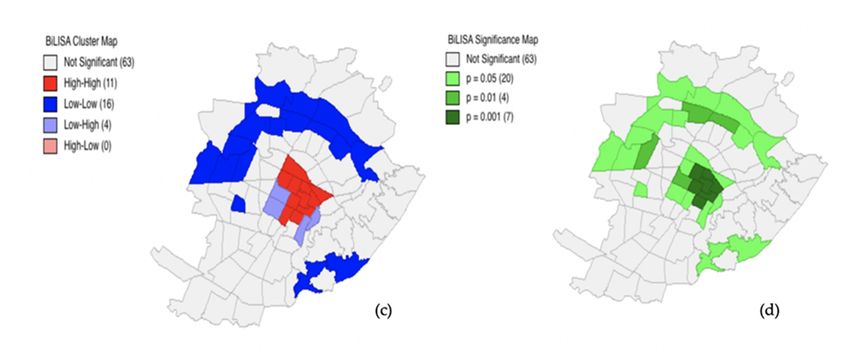
Sustainability 2020, 12, 4533                                                                         8 of 22

//geoportale.comune.torino.it/web/cartografia) instead. The available open cartography was accessed
both to provide a spatial context to Airbnb data and to perform descriptive, qualitative, and quantitative
considerations. All relevant data were cleaned and then processed through QGis and GeoDa, i.e., two
leading open software allowing for geo-based data analyses and visualization.
      In order to perform analyses taking into account also the socio-economic dimension, official indexes
and figures were retrieved from reports published by the Italian Statistical Institute in 2017 [80,82].
More specifically, these reports provide socio-economic information for each statistical zone (SZ)
into which the Municipality of Turin is subdivided. As briefly mentioned in previous paragraphs,
SZs are sub-municipal areas specifically outlined for statistical purposes, and they can be considered
as morphologically, environmentally, and demographically more homogeneous than other types of
territorial subdivisions [82].
      For what concerns the identification of built heritage resources, it was decided to compile an ad
hoc dataset able to integrate the experts’ point of view with a touristic one. For the purpose of this
study, it was thus agreed to consider as built heritage resources the major points of interest (e.g., notable
churches, royal residences, historical palaces of different ages, monuments, archaeological sites and
relics, examples of modern and contemporary architecture, etc.) mentioned in two guides elaborated
by distinguished experts in the architectural field [83,84]. The two guides were deemed particularly
suitable as data sources since they were edited with the purpose of offering to both tourists and
scholars a thorough description of the most significant buildings of Turin, taking into account different
historical periods and providing information based on detailed historical research. Additionally, they
also specify the full address of the buildings, thus allowing for geo-referencing and spatial analysis.
The adoption of tourist guides as data sources was also made in light of the approaches followed
by other authors. For instance, in their study about the influence of built heritage resources on real
estate values of the Italian Veneto region, P. Rosato and colleagues adopted the Guida del Touring
Club (i.e., one of the most authoritative tourist guides edited by Italian publishers) as a source [14];
more precisely, they considered the text length (i.e., number of rows) as a proxy for the importance of
local built heritage resources.
      Given that museums play an essential role in the local tourism landscape, it was deemed important
to take into account their location too; in this case, relevant geo-located data were downloaded from
the Geoportal of the Municipality of Turin.
      All the identified spots were then inputted in the GIS database and treated as point features,
being aware that considering other variables (e.g., surface occupied by historical buildings, linear
meters of their façades, number of visitors attending the sites, etc.) or attributing different weights
to environmental complexes could have added further depth to the analysis. However, given the
exploratory nature of the study, it was deemed appropriate to start with the simplest approach, leaving
some issues open for future research.

3.2. Spatial Analysis
     Datasets were firstly combined and used to elaborate maps. Geo-referenced data concerning
built heritage resources and Airbnb listings (i.e., point features) were first of all plotted on Turin’s
cartography, as to visualize their absolute and relative location; then, choropleth maps (i.e., maps that
describe the properties of distinct areas through colors, shades, etc.) [43] were elaborated with reference
to the datasets mentioned above. Data and maps were initially investigated by the means of visual
exploration; more precisely, visual exploration was carried out to perform qualitative and descriptive
considerations about built heritage resources and Airbnb listings’ distribution. Then, a further step
was represented by the conduction of spatial analysis.
     In general terms, spatial analysis can be considered as “a set of methods whose results are not
invariant under changes in the locations of the objects being analyzed” [43] (p. 291). Given the inductive
and exploratory nature of the study, it was decided to particularly apply Exploratory Spatial Data
Analysis (ESDA) techniques. Coherently with the objectives of the study, it was decided to perform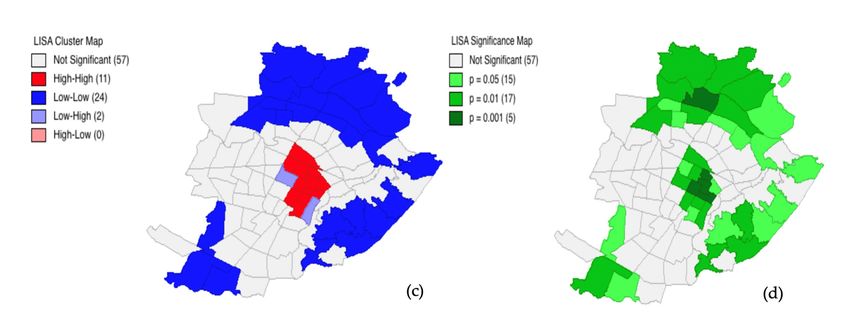
Sustainability 2020, 12, 4533                                                                          9 of 22

spatial autocorrelation statistics, i.e., quantitative techniques used to analyze correlation relative to
distance or connectivity relationships [85]. If, on the one hand, the existence of spatial autocorrelation
may be integrated and corrected in regression models, on the other one, it can be considered as an
approach bearing information in itself, given that it shows spatial associations existing among spatial
entities [85].
     Among the possible approaches, it was decided to calculate global, local, and bivariate Moran’s
Indexes. More precisely, global statistics assess the presence and magnitude of spatial autocorrelation
considering the entire study area, without indicating where specific patterns take place. One of the
techniques most frequently used to assess spatial autocorrelation at the global level is the Global
Moran’s Index (Global Moran’s I). It is calculated as follows:

                                        N ni=1 nj=1 Wij Xi − X X j − X
                                           P P
                                  I = P P                 P           2                             (1)
                                            n    n           n
                                            i=1  j=1 W  ij   i=1 X i − X

where I is the value of the Moran’s index; N is the number of spatial units; i and j are the locations of
observations; Wij is the matrix of spatial weights; xi is the value of variable x registered for observation
at location i; xj is the value of variable x registered for observation at location j; x is the mean of the
values of the variable x. In short, Moran’s Index values can range between -1 and +1, with -1 indicating
strong negative spatial autocorrelation (high values clustered with low values; low values clustered
with high values), +1 strong spatial autocorrelation (high values clustered with high values, low values
clustered with low values), and 0 no spatial autocorrelation (random distribution). Results stemming
from the calculation of the Global Moran’s I are reported in a numeric form (index) and usually plotted
on the so-called Moran’s scatterplot, a tool firstly developed and proposed to the academic community
by scholar Luc Anselin in the 1990s [39]. As described by the author, the scatterplot is based on the
interpretation of the Moran’s I as a regression coefficient in a bivariate linear regression of the spatially
lagged variable (Wx) on the original variable [39] (p. 112). The scatterplot is constituted by an x axis
and Wx axis, and from their intersection four quadrants are formed. The scatterplot is centered on
0,0 since the variables are taken as deviations from their means. The four quadrants in the scatterplot
represent “different types of association between the value at a given location (xi ) and its spatial lag,
that is, the weighted average of the values in the surrounding locations (Wxi )” [39] (p. 117). The points
displayed on the upper-right quadrant represent high values (above the mean) surrounded by high
values (High-High), whereas the points existing in the lower-left quadrant represent low values (below
the mean) surrounded by low values (Low-Low). The upper-left quadrant and lower-right quadrant
are associated to low values surrounded by high values (Low-High) and high values surrounded by
low values (High-Low), respectively, and they correspond to negative spatial association.
      In order to identify the contribution of each individual observation to the global value of the
indicator and identify spatial clusters, it was decided to also apply Local Indicator of Spatial Association
(LISA) techniques [86]; more precisely, it was decided to calculate the local version of the Moran’s
Index. In the case of local indicators of spatial association, interpretative tools usually include not
only the Moran’s scatterplot and value, but also a map displaying High-High, Low-Low, Low-High,
and High-Low patterns, if present. Additionally, another map displaying the significant levels of the
identified relationships (i.e., 0.05, 0.01 and 0.001) helps the researcher better interpret the strength
of results.
      Finally, the Bivariate Moran’s I, which measures the correlation between the values of a variable
x at a location i and the values of a different variable y in areas identified as near or as neighbors,
was calculated too. Overall, all spatial analyses were performed through the GeoDa software: Resulting
indexes, scatterplots, maps, and significance maps will be presented in the following section. Given the
shape of the spatial units of analysis and the exploratory nature of the study, it was decided to perform
the analysis on the basis of a polygon contiguity matrix (Queen type, first order), which is usually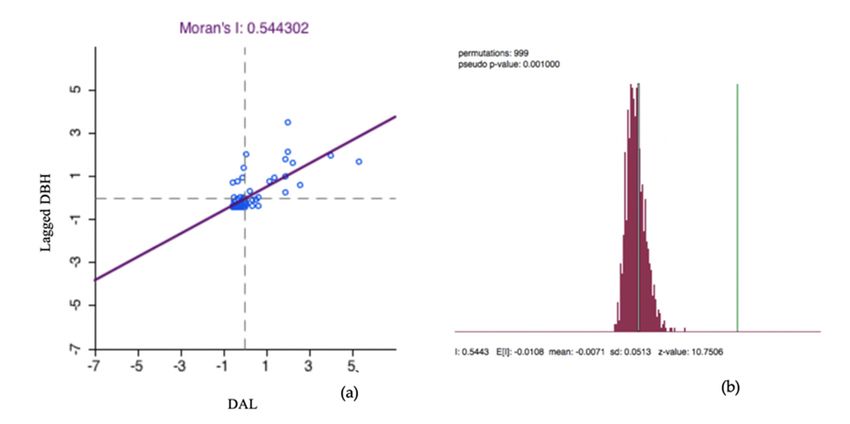
Finally, the Bivariate Moran’s I, which measures the correlation between the values of a variable
x at a location i and the values of a different variable y in areas identified as near or as neighbors, was
calculated too. Overall, all spatial analyses were performed through the GeoDa software: Resulting
indexes, scatterplots, maps, and significance maps will be presented in the following section. Given
the shape of
Sustainability the12,spatial
2020, 4533 units of analysis and the exploratory nature of the study, it was decided
10 ofto
22
perform the analysis on the basis of a polygon contiguity matrix (Queen type, first order), which is
usually recommended for exploratory studies [43]. This type of matrix considers as neighbors of a
recommended for exploratory studies [43]. This type of matrix considers as neighbors of a target
target polygon the polygons sharing either an edge or corner with it.
polygon the polygons sharing either an edge or corner with it.
4. Results and Discussion
4. Results and Discussion
4.1.Short-Term
4.1. Short-TermRentals
RentalsOffer
Offerand
andSpatial
SpatialDistribution
Distribution
The
The number
numberofofAirbnb
Airbnblistings
listingsdetected
detected as asactive in November
active in November 20172017exceeded
exceeded3500 3500
units;units;
this
amount included all the listing types made available on the platform (i.e., entire houses/apartments,
this amount included all the listing types made available on the platform (i.e., entire houses/apartments,
private
private rooms,
rooms, and
and shared
shared rooms).
rooms). As As already
already reported
reported in in other
other articles
articles [87,88],
[87,88], the
the vast
vast majority
majority of
of
the
the listings included entire homes/apartments (72%), followed by private rooms (26.4%) and shared
listings included entire homes/apartments (72%), followed by private rooms (26.4%) and shared
rooms
rooms (1.6%).
(1.6%). With
Withrespect
respect toto other
other cities,
cities, the
the number
number of of multi-listings
multi-listings hosts hosts (i.e.,
(i.e., management
management of of
more than one listing by a single host) resulted to be rather limited, suggesting
more than one listing by a single host) resulted to be rather limited, suggesting that the phenomenon that the phenomenon
of
of professional
professional hosts
hosts and
and ofof real
real estate
estate agencies
agencies operating
operating in in the
the short-term
short-term rental
rental sector
sector was
was not
not
particularly
particularly widespread
widespread [88].[88]. Figure
Figure2a 2ashows
showsthe thelocation
locationof ofthe
thelistings
listingswithwithreference
reference to to Turin’s
Turin’s
open
open cartography,
cartography, whereas
whereas Figure
Figure 2b2b is
is aa choropleth
choropleth map map that
that displays
displays thethe number
number of of listings/Km
listings/Km2
2
(density
(density values)
values) for
for each
each SZ.
SZ. More
More specifically,
specifically, thethe Jenks’
Jenks’ natural
natural breaks
breaks classification
classification method
method waswas
followed, and data were then visualized coherently; this method optimizes
followed, and data were then visualized coherently; this method optimizes the clustering of data, the clustering of data,
reducing
reducing thethe variance
variance within
within classes
classes and
and maximizing
maximizing the the variance
variance between
between classes
classes [89,90].
[89,90].
Figure 2.
Figure Distribution(a)
2. Distribution (a) and
and number
number of
of active listings/Km22 (b)
active listings/Km (b) in
in Turin
Turin (2017).
(2017). (Source:
(Source: Authors’
Authors’
elaboration on data collected by the company Airdna).
elaboration on data collected by the company Airdna).
If Figure 2a suggests that short-term rentals do not equally interest the various zones of the
If Figure 2a suggests that short-term rentals do not equally interest the various zones of the city,
city, Figure 2b helps understand that the SZs displaying the highest density of listings are the
Figure 2b helps understand that the SZs displaying the highest density of listings are the central 01-
central 01-Municipio and 09-Piazza Madama Cristina (Borgo San Salvario), followed by 03-Palazzo
Municipio and 09-Piazza Madama Cristina (Borgo San Salvario), followed by 03-Palazzo Carignano,
Carignano, 04-Piazza San Carlo-Piazza Carlo Felice, 05-Piazza Statuto, 06-Piazza Vittorio Veneto,
04-Piazza San Carlo-Piazza Carlo Felice, 05-Piazza Statuto, 06-Piazza Vittorio Veneto, 07-Corso
07-Corso Cairoli-Piazza Bodoni, 10-Borgo San Secondo-Stazione Porta Nuova, 11-Borgo Vanchiglia,
and 19-Piazza Nizza (Borgo San Salvario). As previously mentioned, the prevalent construction period
of the buildings existing in these areas is prior to 1918 [81], and the studies performed by the research
group working on Turin’s vulnerability and vibrancy [77–79] highlight that many of these SZs are also
characterized by high levels of urban vibrancy [79], suggesting a possible relationship between the
Airbnb phenomenon and the services offered by specific urban areas. The lowest values of density
are registered especially in the peripheral and semi-peripheral northern, eastern, and southern areas
instead; however, whereas density values abruptly decrease in the Eastern part (e.g., in SZ 15, 70,the buildings existing in these areas is prior to 1918 [81], and the studies performed by the research
group working on Turin’s vulnerability and vibrancy [77–79] highlight that many of these SZs are
also characterized by high levels of urban vibrancy [79], suggesting a possible relationship between
the Airbnb phenomenon and the services offered by specific urban areas. The lowest values of density
Sustainability 2020, 12, 4533 11 of 22
are registered especially in the peripheral and semi-peripheral northern, eastern, and southern areas
instead; however, whereas density values abruptly decrease in the Eastern part (e.g., in SZ 15, 70, 75,
etc.,
75, i.e.,
etc.,where hillshills
i.e., where and and
upscale residential
upscale villas/buildings
residential areare
villas/buildings located), density
located), densityvalues
valuesseem
seem toto
decrease more gradually in the northern, southern, and especially western parts of the
decrease more gradually in the northern, southern, and especially western parts of the city. Overall, city. Overall,
this
thisAirbnb
Airbnb distribution
distributionisisthe result
the ofof
result ananexpansion
expansion process
processstarted
startedinin2009:
2009:whereas
whereas inin
initial phases
initial phases
the few existing listings were widely distributed, from 2015 onwards short-term
the few existing listings were widely distributed, from 2015 onwards short-term rentals were registeredrentals were
registered
especiallyespecially
in central in central
and and semi-central
semi-central areas (suchareas
as San(such as San
Salvario, Salvario,and
Vanchiglia, Vanchiglia, and the
the neighborhoods
neighborhoods in the proximity of the “Roman Quadrilateral”); then, they progressively
in the proximity of the “Roman Quadrilateral”); then, they progressively affected interstitial zones affected
interstitial
connecting zones
theseconnecting theseasareas,
areas, as well moreas well as more
peripheral zonesperipheral zones units
and residential and residential
located along unitsthe
located along the North–South axis
North–South axis of the underground [48]. of the underground [48].
4.2. Built
4.2. Heritage
Built Resources
Heritage Resources
The density map 2; 2
The density mapelaborated
elaborated forforbuilt
builtheritage
heritageresources
resources(number
(number ofofbuilt
builtheritage
heritagepoints/Km
points/Km ;
Jenk’s classification) confirms that relevant points are especially concentrated in central
Jenk’s classification) confirms that relevant points are especially concentrated in central SZs, namely SZs, namely
01-Municipio
01-Municipio and
and04-Piazza
04-Piazza San
SanCarlo-Piazza
Carlo-Piazza Carlo
Carlo Felice, followed
Felice, followed byby02-Palazzo
02-Palazzo Reale,
Reale,03-Palazzo
03-Palazzo
Carignano,
Carignano, 06-Piazza
06-PiazzaVittorio
VittorioVeneto,
Veneto,andand07-Corso
07-CorsoCairoli-Piazza
Cairoli-PiazzaBodoni
Bodoni(Figure
(Figure3a).
3a).InIn
descriptive
descriptive
terms, it it
terms, is is
thus possible
thus possibletoto
state that
state some
that someSZs (e.g.,
SZs 01,01,
(e.g., 03,03,
04,04,
06,06,
and 07)07)
and areare
interested
interestedbybya relatively
a relatively
high concentration
high concentration ofofboth
bothshort-term
short-termrentals
rentalsand
andspots
spotswith
withhistorical
historicaland
andarchitectural
architecturalvalue.
value.
Figure 3. Built heritage resources and Airbnb listings: Density map of listings of historical and
Figure 3. Built heritage resources and Airbnb listings: Density map of listings of historical and
architectural value (a); active 2017 Airbnb listings plotted on built heritage resources density map
architectural value (a); active 2017 Airbnb listings plotted on built heritage resources density map (b)
(b) (Source: Authors’ elaboration on Airdna and self-collected data).
(Source: Authors’ elaboration on Airdna and self-collected data).
Figure 3b suggests in visual terms that in 2017, many Airbnb listings were located either in
Figure 3b suggests in visual terms that in 2017, many Airbnb listings were located either in
central historical zones or in their immediate proximity. In order to quantify and better specify these
central historical zones or in their immediate proximity. In order to quantify and better specify these
relationships—also in light of the socio-economic characteristics of the SZs—spatial statistics methods
relationships—also in light of the socio-economic characteristics of the SZs—spatial statistics
were then applied.
methods were then applied.
4.3. Spatial Statistics
4.3. Spatial Statistics
The computation of the Global and Local Moran’s I for the density of Airbnb listings (DAL) and
the density of built heritage resources (DBH) highlighted that both variables present positive spatial
autocorrelation patterns. More precisely, results highlighted that the distribution of Airbnb listings is
not random, but that a certain degree of spatial autocorrelation exists instead (Moran’s I: 0.491; pseudo
p-value = 0.001). The LISA cluster map pointed out that particularly significant High-High spatial
autocorrelation patterns (p = 0.001) exist for central areas such as SZ 02, 03, 04, and 07; even thoughSustainability 2020, 12, x FOR PEER REVIEW 12 of 25
The computation of the Global and Local Moran’s I for the density of Airbnb listings (DAL) and
the density of built heritage resources (DBH) highlighted that both variables present positive spatial
autocorrelation patterns. More precisely, results highlighted that the distribution of Airbnb listings
Sustainability 2020, 12, 4533 12 of 22
is not random, but that a certain degree of spatial autocorrelation exists instead (Moran’s I: 0.491;
pseudo p-value = 0.001). The LISA cluster map pointed out that particularly significant High-High
spatial autocorrelation patterns (p = 0.001) exist for central areas such as SZ 02, 03, 04, and 07; even
characterized by a lower level of significance (p = 0.01 and p = 0.05), High-High patterns interest other
though characterized by a lower level of significance (p = 0.01 and p = 0.05), High-High patterns
central and semi-central statistical zones too (SZ 12, 05, 01, 06, 09, 19, and 10). Significant Low-Low
interest other central and semi-central statistical zones too (SZ 12, 05, 01, 06, 09, 19, and 10). Significant
patterns are registered
Low-Low patterns forarenorthern,
registeredsouthern, and southern,
for northern, eastern areas
and located
eastern towards the borders
areas located towardsofthe
the city,
instead. As described in paragraph 2.2, the northern area is characterized by high levels
borders of the city, instead. As described in paragraph 2.2, the northern area is characterized by high of architectural
and socio-economic vulnerability,
levels of architectural the South presents
and socio-economic industrial
vulnerability, buildings,
the South presentswhereas the buildings,
industrial East is the hill
zonewhereas
of the city. Low-High
the East is the hillpatterns arecity.
zone of the evidenced
Low-High forpatterns
SZ 09bis-Valentino
are evidenced and SZ09bis-Valentino
for SZ 08-Stazione Porta
Susa,and
i.e.,SZ 08-Stazione
statistical zonesPorta
that Susa, i.e., statistical
for their zones that
characteristics for and
(park theirrailway
characteristics
station(park and railway
respectively) present
station respectively) present low-density values of Airbnb listings, even though
low-density values of Airbnb listings, even though their neighboring zones manifest high density their neighboring
valueszones manifest
(Figure high
4). In thedensity
case ofvalues (Figure 4). In theneighboring
SZ 09bis-Valentino, case of SZ 09bis-Valentino,
zones with high neighboring
density zones
values are
with high density values are in fact San Salvario (SZ 09 and 19) and a SZ characterized by squares
in fact San Salvario (SZ 09 and 19) and a SZ characterized by squares providing high environmental
providing high environmental quality (SZ 07); in the case of SZ 08-Porta Susa, neighboring zones are
quality (SZ 07); in the case of SZ 08-Porta Susa, neighboring zones are the central, historical, and in
the central, historical, and in some cases also vibrant 01-Municipio, 04-Piazza San Carlo-Piazza Carlo
someFelice,
cases05-Piazza
also vibrant 01-Municipio,
Statuto, and 10-Borgo 04-Piazza San Carlo-Piazza
San Secondo-Stazione Carlo Felice, 05-Piazza Statuto,
Porta Nuova.
and 10-Borgo San Secondo-Stazione Porta Nuova.
Figure 4. Density of active Airbnb listings (November 2017): Queen first order connectivity map (a),
Moran’s scatterplot and Moran’s I value (b), LISA (Local Indicator of Spatial Association) Cluster Map
(c), and LISA Significance map (d). (Source: Authors’ elaboration).
The computation of the Global and Local Moran’s I for the density of built heritage resources
(Figure 5) confirmed by a spatial statistic point of view what was suggested by choropleth maps and
available cartography. In fact, results highlighted that spatial autocorrelation patterns exist (Moran’s I:
0.641; pseudo p-value = 0.001), and that High-High clusters interest central SZs.(c), and LISA Significance map (d). (Source: Authors’ elaboration).
The computation of the Global and Local Moran’s I for the density of built heritage resources
(Figure 5) confirmed by a spatial statistic point of view what was suggested by choropleth maps and
available cartography. In fact, results highlighted that spatial autocorrelation patterns exist (Moran’s
I: 0.641;
Sustainability pseudo
2020, p-value = 0.001), and that High-High clusters interest central SZs.
12, 4533 13 of 22
Figure 5. Density of built heritage resources: Moran’s scatterplot and Moran’s I value (a), LISA Cluster
Figure
Map (b), and5. LISA
Density of built heritage
Significance mapresources: Moran’s
(c). (Source: scatterplot
Authors’ and Moran’s I value (a), LISA Cluster
elaboration).
Map (b), and LISA Significance map (c). (Source: Authors’ elaboration).
In order to better understand the distribution of Airbnb listings in relation to the socio-economic
characteristics of the SZs, the Bivariate Global Moran’s I values were computed. In this case, correlation
coefficients were calculated considering the standardized values of the variable “density of Airbnb
listings” (DAL) at a given location and the standardized values of a different variable in neighboring
areas (spatially lagged variables). Given the objectives of the research, it was decided to include in the
analyses the following variables: Density of built heritage resources (DBH), density of museums (DM),
density of commercial activities (DCA), density of businesses devoted to food and beverage (DFBA).
DBH for each SZ was calculated through personal data collection (PDC) as described in previous
paragraphs, whereas DM, DCA, and DFBA were obtained considering open access data available on
the Geoportal of the Municipality of Turin (GMT). About this point, it must be mentioned that since it is
not easy to determine whether all the DCA and DFBA businesses are still active, DCA and FBA should
not be considered as necessarily referring to the present commercial scenery, but rather as a proxy of
the commercial and recreational vocation of the areas. Then, it was decided to include in the analysesSustainability 2020, 12, 4533 14 of 22
also the following socio-economic variables: Population density (PD), incidence of foreigner residents
(IFR), vulnerability index (VI), cultural operators’ index (CCOI), average offer prices (euros/square
meter) of the real estate market (OPRE), real estate expansion index (REEI), building conservation
index (BCI), level of education (EL), and employment rate (ER). The values for each variable and
for each SZ were based on the last 2011 ISTAT census data (indicated as ISTAT in Table 1), with the
exception of real estate values, which were updated to 2016 [80]. Table 1 (Table 1) presents a list of the
variables considered and the results emerged from the analyses (Bivariate Moran’s I values).
Table 1. Short-term rentals and socio-economic variables: Bivariate Moran’s I values.
Spatially Lagged Bivariate Pseudo p-Value
Variable Definition Data Source
Variable Moran’s I (999 Permutations Test)
Number of built heritage
DAL DBH PDC 0.544 0.001 ***
resources/km2
DM Number of museums/km2 GMT 0.403 0.001 ***
Number of commercial
DCA GMT 0.472 0.001 ***
activities/km2
Number of food and
DFBA GMT 0.453 0.001 ***
beverage businesses/km2
PD Number of inhabitants/km2 ISTAT 0.132 0.003 **
Number of foreigner
IFR residents/residents, ISTAT 0.044 0.203
multiplied for 1000
Synthetic index that
VI describes the degree of social ISTAT −0.118 0.001 ***
and economic vulnerability
Number of people working
in the creative, cultural,
CCOI sport, and entertainment ISTAT 0.263 0.001 ***
industries/number of
residents, in percentage
Average offer real estate
OPRE prices, expressed in ISTAT 0.437 0.001 ***
euros/m2
Number of residential
buildings erected after
REEI ISTAT −0.044 0.097
2005/number of residential
buildings, in percentage
Number of residential
buildings showing a bad
BCI conservation state/number ISTAT 0.020 0.269
of residential buildings,
in percentage
Number of people aged
25–64 with a high school
EL degree or higher/number of ISTAT 0.242 0.001 ***
residents of the same age
segment, in percentage
Number of employed people
aged ≥15 years/number of
ER ISTAT 0.313 0.001 ***
residents of the same age
segment, in percentage
Pseudo p-values: * p < 0.05, ** p < 0.01, *** p < 0.001. DAL: Density of Airbnb listings; DBH: Density of built heritage
resources; DM: Density of museums; DCA: Density of commercial activities; DFBA: Density of businesses devoted
to food and beverage; PD: Population density; IFR: Incidence of foreign residence; VI: Vulnerability index; CCOI:
Cultural operators’ index; OPRE: Offer prices of real estate market; REEI: Real estate expansion index; BCI: Building
conservation index; EL: Level of education; ER: Occupation rate.
Correlation coefficients indicate that positive spatial correlation patterns are either low or not
present when considering DAL and spatially lagged variables such as population density (PD, Bivariate
Moran’s I = 0.132), incidence of foreigner residents (IFR, Bivariate Moran’s I = 0.044), vulnerability index
(VI, Bivariate Moran’s I = −0.118), real estate expansion index (REEI, Bivariate Moran’s I = −0.044),
and building conservation index (BCI, Bivariate Moran’s I = 0.020). Low positive spatial correlation
patterns emerge when considering the cultural operators’ index (CCOI, Bivariate Moran’s I = 0.263),
the level of education index (EL, Bivariate Moran’s I = 0.242), and the occupation rate (ER, Bivariate
Moran’s I = 0.313) instead. Interestingly, a higher Moran’s value (Bivariate Moran’s I = 0.437) isYou can also read