Hazard Characterization and Risk Assessment - Sept 2021 DRAFT - City of Alameda
←
→
Page content transcription
If your browser does not render page correctly, please read the page content below
Hazard
Characterization and
  Risk Assessment
               Sept 2021 DRAFT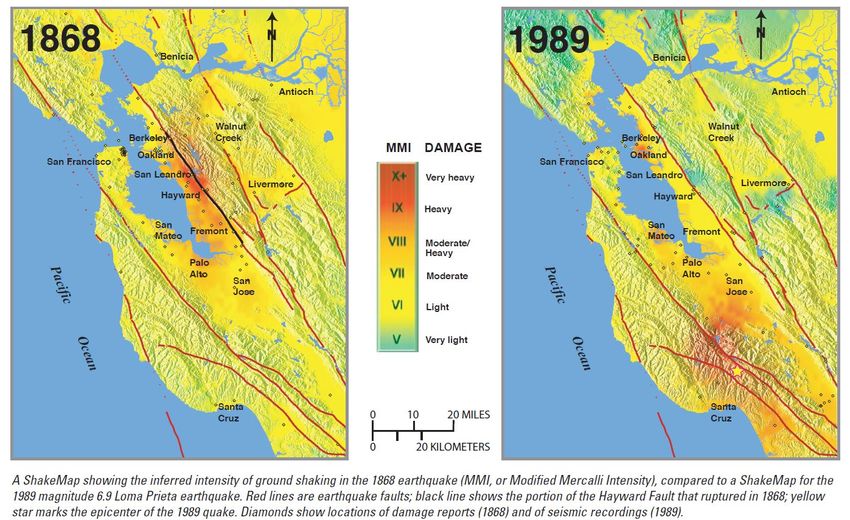
Review of Hazards
Alameda is impacted by a number of natural hazards that have the potential to significantly disrupt daily
life and cause damage to people and property. This chapter provides an overview of the hazards that
impact Alameda and assess the risks they pose to Alameda’s people, economy, buildings and
infrastructure.
Hazards impacting Alameda that were considered in the plan were reviewed and assessed based on their
likelihood of future occurrence and their consequences to Alameda’s people and assets if the hazard
were to occur. The following table provides a summary of the hazards considered and their relative
likelihood and consequence. Based on this analysis, it was determined that earthquakes, floods and sea
level rise pose the greatest risk to people and property in Alameda. Other hazards may also have
significant impacts but are less likely to occur, or the consequences may be more limited in duration or
impact. These hazards are still considered and addressed in the context of this plan, but the primary
focus of the plan is on the three hazards of greatest concern.
Table 4-1 Summary of Hazard Analysis
Hazard Likelihood Consequence Hazards of Concern
Earthquakes Likely Catastrophic
Hazards of Greatest
Flooding from storms Likely Moderate to Catastrophic
Concern
Sea level rise Likely Catastrophic
Tsunamis Possible Moderate to Catastrophic
Heat Likely Moderate
Drought Likely Moderate
Hazards of Concern
Wildfire-related hazards
Likely Moderate
(smoky air, PSPS)
Dam breach inundation Unlikely Moderate
This risk posed by natural hazards can be defined as the likelihood of an impact occurring and the
magnitude of the consequences of that event on a community. Risk is often depicted as: Risk =
Likelihood x Consequence.
This chapter provides a brief description of the risk posed by each hazard. For hazards of greatest
concern, the following appendices provide additional details on the analysis, including exposure of assets
to hazards:
Appendix E: Detailed Earthquake Risk Assessment
Appendix F: Detailed Flooding and Sea Level Rise Risk Assessment
Appendix G: Priority Coastal Inundation Locations
Appendix H: Additional Maps
Appendix I: Tsunami Table
Hazard Characterization and Risk Assessment | 4-2
Earthquakes
An earthquake is the hazard most likely to cause rapid, extensive damage in Alameda. This damage will
primarily result from violent shaking and ground disturbances. Other hazards association with
earthquakes such as fault rupture and landslides are not possible for Alameda. The perceived intensity of
an earthquake is related to the energy released by the earthquake (its magnitude), how close it is, and
the underlying soil conditions. Bay Farm Island and Alameda Island consist of central cores of higher
ground that are relatively stable, and surrounding areas of man-made fill or “made-ground” that can
amplify shaking and liquefy in earthquakes.

In addition to the damage to Alameda itself, the city depends upon its mainland connections for
transportation, utilities, commerce, and services. Major damage to Oakland, San Leandro, and adjacent
cities would have an indirect impact on Alameda in both the short term and long-term recovery of the City.
After an earthquake, Alameda may experience isolation and disruption until bridges and utility crossings
are restored.

Hazard Description
The total amount of energy released in an earthquake is described by the earthquake magnitude. The
moment magnitude scale (abbreviated as M) is logarithmic; the energy released by an earthquake
increases logarithmically with each step of magnitude. For example, the 1906 San Andreas earthquake,
M7.8, released 500 times more energy than the 2014 South Napa Quake, M6.0. But fortunately, the
frequency of large earthquakes is much less than that of smaller earthquakes. “Strong” earthquakes,
M6.0-6.9, occur about 120 times per year somewhere in the world, “major” earthquakes, M7.0-7.9 occur
about 18 times per year, and a “great” quake of M8.0 or more is likely to occur only once in the world per
year. Fortunately, the types of faults in the Bay Area (strike/slip) are unlikely to produce quakes larger
than M8.0. Farther up the coast in Oregon, Washington and Alaska, with subduction faults, M9.0 quakes
are possible. When subduction zone earthquakes occur offshore, they may also produce tsunamis, which
can impact Alameda.

Earthquakes with the same magnitude of energy released can have different effects on nearby facilities,
depending upon how close the rupture is, direction of the rupture, and the type of soil at the site. The
Modified Mercalli Intensity (MMI) scale illustrates the intensity of shaking experienced at a particular
location by considering the effects on people, objects, and buildings. The MMI scale describes shaking
intensity on a scale of 1-12. MMI values less than 5 don’t typically cause significant damage; MMI values
greater than 10 have never been recorded. The USGS makes shake maps that show the MMI in areas
surrounding the epicenter of an actual or scenario earthquake. Table 4-2 below shows the expected
damage caused by various MMIs.

The worst-case scenario for Alameda is a major earthquake along the southern portion of the Hayward
Fault, because that is the closest fault to Alameda, only four miles away. A major earthquake on any one
of the faults in the Bay Area is predicted to cause at least some ground disturbance on the made-ground
portions of Alameda. Made-ground is much more sensitive to shaking and ground disturbance. Shaking is
likely to be felt all over Alameda, but more violently on made-ground. Figure 4-1 shows shake maps
showing the MMI of ground shaking for the historic magnitude M 6.9 quakes in 1868 on the Hayward
Fault and the 1989 Loma Prieta earthquake on the San Andreas fault. In places, Alameda experienced
MMI 8 (very strong) to 9 (violent) intensity shaking during these two quakes.

                                                      Hazard Characterization and Risk Assessment | 4-3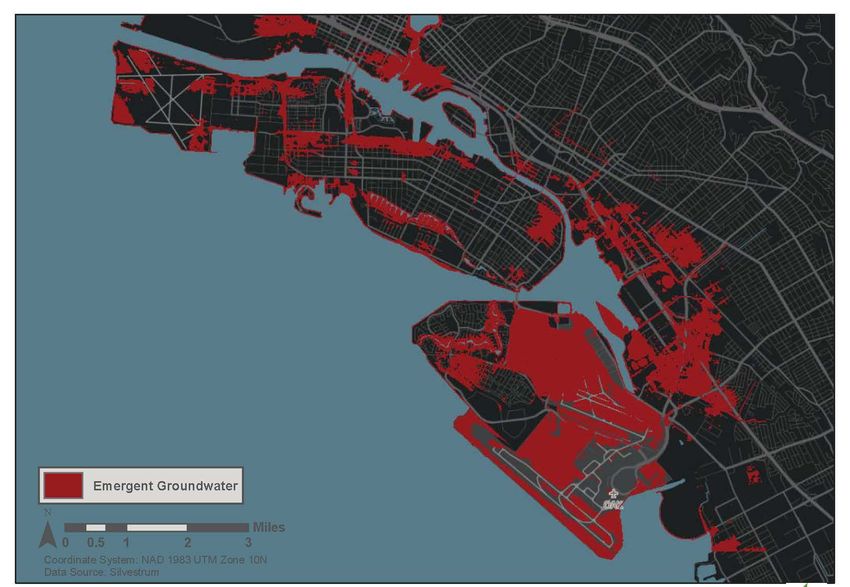
Table 4-2. MMI Intensity Table

                                                                  Multi-Family Wood-          1&2 Story Wood-
Intensity     Building Contents        Masonry Buildings
                                                                   Frame Buildings            Frame Buildings
MMI 6        Some things thrown        Some walls and             Some drywall cracks.      Some chimneys are
             from shelves, pictures    parapets of poorly                                   damaged, some
             shifted, water thrown     constructed buildings                                drywall cracks. Some
             from pools                crack.                                               slab foundations,
                                                                                            patios, and garage
                                                                                            floors slightly crack.
MMI 7        Many things thrown        Poorly constructed         Plaster cracks,           Many chimneys are
             from walls and            buildings are              particularly at inside    broken and some
             shelves. Furniture is     damaged and some           corners of buildings.     collapse, damaging
             shifted.                  well-constructed           Some soft-story           roofs, interiors, and
                                       buildings crack.           buildings strain at the   porches. Weak
                                       Cornices and               first-floor level. Some   foundations can be
                                       unbraced parapets          partitions deform.        damaged.
                                       fall.
MMI 8        Nearly everything         Poorly constructed         Soft-story buildings      Houses shift if they
             thrown down from          buildings suffer partial   are displaced out of      are not bolted to the
             shelves, cabinets,        or full collapse. Some     plumb and partially       foundation, or are
             and walls. Furniture      well-constructed           collapse. Loose           displaced and
             overturned.               buildings are              partition walls are       partially collapse if
                                       damaged.                   damaged and may           cripple walls are not
                                       Unreinforced walls         fail. Some pipes          braced. Structural
                                       fall.                      break.                    elements such as
                                                                                            beams, joists, and
                                                                                            foundations are
                                                                                            damaged. Some
                                                                                            pipes break.
MMI 9        Only very well            Poorly constructed         Soft-story buildings      Poorly constructed
             anchored contents         buildings collapse.        partially or completely   buildings are heavily
             remain in place.          Well-constructed           collapse. Some well-      damaged, some
                                       buildings are heavily      constructed buildings     partially collapse.
                                       damaged. Retrofitted       are damaged.              Some well-
                                       buildings damaged.                                   constructed buildings
                                                                                            are damaged.
MMI 10       Only very well            Retrofitted buildings      Many well-                Well-constructed
             anchored contents         are heavily damaged,       constructed buildings     buildings are
             remain in place.          and some partially         are damaged.              damaged.
                                       collapse.
Source: ABAG, 2013, Modified Mercalli Intensity Scale

                                                          Hazard Characterization and Risk Assessment | 4-4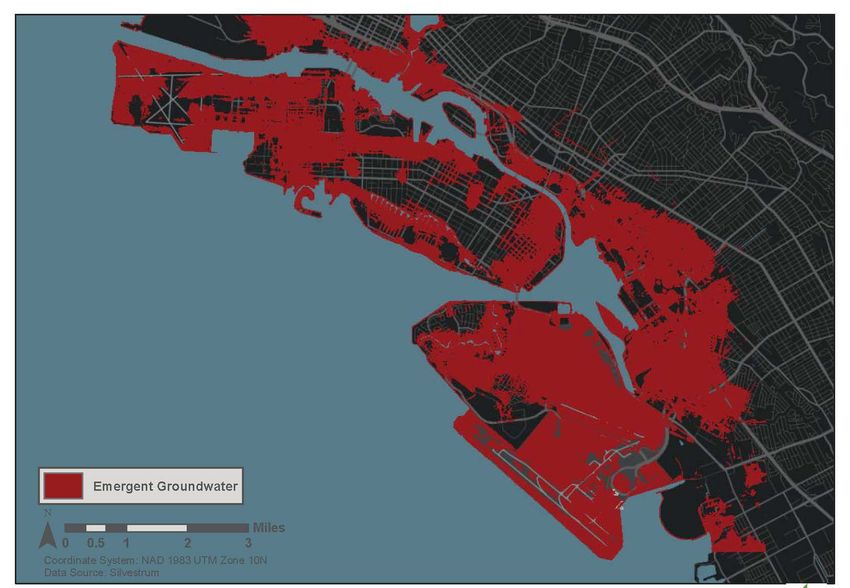
Figure 4-1 Shake Maps Comparing Damage from the 1868 Hayward Earthquake (approx. M6.9) to
                          the 1989 Loma Prieta Earthquake (M6.9)

Earthquake Liquefaction
Earthquakes can cause ground disturbances, including liquefaction and subsidence. Liquefaction occurs
when the underlying saturated sands and muds lose strength and liquefy during shaking and may even
come to the surface as mud boils. Subsidence happens when small pockets or whole neighborhoods sink
down permanently because of the loss of strength during liquefaction. During the Loma Prieta Earthquake
for example, Franciscan Way, which was built on 40-year-old made-ground, sank slightly due to
liquefaction. This caused difficulties with the sanitary sewer system and necessitated the construction of a
sanitary sewer pump station to boost flows from the neighborhood to the main line. The storm drain lines,
while still functional, were also impaired. Several residential streets needed emergency repair due to
differential settlement. Ground improvement techniques to mitigate liquefaction and subsidence, include
replacement of the liquefiable soils, compaction by various techniques, grouting, deep pile mixing, gravel
piles and lowering the groundwater table, all of the techniques are challenging in an already built
environment. Figure 4-2 shows areas that are highly susceptible to liquefaction throughout the city.
Appendix H shows maps of city sewer and stormdrain facilities in relation the liquefaction susceptibility.
In a Hayward Fault earthquake, the areas of the city with very high liquefaction potential have an
approximately 50% chance of liquefying, while the medium liquefaction potential areas have less than a
5% likelihood of liquefying. 1

As groundwater rises with rising sea level, more areas of Alameda may become susceptible to
liquefaction. For more information on rising groundwater, see the Flooding section. Because Alameda’s

1 Jones, J.L., Knudsen, K.L., Wein, A.M., 2017, HayWired scenario mainshock—Liquefaction probability mapping,

chap. E of Detweiler, S.T., and Wein, A.M., eds., The HayWired earthquake scenario—Earthquake hazards: U.S.
Geological Survey Scientific Investigations Report 2017–5013–A–H, 126 p., https://doi.org/10.3133/sir20175013v1.

                                                          Hazard Characterization and Risk Assessment | 4-5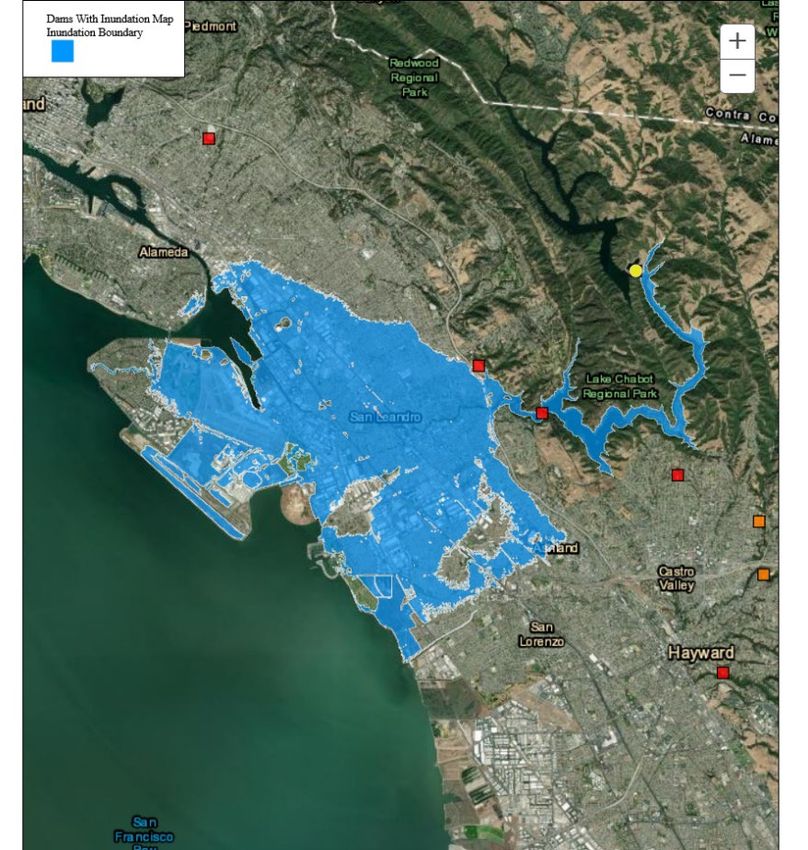
groundwater table is already relatively high, the impact of a rising groundwater table is anticipated to be
relatively minor, especially over shorter time horizons. 2

                                    Figure 4-2 Liquefaction Susceptibility Map

Earthquake Caused Fires
After direct losses caused by violent shaking, liquefaction and subsidence, the largest secondary effect to
consider during and after an earthquake is fire. The Great Earthquake of 1906 was also known as the
Great Fire of 1906, because much of the damage to San Francisco was caused by fires started by the
earthquake. Post-earthquake fires can be caused by damage to natural gas lines, electrical lines, toppled
water heaters, and appliances. After an earthquake, fire-fighting efforts may be hampered by the number
of simultaneous fire ignitions across the city, streets blocked by rubble or trees, lack of water pressure,
lack of mutual aid if Oakland and San Leandro are equally hard-hit, and loss of access across bridges.
Firefighting personnel would have to be split between fighting fires and performing paramedic services.

In Alameda, fires following earthquakes could be very damaging due to firefighting resources being
stretched thin and the dense urban environment with older wood structures likely to be damaged and the
ability of fires to rapidly spread between structures. Areas that experience liquefaction are also more
vulnerable to post-earthquake fires because of the greater potential for underground natural gas lines to
rupture and start fires and because water lines in these areas may also be damaged by liquefaction,

2   Grant, A.R., at al. (Draft) Changes in Liquefaction Severity in the San Francisco Bay Area with Sea-Level Rise

                                                              Hazard Characterization and Risk Assessment | 4-6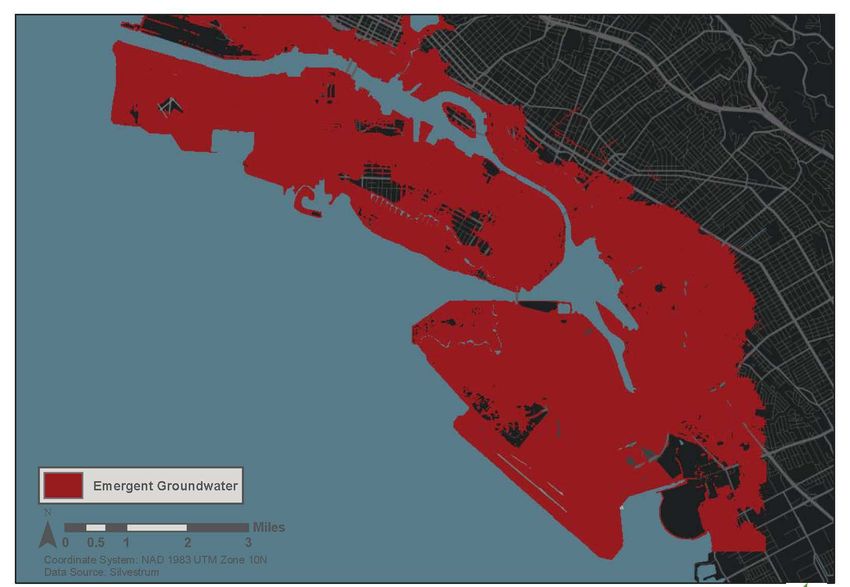
preventing firefighting with regular resources. Areas with hazardous materials may have the potential for
explosion, fires, or toxic smoke. Laboratories are significant concern for hazardous material fires.

Other Earthquake Related Losses
In addition to the direct losses caused by earthquakes and earthquake-started fires, there are other
secondary effects to consider during and after an earthquake, especially if the surrounding cities are
impacted. This includes loss of circulation for emergency vehicles, evacuation, damage to buildings, lack
of access to hospitals, lack of access for mutual aid outside of the City, loss of utilities such as power,
water, telecom, and natural gas, generation of large quantities of debris, release of hazardous materials,
and loss of population displaced by damaged housing, industry and commerce.

Since Alameda is relatively flat, it is not exposed to the earthquake hazards of seismically triggered
landslides. There are no known faults running through Alameda and no history or geological evidence of
fault rupture in Alameda. There is a hypothetical chance of minor sloughing along the shoreline perimeter,
since much of the perimeter is built on mudflats, subject to liquefaction.

Historic Earthquakes
The Bay Area has experienced about 20 strong earthquakes and one major earthquake in the past 165
years, including the 1868 Hayward Fault quake (~M6.9) and 1906 San Andreas quake (M7.8). Those two
earthquakes occurred before the infilling of made-ground in Alameda, and when the majority of buildings
in Alameda were relatively flexible wood construction. The most notable damage was to the brick tower at
Alameda City Hall, built in 1895 and damaged by the San Francisco earthquake in 1906. The damage
was extensive enough to warrant removal of the tower in 1937.

Table 4-3 and Table 4-4 show the historic recorded earthquakes along the Hayward and San Andreas
Faults, respectively.

       Table 4-3. Recorded or Deduced Strong (M6.0+) Earthquakes along the Hayward Fault

               Date             Magnitude       Notes
                1315            Over M6.3        Based on geologic data
                1470            Over M6.3        Based on geologic data
                1630            Over M6.3        Based on geologic data
                1725            Over M6.3        Based on geologic data, predates California
                                                 missions
                1868            M6.8 to M7       Based on geologic data, predates California
                                                 missions
                1984            M6.2             Morgan Hill (on nearby Calaveras Fault)

 Table 4-4. Recorded Strong (M6.0+) and Major (M7.0+) Earthquakes along the San Andreas Fault

               Date             Magnitude       Notes
                1812            M7+              Southern California
                1838            M7               Santa Cruz Mountains
                1857            M7.9             Fort Tejon

                                                        Hazard Characterization and Risk Assessment | 4-7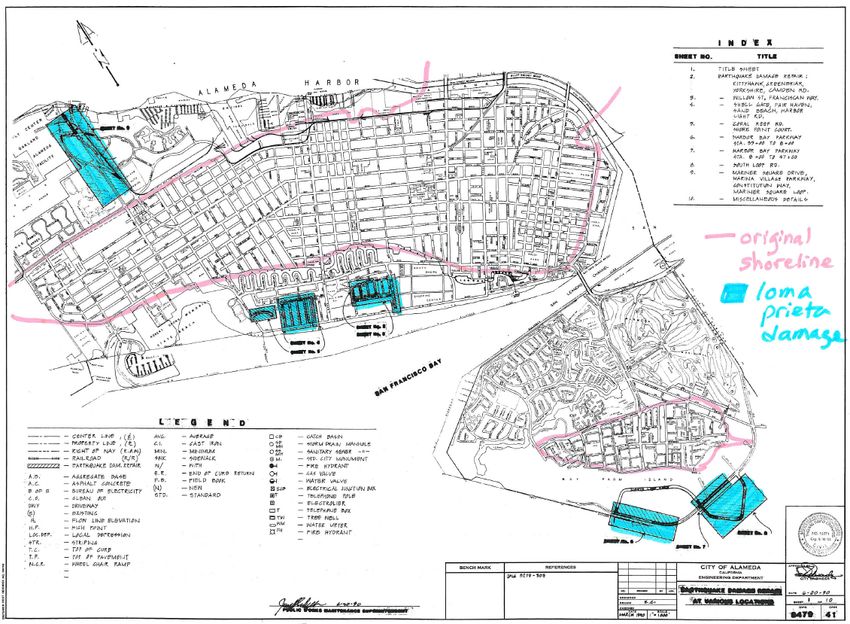
1890            M6.3            Corralitos
               1906            M7.8            San Andreas (San Francisco Quake)
               1940            M7.1            Imperial Valley
               1983            M6.5            Coalinga
               1989            M6.9            Scotts Valley (Loma Prieta Quake)
               1991            M6.3            Fortuna
               1992            M7.2            Fortuna
               2019            M6.4, M7.1      Ridgecrest sequence

The 1989 Loma Prieta earthquake, M6.9, occurred after the infilling of Alameda along South Shore, Bay
Farm Island, and Alameda Point. This quake caused $2.1M damage to properties owned by the City of
Alameda, including buildings, fuel tanks, broken water mains, broken sewer lines, street buckling, and
bulkhead damage. The dollar amount of private properties is not included here.

The earthquake was strong enough to cause the collapse of the nearby Cypress Structure in Oakland.
There were documented liquefaction (mud boils) in the made ground at Alameda Point and Harbor Bay
Business Park on Bay Farm Island. Several neighborhoods including South Shore experienced buckled
streets and sidewalks, and subsidence that made the sanitary sewer pipes no longer flow downhill,
requiring the City to build a new sanitary sewer pump station. Figure 4-3 shows a map of the settlement
damage to streets from the Loma Prieta Earthquake. All were in areas of made ground, outside of the
original shoreline. The Loma Prieta earthquake also caused damage to the Miller Sweeney Bridge at
Fruitvale Avenue causing it to be shut to all vessel traffic until repaired.

The only strong quake to occur in the Bay Area since the 1989 Loma Prieta Earthquake is the 2014 South
Napa Earthquake, M6.0, which caused extensive building and underground utility damage in Napa, along
the rupture of the West Napa Fault. The damage was highly concentrated in the Napa area and no
damage was reported in Alameda.

                                                     Hazard Characterization and Risk Assessment | 4-8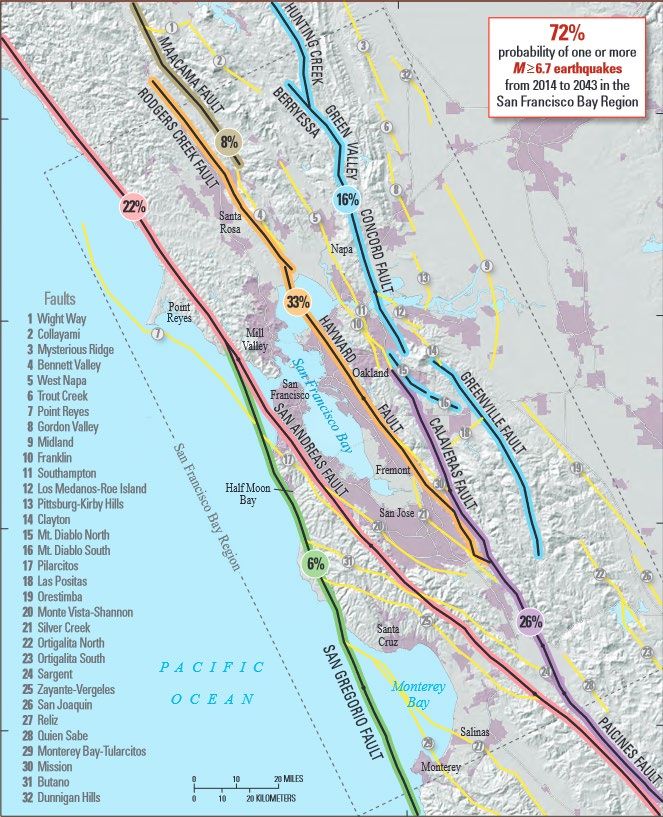
Figure 4-3 Areas of Loma Prieta Earthquake Damage and Original Shoreline of Alameda

                                                              Hazard Characterization and Risk Assessment | 9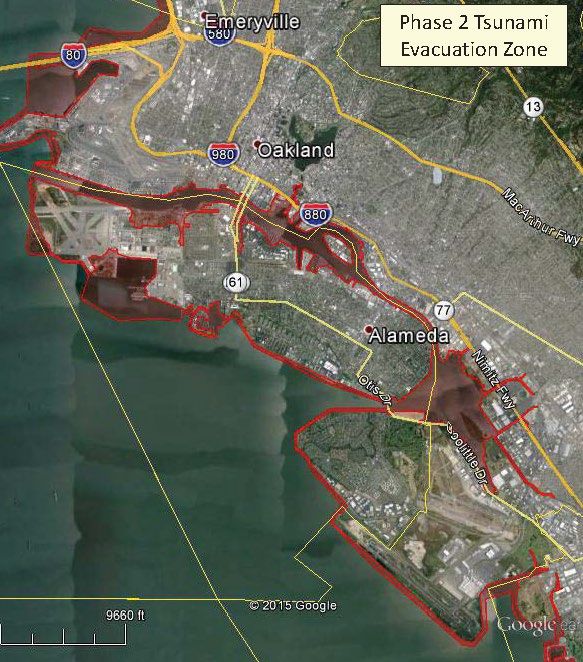
Future Earthquakes
According to the USGS, the chance of an earthquake of M6.7 or greater somewhere in the Bay before
2043 is 72%. 3 As shown on Figure 4-4, the chance of a M6.7 or greater earthquake on our closest fault,
the Hayward-Rodgers Creek Fault, before 2043 is 33%. The likelihood of an earthquake on the next
closest fault, the San Andreas, is 22%.

The California Integrated Seismic Network has developed scenario earthquakes and has shown what
areas will be affected by each earthquake. A M6.8 quake on the Hayward fault or a M7.2 quake on the
San Andreas fault is likely to cause at least a “strong” or MMI 7 shaking in Alameda. Combining all likely
scenarios on nearby faults, Alameda has a 10 percent chance of experiencing “Very Strong” to “Violent”
(MMI 8 to MMI 9) shaking in the next 50 years. This probability can also be expressed as a 0.2 percent
chance per year, or a 500-year event, which could happen any time. Figure 4-5 portrays this probabilistic
seismic hazard.

Strong earthquakes strike the Hayward Fault at approximately 140-year intervals, with the last major one
in 1868, so we may be due for another strong quake in the relative short term. USGS developed the
HayWired earthquake scenario to depict a scientifically realistic depiction of a moment magnitude (Mw)
7.0 earthquake on the Hayward Fault with an epicenter in Oakland. In the scenario the Hayward Fault
ruptures for 52 miles along its length. Such an earthquake would result in strong shaking that will trigger
surface fault rupture, liquefaction, landslides, fires, and severe impacts throughout the entire Bay
Area. Appendix E describes these impacts in greater detail. The HayWired scenario represents an
earthquake with approximately a 150-year return period; one that has about a 20% chance of occurring in
the next 30 years. While the impacts of this scenario are severe, it does not represent the worst-case
earthquake by any means. By comparison, most newer buildings today are designed to protect the safety
of occupants in earthquake shaking with approximately a 975-year return period, or a 2% change of
occurring in any 50-year period.

3 Earthquake Outlook for the San Francisco Bay Region 2014–2043, USGS Fact Sheet 2016-3026. Available at
https://pubs.usgs.gov/fs/2016/3020/fs20163020.pdf

                                                      Hazard Characterization and Risk Assessment | 4-10
Figure 4-4 Probability that a magnitude 6.7 or greater earthquake will occur on the Bay Area fault
system before 2043
Hazard Characterization and Risk Assessment | 4-11Figure 4-5. Probabilistic Earthquake Shaking Hazard Map
Climate Adaptation and Earthquakes
Climate change is expected to have a role in earthquake hazards. Rising sea levels correspondingly
cause rising groundwater levels. Soils that are more saturated with groundwater are more likely to liquefy
and subside. Rising groundwater is explored in further detailed in the Future Flooding section.
Earthquake Risk Assessment
The vulnerability of Alameda assets to earthquake hazards is examined in detail in Appendix E and
summarized below.
Certain types of buildings are more susceptible to the shaking and ground disturbances of earthquakes.
Older buildings constructed before modern building codes are generally not designed to withstand
earthquake shaking. Single family cripple wall, multi-family soft-story, unreinforced masonry, nonductile
concrete, and tilt-up buildings are building types that are particularly vulnerable to damage in
earthquakes. Alameda has an unreinforced masonry program that has resulted in the seismic retrofit of all
unreinforced masonry buildings with 5+ units. Alameda also has a soft-story evaluation program that has
resulted in the voluntary seismic retrofit of 159 buildings with five or more housing units. Sixty-three
buildings containing over 900 housing units remain unretrofitted.
Newer buildings constructed to current California building codes are designed protect occupant safety but
do not ensure that a building will be usable after an earthquake. In a region experiencing a housing
shortage, designing newer buildings to a higher standard would a faster recovery of these critical
Hazard Characterization and Risk Assessment | 4-12buildings and the recovery of the community as whole. An additional 1% in construction cost to build new
buildings to a “functional recovery standard” could increase the availability of homes and businesses by
75 to 95% following a major earthquake. 4
Buildings subject to violent shaking can also dislodge asbestos or encapsulated (abated) asbestos, lead
paint, and other hazardous materials. Broken plumbing can discharge sewage. Broken gas lines and
damaged electrical wiring can spark fires and present health and safety hazards. Other hazards from
shaking buildings include falling piping, shelving, and goods.
Some of the City’s most important buildings are vulnerable to earthquake shaking because they were
constructed with the building standards that pre-dated current knowledge about earthquake dynamics.
The City Hall, for example, completed in 1896, lost its central bell tower during the 1906 San Francisco
Earthquake. The tower was never re-built. Since then, most of the City buildings have been seismically
retrofit, or have been constructed to more modern standards. Of particular concern are the 1940s era
residences and hangers on Alameda Point, the former Alameda Naval Air Station, that would be subject
to earthquake shaking, liquefaction, ground settlement, and flooding. The Alameda Point Master
Infrastructure Plan addresses areas of redevelopment, where buildings will be constructed to modern day
seismic standards and reuse areas where retrofit work may be needed.
Alameda’s five estuary crossings have all be retrofitted to a “no collapse” standard, which means that
while the bridge will survive without loss of life, significant repairs or replacement may be necessary. The
Fruitvale railroad bridge is a collapse hazard that poses a hazard for the adjacent Miller-Sweeney bridge.
Alameda is advocating for this bridge to be removed and replaced with a pedestrian/bike bridge. The City
of Alameda has requested that Miller-Sweeney bridge and Bay Farm Island bridges be upgraded to a
“lifeline” standard, which would allow them to be nearly immediately usable following an earthquake.
The hundreds of miles of natural gas, water, sewer, and stormwater distribution and collection lines are all
at risk to damage from liquefaction. Appendix H shows maps of city sewer and stormdrain facilities in
relation the liquefaction susceptibility and shaking hazard. Neighborhoods that experience significant
liquefaction may not have service restored for weeks or months. An average East Bay customer would
lose water for an estimated six weeks and some will lose service for as long as six months. Water supply
outages will impede fighting post-earthquake fires. Full restoration of the natural gas system can take up
to six months because of the time it will take to integrity test the lines prior to repressurizing and number
of qualified personnel required to relight pilot lights. 5
Flooding
Over 23 miles of shoreline surround both the main island of Alameda and Bay Farm Island. As such, the
City of Alameda is vulnerable to flooding from both coastal storms where water enters the land along the
lower elevations of the shoreline and overland from rainfall within the City during and after storm events.
In the near term, both are likely to be temporary in nature, limited by high tide cycles and intensity of
events, with flooding likely shallow - on the order of 2 feet or less in depth. Nevertheless, as climate
change increases the intensity of storm events, sea levels, and groundwater levels, the depth and extent
of flooding is expected to increase.
4 Haywired Earthquake Scenario, U.S. Geological Survey, 2018.
5 Lifelines Restoration Performance Project, City and County of San Francisco, 2020.
Hazard Characterization and Risk Assessment | 4-13Coastal storm and overland flooding are not mutually exclusive. During high tides many of the city’s
outfalls are already under water and the pipes upstream are partially full as a result. Additionally, some
outfalls have chronic issues with mud deposition and their inherent capacity is already reduced. When a
coastal storm event occurs, temporarily higher sea levels back up already submerged pipes even more,
and as rainfall enters the pipes from upstream this capacity is diminished further. An example of recurrent
flooding in the city due to the combination of rainfall and a submerged outfall is on Main Street, next to the
old entrance gate for the former Naval Air Station. This location can be seen with several inches of water
in the street during certain combinations of tides and storm events.
Note: In 2013 the City’s storm drain outfalls were assessed visually for capacity, condition, and operation
and maintenance prioritization. An updated comprehensive cleaning and condition assessment for the
entire stormwater system is planned for fiscal year 2021-23.
Although there are not a significant number of recurrent flooding locations within the city, the combined
factors described above may cause additional flooding issues if the storm drain system becomes
overtaxed due to climate change.
In some areas of the city, storm drainage is collected through pipes and flows down to a pump station.
Alameda has 11 stormwater pump stations in total. In the case of pump stations, stormwater is pumped
out to the Bay under pressure through a discharge line, not a gravity outfall pipe. Therefore, if the
discharge line outfall is below high tide, it can still effectively pump. This is why rising sea levels will tend
to have less of an effect on some portions of the city where pump stations exist, in lieu of gravity outfalls
which can back up readily.
Alameda is very flat, especially in areas of made-ground, with many streets originally constructed at
minimum longitudinal grade. Over time the significant number of trees along City streets has led to an
abundance of heaves caused by tree roots along street gutterlines. As a result, ponding of stormwater in
front of homes is frequent and recurrent, and keeping catch basin grates and culvert inlets free of clogs
caused by leaves is an issue the maintenance department stays busy with during the wet season. Many
homes have sump pumps below them that discharge to the gutter as well, to minimize structural damage
due to the high-water table found in various parts of the city. For this reason, ponding can occur within the
gutterline during the dry season.
Hazard Description
Tides
Because the Island of Alameda and Bay Farm Island have such extensive shorelines, an understanding
of tidal influence is important for existing and future flood hazard characterization. The City of Alameda
normally experiences tides that range from (-) 0.2 ft Mean Lower Low Water (MLLW) to 6.4 ft Mean
Higher High Water (MHHW), based on the NAVD88 datum (the NAVD88 datum, or zero elevation, is
approximately the same as the elevations used in local tide tables, and is the datum used in the Flood
Insurance Rate Maps described below). The highest tides of the year, or “king tides”, normally occur
during the winter months of November thru February, and are usually about 7.4 ft NAVD88. The ten
highest king tides recorded by NOAA in Alameda for the last 80 years measured 8.6 ft to 9.5 ft NAVD88
in elevation.
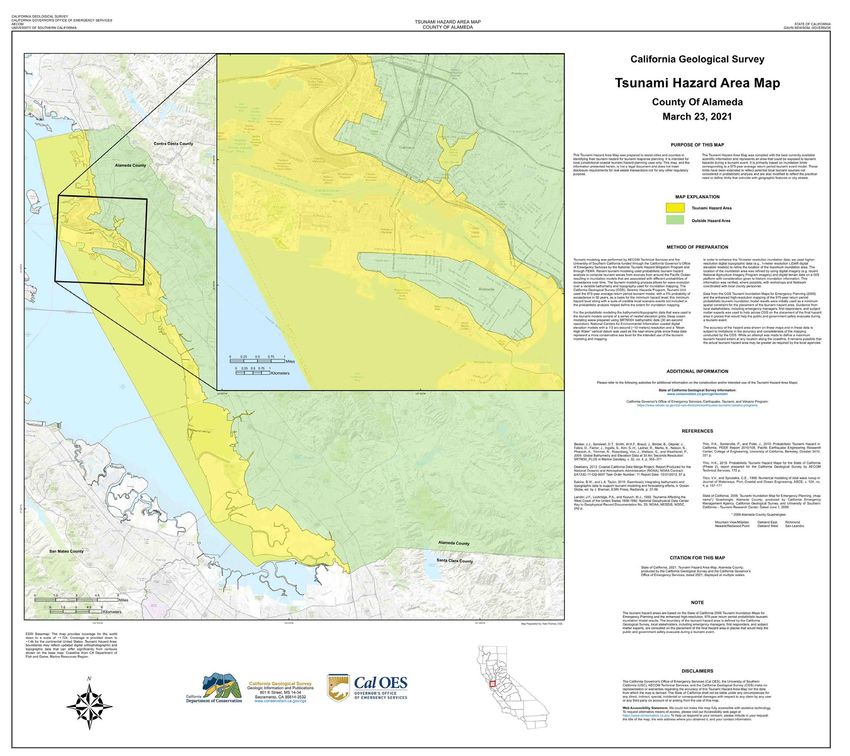
Hazard Characterization and Risk Assessment | 4-14Coastal Flooding
In 2018 the Federal Emergency Management Agency (FEMA) published new Flood Insurance Rate Maps
(FIRMs) that show approximately 2,000 Alameda properties mapped within the 100-yr flood zone, and at
least 1,100 buildings (significantly more than in the previously published 2009 FIRMs). Areas within the
100-yr flood zone have a statistical 1% chance per year of flooding if an extreme storm event happens
during an extreme high tide, though the event could feasibly happen in any year (or even multiple times
within one year).
With the 2018 update, FEMA modeling shows Both AE Zones (high risk flood zone, with wave heights
less than 3 ft) and VE Zones (high risk zone, with wave heights greater than 3 ft) surrounding Alameda’s
shorelines with varying associated Base Flood Elevations, or BFEs (the computed elevation to which the
flood is anticipated to rise). Some BFEs are as high in elevation as 14 ft NAVD88. Thankfully, all of the
low points in the city’s shoreline that serve as entry points for coastal flooding occur in AE Zones where
the BFE is limited to 10 ft NAVD88, and therefore floodwaters would extend onto city land until they meet
land at that same elevation. Nearly the entire city’s land-based flood zone has a BFE = 10 ft NAVD88. For
context, the BFE of 10 ft NAVD88 is 2.6 ft above the yearly typical king tide described previously and
could theoretically be achieved by a combination of a king tide plus a weather-related temporarily higher
sea level. The updated flood mapping for Alameda is shown below and available at msc.fema.gov.
Alameda Point
(former Naval
Air Station)
Figure 4-6. Alameda West End Flood Hazard Map
Hazard Characterization and Risk Assessment | 4-15Figure 4-7 Alameda East End Flood Hazard Map
Hazard Characterization and Risk Assessment | 4-16Figure 4-8 Bay Farm Island Flood Hazard Map
According to the FIRMs, the Island of Alameda has its most extensive coastal flood entry locations in
three main areas where the City shoreline is lower in elevation than the 100-year BFE; these occur along
the northern, eastern, and Alameda Point shorelines (see Error! Reference source not found.). Along the
northern shoreline, this entry point is approximately 1,100 ft long and located behind (north of) the
Webster and Posey Tube portals. Alameda Point is the largest portion of the main island affected by the
100-yr coastal storm event (portions shown on Figure 4-9); to the north, floodwaters would enter along a
1.5 mile stretch along Main Street and extend toward the northwest tip of the former Naval Air Station
airfield. They would also enter from the south along a 1.6 mile stretch that includes the former seaplane
lagoon and federal property. Along the eastern shoreline, the entry location is approximately 350 ft long
and includes the end of the Liberty Avenue right-of-way (see Error! Reference source not found.).
Bay Farm Island is especially vulnerable to coastal flooding, as the lowest property elevations within the
city are found here and are included within the flood zone. The issue of most importance is that flood
waters can enter from multiple locations and combine into one interconnected flood zone. These entry
points within city limits include the end of Veterans Court, the low point at the Lagoon System 1 North
Outfall on the northern shoreline, and approximately 1,900 ft of Doolittle Drive. Additionally, flood waters
Hazard Characterization and Risk Assessment | 4-17originating within the City of Oakland along the 2 miles of shoreline along Doolittle Drive/SR 61 would
also affect Bay Farm Island: they would flow across the airport and enter into Alameda over a stretch of
1.2 miles of Harbor Bay Parkway (the city line), inundating city properties.
Webster Tube Portal
Main
Street
Alameda Point
(former Naval
Air Station)
Posey Tube Portal
Webster Street
Figure 4-9 Main Island: Current (2018) FEMA Flood Mapping Along Portion of Northern and
Western Shorelines. Areas affected include Webster St and Tube Portals.
Hazard Characterization and Risk Assessment | 4-18Fernside
Blvd
Liberty Ave
entry point
Figure 4-10 Main Island: Current (2018) FEMA Flood Mapping of Eastern Shoreline. Areas affected
are Liberty Avenue and Fernside Boulevard neighborhoods.
Hazard Characterization and Risk Assessment | 4-19Lagoon
System
1 North
Veterans
Outfall
Court
Chuck Corica
Golf Course Doolittle
Drive
City
Maitland Boundary
Drive
Oakland
Airport
Figure 4-11 Bay Farm Island: Current (2018) FEMA Flood Mapping. Areas affected are homes
along Lagoon System 1 North, Island Drive, Maitland Drive and Mecartney Road
While the Chuck Corica Golf Course is shown as part of the flood zone in Figure 4-11, it is worth noting
that extensive site grading has taken place over the last few years, and now mounds are in place along
its eastern perimeter and throughout its interior. The exact effect that this regrading may have on Bay
Farm Island flooding scenarios is unknown (the regrading was not done for flood protection purposes or
using FEMA-accreditation methodology and therefore is not reflected on the FIRMs). Regardless,
floodwaters entering Bay Farm Island at the 100-yr event could potentially block Island Drive, Doolittle
Drive, Harbor Bay Parkway, Ron Cowan Parkway, and the approach to the Bay Farm Island Bridge,
compromising Bay Farm Island egress from both Oakland and the main island for emergency and
recovery purposes.
In the above discussion, potential flooding is considered temporary – induced by storm events that have a
beginning and end, and the FEMA flood maps reflect these temporary conditions. However, in the
subsequent discussion on sea level rise the key difference will be that flooding conditions are considered
permanent even though they may impact the same geographical area as a temporary storm today would.
As such, a higher baseline sea level in the future could be considered the new “normal.”
Overland Flooding
Figure 4-12 and Figure 4-13 depict modeled surface flooding in Alameda based on a historic 25-year
rainstorm event. The model shows where water may overwhelm the stormwater system in a theoretical
Hazard Characterization and Risk Assessment | 4-20storm (these are not actual flooding locations). Red nodes indicate locations where surface flooding is
expected to be greater than 1 ft in depth. Open circle nodes indicate locations expected to be 0.5 ft to 1 ft
deep. Locations with less than 0.5 ft of flooding are not shown. These modeled flood nodes were used
during the vulnerability assessment to specifically consider the risk of overland flooding separately from
flooding due to sea level rise and storm surge.
As the figures illustrate, flooding over 1 ft deep on the main island is concentrated on the western side,
along Singleton Avenue and the Webster Street corridor (and a few locations a block east or west of it).
On Bay Farm Island there is only one location, at the northern end of Lagoon System 1 North. Otherwise
flooding is limited to less than 1 ft at the theoretical event.
Figure 4-12 Modeled surface flooding on the main island for a 25-year storm event. Results were
filtered to show only locations with modeled flood depths of greater than 0.5 ft above street level.
The points shown on this map reflect model node locations
Hazard Characterization and Risk Assessment | 4-21Figure 4-13 Modeled surface flooding on Bay Farm Island for a 25-year storm event. Results were
filtered to show only locations with modeled flood depths of greater than 0.5 ft above street level.
The points shown on this map reflect model node locations
The City has also modeled the existing stormwater collection system and determined what intersections
are at risk of flooding during a 10-year storm or 25-year storm due to undersized pipes, undersized pump
stations, or the inability to drain during high tides. Maps showing collection system-related flooding
potential are shown in Appendix H. The City’s storm drain modeling looked at 10 and 25-year storms,
which is the normal return period used for storm drain construction.
Historic Flooding
Winter months are when the City is most likely to experience storm events. During an extreme storm
event, the level of the sea can temporarily rise several feet above the level predicted by tide tables. This
is caused by “wind set-up,” which is the tendency for water levels to increase at the downwind shore and
to decrease at the upwind shore if the storm pushes and piles up water along the coast. Temporary sea
level rise can also be caused by wind-caused waves, and by the seawater increasing in volume as its
temperature rises (as happens during an El Niño year) among other factors.
California experiences a megaflood, or outburst flood, event every 100 to 200 years. During the
megaflood of 1861-62 that destroyed a quarter of California’s economy, 28 in of rainfall fell on San
Francisco in 1 month, and a record 7.76 in fell in one 24 hour period. Other areas on the West Coast
experienced similarly intensity and volume. Since then, there have been less extreme flood-inducing
storms every two to three years striking some part of California.
These storms are not necessarily related to El Niño or La Niña years. During normal conditions in the
Pacific Ocean, trade winds blow west along the equator, taking warm water from South America towards
Asia. To replace that warm water, cold water rises from the depths — a process called upwelling. El Nino
Hazard Characterization and Risk Assessment | 4-22and La Nina are two opposing climate patterns that break these normal conditions. During El Nino, trade
winds weaken. Warm water is pushed back east, toward the west coast of the Americas. La Nina has the
opposite effect of El Nino. During La Nina events, trade winds are even stronger than usual, pushing
more warm water toward Asia. Off the west coast of the Americas, upwelling increases, bringing cold,
nutrient-rich water to the surface.
Of the ten costliest California storm seasons between 1949 and 1997, four (1979-80, 1985-86, 1992-93,
and 1996-97, in 1998 dollars) were neither El Niño nor La Niña types. The most expensive storm (1994-
95) was a weak El Niño with 100-year to 1000-year events. (J. Null, “El Niño and La Niña … Their
Relationship to California Flood Damage”, http://ggweather.com/enso/calif_flood.htm). Therefore, in any
given year, El Niño or not, there could potentially be a severe storm. With the increased understanding
and tracking of atmospheric rivers, these events will become easier to predict and prepare for.
In 1981, storms eroded Crown Beach up to the edge of Shoreline Drive. During the El Niño event of
1997-98, there was up to 2 feet of standing water on Main Street due to higher sea levels (king tide plus
weather-related temporary sea level rise) and heavy rainwater runoff. And in 2006, storm waves
damaged the Harbor Bay Ferry Terminal and washed away portions of the adjoining Coastal Trail. These
events were relatively minor in terms of damage, and none involved structures. However, there is the
potential for more extensive flooding and erosion.
The most problematic recurring flooding location in the city was alleviated in 2021, which involved
construction of two relief manholes in the Crown Beach sand dune. The manholes were constructed inline
with two culvert outfalls from Shoreline Drive and have their grates at a lower elevation than the catch
basin grates feeding the outfalls within Shoreline Drive. This thereby prevents Shoreline Drive and Kitty
Hawk Road from flooding during a combination of large rain events and clogged outfall pipes, which
maintenance crews had historically struggled with every wet season.
As of May 2021, FEMA’s National Flood Insurance Program (NFIP) Claims Dashboard shows that FEMA
has handled 10 flood loss claims for the City of Alameda since 1970 - a time span of 51 years. These
claims have resulted in a net total payment of $30,865. There are currently no open claims, and FEMA
Region IX personnel informed the City that as of May 2021 there are no Repetitive Loss (RL) or Severe
Repetitive Loss (SRL) structures in the City of Alameda (Community ID# 060002) and therefore none in
the identified flood hazard areas.
Future Flooding
Earlier it was discussed that today’s coastal flood scenario can be viewed as a potential and temporary
condition, induced by a storm event that has a beginning and an end. When discussing future flooding
scenarios, sea level rise may be a key difference - making flooding conditions permanent due to a higher
baseline sea level. It is anticipated that future storm surge, higher sea level, and elevated groundwater
levels will have a compound effect on increasing flooding scenarios within the city.
Total Water Level vs. Sea Level Rise
When discussing sea level rise, the CARP and this document evaluate tidal flooding due to storm surge
and sea level rise in terms of total water level (TWL) above today’s MHHW level. Using TWL recognizes
the contribution of both sea level rise and storm surge to flooding and reflects a range of scenarios. For
example, a total water level of 36 inches above today’s high tide can result from any of the following (as
shown in Figure 4-14):
Hazard Characterization and Risk Assessment | 4-23 50-year storm event today;
6 inches of sea level rise plus a 25-year storm event in the short term (6 inches sea level rise
likely by 2030); and
36 inches of sea level rise (around 2060–2070).
(Credit: ART, San Francisco BCDC).
Figure 4-14 Image depicting total water level as a combination of sea level rise and storm surge
Applying a TWL approach enables us to plan actions that address temporary impacts of today’s winter
storms while simultaneously planning to address more permanent inundation from sea level rise.
Flooding Scenarios and their Timing
Table 4-5 is taken from the CARP and presents the main TWL projections shown on Figures 4-12 and 4-
13 (and referenced in the CARP) as well as additional projections, their respective elevations in NAVD88,
the various flood scenarios represented by these TWLs, and the anticipated timing for these projections.
Table 4-5 Total Water Levels, Flooding Scenarios, and Timing for Sea Level Rise Projections
Applied in CARP Sea Level Rise Planning
Flooding Scenarios: Timing for SLR
TWL Elevation (NAVD88)
SLR + Storm Surge Projections
MHHW + 36” ~9.5 feet 50-year storm Immediate (storm risk)
6” SLR + 25-year storm Before 2030
12” SLR + 5-year storm 2030–2040
18” SLR + 2-year storm 2040–2050
24” SLR + king tide 2050
36” SLR 2060–2070
MHHW + 42” ~10 feet (base flood 100-year storm Immediate (storm risk)
elevation) 42” SLR 2070
MHHW + 66” ~12 feet 24” SLR + 100-year storm 2050
30” SLR + 50-year storm 2060
36” SLR + 25-year storm 2060–2070
42” SLR + 5-year storm 2070
48” SLR + 2-year storm 2070+
52” SLR + king tide 2070+
66” SLR 2070+
Hazard Characterization and Risk Assessment | 4-24Flooding Scenarios: Timing for SLR
TWL Elevation (NAVD88)
SLR + Storm Surge Projections
MHHW + 108” ~15.5 feet 66” SLR + 100-year storm 2070+
84” SLR + 5-year storm 2070+
108” SLR 2070+
MHHW + 124” ~16.75 feet 84” SLR + 100-year storm 2100
Note: Sea level rise (SLR) projections correspond to medium-high risk aversion decision, high emissions scenarios
from Rising Seas in California: An Update on Sea-Level Rise Science (Griggs et al., 2017).
When selecting sea level rise projections to plan for the shoreline’s future, the CARP aligns with the
California OPC’s sea level rise guidance, giving more weight to the “medium-high risk aversion” scenario
and higher GHG emissions scenarios (OPC, 2018):
MHHW + approximately 24 inches of sea level rise by 2050; and
MHHW + 71 inches to 83 inches of sea level rise by 2100 (OPC guidance also recommends
considering storm surge in planning).
To help frame recommendations for adaptations in Alameda, the CARP describes strategies for
increasing resilience and specific actions the City can take to collectively implement those strategies to
address climate vulnerabilities. Distinguishing between actions and strategies helps illustrate how the City
can make concrete progress toward climate goals by implementing individual actions or projects within a
broader strategic approach.
Total Water Level Mapping
Figure 4-15 and Figure 4-16 show maps depicting inundation for four TWL scenarios: today’s MHHW
plus 24 in, 36 in, 77 in, and 108 in. Additionally, as described in the discussion below, while the current
FIRMs show us temporary 100-yr flood conditions as of today, they also show us a TWL scenario of
today’s MHHW plus 42 in. Refer to Appendix H.
The maps show us that at a TWL of 24 in above today’s MHHW, the main island can expect flooding to
impact Main Street and Alameda Point, particularly the Barbers Point Road residential area to the north
and the wetland/tarmac area along the southern shore. For Bay Farm Island, mainly the coastline north of
Doolittle Drive is affected.
At a TWL scenario of 36 in flooding is far more extensive, and affects slightly less area than what was
described previously for flood zone impacts shown on the current FIRMs (refer to Coastal Flooding
section). This is because a TWL of 36 in is just a few tenths of a foot lower than the BFE shown on the
FIRMs. Note: while the FIRMs represent temporary 100-yr flood conditions as of today, they also show us
what the permanent flooding extent is for a TWL scenario of 42 in: MHHW + 42 in sea level rise = TWL of
10 ft NAVD88, aka area covered by the blue shown on the FIRMs.
At a TWL scenario of 77 in, the main island sees approximately three-quarters of Alameda Point flooded
while northern shoreline flooding reaches as far as the Buena Vista Avenue neighborhood. The
southshore area and Crown beach is heavily inundated, and southshore flooding connects to an also
heavily inundated eastern end of the island. Bay Farm Island experiences flooding of properties along the
remainder of the lagoon system as well as inundation extending southerly of Mecartney Road to a greater
extent than shown on the FIRMs.
Hazard Characterization and Risk Assessment | 4-25Finally, at the 108 in TWL scenario the western half of the main island is flooded as well as the entire
southshore area, east end, and northern end of the island. The central portion of the island above
Elevation 15.4 ft NAVD88 remains unflooded. Bay Farm Island is approximately 80% flooded at this
scenario, since only a select few upland areas exist above Elevation 15.7 ft NAVD88.
Hazard Characterization and Risk Assessment | 4-26Figure 4-15 Maps depicting inundation for MHHW (6.4ft NAVD88) plus 24 in, 36 in, 77 in, and 108 in total water level scenarios for the
main island.
Hazard Characterization and Risk Assessment | 4-27Figure 4-16 Maps depicting inundation for MHHW (6.7ft NAVD88) plus 24 in, 36 in, 77 in, and 108 in
total water level scenarios for Bay Farm Island.
Impacts of Sea Level Rise on Groundwater Levels
Sea level rise can have a major impact on local and regional groundwater levels. Figure 4-17 shows the
relationship between sea level rise and groundwater in areas such as Alameda with shallow coastal
aquifers. As sea level rises the freshwater lens rises as well – even in areas that are not hydrologically
connected to the ocean. The magnitude of groundwater rise due to sea level rise varies based on local
geology and hydrology.
Hazard Characterization and Risk Assessment | 4-28Rising groundwater can damage underground assets like cables and pipes and increase the basement
flooding that many Alamedans already experience (see Figure 4-18). Depending on the thickness of the
freshwater lens and the rate of groundwater level rise, saltwater intrusion can corrode some metallic-
based infrastructure materials. High groundwater levels can also reduce the efficacy and capacity of the
stormwater system, potentially resulting in surface flooding.
Figure 4-17 Conceptual diagram of the relationship between sea level rise and groundwater,
highlighting the potential for flooding and inundation to occur in shallow areas that are not
hydrologically connected to the ocean (Habel et al., 2017).
Figure 4-18 Example of basement flooding, similar to what can be found in Alameda basements.
Photo Credit: Arthaey Angosii
Researchers at Silvestrum Climate Associates and the University of California, Berkeley collaborated on
the development of a high level, regional shallow groundwater layer in the San Francisco Bay Area using
groundwater monitoring well data. The results of the analysis, released in 2018, revealed widespread
shallow groundwater conditions along most of the shore of San Francisco Bay. As sea levels rise, the
groundwater surface will also rise, and these areas are at highest risk of experiencing impacts to buried
infrastructure, soil behavior, human health, and nearshore ecosystems. These areas are also at risk for
Hazard Characterization and Risk Assessment | 4-29flooding due to emergent groundwater. The findings of this high-level assessment highlighted the need to
understand the full range of sea level rise impacts for prioritizing adaptation investments, and selecting
appropriate strategies in coastal communities. The CARP recognized that many homes in Alameda are
already affected by groundwater and given the findings in the newly published research, recommended
further characterizing rising groundwater as a potential future hazard in Alameda’s climate change
vulnerability assessment.
The 2018 research revealed the City of Alameda is at-risk for rising groundwater in the face of climate
change. However, due to sparse well data within city limits, and a strong tidal and precipitation influence
within the Alameda soils, enhancements to the regional mapping were needed to characterize the shallow
groundwater layer in Alameda. Staff engaged Silvestrum Climate Associates to develop a more refined
model using geotechnical soil boring data collected throughout the City and the Oakland International
Airport. This local groundwater model was then used to assess the groundwater surface response to
various sea level rise scenarios. As the groundwater table rises, contaminants with the shallow
groundwater will rise closer to the ground. The potential for contaminants to become emergent was also
looked at.
The groundwater report finds that the areas at risk of future flooding increase by up to 25 percent when
considering emergent groundwater, and in certain areas this flooding occurs well before coastal
floodwaters overtop the shoreline. Rising groundwater, even before it is emergent, will affect below grade
infrastructure such as building foundations, basements and utilities. Figure 4-19 illustrates emergent
groundwater under 24, 36, 66, and 108-inch sea level rise scenarios.
The groundwater report recommends adaptation solutions to include in the next update to the CARP,
such as amendments to local building codes to address floodproofing and guidance for homeowners
regarding sump pumps. Other follow-ups to the groundwater report include, among other items,
integrating the study’s results into relevant chapters of the General Plan, further analyzing potential
landfill risks, and updating the digital elevation model used in the groundwater mapping given recent
changes in grade at the Corica Golf Course and other areas of recent land development.
Hazard Characterization and Risk Assessment | 4-30Source: The Response of The Shallow Groundwater Layer and Contaminants to Sea Level Rise, 2020.
Figure 4-19 Map depicting emergent groundwater for 24, 36, 66 and 108 inches of sea level rise
Hazard Characterization and Risk Assessment | 4-31Flood Risk Assessment
If 100-year floodwaters as modeled on the FEMA FIRMs were to enter along the northern shoreline’s
1,100ft long span of entry behind the Webster and Posey Tube portals, they would extend southerly down
Webster Street to the intersection of Atlantic Avenue by the College of Alameda, flooding the tubes as
well as affecting commercial businesses, and to a lesser extent residential buildings. While land elevation
ranges between 5 ft and 10 ft NAVD88 within this flood zone area, elevations of developed properties are
generally between 7 ft to 10 ft NAVD88, meaning that depth of flooding would be limited to 3 ft or less for
these properties (depending on the location) at the 100-yr flood event. The tubes however would be more
severely affected, as they descend to a depth such that the top of the tubes is at least 40 ft beneath the
northern shoreline ground surface. In a coastal flood event waters would enter the tubes via the Webster
and Posey portals and the extent/level of flooding within the tubes themselves would likely depend on the
elevation of floodwaters during the event and the amount of time the tubes were exposed to it.
Along the eastern shoreline, the 350 ft long entry span for the 100-year flood places roughly 250
residential homes in the Fernside Boulevard / Liberty Avenue neighborhoods within the flood zone.
Ground elevation ranges between 8 ft and 10ft NAVD88 in this area, meaning flooding at this event would
be limited to a depth of 2 ft or less for these residential properties.
On Alameda Point, 100-year floodwaters entering along the 1.5 mile stretch of Main Street to the north
and 1.6 mile stretch to the south would affect commercial businesses, industrial, residential, and City-
owned properties, and federal lands such as the Least Tern nesting habitat on the former airfield tarmac.
While elevations can be found as low as 5 ft NAVD88 on undeveloped properties within the Alameda
Point flood zone, elevations of developed properties are generally between 8 ft to 10 ft NAVD88, meaning
that depth of flooding would be limited to 2 ft or less at this event for developed properties with structures.
On Bay Farm Island, the interconnected 100-year flood zone spans a large enough area to include over
600 homes within it. Properties on Island Drive and Maitland Drive (south of the Chuck Corica Golf
Course) are at the lowest ground elevations, as low as 2 ft NAVD88. This means the event on Bay Farm
Island could result in a depth of flooding as great as 8 ft in these locations. However, several hundred of
the homes included in the flood zone are along Lagoon System 1 North and are generally between 8 ft
and 10 ft NAVD88 in elevation, meaning they would be subjected to a flood depth of 2 ft or less.
As described earlier, the current 100-yr flood event reaches the same elevation as a future TWL scenario
of 42 in would, and therefore similar flood depths/impacts would be expected for both scenarios.
Note that roadways serving the areas described above would also be flooded to various depths
depending on the road elevations. Roadways in the northern shoreline, eastern shoreline, and Alameda
Point areas will all experience flooding to a different degree. Similarly, the 3 major roadways that provide
egress from Bay Farm Island to the main island (and Oakland via Doolittle Drive) will experience flooding
to various degrees. This is explained in further detail in the detailed flood and sea level rise risk
assessment Appendix F and summarized below. Priority Coastal Inundation Locations are summarized
in Appendix G.
When floodwaters do occur, they result in the flooding of buildings, yards, and streets and can cause loss
of use and damage of contents of residences, commercial establishments, schools, and other buildings.
Floodwaters can damage underground utility boxes, prevent emergency circulation if streets are blocked,
Hazard Characterization and Risk Assessment | 4-32and release of hazardous material leachates. Recovery efforts may include removal of water, mud and
debris; removal of moldy building material; repair of salt water damage to electrical and telecom facilities;
and replacement of goods and furniture stored in low-lying areas.
Flooding affects natural shorelines as well. When erosive issues are at play from floodwaters, the
underlying berm fill material that the shoreline is composed of is eaten away and the integrity of the
shoreline is compromised. The effects are less pronounced with hardened shorelines such as riprap or
seawalls. With natural shoreline areas like the northern shoreline of Bay Farm Island, the erosion
becomes pronounced over time because there are not large boulders present to buffer the wave energy.
In turn, the protective distance between homes and the waterfront is lessened and the potential for
coastal flooding moving inland increased.
Additionally, high winds associated with storms can damage or knock down trees onto streets, power
lines or buildings. Storms combined with high tides can cause coastal erosion, beach loss, habitat loss,
shoreline street damage, shoreline trail damage, and marina damage.
Tsunamis
Hazard Description
Tsunami waves are triggered by ground displacements from large underwater earthquakes or landslides. 6
Tsunami waves do not “break” when they reach the shore like normal waves, instead they rush ashore
like a fast-rising tide with powerful currents that extends much farther inland than normal tides. Even small
tsunamis are associated with extremely strong currents capable of knocking someone off their feet.
Tsunamis impacting Alameda can result from offshore earthquakes within the Bay Area, or from distant
offshore subduction faults such as those in the Pacific Northwest, Alaska, Japan and South America.
Alameda will have several hours warning time for tsunamis generated in distant locations. Local tsunamis
can also be generated from offshore strike-slip faults within the Bay Area and would provide little warning
time. However, these faults are not likely to produce significant tsunamis because they move side to side,
rather than up and down, which is the displacement needed to create significant tsunamis. They may
have slight vertical displacements, or could cause small underwater landslides, but overall there is a
minimal risk of any significant tsunami occurring in the Bay Area from a local fault. The greatest risk to
Alameda is from events in the Cascadia subduction zone and the Aleutian Islands. These events could
generate significant tsunami waves that would reach Alameda within a few hours, providing short time for
evacuation.
Historic Tsunamis
Over 70 tsunamis have been observed or recorded within the San Francisco Bay in the past 200 years,
but none have caused significant damage in Alameda. Only two were recorded in the vicinity of Alameda
before 1946. One of questionable record was in 1868 with a latitude and longitude in the Bay near
Oakland Airport, listed as 4.5 feet, plus a sighting of unknown height at Government (Coast Guard)
Island. Another was recorded in 1898 in Oakland at 0.31 feet.
Since 1946, when record keeping increased, there have been 30 tsunamis within the San Francisco Bay,
and of those, about half have been recorded in Alameda or Oakland. Recorded heights at Alameda and
6 See: USGS, What are tsunamis?
Hazard Characterization and Risk Assessment | 4-33You can also read