Investors' Day Zurich, 20 November 2020 - Swiss Re

Page created by Barbara Schultz
 
CONTINUE READING
Investors' Day Zurich, 20 November 2020 - Swiss Re
Investors’ Day
Zurich, 20 November 2020
Investors' Day Zurich, 20 November 2020 - Swiss Re
Agenda – Investors’ Day 2020

        Time        Content                                     Management
    10:30 – 11:05   Group CEO update                            Christian Mumenthaler
    11:05 – 11:30   Financial strength and capital management   John Dacey
    11.30 – 11.50   Asset Management                            Guido Fürer
    11:50 – 12:30   Q&A session
    12:30 – 13:30   Break
    13:30 – 13:55   Group Underwriting                          Thierry Léger
    13:55 – 14:30   Reinsurance                                 Moses Ojeisekhoba
    14:30 – 14:50   Corporate Solutions                         Andreas Berger
    14.50 – 15.25   Q&A session
    15:25 – 15:30   Wrap-up                                     Christian Mumenthaler

                                                                         Investors' Day | Zurich, 20 November 2020   2
Investors' Day Zurich, 20 November 2020 - Swiss Re
Group CEO update
Christian Mumenthaler, Group Chief Executive Officer
Investors' Day Zurich, 20 November 2020 - Swiss Re
Key messages for today

• Very strong balance sheet and proactive approach to COVID-19 reserving allow for targeted growth

• We see positive rate momentum in P&C Re and expect a normalised combined ratio of ≤96% in 2021

• We continue to focus on profitable growth across regions in L&H Re and to manage in-force margins

• Corporate Solutions is well on track to achieve a normalised combined ratio of ≤98% in 2021

• iptiQ's strong growth trajectory continues with a market-implied valuation of USD ~2bn

• Swiss Re's investment portfolio is well-positioned to mitigate the current low interest rate environment

• We remain committed to our capital management priorities, focusing on superior capitalisation and a stable or
  increasing dividend

• Our risk insights and successful partnership approach complement our risk transfer proposition and position
  Swiss Re for long-term success

                                                                                     Investors' Day | Zurich, 20 November 2020   4
Investors' Day Zurich, 20 November 2020 - Swiss Re
COVID-19 crisis significantly impacts the risk landscape

              Key impact on re/insurance industry           Swiss Re response

               Less capital available near-term and         Maintain strong balance sheet and proactively
               significant uncertainty on ultimate losses   establish appropriate COVID-19 reserves

               Global insurance protection gap further      Continue to develop and promote
               increased                                    public-private partnership solutions
   COVID-19
     Text
               Increasing re/insurance demand with          Reinforce commitment to our digital B2B2C
               accelerated shift to digital channels        platform iptiQ

               Unprecedented low interest rates expected    Increase focus on underwriting margins and
               to remain for longer                         gradual strategic asset allocation repositioning

                                                                               Investors' Day | Zurich, 20 November 2020   5
Investors' Day Zurich, 20 November 2020 - Swiss Re
COVID-19 pandemic is still ongoing with more targeted restrictions and
expected claims impact in Q4
Business closings in Europe1
Number of countries
    30
    25
    20                                                                                                      • Data on business closings indicates that majority of business
    15                                                                                                        interruption losses were incurred in Q2
    10
     5
     0
                    Q1                       Q2                           Q3
                                                                                                            • Increasing restrictions in Q4 expected to lead to additional losses in
                Closing of all-but essential businesses              Closing of some sectors                  some business lines, although at a lower level compared to Q2
Excess mortality in the US, England and Wales2
% of expected                                                                                               • The US, England and Wales experienced the peak of excess mortality
 220%                                                                                                         at the beginning of Q2
 180%
                                                                                                            • Sharp increase in new cases in Europe and the US in Q4, however,
 140%
                                                                                                              impact on excess mortality remains to be seen
 100%

                    Q1                          Q2                          Q3
                                          US         England and Wales

  Majority of ultimate COVID-19 insurance losses are expected to have been incurred in Q2 2020

            1    Country universe includes EU, Switzerland and the UK; Source: University of Oxford, Swiss Re Institute; data until 9 November 2020
            2    Source: Office for National Statistics, Centers for Disease Control and Prevention; data until 23 October 2020                       Investors' Day | Zurich, 20 November 2020   6
Investors' Day Zurich, 20 November 2020 - Swiss Re
Our reported US GAAP COVID-19 claims and reserves have developed
broadly in line with our original assumptions
Swiss Re’s reported COVID-19 losses in 9M 2020
USD m, pre-tax

                                                                                                427                     2 969            2 969
                    IBNR       Paid & case reserves
                                                                                   667                                                   14%           Q3

                                                                    175                                                  67%
                                              1 019
                                                                                                                                         70%           Q2

                       681
                                                                                                                         33%
                                                                                                                                         16%           Q1

                 Event cancellation    Business interruption   Credit & surety   Mortality   Other lines                         Total

P&C Re                 325                     879                  29               -          354                             1 587

L&H Re                   -                      -                     -            655           34                               689
Corporate
                       356                     140                  146              -           36                               678
Solutions

  In US GAAP, we have booked COVID-19 losses of USD 3.0bn, representing the majority of the ultimate SST assumption

                                                                                                           Investors' Day | Zurich, 20 November 2020    7
Investors' Day Zurich, 20 November 2020 - Swiss Re
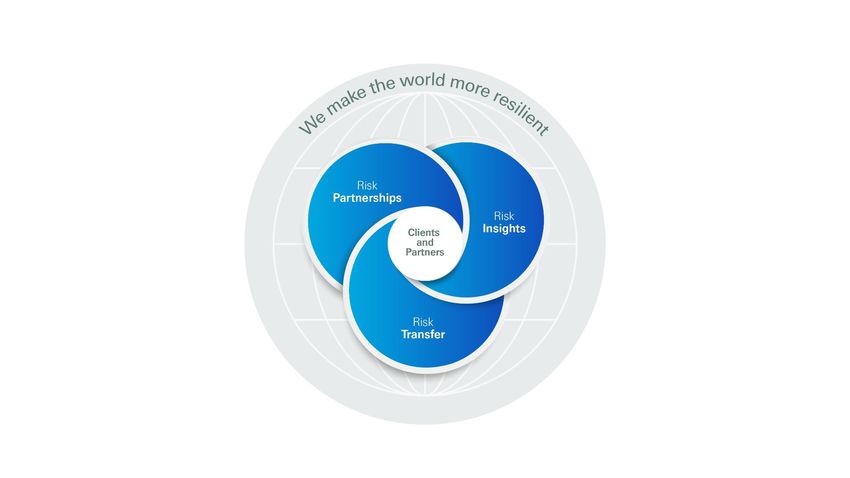
We expect the impact of additional waves in the coming quarters to be
manageable
                  Pre-tax US GAAP
                  losses booked in
                  9M 2020 (USD)

                                     • Majority of Q4 events already reflected in 9M US GAAP numbers
Event
cancellation
                    0.7bn            • Corporate Solutions with limited exposure in 2021 as book is in run-off
                                     • Ultimate loss assumption anticipates larger sports events to take place without spectators in 2021

                                     • Impact of additional waves expected to be lower driven by: i) shorter and more targeted restrictions,
Business                               ii) insurance policies have exhausted sub-limits and/or renewed with exclusions, iii) application of loss
interruption
                    1.0bn              occurrence/aggregation provisions in reinsurance treaties and/or treaties renewed with exclusions
                                     • Limited exposure in 2021 as vast majority of reinsurance treaties will have been renewed with exclusions

                                     • Excess mortality dependent on additional factors such as severity of flu season or availability of vaccine
Mortality           0.7bn            • Sensitivity: estimated USD 0.2bn pre-tax US GAAP losses per 100k excess deaths in the US

                                     • Possible additional adverse impact mainly on credit & surety and disability
Credit & Surety
and other lines
                    0.6bn            • Impact dependent on several factors, including government stimulus, vaccine availability and knock-on
                                       effects from lockdowns

                                                                                                                 Investors' Day | Zurich, 20 November 2020   8
Investors' Day Zurich, 20 November 2020 - Swiss Re
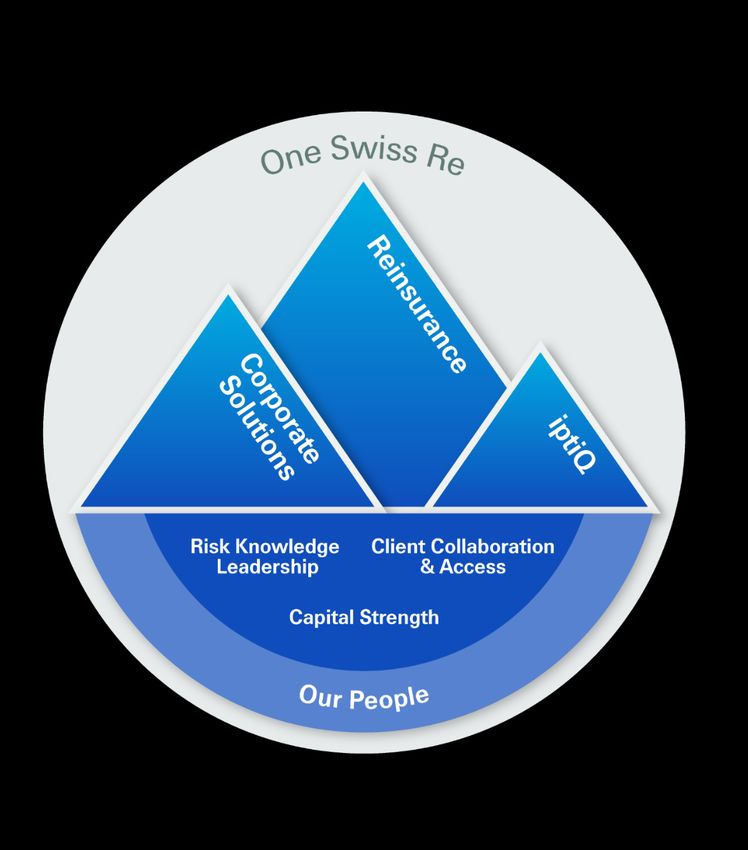
We aim to operate as ‘One Swiss Re’

                                Risk Knowledge
                                  Leadership
                                                   Client Collaboration
                                                        & Access

                                          Capital Strength
                                                                          Reinsurance           A leading global reinsurer
                                            Our People

                                                                                                A specialised risk partner with direct
                                Risk Knowledge
                                  Leadership
                                                   Client Collaboration
                                                        & Access

                                          Capital Strength
                                                                          Corporate Solutions   access to corporate customers
                                            Our People

                                                                                                A globally leading digital B2B2C
                                Risk Knowledge
                                  Leadership
                                                   Client Collaboration
                                                        & Access

                                          Capital Strength
                                                                          iptiQ                 insurance platform
                                            Our People

                                                                                                A balanced approach to accountability,
                                Risk Knowledge
                                  Leadership
                                                   Client Collaboration
                                                        & Access

                                          Capital Strength
                                                                          Group foundation      shared values and strengths
                                            Our People

                                                                                                      Investors' Day | Zurich, 20 November 2020   9
Investors' Day Zurich, 20 November 2020 - Swiss Re
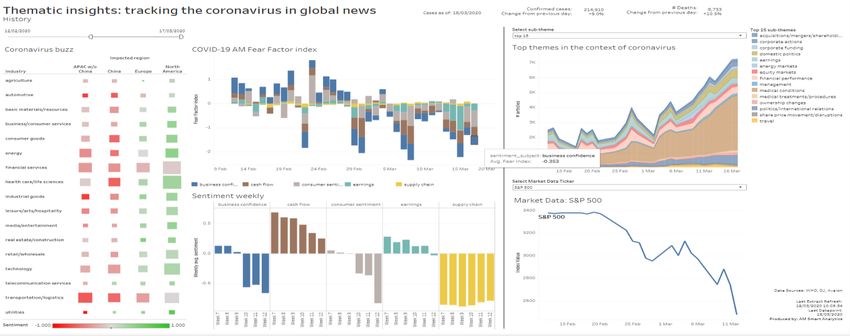
Reinsurance – a powerful franchise with unique competitive
                                           advantages
Risk Knowledge     Client Collaboration
  Leadership            & Access

          Capital Strength

            Our People

                                              Core strengths of Reinsurance

                                                                                  •   P&C Re is growing in a hardening market and addressing
                                             Global scale        Client access        underperforming portfolios

                                                                                  •   L&H Re maintains successful ROE and new business track record
                                                                                      despite COVID-19 impact, with positive medium-term outlook

                                                                                  •   We benefit from significant economies of scale from growing both
                                                                                      segments while maintaining our expenses flat

                                                                                  •   Deconsolidation of ReAssure significantly reduces financial market
                                          Risk diversification   Risk knowledge       risk, providing financial flexibility

     Reinsurance is the key contributor to our earnings power and is well-positioned to capture current growth opportunities

                                                                                                                          Investors' Day | Zurich, 20 November 2020   10
P&C Reinsurance – strong earnings power, supported by a hardening
                                                      market
  Risk Knowledge              Client Collaboration
    Leadership                     & Access

                   Capital Strength

                      Our People

We expect a normalised combined ratio1 of ≤96% in 2021

                                   25%

                                                                                                                                                                                                             •     At today’s investment returns, P&C Re
                                   20%
                                                                                                                                                                                                                   operates at ~16% normalised ROE
Normalised return on equity

                                                                                                                                        9M 20             FY 21

                                   15%
                                                                                                                                                                                     ROE
                                                                                                                                                                                                             •     A further 100bps reduction of the ROI2
                                                                                                          FY 19
                                                                                                                                                                                 target range
                                                                                                                                                                                   10-15%
                                                                                                                                                                                                                   would be compensated by a ~2.5%pts
                                   10%                                                                                                                                                                             combined ratio improvement
                                                                                    FY 18

                                             5%                                                                                                          with normalised ROI2                                •     Asset-liability duration of ~6 years implies
                                                                                                                                                         with 100bps lower normalised ROI2                         erosion of running yield will be gradual
                                                     102%          101%           100%            99%             98%            97%             96%            95%            94%             93%

                                                                                                          Normalised combined ratio1

          Improving underwriting margins and our ability to leverage scale provide basis for increasing profitability
                                                        1   Assuming an average large nat cat loss burden and excluding (i) prior-year reserve development and (ii) the COVID-19 impact;
                                                            FY 2019 combined ratio adjusted for impact of adverse development cover with Corporate Solutions                                                                  Investors' Day | Zurich, 20 November 2020   11
                                                        2   ROI = return on investments; adjusted for fixed income and FX realised gains/losses and replaced equity (un)realised gains/losses with expected equity returns
L&H Reinsurance – we continue to focus on profitable growth across
                                           all regions and to manage in-force margins
 Risk Knowledge     Client Collaboration
   Leadership            & Access

           Capital Strength

             Our People

L&H Re has delivered strong results

                              18%

                              16%                                                                             •   Earnings expected to return to target range in
                              14%                                                                                 2021, medium-term outlook positive
                              12%
Return on equity

                                              ROE target range
                                                 10-12%
                                                                                                              •   Strong annual new business generation with
                              10%
                                                                                                     excl.        average economic profit of USD 1bn since 2015
                                       8%                                                          COVID-19

                                       6%
                                                                                                              •   New business has improved the attractiveness and
                                       4%
                                                                                                                  earnings diversification of in-force portfolio
                                       2%                                                                     •   ~25% premium growth and cost discipline results
                                           2015            2016   2017               2018   2019      9M
                                                                                                                  in a ~2%pts lower operating cost ratio since 2015
                                                                                                     2020
                                                                    Financial year

      Build on successful track record through attractive new business generation and in-force management

                                                                                                                                    Investors' Day | Zurich, 20 November 2020   12
Corporate Solutions – specialised risk partner that enables
                                           Group-wide strategic engagement with corporate customers
 Risk Knowledge     Client Collaboration
   Leadership            & Access

           Capital Strength

             Our People

Strategic repositioning of Corporate Solutions
                   Expertise
                    focused

                                                                           In the future
                                                                                                             Key elements of repositioning

                                                                                             2012-2019       •   Focus on segments with clear competitive advantage
                   Product offering

                                                                                                             •   Growth to be driven by Primary Lead expansion
                       Type of

                                                                                                                 supported by proven technology
                                                                                                             •   Fostering a more disciplined and data-driven
                                                                                                                 underwriting culture

                                                                              pre-2012                       •   Leveraging our direct access to corporates for the entire
                   Capacity
                   focused

                                                                                                                 Swiss Re Group

                                            (Multi-)specialist   Range of product offering   Comprehensive

                                                                                                                                            Investors' Day | Zurich, 20 November 2020   13
Corporate Solutions – management actions and strong price
                                                    momentum have significantly improved underlying profitability
 Risk Knowledge              Client Collaboration
   Leadership                     & Access

                  Capital Strength

                     Our People

Well on track to achieve 2021 combined ratio target1

                                      112%

                                                                                                                                                                    •     85% of portfolio pruning to be realised by the end of 2020
Normalised combined ratio1

                                      108%
                                                                                                                                                                    •     On track to achieve communicated gross cost savings
                                      104%                                                                                                                          •     Current reinsurance structure reduces earnings volatility

                                      100%
                                                                                                                                                                    •     Supported by strong price momentum (+15% achieved YTD)

                                                          ≤98% target for 2021                                                                                      •     Favourable prior-year development in 9M 2020
                                                96%

                                                                                                                                                                    •     Uncertainties related to unique nature of claims development
                                                92%                                                                                                                       in 2020
                                                  2015                 2016               2017               2018               2019               9M
                                                                                                                                                  2020
                                                                                                Financial year

          Corporate Solutions turnaround is ahead of plan, supported by broad-based rate hardening and portfolio pruning actions

                                                      1   Assuming an average large nat cat loss burden and excluding (i) prior-year reserve development and (ii) COVID-19 impacts; 2019 adjusted for ADC premium and
                                                          restructuring costs                                                                                                                                           Investors' Day | Zurich, 20 November 2020   14
iptiQ – a global B2B2C digital insurance platform aimed at both
                                          digital and traditional affinity distribution partners
Risk Knowledge     Client Collaboration
  Leadership            & Access

          Capital Strength

            Our People

B2B2C model                                                                         Global expansion accelerating

                                                                                    •   iptiQ will become a standalone division, reporting directly to
                                                      Corporates         Insurers
                                                                   B2C                  the Group CEO
                                                B2B
                                                                                    •   Successful launch of iptiQ P&C in Europe with 6 distribution
                                                                                        partners already live

                                                      Ecosystems         Banks      •   COVID-19 accelerates shift to digital sales distribution
                                                                                        channels, providing further long-term growth opportunities

         >500k customers with 40 partners in 5 markets
     We are further expanding our B2B2C offering while increasing scale of our existing partnerships

                                                                                                                     Investors' Day | Zurich, 20 November 2020   15
iptiQ – based on growth trajectory and peer valuations we estimate a
                                           market-implied valuation of USD ~2bn
 Risk Knowledge     Client Collaboration
   Leadership            & Access

           Capital Strength

             Our People

Strong growth trajectory since inception                                                                                                     Attractive peer valuations

                                                                                                                                                                                             20x
                                                                                                                 >300
         Gross                                                                 CAGR +75%
         premiums                                                                               211
         written1
         (USD m)
                                                                             89
                                                                                                                                                                                                                      USD
                                                                                                                                                                           7x blended average

                                                                                                                                                                                                             ~2bn
                                                          61                                                                                                7x
                                                                                                                                                            5x
                                                        2017               2018               2019             2020E2                                                                        3x
         # of
         partners
                                                          12                 19                 29                 40
                                                                                                                                                  Listed peers3                Unlisted peers4
                                                                                                                                                                                                          market-implied
                                                                                                                                                                                                            valuation
                                                  USD >300m                                                                                                          5-7
                                                            2020E GPW1,2
                                                                                                                                    X                     conservative
                                                                                                                                                      price/GPW multiple
                                           1 Core business only
                                           2 Number of partners as of 9M 2020, GPW FY 2020 extrapolation based on 6M 2020
                                           3 Listed peers based on publicly available information, including Lemonade and Root (both adjusted for operating model differences) as well as Lifenet
                                                                                                                                                                                                    Investors' Day | Zurich, 20 November 2020   16
                                           4 Unlisted peers based on latest available funding rounds, including Hippo, Next Insurance, Clover and wefox
Our strategy offers more than traditional risk transfer

                                                                                       sigma research
                                                                                       SONAR
                                                                                       New emerging risks insights

                                                                                                   SwiftRe®
                                                                                              Surety Client Portal
                                                                       Magnum
                                                                                             Ex Tool
                                                                      CatNet®                MPL for explosions

                                                                  PUMA                             FacEasy
                                                                  Engineering underwriting
                                                                                             PULSE
                                                                                             Online risk management

                      Public sector   Traditional risk   Large and complex
                      risk transfer      transfer           transactions
                                                                                         Investors' Day | Zurich, 20 November 2020   17
Swiss Re is progressing towards net-zero emissions across our business

Business areas                          Commitments                                                                                     Recent initiatives

                                                                                                                                                Exclude support to most carbon intensive oil and
Underwriting                                UN Business Ambition for 1.5°C pledge
                                                                                                                                                gas companies1

Asset Management                            Net-zero Asset Owner Alliance (AOA)                                                                 Co-led development of AOA Target Setting Protocol
                                                                                                                                                enabling reduction target setting for 2025

                                                                                                                                                100% powered by renewable energy and 30%
Operations                                  Net-zero operations
                                                                                                                                                CO2 reduction target for air travel for 20212

                                                                     2030                                           2050

       1   Swiss Re will exclude business support to companies producing the world’s 5% and 10% most carbon intensive oil and gas from July 2021and July 2023, respectively
       2   100% renewable power used for Swiss Re’s own operations from 2020 (RE100); CO2 reduction target relative to air travel levels as at FY 2018                        Investors' Day | Zurich, 20 November 2020   18
We drive sustainability leadership across the industry with pioneering
initiatives
Recent initiatives                                                                                                                 External recognition

First multinational company to announce triple-digit real carbon levy1

                                  •      Internal carbon levy to increase to USD 100/tonne as of 2021,
                                         and to gradually increase to USD 200/tonne by 2030
                                                                                                                                              July 2020
                                  •      Incentivises emission reductions in operations
                                  •      Generates funding to compensate residual emissions via carbon
                                         removal (100% by 2030, in line with our net-zero target)

Biodiversity and Ecosystem Services (BES) Index launched

                                  •      Swiss Re Institute study assesses risks of biodiversity and
                                         ecosystem services decline
                                  •      BES Index available to clients as part of CatNet®
                                  •      Enables businesses and governments to factor in biodiversity
                                                                                                                           Read more about the renewed Group
                                         and ecosystem issues into economic decision-making                                Sustainability Strategy here

         1   Based on a Swiss Re analysis of CDP Climate Change questionnaires submitted for the 2020 disclosure cycle   Investors' Day | Zurich, 20 November 2020   19
Financial strength and capital management
John Dacey, Group Chief Financial Officer
Economic earnings have comfortably covered ordinary dividends in the
last 5 years, even in a difficult environment
Group capital generation since beginning of 2015
                                                                                                                                                                             1• Generated USD ~12bn of economic
                                       1                2               3               4               5                                                                         earnings since 2015, despite above-
                                                                                                                                                                                  average nat cat losses and COVID-19
                     46.0
                                                                                                                                                        37.6                 2• Economic earnings covered 130% of
SST available
   capital                                                                                                                                                                        ordinary dividends; share repurchases
 (USD bn)1                                                                                                                                                                        served as a tool to reduce excess capital
                                                                                                                                                                                  towards target level
                     SST          Economic          Capital      Capital   ReAssure                  FX and           Other           Change           SST
                   1/2015          earnings      repatriation2 deployment3   sale4                   interest      (incl. model      in suppl.       7/2020                  3• Selectively deployed capital to
                                                                                                      rates5         changes)         capital
                                                                                                                                                                                  underwriting risks in an improving
                                                                                                                                                                                  market environment
  SST ratio          271%          +76%pts          -81%pts          -85%pts        +34%pts          -23%pts         +33%pts           -4%pts           223%

                                                                                                                                                                             4• Successful ReAssure sale has
                     17.0                                                                                                                               16.8
                                                                                                                                                                                  significantly lowered the Group’s
SST economic                                                                                                                                                                      financial market risk
target capital
  (USD bn)1                                                                                                                                                                  5• Lower interest rates with significant
                     SST                                           Capital   ReAssure                FX and           Other                            SST                        impact on headline ratio, but this relates
                   1/2015                                        deployment3   sale4                 interest      (incl. model                      7/2020                       primarily to capital costs (not to actual
                                                                                                      rates5         changes)
                                                                                                                                                                                  increases in technical provisions)

           1   SST available capital: SST risk bearing capital – MVM; SST economic target capital: SST target capital – MVM
           2   Assumes pro-rata ordinary dividend to be paid in 2021
           3   SST available capital: change in MVM from business update; SST economic target capital: change in shortfall from business update and market moves e.g. in credit spreads
           4   Including stake sale to MS&AD Insurance Group Holdings Inc and sale to Phoenix Group Holdings plc                                                                          Investors' Day | Zurich, 20 November 2020   21
           5   Foreign exchange impact on SST available capital and interest rate impact on valuation differences between EVM and SST
Strong capital generation and liquid funds at Group level have provided
the basis for attractive capital repatriation track record
Excellent track record of external capital repatriation                                                                                                        Liquid funds at Group level
USD bn, in year paid                                                                                                                                           USD bn
                                                                         2.9
                                          2.7            2.6                              2.6
                                                                                                        2.0                                                                       4.1
                                          1.1            1.1             1.3              0.9                    Share buyback and
                                                                                                       0.21
                                                                                                                 special dividend
                                                                                                                                                                                                 Life Capital dividend
                                          1.6            1.6             1.6              1.7           1.8      Ordinary dividend                                                1.5
                                                                                                                                                                                                 paid in 2020

                                        2016            2017           2018            2019           2020
                                         3.30           3.40            4.20           3.10            0.60
         per share in CHF
                                         4.60           4.85            5.00           5.60            5.90

                                                                                                                                                                                  2.7            Other free funds
                                                                      Swiss Re
Internal dividend flows (USD bn, in year paid)
              Reinsurance                                     Corporate Solutions                                       Life Capital
   2.9      2.6        2.0       1.7      1.7         0.3       0.2       0.1       0.0         0.0        0.4       1.1       1.1       0.5      1.5
                                                                                                                                                                                9M 2020

 2016      2017      2018      2019      2020        2016      2017      2018     2019      2020         2016      2017      2018      2019      2020

                                                    Capital contributions of USD 1.0bn                   Capital contribution of USD 1.6bn
                                                                                                                                                                      Swiss Re Ltd holds sufficient liquid funds to
                                                     in 2017, USD 0.6bn in 2019 and                      in 2016 for Guardian acquisition                              cover more than 2x the ordinary dividend
                                                            USD 0.3bn in 2020                            and USD 1.1bn in 2017 – 2020
              1   Remainder of the first tranche of the 2019/2020 share buyback programme; second tranche of the 2019/20 share buyback programme has been cancelled            Investors' Day | Zurich, 20 November 2020   22
The Group’s capital efficiency has improved

Group SST ratio1 development
USD bn unless otherwise stated
                                                                                                                                                 illustrative
     271%                                                            269%
                           261%                 262%
                                                                                         251%
                                                                                                                                                                                    • SST available capital decrease
                                                                                                              232%
                                                                                                                                  223%
                                                                                                                                                                Group SST target      mainly driven by the impact of
                                                                                                                                                                 capitalisation2
                                                                                                                                                                    220%
                                                                                                                                                                                      COVID-19 losses

                                                                                                                                                                  Management        • SST economic target capital
  46.0                  44.8                46.1                 46.3                                                                                            authorised limit     decrease reflects the sale of
                                                                                     40.6                 41.9
                                                                                                                              37.6
                                                                                                                                                                     200%             ReAssure

                                                                                                                                                                                    • MVM3 increase mainly due to
                                                   17.6                                                          18.0
                                                                                                                                                                                      decreasing interest rates
         17.0                  17.2                                     17.2                 16.2                                     16.8

   1/2015                1/2016               1/2017              1/2018               1/2019              1/2020               7/2020

  USD 6.6bn             USD 5.3bn            USD 5.2bn           USD 5.9bn            USD 7.0bn           USD 9.4bn           USD 11.6bn
    MVM3                  MVM3                 MVM3                MVM3                 MVM3                MVM3                MVM3

                                          SST available capital                 SST economic target capital

                1   Group SST ratio calculation: SST available capital / SST economic target capital = (SST risk-bearing capital – MVM) / (SST target capital – MVM)
                2   SST 220% target capitalisation was introduced in 2017                                                                                                           Investors' Day | Zurich, 20 November 2020   23
                3   MVM = Market Value Margin = minimum cost of holding capital after the one-year SST period until the end of a potential run-off period
Group SST capital generation impacted by COVID-19 and low interest
rates
Group capital generation in H1 2020

                                    41.9
                                                            -0.5
                                                                                    -3.1                                                                                                                                37.6
                                                                                                            -1.3                                                                    +1.0               -0.1
                                                                                                                                    -0.5                    +0.3
   SST available
      capital
    (USD bn)1
                             SST 1/2020              ReAssure sale             Economic    FX and interest                      Capital                Other (incl.           Change in              Capital        SST 7/2020
                                                                                earnings    rate impact2                      deployment3               valuation           supplementary         repatriation5
                                                                             (Contribution                                                            differences)4            capital
                                                                                to ENW)

       SST ratio                   232%                   19%pts                  -19%pts                 -16%pts                 -10%pts                 +11%pts                 +6%pts              0%pts             223%

                                   18.0
                                                                                                                                                                                                                        16.8
  SST economic                                              -1.5                                            +0.6                    +0.5                    -0.8
  target capital
    (USD bn)1
                             SST 1/2020              ReAssure sale                                  FX and interest             Capital                    Other4                                                   SST 7/2020
                                                                                                     rate impact              deployment3

         1   SST available capital: SST risk bearing capital – MVM; SST economic target capital: SST target capital – MVM
         2   Foreign exchange impact on SST available capital and interest rate impact on valuation differences between EVM and SST
         3   SST available capital: change in MVM from business update; SST economic target capital: change in shortfall from business update and market moves e.g. in credit spreads
         4   Includes model changes                                                                                                                                                     Investors' Day | Zurich, 20 November 2020   24
         5   Assumes pro-rata ordinary dividend to be paid in 2021
Swiss Re’s dynamic capital structure provides significant financial
flexibility
Group available capital and leverage                                                                                               Strong access to diversified funding sources
USD bn

     48.7                   47.8                                                                                                    • Despite COVID-19 market turbulence, Swiss Re raised EUR 800m
         4.6                 1.9                                         Additional USD 2.7bn                                         of subordinated debt to support growth opportunities
                             3.1                42.0                    pre-funded subordinated
         4.1                                                            debt available on demand
                             6.7
                                                 0.8
                                                 3.1
                                                                                                                                    • Strategic issuance of SGD 350m of subordinated debt in June also
         4.0                                                                                                                          highlights our ability to access diversified sources of funding
                                                 6.5
     36.0                   36.1
                                                31.6                      LOC1
                                                                          Senior debt                                             Funding tool                                 Outlook
                                                                          Subordinated debt2
                                                                          Core capital3                                                                                          Continued focus on optimising cost of
                                                                                                                                    Subordinated leverage
     26%
                             24%                25%
                                                                           Total leverage       ratio4                                                                           capital and funding business growth

                                                                                                                                    Senior leverage                              Focus on continued reduction

     2018                   2019               2020E

Continued focus on financial flexibility through our prudent approach to leverage and strong access to diversified funding sources
               1   Unsecured LOC usage and related instruments                    3   Core capital is defined as economic net worth (ENW); 2020E shows Q3 ENW estimate
               2   Funded subordinated debt and contingent capital instruments,   4   Total on-balance sheet senior and subordinated debt and contingent capital, including drawn LOCs
                                                                                      divided by total capitalisation
                                                                                                                                                                                         Investors' Day | Zurich, 20 November 2020   25
                   excluding non-recourse positions
Alternative Capital Partners (ACP) is our unified centre of expertise in the
alternative capital space

                                                                                                Increased presence in the alternative capital market

                                                                                                                   Principal investor in ILS1                    ILS structurer and bookrunner2
               AC market leadership
                                                                                                           1.5                                                   9                      +10%

                                                                                                                                                                 8
    Knowledge and reputation are the
                                                                                                                                                                 7
 foundations for fast access to AC market                                                                                              +80%
                                                                                                           1.0                                                   6

                                                                                                  USD bn

                                                                                                                                                        USD bn
                                                                                                                                                                 5
 • Arranger and structurer for our clients
   1st cat bond structured in 1997                                                                                                                               4

 • Principal investor                                                                                      0.5                                                   3

   1st investments in ILS ~20 years ago                                                                                                                          2

                                                                                                                                                                 1

                                                                                                           0.0                                                   0
                                                                                                                          2018                H1 2020                         2018              H1 2020

        1   Portfolio is composed of tradable securities and other index-based private transactions (e.g. ILW)
        2   ILS outstanding notional structured by Swiss Re Capital Markets (structuring agent and/or bookrunner of outstanding ILS bonds)                           Investors' Day | Zurich, 20 November 2020   26
ACP has sourced more than USD 2bn of additional alternative capital in a
challenging market environment since 2018

                                                                        Nat cat growth supported by our increasing sidecar platform and cat bond issuances

                                                                                 Outstanding nat cat bonds1
             Exposure management
                                                                                 2.0
                                                                                 1.5                          Expand risk-sharing                         Shortfall relief North

                                                                        USD bn
  Support growth in a risk controlled-                                           1.0                               platform                                Atlantic hurricane3
   manner and generate additional                                                0.5                          • New vehicles will focus
                                                                                                                                                          4        +146%
              revenues                                                           0.0                            on increasing
                                                                                          2018      H1 2020     permanency of third-
                                                                                                                party capital                             3

                                                                                                                                                 USD bn
• We manage our net risk exposure by                                                    Sidecar platform2     • Will allow investors to
                                                                                                                                                          2
  ceding excess risks to ACP investors                                                                          participate alongside
                                                                                  2.0                           Swiss Re
                                                                                                 +144%                                                    1
• Attractive returns for ACP investors                                            1.5                         • Innovation will enable
                                                                        USD bn

  and Swiss Re shareholders                                                       1.0
                                                                                                                ease of capital raising
                                                                                                                throughout the year                       0
                                                                                  0.5                                                                          2018    H1 2020
• We earn a commission or spread
                                                                                  0.0
  between risk taking and hedging                                                          2018     H1 2020

       1   Notional outstanding
       2   Based on valuations as at 31 December 2018 and 1 July 2020                                                                 Investors' Day | Zurich, 20 November 2020    27
       3   Standalone shortfall
ACP acts as a significant extension of our capital structure

                                                                     Supporting efficient capital structure

                                                                                       Total capital relief at target level1
                Capital efficiency
                                                                                     2.5                  +75%

   Find alternative sources of capital below our                                     2.0
     WACC and improve our overall portfolio
                   diversification
                                                                                     1.5

                                                                            USD bn
 • Assessing capital efficiency opportunities in
   all lines of business to improve our                                              1.0
   economic capital usage
                                                                                     0.5
 • Executed successful pilot with issuance of
   a combined extreme mortality and North
   Atlantic hurricane cat bond                                                       0.0
                                                                                                2018              H1 2020

        1   Capital relief at Group target level of 220% SST ratio                                                   Investors' Day | Zurich, 20 November 2020   28
Substantial decrease in market and credit risk following the sale of
ReAssure provides financial flexibility
Group SST economic target capital1
USD bn                                                                                         • Increase in P&C risk mainly driven by nat cat growth and reserves
                                                                                                 for COVID-19 losses
 Property & Casualty               12.4                                              +0.7
                                                                                               • L&H risk increase mainly reflects lower interest rates and new
                                                                                                 business in the US and Canada
         Life & Health                                  11.4                         +1.6
                                                                                               • Financial market risk and credit risk decreases are mainly due to
   Financial market                                                8.9               -2.3
                                                                                                 the sale of ReAssure

                  Credit                                                    3.0      -0.5          Swiss Re shortfall by line of business1
          Total pre-                                                                               USD bn
     diversification
                                   35%                  32%        25%      8%       -0.6
                                                                                                                                   Other credit 3%
      Diversification                                               -15.1                                     Credit & surety 4%                     Property 16%

 Swiss Re shortfall           34%         34%        24% 7% 20.6                     -0.7
                                                                                                   Financial market 24%
    SST adjustment                                          -3.8                                                                                          Casualty 15%
                                                                                                                                    20.6
     SST economic
      target capital
                                       16.8                                          -1.2
                                                                                                                                                       Specialty 3%
                                                                                   Change to                   Health 5%
                                SST 7/2020
                                                                                  SST 1/2020

                                                                                                                                   Life 29%
              1   as of 1 July 2020 post sale of ReAssure                                                                            Investors' Day | Zurich, 20 November 2020   29
Changes in reporting structure following Life Capital disbandment

                            Current (as of Q3 2020)                                                                                                                  Planned future (2021)
                                               Corporate                                                                                                                                    Corporate
   P&C Re                L&H Re                                        Life Capital           Group items                                          P&C Re                  L&H Re                             Group items
                                               Solutions                                                                                                                                    Solutions

                                                                     Phoenix shares                                                                                                                         Phoenix shares1

                                                                                                                                                                                                              Admin Re US

                                                                      Admin Re US

                                                                                           Estimated key metrics2
                                          USDm                   Net premiums earned                           Earnings before taxes4                          Shareholders’ equity

                                           iptiQ                              450                                           -200                                           700

                                         elipsLife                           1 000                                             0                                           300

                                     Admin Re US3                             150                                             25                                           700

      1   Phoenix shares to be reported in Principal Investments portfolio in Group items already as of Q4 2020
      2   Figures shown are high level near-term estimates based on current projections; Core business only for iptiQ
      3   Admin Re US net premiums earned includes fee income; this block is in run-off and does not write new business
      4   In addition to iptiQ and Admin Re US, Group items will also include Principal Investments (including Phoenix shares), income from trademark license fees and other Group   Investors' Day | Zurich, 20 November 2020   30
          expenses; earnings impact of these additional items expected to be broadly neutral, assuming normal volatility in Principal Investments returns
Our Group targets and capital management priorities remain unchanged

Group financial targets                                                                              Capital management priorities

 Over-the-cycle targets                                                                                      Priority I                                                               Priority II

                                                                                                               Ensure superior capitalisation           Grow the regular dividend
                  Rf + 700                                                                                       at all times and maximise             with long-term earnings, and

                     bps                                                                                             financial flexibility              at a minimum maintain it

                     Return on equity1                                                                                                           Capital
                                                                                                                                               management
                                                                                                                                                priorities
                                                                                                                                                             Deploy capital for
                                                                                                                          Repatriate further
                             10%                                                                                          excess capital to
                                                                                                                                                          business growth where
                                                                                                                                                         it meets our strategy and
                                                                                                                            shareholders
                ENW per share growth2                                                                                                                        profitability targets
                                                                                                            Priority IV                                                               Priority III

         1   700bps above 10y US government bonds. Management to monitor a basket of rates reflecting Swiss Re’s business mix
         2   The 10% ENW per share growth is calculated as: (current-year closing ENW per share + current-year dividends per share) /                   Investors' Day | Zurich, 20 November 2020    31
             (prior-year closing ENW per share + current-year opening balance sheet adjustments per share)
Asset Management
Guido Fürer, Group Chief Investment Officer
Asset Management demonstrated success on key metrics for 9M 2020

         3.4%                                               ROI remains solid, with investment portfolio providing consistent returns
                    ROI

   USD 27m                                                  Negligible net exposure to sensitive sectors such as airlines, gaming or leisure
              impairments
Swiss Re’s high-quality investment portfolio has performed consistently
amid market volatility and the low interest rate environment
Key performance indicators over 5 years                                                                       Fixed income maturities and unrealised gains
Return on investment (ROI)1                                                                                   Duration split of fixed income maturities

                      3.6%                              3.0%                                                                                                                44%
                    Swiss Re average                   Peer   average2
                                                                                                                                              36%
                                                                                                                                                                                                                        72%
                                                                                                                                                                                                                    unrealised gains with
                                                                                                                                                                33%
                                                                                                                                                                                                                     maturity >10 years
Excess return (LHS) and Sharpe ratio (RHS)1                                                                                                                                                                            End 9M 2020
                                                                                                                                        26%
      2.5%                                                                     1
                             0.8                                                                                                                                                                  Swiss Re
      2.0%                                                                     0.8                                                                                                                Peer average2             USD
                                                                                                                                                          18%                     18%
      1.5%                                                 0.5                 0.6
                                                                                                                      12% 13%                                                                                          6.7bn
      1.0%                                                                     0.4                                                                                                                                  net unrealised gains
                                                                                                                                                                                                                      End 9M 2020
      0.5%                                                                     0.2
                            1.9%                          1.1%
      0.0%                                                                     0
                                                                                                                       < 1 year        1 - 5 years       5 - 10 years      > 10 years
                   Swiss Re average                 Peer average2

 • Outperformed peers over the last 5 years on both ROI and excess                                             • Long-maturity fixed income portfolio extends annual maturities well into the future
   return (with higher Sharpe ratio)
                                                                                                               • Significant unrealised gains position on long-maturity fixed income supports our running
 • Fixed income impairment rate (average 1bp over last 5 years) lower                                            yield’s persistency
   than historical A-rated corporate bond defaults (14bps)

             1   Average ROI, excess return and Sharpe ratio calculated over the period 2016 to 9M 2020; excess return is portfolio total return above performance of a risk-free benchmark,
                 aligned with liability duration (excluding FX)                                                                                                                                Investors' Day | Zurich, 20 November 2020    34
             2   Peer group includes Hannover Re, Munich Re and SCOR
Investment portfolio positioned for opportunistic deployment within a fast-
developing risk environment
Investment portfolio positioning                                                                                 Fixed income portfolio rating split
USD bn                                                                                                           End 9M 2020
                                                     117.6
120                109.9                                 0.4
                                                  12.1                                                                         3%
                       0.5                                                                                                       2%       15%
                11.5
100

                                                      37.4                                                          22%
 80                35.6                                                   Other                                                                                  AAA
                                                                          Equities and alternatives (incl. PI)                                                   AA
                                                                          Credit investments                                                                     A
 60
                                                                          Government bonds                                                                       BBB
                                                      46.6                Cash and short-term investments                                                        < BBB
 40                49.0                                                                                                                                          NR incl. catastrophe bonds
                                                                                                                      18%                       40%
 20
                                                      21.1
                   13.3
  0
               End FY 2019                        End 9M 2020
             ReAssure excluded                  ReAssure excluded

• Defensive portfolio positioning through COVID-19 resulted in larger cash and short-term position,              • 95% of the fixed income portfolio is investment grade
  enabling deployment into yield enhancement opportunities across asset classes and regions
                                                                                                                 • Stable rating mix maintained throughout the crisis
• Credit/equity overlay hedges implemented during the first half of 2020 partially maintained in
  anticipation of future volatility                                                                              • Downgrades mitigated through targeted reductions

                                                                                                                                      Investors' Day | Zurich, 20 November 2020        35
Pioneering ESG approach delivers better risk-adjusted returns while
providing downside protection
ESG investments outperform during key periods of high volatility                                                                                                Swiss Re’s YTD ESG outperformance
Cumulative excess return of ESG-based indices vs traditional indices

 7.0%                                                                                                                                        0.7%

                                                                           Equity1 (LHS)
 5.0%                                                                                                                                        0.5%
                                                                                                                                                                        Equity1
                                                                           Credit2   (RHS)
 3.0%                                                                                                                                        0.3%
                                                                                                                                                                     +1.1%
 1.0%                                                                                                                                        0.1%
                                                                                                                                                                    during 9M 2020
 -1.0%                                                                                                                                       -0.1%

 -3.0%                                                                                                                                       -0.3%
    Dec 14        Jul 15       Feb 16       Sep 16       Apr 17       Nov 17         Jun 18     Jan 19       Aug 19       Mar 20       Sep 20                                                     Credit2

 Sharpe ratios since benchmark transition3                                                    Equity1                         Credit2
                                                                                                                                                                                           +0.2%
 A) ESG-based indices                                                                          0.43                            0.20                                                        during 9M 2020
 B) Traditional indices                                                                        0.38                             0.18

 Difference A) - B)                                                                  0.05 (+12%)                      0.02 (+10%)

             1   ESG index ‘MSCI ACWI ESG Leaders’ vs traditional index ‘MSCI ACWI Index’
             2   ESG index ‘Bloomberg Barclays MSCI US Corp Sustainability BB and Better Int.’ vs traditional index ‘US Corp Int.’                                        Investors' Day | Zurich, 20 November 2020   36
                                                                                                                                                                                                                      36
             3   Data based on annualised Sharpe ratios over risk-free benchmark; Swiss Re transitioned to ESG benchmarks in 2017; June 2017 - September 2020
We target outperformance through a set of key initiatives

Further build-up in      • Selective growth in private debt and private equity, focusing on price and quality
private markets          • Expansion of infrastructure mandate and opportunities such as mid-market loans

Geographic               • Balanced portfolio shift towards global GDP, including increase in High Growth Markets
diversification          • Global portfolio to conform to ESG and net-zero ambitions

Increased focus
                         • Build on successful implementation of ESG approach along new, high-potential themes
on thematic
                         • Leverage proprietary data to invest around select themes, e.g. Healthcare, Digital Infrastructure
investing

Technology
                         • Leverage advancements in big data and smart analytics across the investment process
enabling
                         • Deploy real-time analysis and proprietary tools/data to enable differentiated decision-making
outperformance

                                                                                      Investors' Day | Zurich, 20 November 2020   37
Our smart analytics tools help us generate actionable portfolio insights
             In February 2020, smart analytics methods applied to big data enabled us
             to capture the real-time impact of COVID-19 on financial markets

                                                                                       Impacted region
                                                                             APAC w/o                     North    •   We leverage Swiss Re’s
                                                  Industry                   China    China     Europe   America
                                                                                                                       proprietary re/insurance
   Thematic Insights: tracking the corona virus
                                                  automotive                                                           knowledge and build smart
                                                  consumer goods                                                       analytics tools to derive insights
                                                  energy
                                                                                                                       from vast amounts of data
                                                  financial services

                                                  industrial goods                                                 •   Similar approaches are used to
                                                  leisure/arts/hospitality
                                                                                                                       identify trends and
                                                                                                                       opportunities, supporting our
                                                  transportation/logistics                                             thematic investing initiatives

   Swiss Re’s COVID-19 Tracker supported us in the timely and focused de-risking of our portfolio
   across vulnerable sectors such as automotive, energy, financial services, leisure, industrial &
   consumer goods, across most impacted regions

                                                                                                                       Investors' Day | Zurich, 20 November 2020   38
Strong value drivers will help us thrive in uncertain markets

  Investment outlook

           Economic recovery underway, while high               ✓ Portfolio quality and positioning:
           uncertainty persists                                   we continue to deliver stable returns amid a
                                                                  low-yield and highly volatile market environment
           Monetary and fiscal policies remain very
           accommodative
                                                                ✓ Constructive investment outlook:
                                                                  we are cautiously optimistic and poised to take
           Constructive outlook for financial markets amid
                                                                  advantage of attractive opportunities
           strong central bank backstop

           COVID-19 accelerating key trends including           ✓ Enabled by differentiated value drivers:
           digitisation, deglobalisation, ESG                     our approach to thematic investing and smart
                                                                  analytics helps capture outperformance while
                                                                  mitigating downside risk
           Increased need to focus on quality and
           differentiation across regions, sectors, companies

                                                                                         Investors' Day | Zurich, 20 November 2020   39
Group Underwriting
Thierry Léger, Group Chief Underwriting Officer
In the current market environment, underwriting excellence is key to
success
Reinsurance industry development and interest rate evolution1
                                                                                                                          Current environment
                                                                                                                          • Ongoing COVID-19 pandemic
         500                                                                                                       8%
                                                                                                                          • Increase in secondary perils related to climate change
                                                                                                                   7%
         400
                                                                                                                          • Growth of capital expected to continue
                                                                                                                   6%
                                                                                                                          • Interest rates to remain very low
         300
                                                                                                                   5%     Industry change due to
USD bn

                                                                                                                   4%     • Growing protection gap
         200
                                                                                                                   3%     • Technology advancement and digitisation

                                                                                                                   2%
                                                                                                                          • More cost-conscious buyers
         100
                                                                                                                   1%     Future outperformance requires
                                                                                                                          • Increasing scale and efficiency
           1994 1996 1998 2000 2002 2004 2006 2008 2010 2012 2014 2016 2018 2020
                                                                                                                          • Leveraging technology
          Global trad. reinsurance capital (LHS)                       Worldwide Cat Market Price Index2                  • Pushing innovation and services for clients to the edge
          Alternative capital (LHS)                        US 10y interest rate (RHS)             Insured losses3 (LHS)   • Underwriting and capital allocation discipline

  Re/insurers must navigate the current market environment carefully, with increased focus on underwriting margins
                1   Source: Swiss Re Institute; 2020 9M provisional figures for insured losses
                2   Swiss Re pricing index; indicative for 2019
                                                                                                                                               Investors' Day | Zurich, 20 November 2020   41
                3   Nat cat and man-made losses (excl. COVID-19)
Our economic costing approach supports shareholder value generation in a
low yield environment
Economic view: composition of economic earnings stays unchanged                                                                     US GAAP earnings: shift from investment to underwriting income
Illustrative example for P&C Re based on a 150bps decline in interest rates 1                                                       Illustrative example for P&C Re based on a 150bps decline in interest rates1

                                   Economic earnings                          Economic balance sheet                                                             US GAAP earnings                   US GAAP balance sheet

      Investment risk                               ~20%
                                   ~20%                                                                                                                                       ~40%
      premium
                                                                                                                                                                                                                   Nominal4
                                                                                                 Market                                                                                                             value of
                                                                                               consistent                                    Investment                                                            liabilities
                                                                                Market          value of                                     income3            ~60%                                 Market
                                                                                 value          liabilities                                                                                           value
      Discounted                                                                of assets                                                                                                            of assets
      underwriting                 ~80%             ~80%
      income2                                                                                                                                                                 ~60%
                                                                                                                                             Underwriting                                                           Share-
                                                                                                                                                                ~40%                                               holders’
                                                                                               Economic                                      income2
                                                                                                                                                                                                                    equity
                                                                                               net worth
                                   2018             2020                                                                                                        2018          2020

• New business is discounted with current risk-free interest rates,                                                                   • Higher nominal prices lead to increased US GAAP underwriting
  requiring a higher nominal price to meet return hurdles                                                                               income as business is earned (within ~2 years in P&C)
• Economic balance sheet is asset-liability matched, protecting                                                                       • Asset duration of ~6 years for P&C Re and 7-8 years for L&H Re
  economic net worth (ENW)                                                                                                              results in gradual decline in investment income to current yields
              1   10y US government bond
              2   Assuming an average large nat cat loss burden and excluding (i) prior-year reserve development and (ii) the COVID-19 impact
                                                                                                                                                                                   Investors' Day | Zurich, 20 November 2020     42
              3   Adjusted for fixed income and FX realised gains/losses and replaced equity (un)realised gains/losses with equity risk premium
              4   Undiscounted US GAAP liabilities
COVID-19 is a major loss event which is driving changes in the
underwriting landscape
USD 27bn1 of reported COVID-19 losses so far, with more to come…                                                                        … triggering various reactions

Largest recorded catastrophe losses for the P&C insurance industry2 (USD bn)

100                                                                                                                                                                                P&C risks
 90
 80
                                                                                                                                            • Unambiguous coverage within policy wordings

                                                                                                 Range of

                                                                                                 estimate
 70                                                                          COVID-19

                                                                                                   loss
 60                                                                           (P&C)                                                         • Aggressive review of cumulative risk exposures
 50
 40
 30
 20
 10
                                                                                                                                                                                   L&H risks
  0
       HIM Katrina    EQ   Sandy Andrew WTC Northridge Ike EQ New
      (2017) (2005) Japan (2012) (1992) (2001) (1994) (2008) Zealand                                                                        • Temporary drop in new business production
                    (2011)                                   (2011)                                                                         • Adjustments of terms and conditions for new policies

 COVID-19 is supporting a more protracted market hardening, with increased focus on terms and conditions
           1   Source: Swiss Re/HSBC; total P&C and L&H impact for selected insurers and reinsurers; Note: mutuals do not report on a quarterly basis and P&C market estimate is
               on a gross basis whereas most re/insurers report on a net basis (incl. frequency benefits)
                                                                                                                                                                                   Investors' Day | Zurich, 20 November 2020   43
           2   Numbers in USD bn at 2020 prices; Source: Swiss Re Institute – estimate based on information and projections available as of November 2020
Insurers are focused on restoring overall resilience and financial stability

Amid globally reduced macro resilience…                                                                        … we continue to support our clients throughout COVID-19

Swiss Re Institute Global Resilience Indices (%)1

                      94                               93                                                                                … reduce earnings
                                                                                                                                                                                     e.g. nat cat covers, quota shares
                                                                                                                                         volatility

   63                              62

                 47                                                 50
                                                  44
                                                                                                                                         … reinforce balance
                                                                                                                                                                                     e.g. structured transactions
        25                                                                                                                               sheet strength
                                          24

         2008                              2019                            20202
                                                                                                                                         … achieve optimal                           e.g. legacy solutions and portfolio
                                                                                                                                         portfolio composition                       reviews, prospective covers
                        Macro           Nat cat         Mortality          Health

We see increased demand for tailored and capital-related solutions
             1   Insurance resilience measured as protection available as a percentage of protection needed; macro resilience derived considering multiple economic and structural
                 factors incl. economic complexity, low carbon economy, human capital and insurance penetration
             2   2020 values for SRI nat cat, mortality and health Resilience Indices are illustrative only
                                                                                                                                                                                       Investors' Day | Zurich, 20 November 2020   44
We have taken a number of actions to improve the quality of our P&C
underwriting

               1   Portfolio mix: increasingly attractive risk-return profile of total portfolio

               2   Nat cat: continuously updating risk models to reflect recent events
     Key
   actions
     Text
    taken      3   US casualty de-risking: reduction of exposures in Corporate Solutions and P&C Re

               4   US casualty new business: focus on improving profitability

                                                                                            Investors' Day | Zurich, 20 November 2020   45
1   We have actively shifted our underwriting portfolio mix over the last 18
    months in line with our Target Liability Portfolio
    We steer our business based on a defined TLP…                                                         … driving recent changes in our relative portfolio mix
                                                                                                                                                                                            GPW
                                                                                                                                          Illustrative
                                  Enhanced profitability

                                                                                     Positive
                                                                             Price quality improvement1
                                  Target Liability Portfolio
                                            (TLP)

                                                                                     Negative
      Sustainable growth                               Exposure management                                Decrease            Relative change in portfolio weight1                    Increase

     Our TLP ensures focus and rigour in portfolio steering, aiming to achieve long-term underwriting outperformance

            1   H1 2020 vs 2018                                                                                                                 Investors' Day | Zurich, 20 November 2020    46
2   We have incorporated learnings from recent nat cat events to reinforce our
    strong track record in this line of business
    Swiss Re’s leading market position in Nat Cat is based on underwriting expertise and balance sheet advantages

    Absolute and relative loss burden of major Nat Cat events, 2017-20191                                                                                                                           Total nat cat losses relative to shareholders’ equity

                               3.5
                                                                                                                                                                                                                     Swiss Re       Peers2
    Loss per event in USD bn

                                                                                                                                                                                                          13.5% 13.5%

                               1.0
                                                                                                                                                                                                                                 9.1%
                                                                                                                                                                                                                          7.3%                6.6% 6.7%
                               0.5

                               0.0
                                  0%            1%             2%              3%             4%              5%                   9%             10%            15%            16%                         2017             2018               2019
                                           Swiss Re        Peers2                                                                 Loss in % of common shareholders’ equity

    We have adjusted our risk models for certain perils and continue to refine our views where appropriate, particularly on secondary perils

                                             +30-70%                                                                          +50-80%                                                                         +70-110%
                                       weather events in Australia with                                                         recent elevated Japan                                                        increased frequency of high-
                                       AUD >1bn insured market loss                                                                typhoon activity                                                           severity California wildfires

                                       1 Based on current accident year losses (net of external retrocession, before tax); includes reserve increases for loss creep in 2019 on Typhoon Jebi and Trami.
                                       2 Peers include Munich Re, Hannover Re, SCOR, Renaissance Re and Everest Re                                                                                                 Investors' Day | Zurich, 20 November 2020   47
                                       Source: Company reports
3   We have meaningfully de-risked our US casualty portfolio and continue to
    focus on managing our exposures
    Corporate Solutions de-risking progressing according to plan                                                                           P&C Re has reduced exposure to LCRs in liability lines by ~25%
    Corporate Solutions US general liability portfolio – gross premiums written                                                            P&C Re US liability portfolio – exposure to Large Corporate Risks (LCRs)
                                                                                                                                                           -1%
                                                            -99%                                                                                                              -4%
                                                                                                                                                                                           -5%
                                                                                                                                                                                                        -7%
                                                                                                                                                                                                                         -7%

        Q1 2019                 Q2 2019                   Q3 2019                   Q4 2019                   Q1 2020                        Mar 2019            Jul 2019       Jan 2020     Apr 2020         Jul 2020     Sep 2020   Target

     • In 2019, we decided to exit our US general liability portfolio                                                                        • LCR exposure reduction expected to accelerate in 2021
     • Exit essentially complete as of the first quarter 2020 with a 99%                                                                     • In the past Swiss Re had a high share on the most exposed treaties
       reduction compared to the same period of 2019                                                                                           but we have reduced our share towards a market weight position
     • Introduction of new tighter guidelines for liability outside the US                                                                   • Over the next 12-24 months, we will further reduce this

                1   Includes the net effect of changes in premium mix (e.g. reduced liability), structuring actions (e.g. limits, corridors) and other underwriting actions                      Investors' Day | Zurich, 20 November 2020     48
4   Underwriting of new US casualty business has been adjusted to help
    achieve significant profitability improvements
    P&C Re put through significant price increases in the recent renewals

         +11%
        nominal rate increase
         Americas casualty
           reinsurance1
                                                              +20%                       • Technical combined ratio has improved across regions

                                                              nominal rate increase      • US casualty book has seen strong original rate increases and
                                                             US liability reinsurance1
                                                                                           tightening of conditions

                                                                                         • We have applied higher loss picks, in some cases significantly
                                               Up to
                                                                                           above those of our cedants

                                  5%pts                                                  • Social inflation accounts for >50% of the increased loss picks
                                 lower commissions for
                                 proportional US liability
                                      reinsurance2

     Concrete remediation actions are in place to ensure stronger margins in US casualty going forward

             1   Based on July 1st renewals.
             2   Over the course of 2020                                                                                      Investors' Day | Zurich, 20 November 2020   49
L&H underwriting reflects both near-term COVID-19 considerations and
longer-term trends

                                                L&H UW
       Near-term focus on COVID-19               focus             Long-term focus on R&D
                                                 areas

 • Temporary changes to underwriting                     • Robust duration and margin management
   guidelines during pandemic
                                                         • Monitoring and R&D work on disability and
 • Soft rather than hard guarantees for long-              cancer trends
   term critical illness

                                                                          Investors' Day | Zurich, 20 November 2020   50
Swiss Re is focused on underwriting of the future to ensure we can
compete in an evolving insurance landscape

                   Underwriting process                             • State of the art data-driven workflow tools
                                                                    • Real-time underwriting decisions with strengthened costing assumptions

                                                                    • Data-driven TLP model, incorporating advanced scenario modelling
                                                                    • Optimal reflection of forward-looking views and capital modelling
  Contracts                                 Portfolio
 and wording                                  mix
                                                                    • Underwriting data at individual contract level with live monitoring
                                                                    • Risk insights for individual location, risk and policy

                                                                    • End-to-end digitisation of contracts
                                                                    • Application of machine learning to track exposures and review wordings
                    Data and analytics

We focus on applying data, analytics and technology to tangibly improve our day-to-day underwriting

                                                                                                         Investors' Day | Zurich, 20 November 2020   51
Our current profitability outlook is positive across our P&C and L&H
underwriting portfolios
Underwriting portfolios at low point of soft market (for 2017)                                                                                   Current underwriting portfolio outlook (for 2021)

                                                          Illustrative                            Economic premiums                                                                              Illustrative                   Economic premiums

                                                                                                                                                  Profitability1
 Profitability1

                                                                                                                                                                                                                     Property portfolios
                                                                                                 Property portfolios

                                                                                                                                                                         Commercial
                  Commercial
                                                                                                                                                                          portfolios
                   portfolios

                                                                                                Economic profit1 = 0                                                                                                         Economic profit1 = 0

                                                                                                            Exposure2                                                                                                                   Exposure2

   >95% of our underwriting portfolios are expected to return more than cost of capital

                       1   New business underwriting profit above capital costs, assuming normal loss experience in line with costed assumptions, excluding centralised and unallocated items.
                       2   Based on standalone shortfall                                                                                                                                              Investors' Day | Zurich, 20 November 2020     52
Reinsurance
Moses Ojeisekhoba, Chief Executive Officer Reinsurance
We are focused on increasing the earnings power of Reinsurance

                          Key assets to capture profitable growth

                           •   Global scale and presence
                           •   Strong franchise, evidenced by client and broker rankings
                           •   Significant diversification benefit within Reinsurance
                           •   Technology, innovation and R&D

                          Key messages

                               Focus on differentiation through Core, Transactions and Solutions

                               Benefit from positive reinsurance market pricing developments

                               Capture profitable P&C opportunities in nat cat and Regional & National segment

                               Continue L&H track record with attractive new business and in-force management

                               Scale Solutions to accelerate achievement of clients’ business ambitions

                               Continue to optimise portfolio mix

                                                                                  Investors' Day | Zurich, 20 November 2020   54
Differentiation drives our Reinsurance business and enables growth in
Core, Transactions and Solutions

                                               Core                                   Transactions                             Solutions
                             Traditional reinsurance offerings                   Tailored and structured reinsurance   Additional value-adding services

 How we
 win                             Brand and                  Scale and                 Ability to    Balance sheet        Joint risk      Tech, innovation
                                 reputation                 presence                  execute         strength            sharing           and R&D

 Putting                      Increase support to Regional &                            Balance Transactions                   Solutions support
 strategy                     National clients with traditional                     between small, mid-sized and          differentiation in Core and
                                           covers                                            large deals                         Transactions
 into action

                                             4-5% p.a.                                  Diversified book of                  >40% of our clients
                                 mid-term premium growth                             Transactions with ~200                  utilise one or more of
                                  outlook in Core market1                              deals across regions                       our Solutions

       1   Swiss Re Institute forecast of global ceded premium CAGR, 2020-2030                                              Investors' Day | Zurich, 20 November 2020   55
Our business benefits from diversification across client segments, lines of
business and regions
We continue to grow our book…                                         … and aim to maintain our diversified earnings profile
Economic premiums (USD bn)                                                                                   P&C Re                                                                                L&H Re

                                                                             By client segment3
                                    50.8            >50.0
   36.5           38.9                                                                                                                                                                                       46%          47%
                                                                                                                                64%           61%
                                                                                                    58%       59%                                        Regional & National4        52%       56%
                                                                                                                                              39%                                                            54%          53%
                                                                                                    42%       41%               36%                               Globals            48%       44%
                                                                                                  2017       2018              2019             2020E1                             2017        2018         2019          2020E1
   2017           2018             2019            2020E1
                     P&C Re           L&H Re

Economic profit2 (USD bn)
                                                                            By geography3

                                     2.4
                   2.0                               >2.2
                                                                                                    Americas        EMEA              Asia                                            Americas EMEA                Asia
    1.7
                                                                                                          44%         37%             19%                                                  39%         21%         40%

   2017           2018             2019            2020E1
                     P&C Re           L&H Re

          1   FY 2020 extrapolation based on 6M 2020
          2   New business underwriting profit above capital costs, assuming normal loss experience in line with costed assumptions, excluding centralised and unallocated items
                                                                                                                                                                                     Investors' Day | Zurich, 20 November 2020   56
          3   Based on economic premiums
          4   Regional & National clients includes Large client segment
We have a strong client franchise but are not resting on our laurels

Close relationships built over time are one of our key assets, leading to…                                                                                        … top rankings with our clients

                                                                                                                                                                    NMG study Business Capability Index1, 2020
                                 2 315 active reinsurance clients
                                                                                                                                                                                      P&C Re

  ‘Right service for right client’ using client needs and buying segmentation                                                                                       #1                  #1                      #1
                               236 distinct                                   1 516 distinct                                                                      Brokers             Target                   Total
                               interactions                                    interactions
                                                                                                                                                                                      market2                 market

                         Low touch client                                High touch client
                                                                                                                                                                                      L&H Re
    Clients served both through broker channels and direct relationships

                 L&H Re 5%                                              95%                                                                                                             #1                      #2
                 P&C Re                         50%                                       50%
                                                                                                                                                                                      Target                   Total
                                                    Brokered              Direct                                                                                                      market2                 market

         1   NMG consulting 2020 global study of the reinsurance market; Business Capability Index ranks reinsurers delivering highest value to clients/brokers
         2   Swiss Re defined target insurers/clients                                                                                                                       Investors' Day | Zurich, 20 November 2020   57
We have increased our operating efficiency by fully leveraging our global
platform
 What
P&C Re situations   trigger
       cost ratio1 has      recaptures?
                       reduced, now in line with peers2                                                                    L&H Re has moved to a more competitive cost ratio1,2

                     35                                                                                                                         30
                          33.4                                                                             Peer 1
                                                                                                                                                     25.8
Total cost ratio %

                                                                                                                           Total cost ratio %
                                                                                                    31.1 Peer 2                                 25
                                                                                                         Swiss Re
                     30                                                                                                                                                                          20.9
                                                                                                           Peer 3                                                                                       Peer 1,2
                                                                                                                                                20                                                      Swiss Re
                                                                                                                                                                                                        Peer 3
                                                                                                                                                                                                        Peer 4

                     25                                                                                                                         15
                      2015               2016               2017                2018                2019                                         2015        2016   2017          2018           2019

Efficiency drivers

                                      Smart growth                                           Diversification          Right service for right client                  Improve efficiency
                                        Reallocation of                                Capital efficiency driven by                       Services aligned                 Smart and lean
                                       resources to key                               geographic and product mix                           to client needs              processes, leveraging
                                         growth areas                                                                                                                 technology and footprint

                             1   Cost ratio: GAAP/IFRS operating expenses plus acquisitions costs
                             2   Peers include Hannover Re, Munich Re, SCOR and RGA (for L&H Re)                                                                    Investors' Day | Zurich, 20 November 2020   58
Our Solutions are designed to accelerate our clients’ business ambitions

Solutions enable our clients to achieve their business goals across the value chain                                                                                                 Economic profit1
                                                                                                                                                                                    USD m

                                                                                                                                                                                                              336       >330
        Product                                 Underwriting &                                   Sales &                               Claims & in-force
      development                                  pricing                                     distribution                              management                                                 285
  Customer engagement                         Enhancement with                      Lapse, retention, propensity                   Data insights to improve
   and risk assessment                        predictive models                      to buy models / strategies                           profitability

                                                                                                                                                                                          146

      Product innovation                                                 Magnum                                                    SwiftRe®
       Agile (co-)creation of                                Automated L&H underwriting                                    P&C risk placement and
    next-generation propositions                               and dynamic risk ratings                                    management platform

       # of new          Premiums                               Applications Efficiency                                       Quote     Reduced
       launches          generated                               processed      uplift                                    response time UW time
                                                                                                                                                                                         2017      2018       2019     2020E2

                           USD                                                      +80-
        >210                                                        13m             100%                                       5min              90%
                           5bn                                                                                                                                                              >750                  >230
                                                                                                                                                                                        P&C Re clients        L&H Re clients
   Client benefits                                                                                                                                                                        supported             supported

           1   New business underwriting profit above capital costs, assuming normal loss experience in line with costed assumptions, excluding centralised and unallocated items
           2   FY 2020 extrapolation based on 6M 2020                                                                                                                               Investors' Day | Zurich, 20 November 2020   59
We are rebalancing our portfolio in line with our Target Liability Portfolio
and our core strengths
We actively steer our portfolio…                                                                      … based on pricing outlook and market trends

                                   Enhanced profitability
                                                                                                                                     Pricing1 X Exposure2 = Premium

                                                                                                        1   Property cat

                                                                                                        2   Property non-cat

                                                                                                        3   Liability

                                              8                                                         4   Motor
                                                               7
                                                                                                        5   Marine and engineering
                                 9                            4
                                                                        3                               6   Credit & surety
                            2          5
                                                                                6
                                                                                                        7   Health
                       1
                                                                                                        8   Mortality

                                                                                                        9   Longevity
Sustainable growth                                                              Exposure management

         1   Based on price adequacy estimate from Target Liability Portfolio
         2   Based on market share target from Target Liability Portfolio                                                              Investors' Day | Zurich, 20 November 2020   60
P&C Reinsurance     L&H Reinsurance

P&C Re: focus areas to selectively expand the portfolio and increase
margins

                                      1   Nat cat: continue to develop our book at attractive rates

                                      2   Specialty: capture profitable opportunities
         P&C Re
                  Text

                                      3   Regional & Nationals: expand our client base

                                      4   Actual vs expected earnings: address areas of recent underperformance

                                                                                                      Investors' Day | Zurich, 20 November 2020   61
P&C Reinsurance           L&H Reinsurance

1   We will continue to grow our nat cat book at attractive rates

     Strong growth in US GAAP nat cat premiums and expected margins...
     USD bn
                                                                                                       3.3
                                                                               2.8
                          2.3                          2.1
                                                                                                               Significant increase in sustainable earnings power
                                                                       1.3                    1.4
           1.2                                  1.2

               2017                               2018                    2019                 2020E1                     USD                        Growth has been more
                                                                                                                                                  focused on peak scenarios,
                                                                                                                      >0.4bn
                                  Expected nat cat budget          Expected nat cat premium
                                                                                                                                                    supported by successful
                                                                                                                                                    expansion of Alternative
    ... focused on areas with the highest risk-adjusted price increases                                            increased annual pre-tax             Capital Partners
                                                                                                                 US GAAP earnings since 2017
               Americas                                       EMEA                              Asia

       2017 2018 2019 2020E1                          2017 2018 2019 2020E1            2017 2018 2019 2020E1
                                    Price Adequacy                 Exposure2

                      1   FY 2020 extrapolation based on 9M 2020
                      2   Based on gross expected losses                                                                                  Investors' Day | Zurich, 20 November 2020   62
P&C Reinsurance           L&H Reinsurance

2   We run a disciplined specialty book, with targeted growth opportunities

    We have a positive outlook for our specialty book...                                                          … reflecting profitable opportunities across the portfolios…

                                                                                                                   Economic premiums (USD bn)
                                          Enhanced profitability

                                                                                                                                              CAGR +8%
                                                                                                                                                               >2.9                               USD >0.3bn
                                   Marine                             Credit & surety
                                                                                                                                                                                                    average pre-tax US GAAP
                               Aviation
                                                                                                                                             2.3                                                           earnings2
                  Engineering

               Sustainable
                 growth
                                                                         Exposure
                                                                        management                                                         2017              2020E1
                                                                                                                                                                                                          +30%
                                                                                                                                                                                                  increase in economic profit3
                                                                                                                                                                                                       in the last 3 years

    … supported by a global team with strong underwriting and innovation capabilities

     • Very strong underwriting capabilities and portfolio steering to address divergent trends across portfolios

     • Solid mid-term growth outlook particularly in engineering and marine

     • Differentiation vis-à-vis clients with adapted digitisation solutions in response to more tech-savvy markets
                       1   FY 2020 extrapolation based on 6M 2020
                       2   Since 2014                                                                                                                                                           Investors' Day | Zurich, 20 November 2020   63
                       3   New business underwriting profit above capital costs, assuming normal loss experience in line with costed assumptions, excluding centralised and unallocated items
P&C Reinsurance           L&H Reinsurance

3   Opportunity to grow with Regional & National clients, building on our
    successful foundation
    Swiss Re has grown premiums steadily since 2017…                                       ... with further potential to expand
    Economic premiums for Regional & National segment, USD bn                                Forecast premiums in US market2, USD bn

                                                      CAGR +6%
                                                                              >8.0                           CAGR +4%                                  12%
                                          7.2                                                                           ~90                        Globals market share3

                                                                                                        61
                                                                                                                                                         9%
                                                                                                                                                    Regional & National
                                                                                                                                                      market share3
                                        2017                               2020E1                     2020             2030E

    Ambition to expand Core reinsurance to our Regional & National clients

                Opportunities in all regions                                                    Leverage technology to simplify and automate processes

                Increase capacity for selected lines of business                                Extensive distribution network to access business

                       1   FY 2020 extrapolation based on 6M 2020
                       2   Source: Swiss Re Institute                                                                              Investors' Day | Zurich, 20 November 2020   64
                       3   Share in total market (not only US), by segment as of FY 2018
You can also read