Resource Allocation in Multi-divisional Multi-product Firms
←
→
Page content transcription
If your browser does not render page correctly, please read the page content below
Resource Allocation in Multi-divisional Multi-product Firms

 BY BINLEI GONG AND ROBIN C. SICKLES* 1

 March 27, 2018

*Binlei GONG: Department of Agricultural Economics and Management, China Academy for Rural Development (CARD), Room
1203 Qizhen Building, 866 Yuhangtang Road, Hangzhou, Zhejiang University, China 310058, (e-mail: gongbinlei@zju.edu.cn).
Robin SICKLES: Department of Economics, Rice University, Houston, TX, USA, (e-mail: rsickles@rice.edu).
 1
Resource Allocation in Multi-divisional Multi-product Firms

 This paper is concerned with specifying and estimating the productive characteristics
of multidivisional multiproduct companies at the divisional level. In order to accomplish
this, we augment division-level information with inputs that are imputed based on
profit-maximizing allocations within each division. This study builds on work by De
Loecker et al. (2016) as well as Olley and Pakes (1996), Levinsohn and Petrin (2003) and
Ackerberg et al. (2015), and extends this work by lifting a key assumption that single-
and multi-product/division firms have the same production technique for the same
product/segment. We estimate the production function and impute input allocations
simultaneously in the absence of this key assumption as well as the constant share
constraint of the input portfolio. Finally, our approach is applied to estimate the
division-specific productivity of firms that compete in five segments of the global oilfield
market.

Key words: Multi-divisional Multi-product firm, heterogeneous technologies,
productivity and performance, global oilfield market
JEL Codes: D2 L2 Q4 C5

 2
1. Introduction
In productivity analysis, access to input and output data is essential to estimate the
production function. However, detailed input and output data, especially on the input side,
is often incomplete or inaccessible to researchers. An example relates to the estimation of
productivity in an industry. More and more integrated companies have a multi-divisional
form (MDF or M-form) and have footprints in multiple segments. The companies report
total output and input data, and possibly division-level output as well, but not
division-level inputs. Such information is not sufficient to reflect the company’s
resources invested in the targeted segment and to estimate the segment-specific
production function. In this case, the input allocations across divisions/segments for each
firm need to be collected or imputed to properly study the M-form firms and the
segments in which they have footprints.
 Such a problem also exists in modeling productivity by country/region. Many models
of world productivity have been proposed in the literature, but most assume a common
production function for the entire economy. However, different sectors or industries
within an economy clearly utilize different technologies. Some industries are more
labor-intensive, while others are more capital-intensive. Many economists overlook this
economic structural heterogeneity while others choose to ignore such issues due to the
lack of industry-level data.
 These examples illustrate two challenges that arise as a result of unobservable input
allocations, or the “black box” within multi-divisional organizations. For each
multi-divisional organization, the productivity levels measured by standard production
methods do not provide the difference in performance across divisions. For each segment,
the production function cannot be estimated, since the inputs allocated in that specific
segment are unknown for those multi-divisional firms. The focus of this paper is on these
two issues, analyzing the divisional productivity of multi-divisional firms and
segment-specific production functions for relevant segments.
 The setup of multi-divisional firms and multi-product firms in economics and finance
studies has been very similar, as most conglomerates adopt the M-form, wherein each
division presents one product line that produces one output in order to produce multiple
products. Many studies (Teece (1998), McEwin (2011), among them) call such a business
 3
organization a multi-divisional multi-product firm. We study such multi-divisional firms
and multi-product firms and also analyze standard assumptions and conventions adopted
from the literature in order that appropriate methods for modeling and estimating the
technologies of such M-firms can be implemented.
 It is worth noting the relationship among the three words that this research frequently
uses: product, division, and segment. Suppose an energy firm has two divisions - one
producing oil and the other producing natural gas; it is said that this is a multi-divisional
multi-product firm. Such a company has an oil division that generates the oil product in
the oil segment, as well as a natural gas division that generates the natural gas product in
the natural gas segment. Therefore, the words product, division, and segment are a
one-to-one match. For one product, the matching division is the department or branch of
the firm that generates this product, while the matching segment refers to the market for
that product.
 De Loecker et al. (2016) point out that input allocations of multi-product firms are
typically unobservable. According to their setup, these multi-product firms can be treated
as multi-divisional multi-product firms. They exploit data on single-product firms to
estimate the production function for each product line, assuming that the production
function is the same for single- and multi-product firms that generate the same product.
The production functions estimated from single-product firms allow them to back out
allocations of inputs across products within a multi-product firm.
 De Loecker et al. (2016) also note that the key assumption in their work—the
production techniques for single- and multi-product firms are the same for one product
line—is already implicitly employed in all previous work that pools data across single-
and multi-product firms (e.g., Olley and Pakes (1996) and Levinsohn and Petrin (2003)).
This is of course a testable hypothesis and we examine its validity in our analysis below.
Another issue in this line of empirical study is that there may not be enough observations
if there are only a few single-product firms, but many more multi-divisional firms in a
product line. For example, two of the five segments in our study of the global oilfield
market are dominated by multi-divisional firms. There are only seven and eight
single-division firms in the completion and production segments, respectively. Another

 4
example concerns world productivity analysis, where almost all countries are
multi-product/division “firms” since they all have more than one industry.
 In order to implement their model, De Loecker et al. (2016) also assume that the share
of a firm’s inputs allocated to a given product line is constant, and thus independent of
the input type. For example, if a product line uses 30% of the firm’s labor, it also uses 30%
of the firm’s capital. However, this assumption (assumption 4 in their paper) may not be
consistent with the product-specific production function assumption (assumption 1 in
their paper). For a multi-product firm, some product lines are relatively labor-intensive
and require a higher labor share in the input portfolio, while other product lines are
relatively capital-intensive and need a higher capital share in the input portfolio. We lift
this assumption in our analysis and let the data speak to the constancy of a firm’s input
shares allocated to a given product line.
 Valmari (2016) also studies product-specific production function of multi-product
firms. He also emphasizes the two key assumptions in De Loecker et al. (2016) as we
mentioned above, and criticizes that the share of a profit maximizing firm’s inputs
allocated to a given product line cannot be constant. However, Valmari (2016) also
assumes single- and multi-product firms use similar product-specific technologies and
highlights that this is the key assumption that enables De Loecker et al. (2016) to
estimate the production functions using data on single-product firms only without
simultaneously solving for the unobservable input allocations.
 Thus our study makes three central contributions. First, we test the key assumption that
previous studies rely on, i.e., that single- and multi-product/division firms have the same
production technique for the same product/segment. Second, we estimate the production
function and impute input allocations simultaneously in a setting in which the share of the
input portfolio is not constrained to be constant across segments and the single- and
multi-product/division firms are not assumed to have the same production technique for
the same product/segment. These are two assumptions relied on by De Loecker et al.
(2016). Third, we study the productivity and efficiency of a major strategic industry, the
global oilfield market, also referred to as the oil and gas service industry, using methods
that address these aforementioned issues. Our empirical study suggests that the key
assumptions typically made in such empirical settings are not always valid and may lead

 5
to erroneous conclusions about the productivity and efficiency of firms in this key
industry. Moreover, our division-level analyses provides valuable information for firms’
mergers and acquisitions (M&A) decisions and are consistent with and predictive of
recent major business decisions by several of the large companies in the oil and gas
service industry.
 To accomplish this we develop a model to explore resource allocation across divisions
within a multi-divisional firm when division-level outputs, total inputs, and segment
average input prices are available. The undistorted input allocations must simultaneously
satisfy two systems of equations including segment-specific stochastic production
functions and the maximization of the mathematical expectation of profit for each
multi-divisional firm.
 An iterative method is used to jointly solve these two systems and impute undistorted
input allocations. Then, stochastic frontier analysis is used to estimate the
segment-specific production frontiers. Since there is one frontier for each segment, this
method is called the segment-specific production frontier (SSPF), while the standard
stochastic frontier analysis assuming similar production frontiers across segments is
called the single production frontier (SPF) approach.
 This study tests the accuracy of the estimation using panel data for twenty-two
Organization for Economic Co-operation and Development (OECD) countries from 2000
to 2006 where the actual input allocations are observed. The imputed undistorted input
allocations are closer to the actual levels than the three competing estimations. Moreover,
the iteration converges to the same point using different initial guesses.
 This SSPF approach is used to explore the unobservable input allocations of
multi-divisional firms in the global oilfield market, which is composed of five segments.
This study finds no evidence of scale economies, as the estimated production function is
constant returns to scale. However, we do find economies of scope, since the
multi-divisional firms on average have higher productivity than single-divisional firms.
Moreover, the single- and multi-divisional firms in the capital equipment segment have
different production functions, which provide evidence that a key assumption in this
literature is not always valid. Multi-divisional firms may have very different efficiency
levels across segments and they prefer to invest in more efficient segments. This SSPF

 6
approach can estimate division-level and firm-level efficiency as well as average
efficiency for each segment.
 The remainder of the paper is structured as follows. Section 2 introduces the
methodology of the SSPF approach. Section 3 presents our empirical application on the
global oilfield market. Section 4 consists of the conclusions drawn. Data construction,
imputation algorithms, as well as robustness checks and extended results based on the
translog functional form in addition to those based on the Cobb-Douglas that we report in
the main body of our paper are found in the Appendices.

2. The Model

2.1 Multi-divisional Firms and Multi-product Firms

The multi-divisional form is an organizational structure that separates a company into
individual divisions based on location or products. A multi-divisional (form) firm is
essentially divided into semiautonomous divisions that have their own unitary structures,
and division managers are responsible for their own production and for maximizing profit
division-wide. There is a central office that develops overall strategies to maximize
overall company-wide profit. Thus the headquarters are in charge of overall strategic
decisions, while division managers are allowed to make their own operational choices.
 Multi-divisional firms, or conglomerates, have been popular in the United States since
the 1960s and currently account for over 60% of the book assets and market equity of
S&P 500 firms (Duchin et al., 2015). This type of firm is mostly studied in corporate
finance and management research. The main focus of the corporate finance and
management research on multi-divisional firms has been on comparisons between the
U-form (unitary form) and the M-form (multi-divisional form), the principal-agent
problem between headquarters and division managers, and transfer pricing and tax
minimization.
 The M-form provides many advantages. First, firms can be more productive by
diversifying under the assumption of neoclassical diminishing returns within the industry
(Maksimovic and Phillips, 2002). Second, a large company has higher brand value and
spillover effects that can be shared across divisions. Third, division managers can more

 7
efficiently handle the day-to-day operations of their own divisions. Fourth, even if some
units of the firm fail, the other divisions can still be productive and profitable, which
guarantees a more versatile, less risky, and more enduring organization. Fifth, diversified
firms can allocate capital better than typical external market sources due to their superior
inside information (Williamson, 1975). The headquarters also can expand highly
productive divisions and abandon low producing divisions more effectively than the
market (Stein, 1997). The M-form combines the advantages of a distinct brand and
economies of scale for a large conglomerate, while maintaining the operational flexibility
of a small firm.
 The M-form also has disadvantages. The headquarters of multi-divisional firms may
not be able to manage the various different businesses as effectively as single-division
firms. In addition to coordination problems, conglomerates suffer from agency problems,
wherein division managers may report incorrect information to maximize profits
division-wide, rather than firm-wide. Bureaucracy and a lack of managerial focus are also
frequent problems. Moreover, a lack of transparency, such as the black box of input
allocations across divisions that this study discusses, also discourages investors. As a
result, the stock market may value a diversified group of businesses and assets at less
than the sum of its parts, which is referred to as the “conglomerate discount.” Many
scholars (Berger and Ofek, 1995; Lang and Stulz, 1994) find that multi-divisional firms
have lower productivity levels than single-division firms.
 It is important to clarify the definitions and terminology used in the literature on
multi-product and multi-divisional firms. Multi-product firms produce multiple goods
and face the problem of how to allocate inputs in each product line. Multi-divisional
firms are those that have multiple semi-autonomous divisions and face the problem of
how to allocate inputs in each division. On the one hand, multi-product firms take either a
unitary form (e.g., a small farm that produces vegetables and fruits) or a multi-divisional
form (e.g., General Electric operates through multiple divisions: power & water, oil &
gas, aviation, healthcare, transportation, capital, and energy management). On the other
hand, a multi-divisional form can be adopted by either single-product firms (e.g., an
electricity company owning several power plants) or multi-product firms (e.g., the GE
case mentioned above).

 8
Since the multi-divisional form became popular in the 1960s, more and more studies
focus on these organizational structures, especially for multi-product firms. Williamson
(1975) theorizes the information-processing advantages that a multi-product firm can
achieve by deploying a multi-divisional form. Teece (1981) concludes that large
multi-product firms that adopted a multi-divisional form always perform better than those
with a unitary form. Although more and more large firms are both multi-divisional and
multi-product, some differences between the two were revealed in previous studies.
 Earlier studies on multi-divisional firms largely have appeared in the finance and
management literatures and tend to focus on the principal-agent problem (Grossman and
Hart, 1983; Hölmstrom, 1979, 1982; Ross, 1973), since divisional managers are
responsible for their own profit maximization, which may conflict with firm-level profit
maximization. Multi-product firm studies largely are found in the literatures on empirical
industrial organization, productivity and efficiency, and international trade, and center
on product choices: how to concentrate on the most productive goods and drop the least
productive goods in global markets (Baldwin et al., 2005; Bernard et al., 2011) and in
national markets (Bernard et al., 2010; Broda and Weinstein, 2010).
 As Valmari (2016) mentioned, most of the existing studies of multi-product firms
assume that all of the company’s products is generated with a firm-level technology. In
recent years, both multi-divisional and multi-product studies have begun to consider
division-specific or product-specific production functions, rather than a unique
production function at the firm level. Maksimovic and Phillips (2002) find evidence to
indicate that the majority of U.S. conglomerates grow efficiently and therefore study
resource allocation in the absence of an agency problem. In this paper we follow
Maksimovic and Phillips (2002) and study multi-divisional firms in the absence of an
agency problem. A more detailed discussion of this issue is discussed in section 2.3.
 Differences between multi-divisional firms and multi-product firms are minimized
when the assumptions of division (product)-specific production and the absence of an
agency problem are made. The lack of an agency problem to which we refer speaks to the
optimal decisions of divisional managers that are consistent with firm-level
maximization. However, that every division’s goal is to do their best the best may not
correspond to frontier behavior. Most conglomerates have both multi-product and

 9
multi-divisional characteristics and set each product line as a division, with divisional
managers making operational decisions. Although they may be attempting to
profit-maximize those goals may not play out in the real world.

2.2 General Model

Suppose companies can have footprints in one or multiple segments in a “M Inputs – N
Outputs/Segments – T periods” economy. We outline below methods to model such a
production process and to estimate the productivity and efficiency of such enterprises,
where stochastic frontier analysis 2 is used as the production method to nest the
neoclassical production model that assumes fully efficient allocations. The usual
approach to model such a technology, wherein one production frontier applies to all the
firms, is denoted as the single production frontier (SPF, hereafter) approach, while our
new model, where segment-specific production frontiers exist, is denoted as the
segment-specific production frontier (SSPF, hereafter) approach.

2.2.1 Single Frontier Analysis.

The canonical stochastic frontier model for panel data, or what this study calls the SPF
estimator, specifies production for an individual company at time as

 = ( ; 0 )exp( )exp( )exp(− ), (1)

where is the aggregated output of company (firm) i at time t; = ( 1 , 2 , . . . , )
denotes the vector of the M types of inputs; ( ; 0 ) ⋅ exp( ) is the average
production frontier, where ( ; 0 ) is the time-invariant part of the average production
function, 0 = ( 01 , 02 , . . . , 0 ) is a vector of technical parameters to be estimated,
and is a vector that contains a group of year dummy variables and shift the production
frontier over time with corresponding coefficients ; exp( ) is the stochastic
component that describes random shocks affecting the production process. The stochastic
term is standard idiosyncratic noise assumed to be normally distributed with a mean
of zero and a standard deviation of while is a one-sided stochastic term with a
positive mean > 0. Technical efficiency (TE) is defined as the ratio of observed
2
 Stochastic frontier analysis (SFA) is a method of economic modelling widely used in productivity and efficiency analysis. See
Kumbhakar and Lovell (2003).
 10
output to the expected maximum feasible output and is = exp(− ). = 1 or
 = 0 shows that the i-th individual allocates at the production frontier and obtains the
maximum feasible output at time t, while < 1 or > 0 provides a measure of the
shortfall of the observed output from the maximum feasible output. This study uses the
error components specification with time-varying efficiencies (Battese and Coelli, 1992),
where = exp(− ( − )) ∗ ) . To sum up, the input coefficients 0 of the
production function in Eq. (1) are time-invariant, while the firm-specific intercept term is
shifted by a common time varying component. This study will test if the coefficients 0
of the production function also change over time in the empirical analysis.

2.2.2 Segment-Specific Frontier Analysis.

Eq. (1) assumes a unique production function across segments and is not a useful
representation of technologies that are segment-specific. A meta-frontier function is a
widely used method to investigate firms in different groups that may not have the same
technology (Battese and Rao, 2002). The meta-production function was first established
by Hayami (1969) and Hayami and Ruttan (1970), which is treated as the envelope of
commonly conceived neoclassical production functions (Hayami and Ruttan, 1971). This
method is attractive theoretically since the producers in the same group have potential
access to the same technology but there exist technology gaps across groups. It is worth
noting that the technology gaps among different groups in the original meta-production
studies are often caused by geographic reasons. For example, Mundlak and
Hellinghausen (1982) and Lau and Yotopoulos (1989) adopt this method to compare
agricultural productivity across countries.
 The meta-frontier methodology is introduced in stochastic frontier analysis and
becomes a function that envelopes all the frontiers of groups using different technologies
(Battese et al., 2004). For example, Sharma and Leung (2000) use stochastic
meta-frontier model to estimate the efficiency of aquaculture farms in South Asian
nations. The technology gaps between units across regions or countries are the main
causes to use stochastic meta-frontier models (Huang et al., 2010).
 The concept of a group-specific frontier in the meta-frontier literature provides a useful
paradigm that allows different segments to have different frontiers as they possess

 11
different technologies. In this paper, we assume the production frontier is
segment-specific. Moreover, all the players in the same segment, including both
single-division firms and the divisions of the multi-divisional firms, are assumed to have
potential access to the same technology at this point. Therefore, different divisions in a
multi-divisional firm that has footprints in multiple segments are under different frontiers.
In a “M Inputs – N Products/Segments – T periods” economy, each equation in the
system of equations describes the production techniques for the corresponding
segment. This system can be written as:

 1 = 1 ( 1 ; 1 ) exp ( 1 1 ) exp ( 1 ) exp (− 1 )
 � ⋮ , (2)
 = ( ; ) exp ( ) exp ( ) exp (− )

where represents the observed scalar output and are vectors of unobserved
inputs of firm i in segment j at time t, respectively. ( ; ) is the heterogeneous
production frontier for segment j, where = ( 1 , 2 , . . . ) is a vector of
segment-specific technical parameters; = ( 2 , 3 , . . . , ) are vectors of year
dummy variables to control for production frontier changes across time and =
( 2 , 3 , . . . , ) vectors the coefficients of the year dummy variables; and =
(− ( − )) ∗ is the time-variant efficiency indicator. is the noise that is
considered normally distributed with a mean of zero and a standard deviation of . The
data pooled into the j-th equation in Eq. (2) depends on the validity of a key assumption.
This key assumption is that single- and multi-product/division firms have the same
production technique for the same product/segment). If this assumption made by De
Loecker et al. (2016) is adopted, then all of the divisions for firms that are single division
firms and all corresponding divisions of multi-product firms operating in the same
segment (j) are included in the pooled regression model. However, we can test if this
assumption is valid and if a single-division firm and the corresponding division of the
multi-divisional firm that operate in the same segment (of the five segments: exploration,
drilling, completion, production, capital equipment and other) have different production
technologies then we can remove them from the pooled regression and allow each to have
their own production regression model.

 12
The SSPF approach can predict division-level efficiency for multi-divisional firms
 � = − ) and firm-level efficiency for single-division firms. The firm-level
(
 � , is the weighted average of its
efficiency for the multi-divisional firm at time ,
efficiency in each division.

 � = ∑ �
 � �,

where is the firm-level revenue for firm at time and is the division-level
revenue for firm in division at time .
 Compared with a standard SPF, the SSPF approach considers the heterogeneity in
production frontiers across segments and can derive divisional level efficiency. However,
the unobserved input allocations at the divisional level need to be imputed. We next
present the assumptions, the methodology, and a method to assess the accuracy of the
imputations of this imputation approach.

2.3 Assumptions

Before building the model to impute input allocations across divisions, we discuss several
key assumptions we must make.
 Assumption 1: Maksimovic and Phillips (2002) Agency problems are absent and thus
the multi-divisional firms are profit-maximizing at the firm-level, have undistorted input
allocations, and report actual and accurate price and quantity information to the
headquarters.
 Each semiautonomous division has its own unitary structure and managers are
responsible for their own division, which may be inconsistent with the goal of the entire
company. This principal-agent problem in multi-divisional firms has been studied by
many economists since Ross (1973) and Hölmstrom (1979). Hölmstrom (1982) and
Grossman and Hart (1983) solve the moral hazard of the division managers by designing
a compensation scheme so that the semiautonomous divisions would not deviate from the
equilibrium. Maksimovic and Phillips (2002) analyze optimal firm size, growth, and
resource allocation by using a profit-maximizing neoclassical model in the absence of an
agency problem. They find evidence to indicate that majority of U.S. conglomerates grow

 13
efficiently and therefore study resource allocation in absence of an agency problem. We
follow the ideas of Maksimovic and Phillips (2002) by assuming no limit on the inputs
one company can employ, indicating that the firm-level profit maximization problem is
the first best and that divisions do not have to compete for inputs. If this assumption is
made then division managers are willing to truthfully report their actual operational
conditions and not overstate divisional profits, anticipating that additional resources
would be allocated to their division, and the upstream profit-maximizing headquarters
therefore know what actual profits are. The empirical results in Maksimovic and Phillips
(2002) indicate that the actual resource allocations for most conglomerates are generally
consistent with the undistorted/optimal allocations of resources across divisions to
maximize profit. Therefore, the undistorted input allocations for profit-maximizing
multi-divisional firms can be used to impute the unobserved input allocations that
companies are not required to (and thus do not) report at the division level. It is worth
noting that we allow technical inefficiency in the production function and hence in the
profit function, which determines the undistorted input allocations. Companies with
different levels of productivity (technical efficiency) have different levels of input usage
for different divisions.
 Assumption 2: Spillover effects on input prices are division-invariant functions of firm
size. Firm size can be measured by total costs.
 Potential reasons for the presence of the multi-divisional form are economies of scale,
as the firms become larger and more diversified, economies of scope, and spillover
effects. There are of course also possibilities for diseconomies due to coordination issues
and other constraints on managing a heterogeneous set of divisions. Economies of scope
for multi-divisional firms would suggest that such firms enjoy higher productivity and
efficiency than single-division firms, which is considered in De Loecker et al. (2016) and
also allowed in this paper. In our empirical work below we do not find evidence of scale
economies. However, we do find economies of scope.
 Spillover effects can be another important driver of the multi-divisional form for firms
in this industry. Sönmez (2013) presents a literature survey on firm survival and
concludes that the survival probability of a firm increases with firm size. On the one
hand, Burdett and Mortensen (1998) and Coles (2001) discuss how firms trade off higher

 14
wages against a lower quit rate when they expect a higher likelihood of survival. They
also find that in equilibrium, large firms with many employees pay high wages relative to
small firms with few employees that pay lower wages. On the other hand, many studies
have found that larger firms pay less for capital (Botosan, 1997; Gebhardt et al., 2001;
Petersen and Rajan, 1994; Poshakwale and Courtis, 2005; Reverte, 2012), since large
firms have a higher survival probability and lower risk. As a result, larger firms are more
capital-intensive than smaller ones due to factor prices differing by firm size (Söderbom
and Teal, 2004), again reinforcing our assumption that the price of capital and the price
of labor are affected by firm size.
 The effect of firm size on input prices is similar across divisions. Duchin et al. (2015)
point out that the spillovers (within-firm peer effects) in compensation and capital
expenditure are equally strong across related and unrelated divisions within a firm. If the
effect is not equal across segments, less-benefiting divisional managers will lobby and
negotiate with the headquarters. Levin (2002) presents a model where the actions of the
firm toward a group of employees affect the expectations of the other employees,
suggesting the importance of wage equity across divisions. Multi-divisional firms thus
would pay the same premium/discount based on the segment average compensation for
employees to maintain a similar quit rate across divisions. The capital prices across
divisions within the same multi-divisional firm reflect the same company risk over and
above the segment-specific systematic risk. Therefore, the capital prices of different
divisions within the same multi-divisional firm have the same premium/discount on the
basis of each segment’s benchmark interest rate that depends on the systematic risk of the
segment. We assume an equal effect of firm size across divisions and thus that the
premium/discount on input prices due to spillover effects is equal across divisions.
 Assumption 3: Capital is chosen prior to the realization of the production, while labor
and intermediate inputs (if included as an input) are chosen at the time production takes
place.
 This assumption specifies the timing of input choices, which is consistent with classic
productivity frameworks in Olley and Pakes (1996) and Levinsohn and Petrin (2003). In
the framework of Olley and Pakes (1996), the labor used in time is chosen when the
productivity shock at time is observed, while the capital used in time is chosen at

 15
time − 1 because = (1 − −1 ) −1 + −1 , where , , and are capital,
depreciation rate and investment, respectively, at time . Ackerberg et al. (2015) describe
those inputs that are chosen at the time production takes place as non-dynamic inputs. In
Levinsohn and Petrin (2003), labor and intermediate inputs are both non-dynamic inputs,
while capital is not. We allow labor and intermediate inputs (if included as an input) to be
non-dynamic inputs (see Ackerberg, Caves, and Frazer, 2015, pg. 2421).

2.4 Imputation Algorithm

Let be the division-level revenue for firm in division at time ; be the
information set for firm at time ; [ | −1 ] be the expected revenue for firm

in division at time given the information set at time − 1; be unobserved k-th

input of firm i in division j at time t for all < , and the last input, , be the
division-level capital input; be the average price of the output in segment j at time t;
 be the average price of the k-th input in segment j at time t; ′

 be the ratio of
average price for the k-th input between segments j and j’ at time t; ( , ) be a subset
of = (1,2, . . . , ), indicating the segments where firm i at time t has a footprint;
 = ( 1 , 2 , . . . ) be a vector of technical parameters in segment ’s production
 2
function; ∼ (0, ) be the white noise in segment ’s production function;
be the coefficient of time ’s dummy variable in segment ’s production function;
 = exp� + − � be the (total-factor) productivity in segment ’s production
function for firm i; be the coefficient of the intersection between the k-th input and
l-th input in segment ’s production function if the function takes Transcendental
 2
Logarithmic form; log( ′ )|log( ) ∼ (log( ) + , ) for all = , , ,
which means the growth rate of is normally distributed with a mean of and a
standard deviation of .
 Theorem 1: Under Assumptions 1-3, the undistorted input allocations in
multi-divisional firms satisfy: (i)

 16
 [ | ]
 ⎧

 = ′ , ∀ , , ∀ < , ∀ , ′ ∈ ( , )

 ⎪ =
 � ′ | � ′
 ⎪
 ′
 ⎪
 [ | −1 ]

 . (3)
 ⎨ −1
 ′ −1 , ∀ , , ∀ , ′

 = = ∈ ( , )
 ⎪ � ′ | −1 �
 ′ −1
 ⎪ ′
 ⎪

 ⎩ ∑ ∈ ( , ) = , ∀ , ,

(ii) When the production function has a Cobb-Douglas form, (i) derives

 ⎧ = ∑

 2
 , ∀ <
 2 �
 ⎪ ′ ′ ′
 ∈ ( , ) ′ � − ′
 +0.5 ′
 −0.5

 , (4)

 ⎨ = ′ ′
 ⎪
 ∑ ′ ∈ ( , ) ′ ′ ′ ′ � ��

 � � − ′ +0.5 2
 ′
 −0.5 2 �

 ⎩

where

 −1 −1 −1
 = ∏ =1,…, −1 � � ,

and
 2 2
 + +∑ −1 2 2
 =1
 −1
 ∑ =1
 = exp � + + + �.
 2

(iii) When the production function has a Transcendental Logarithmic form, (i) derives
 [ | ]
 ⎧ ( +∑ 2
 =1 ) ′ � ′ +0.5 �
 = ′ , ∀ <

 ⎪ =
 � ′ | �
 ( ′ +∑ 2
 =1 ′ ′ ) ′ � +0.5 ′ �
 ⎪
 ′
 ⎪
 � � −1 �
 2
 . (5)
 ⎨ ( +∑
 =1 ) ′ exp( ′ +0.5 )
 ′ −1

 ⎪ =
 =
 � ′ | −1 �
 ′ � ′ +∑ 2
 =1 ′ ′ � ′ exp� +0.5 ′ � ′
 ⎪ ′

 ⎪

 ⎩ ∑ ∈ ( , ) = , ∀ , ,

 Appendix A provides a detailed imputation algorithm: Eqs. (3) - (5) are derived from
the first order condition of profit maximization problem and can be solved jointly with
the segment-specific production functions using an iterative method. Finally, the iterative

 17
method can impute undistorted input allocations, which can be applied in the SSPF
(through Eq. (2)) to estimate the efficiency at divisional level.
 We test whether this imputation method can deliver accurate estimations of input
allocations using a panel of data for OECD countries where actual input allocations are
observed. Details are in Appendix B and results indicate that our imputation method
provides estimated input allocations that are closer to the actual allocations than the other
three competing imputation methods utilized in the literature.

2.5 Endogeneity Problem

Olley and Pakes (1996) revisit the endogeneity problem inherent in production function
studies due to input choices being determined by some factors that are unobserved by
the econometrician, but observed by the firm (Ackerberg et al., 2015). Such factors
include the firm’s beliefs about its productivity and efficiency. This problem is more
pronounced for inputs that adjust rapidly (Marschak and Andrews, 1944), such as the
oilfield market, where the decisions of the companies depend heavily on exploration and
production (E&P) spending from the oil and gas firms (affected by oil price) and the
business cycles. Many companies divest capital and cut headcount aggressively when oil
prices fall and ramp up their use of capital and labor services when the price of oil rises.
This of course leads to familiar problem of endogenous inputs in the production function,
which leads to biased OLS estimates.
 One of the solutions to the endogeneity problem in estimating production functions is
to specify the unobserved factors as fixed effects and utilize a within transformation. In
standard productivity studies utilizing linear in parameters models, such as the linear in
logs Cobb-Douglas (C-D) or more flexible forms such as the Transcendental Logarithmic
(T-L), the fixed-effects treatment is straightforward. However, the consistency of the
fixed effects estimator rests on the assumption that unobserved factors are constant across
time. An alternative advocated by Olley and Pakes (1996) is to use observed investment
to control for unobserved productivity or efficiency shocks. Levinsohn and Petrin (2003)
extend the idea by using intermediate inputs instead of investment as instruments. They
claim the benefit is strictly data-driven, since many datasets have significant amounts of
observations with zero investment, which makes investment an invalid proxy. However,
 18
as Ackerberg et al. (2015) note, both of the models suffer from the collinearity problems
in the first step, such that the coefficients of the exogenous inputs may not be identified.
Moreover, data on intermediate inputs is not available in the sample of oilfield firms we
analyze in the empirical study we turn to in the next section.
 The third approach, which is also the most widely used method to solve the
endogeneity problem, is instrumental variables (IV) estimation. Amsler et al. (2016)
review Two-Stage Least Square (2SLS) and applied a Corrected 2SLS (C2SLS) to solve
the endogeneity problem in stochastic frontier analysis when the production function is
linear in parameters, such as with the C-D production function. For C2SLS, the first step
is to estimate the model by 2SLS and derive the residuals using the instruments. In the
second step, these 2SLS residuals are decomposed using the maximum likelihood
method, just as in classic stochastic frontier analysis. A somewhat similar two-step
procedure is developed by Guan et al. (2009). For a T-L production function, however,
Amsler et al. (2016) suggest that the control function method is more efficient than the
C2SLS method. Moreover, they explain how to reduce the number of instrumental
variables needed, while still yielding consistent estimators based on the control function
method. 3
 We use the C2SLS method for the linear C-D production function and the control
function method for the nonlinear T-L production; both are recommended in Amsler et
al. (2016). The control function method can also be used to test the strict exogeneity of
the inputs using t-tests for the significance of the reduced form residuals. For the
selection of instrument variables, Levinsohn and Petrin (2003) mention that the potential
instruments include input prices and lagged values of input use. Lagged values of inputs
are valid instruments if the lag time is long enough to break the dependence between the
input choices and serially correlated shocks. Blundell and Bond (2000) and Guan et al.
(2009) both emphasize that the input levels lagged at least two periods can be valid

3
 For example, suppose two inputs, labor and capital, are both endogenous. At least five instruments are needed since all of the two
inputs, their square terms, and their intersection are endogenous in the T-L production function. However, under some additional
assumptions, consistent estimators can be obtained using only two control functions, not five. This point has been made by some
economists, including BLUNDELL, R.W., POWELL, J.L., (2004). Endogeneity in Semiparametric Binary Response Models. The
Review of Economic Studies 71, 655-679., TERZA, J.V., BASU, A., RATHOUZ, P.J., (2008). Two-Stage Residual Inclusion
Estimation: Addressing Endogeneity in Health Econometric Modeling. Journal of health economics 27, 531-543., and
WOOLDRIDGE, J.M., 2010. Econometric Analysis of Cross Section and Panel Data. MIT press.. See detailed discussion in
AMSLER, C., PROKHOROV, A., SCHMIDT, P., (2016). Endogeneity in Stochastic Frontier Models. Journal of Econometrics 190,
280-288..
 19
instruments based on annual data such as we use in our empirical study. We also use
input prices as instruments. 4

3. Empirical Study of the Oilfield Market
We demonstrate the method by using global oilfield data. SSPF approach imputes the
undistorted input allocations and conducts a segment-specific frontier analysis for
multi-divisional firms in the global oilfield market, where five segments exist.

3.1 The Oilfield Market

The oilfield market, or oil and gas exploration and service, is a complex market whose
firms utilize processes that involve specialized technologies at each step of the oil and gas
supply chain. Most oil and gas companies, even large vertically integrated companies
such as Chevron and Exxon Mobil, choose to rent or buy part of the necessary equipment
from oilfield services firms. Companies in the oilfield market provide the infrastructure,
equipment, intellectual property, and services needed by the international oil and gas
industry to explore for and extract crude oil and natural gas, and then transport it from the
earth to the refinery, and eventually to the consumer. Therefore, this industry has many
diverse product lines.
 Firms in this industry have a total market capitalization of over $4 trillion USD,
generating total revenues over $400 billion USD in 2014. The significant development of
new technologies, such as hydraulic fracturing and offshore drilling, has resulted in a
10% compound annual growth rate (CAGR) from 2004 to 2014. Oil and gas companies
are also paying more attention to unconventional oil and gas, offshore production, and
aging reservoirs to maintain a steady supply of fossil fuel products. The higher
exploration and production (E&P) spending of the oil and gas companies translates to
higher revenues for the oilfield service companies.
 The Oilfield Market Report (OMR) by Spears divides the oilfield industry into five
segments: 1) exploration, 2) drilling, 3) completion, 4) production, and 5) capital
equipment, downhole tools and offshore services (capital equipment, hereafter). OMR
reports segment-level revenue for the 114 public firms in the field: 68 firms are

4
 The estimation results using lag two and lag three input quantities are robust in the empirical study.
 20
single-division and 56 firms are multi-divisional (28 firms do business in two segments,
10 firms are active in three segments, seven firms have footprints in four segments, and
only one firm covers all five segments). There are four diversified oilfield firms (the “Big
Four”): Baker Hughes, Halliburton, Schlumberger and Weatherford.

3.2 Oilfield Data

In this section we discuss the outputs and the inputs used in our analysis and how they are
constructed. Previous studies of this industry, such as those by Al-Obaidan and Scully
(1992)) and Hartley and Medlock (2008) selected both revenue and physical products as
the output measures. The use of revenue in these earlier studies instead of output quantity
to estimate firm-level performance in the petroleum industry was justified on the basis of
three rationales. The first was that physical output such as oil and gas produced may fail
to catch the impact of subsidies (e.g., a lower domestic price) as the result of political
pressure on National Oil Companies (NOCs). Second, a usual method to aggregate the
multiple products (e.g., oil and gas) is to calculate their relative value at market prices.
Third, revenue figures are usually easier to collect than the quantities of various products.
Wolf (2009) shows the strong correlation between physical outputs and revenue in oil
and gas companies in his empirical work on the performance of state vs. private oil
companies during the period (1987–2006). Most of the recent studies in this industry use
revenue as the output in estimating the performance of oil and gas companies (Eller et al.,
2011; Gong, 2018b; Hartley and Medlock III, 2013). In order to adjust the prices over
time, all of these studies use oil prices as a control variable in the production function.
Another method to control price over time is to deflate revenue so that the output level in
different periods are comparable. Gong (2017) and Gong (2018d) use deflated revenue as
the output variable in productivity analysis of oilfield companies. We follow this
approach and utilize deflated revenue (based on the producer price index) as the output
measure which provides a measure that is more comparable to the quantity-based
production analyses utilized conducted by Gandhi et al. (2013) and De Loecker et al.
(2016).
 In terms of input variables, labor, measured by number of employees, is always used as
an input in recent productivity analyses of the petroleum industry (Al-Obaidan and Scully,
 21
1992; Eller et al., 2011; Gong, 2018b; Hartley and Medlock III, 2013; Wolf, 2009).
Assets is another important input for these companies: Al-Obaidan and Scully (1992) use
total assets; Wolf (2009) use the sum of oil and gas reserves as an extra input in addition
to total asset; Eller et al. (2011), Ike and Lee (2014) and Ohene-Asare et al. (2017) drop
total assets and separate oil reserves and gas reserves as capital input variables; Hartley
and Medlock III (2013) and Gong (2018b) keep oil reserves and gas reserves, and add
refining capacity as another important capital variable, as refining capacity is the key
assets in downstream activities. No related literature uses intermediate inputs, as it is
often unavailable, which is also the case in our dataset. Different from the petroleum
industry, the oilfield market consists of oilfield service companies, which provide
services to the petroleum exploration and production industry but do not typically
produce petroleum themselves. For the oil and gas companies, reserves are an important
input as well as asset and these companies pay E&P (exploration and production)
spending to “purchase” this input. The service firms exchange services such as
directional drilling and hydraulic fracturing for the E&P spending from the oil and gas
companies. Therefore, reserves are not an input for service companies, most of which do
not own reserves, let alone refining capacity, which is the downstream asset the
petroleum industry that has no bearing on oilfield companies. Similar to many industries,
oilfield companies use many different types of equipment and assets in the production
process. A typical solution is to sum them up to one input – capital, using the Perpetual
Inventory Method (PIM). The PIM interprets a firm’s capital stock as an inventory of
investments, which already takes various equipment and assets into consideration.
 To summarize, our study uses deflated revenue as the output, the number of employees
and capital as the inputs as others have done in this literature and due to data availability.
Although (Gong, 2017) and Gong (2018d) also consider some characteristics of the
M-form in oilfield companies, their estimations of productivity and efficiency stay at the
firm-level. This paper, however, estimates segment-level production function and
efficiency, which provides much more information within those multi-divisional
companies. Different production functions are specified for the five segments and this
leads to a “2 Inputs – 5 Products/Segments – 18 Periods” technology that each firm in the
industry utilizes. Division-level revenue data from 1997 to 2014 for each of the 114

 22
public firms are collected from the three waves of the OMR (2000, 2011, and 2015)
dataset. Appendix C introduces this report, the method employed to combine the three
waves of data, and the detailed segmentation of the oilfield market. The Bureau of Labor
Statistics publishes the Producer Price Index (PPI) by North American Industry
Classification System (NAICS) division. The average output price index for each of the
five segments, as well as the overall oilfield market, can thus be calculated. The output
price indices deflate the revenue, which is used as the measure of segment specific
output.
 Data on annual overall revenue, the number of employees, and total capital for the 114
public firms during the sample period is collected from Thomson ONE, Bloomberg, and
FactSet. Capital services are assumed to be proportional to accounting capital, which is
the sum of equity and long-term debt, adjusted based on the approach of Berlemann and
Wesselhöft (2014) using PIM. Appendix D explains in more detail how the variables
were constructed. The overall revenue of a firm is not always equal to the total revenue in
the oilfield market as reported by the OMR. In some cases, the former may be larger
because the company has some business outside the oilfield market. On the other hand,
the former could be smaller, as the OMR adds the acquired firm’s revenue to the mother
firm’s revenue even in the years before acquisition. The input proportionality assumption
suggested by Foster et al. (2008) is used to adjust the labor and capital used in the oilfield
market.
 Input and output price data are constructed using conventional methods in the
literature. The service price of capital is the sum of the depreciation rate and interest
rate. The depreciation rate is calculated using the depreciation and capital data from
Thomson ONE, Bloomberg, and FactSet. Using the firm-level beta 5, the risk-free rate,
and the expected market return from the same database, the firm-level interest rate can be
estimated with a capital asset pricing model (CAPM). For labor price, many international
firms have compensation cost information, but North American firms have no such
information published. The Bureau of Labor Statistics has average compensation per
employee figures for each NAICS division in the Labor Productivity and Cost (LPC)
Database. The labor prices of those firms without wage information are set equal to the
5
 In finance, the beta of an investment or a company is a measure of the risk arising from exposure to general market movements as
opposed to idiosyncratic factors. The market portfolio of all investable assets has a beta of unity.
 23
corresponding NAICS division average. Average labor and capital prices are constructed
for each segment.
 Table 1 summarizes the input and output quantities in the oilfield market and in each
of the five segments. Firm-level labor and capital are observed, but segment-level labor
and capital are not. The average revenues in drilling and completion are significantly
higher than those of other segments. The exploration and drilling segments have a high
average wage while the capital equipment segment has a low average wage. Moreover,
the capital price in exploration is relatively high when compared to the other segments.

 [Insert TABLE 1 Here]

3.3 Empirical Results

Our imputation of the input allocations assumes that the production function is either a
C-D or T-L functional form. . The stopping criterion in the imputation algorithm
(c=1*10−6) was attained after eight iterations in the C-D case and after eleven iterations
in the T-L case. We report below results for the C-D case while Appendix E provides the
corresponding results for the T-L case. Overall, the findings are quite comparable for the
two functional forms.

3.3.1 Estimations of Production Functions

Table 2 presents the estimation results of the SPF approach in Eq. (1), which reflect the
production frontier at firm-level for the oilfield market.

 [Insert TABLE 2 Here]

 The first column of Table 2 reports the MLE estimation (assuming inputs are
exogenous) and the second column presents the C2SLS estimation (assuming inputs may
not be exogenous) of the total oilfield industry’s production frontier. The method
discussed by Amsler et al. (2016) is followed to test the exogeneity of labor and capital.
The capital is assumed to be exogenous, while labor is allowed to be endogenous, which

 24
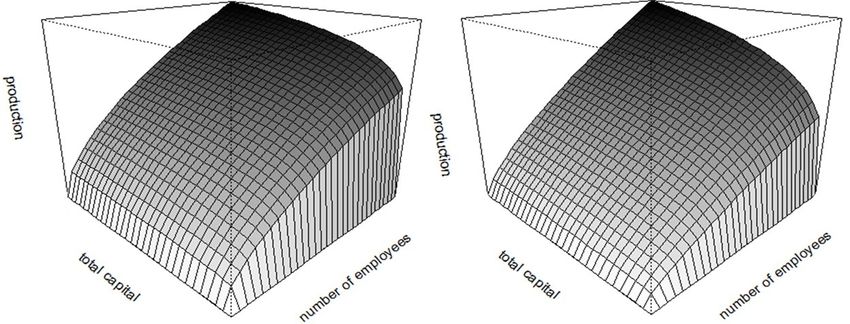
is consistent with the literature (Levinsohn and Petrin, 2003; Olley and Pakes, 1996).
Griliches and Mairesse (1998) remark that fixed effect estimators have frequently led
researchers to find point estimates for the capital coefficient that are very low and often
not significantly different from zero. This problem appears to have been addressed, as the
coefficient on capital in the C2SLS model (0.23 with a t-value of 19.2) is both
statistically and economically more significant than the estimation without considering
endogeneity (0.13 with a t-value of 8.6). Moreover, the sum of the output elasticities of
the labor and capital factor inputs is insignificantly different from one in the C2SLS
estimation, indicating a technology that does not display economies or diseconomies of
scale when endogeneity is addressed.
 The estimators in Table 2 make it possible to draw 3D images of the production
frontiers. Figure 1 plots the production frontiers for the oilfield market. The left is the
MLE estimation and the right is the C2SLS estimation. These 3D images visualize the
production-labor-capital relation. It is obvious that the elasticity of capital in the C2SLS
estimation is larger than that in the MLE estimation.

 [Insert FIGURE1 Here]

 The C2SLS estimation of the production function also derives firm-level technical
efficiency and total factor productivity. Table 3 compares the productivity of
single-division and multi-divisional firms. The first column regresses productivity on a
dummy variable of multi-divisional firms and a group of year dummy variables, while the
second column regresses productivity on number of divisions each company entered and
a group of year dummy variables. The results show that multi-divisional firms on average
have higher productivity than single-division firms, indicating the existence of economies
of scope in this market.

 [Insert TABLE 3 Here]

 Table 4 presents the estimation results of the SSPF approach in Eq. (2), which reflects
the segment-specific production frontiers for the oilfield market. This study first uses the

 25
SSPF approach to impute input allocations at the divisional level and estimate
segment-specific production functions, assuming that both single- and multi-divisional
firms have the same production techniques within a segment. Then, the validity of this
assumption is tested for each regression and it is found that the production techniques for
single- and multi-divisional firms are significantly different in the capital equipment
segment, which indicates that the key assumption previous studies rely heavily on is not
always valid. Therefore, the observation from single-division firms cannot solely be used
to estimate the production function that multi-divisional firms also follow.

 [Insert TABLE 4 Here]

 Since the production techniques are different for single- and multi-divisional firms in
the capital equipment segment, this study drops the observations of single-division firms
in that segment from the production function and reruns the iterations to reach the
undistorted input allocations. Columns 1 - 4 of Table 4 list the estimated production
frontiers for each of the first four segments, and Columns 5 and 6 show the estimated
production frontiers in the capital equipment segment for single-and multi-divisional
firms, respectively.
 The production frontiers are different across segments. Compared with the drilling,
completion, and capital equipment segments, the exploration and production segments
are relatively more capital-intensive. This finding implies that the constant share in the
input portfolio across segments assumed in De Loecker et al. (2016) is not a valid
assumption.
 Tables 2 and 4 also present the average efficiency for the oilfield market and each
segment, respectively. The top and bottom 5% of the estimated efficiencies are dropped
to eliminate possible outliers. After controlling the endogeneity problem, the average
efficiency for the oilfield market as a whole is 0.541. For segment-level average
efficiency, the exploration segment (0.719) and the multi-divisional firms in the capital
equipment segment (0.673) are the highest, followed by the production (0.659) and
drilling (0.633) segments, while the completion segment (0.606) and the single-division
firms in the capital equipment segment (0.610) are the lowest.

 26
You can also read