Investor Ideology - European Corporate Governance Institute
←
→
Page content transcription
If your browser does not render page correctly, please read the page content below
Investor Ideology

Finance Working Paper N° 557/2018   Patrick Bolton
                      March 2018    Columbia University and ECGI

                                    Tao Li
                                    Universtiy of Florida

                                    Enrichetta Ravina
                                    Northwestern University

                                    Howard Rosenthal
                                    New York University

                                    © Patrick Bolton, Tao Li, Enrichetta Ravina and
                                    Howard Rosenthal 2018. All rights reserved. Short
                                    sections of text, not to exceed two paragraphs, may
                                    be quoted without explicit permission provided that
                                    full credit, including © notice, is given to the source.

                                    This paper can be downloaded without charge from:
                                    http://ssrn.com/abstract_id=3119935

                                    www.ecgi.org/wp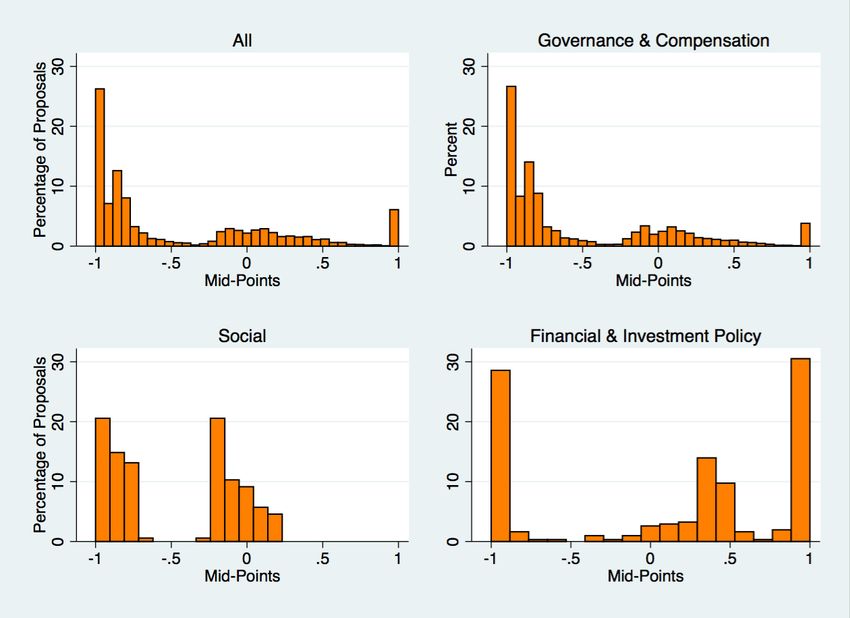
ECGI Working Paper Series in Finance

                                Investor Ideology

                                    Working Paper N° 557/2018
                                            March 2018

                                      Patrick Bolton
                                          Tao Li
                                     Enrichetta Ravina
                                     Howard Rosenthal

We are grateful to Mohammadreza Bolandnazar, Ariza Gusti, Roya Arab Loodaricheh, Umberto Mignozzetti,
and Da Tian for very helpful research assistance.

© Patrick Bolton, Tao Li, Enrichetta Ravina and Howard Rosenthal 2018. All rights reserved. Short
sections of text, not to exceed two paragraphs, may be quoted without explicit permission provided
that full credit, including © notice, is given to the source.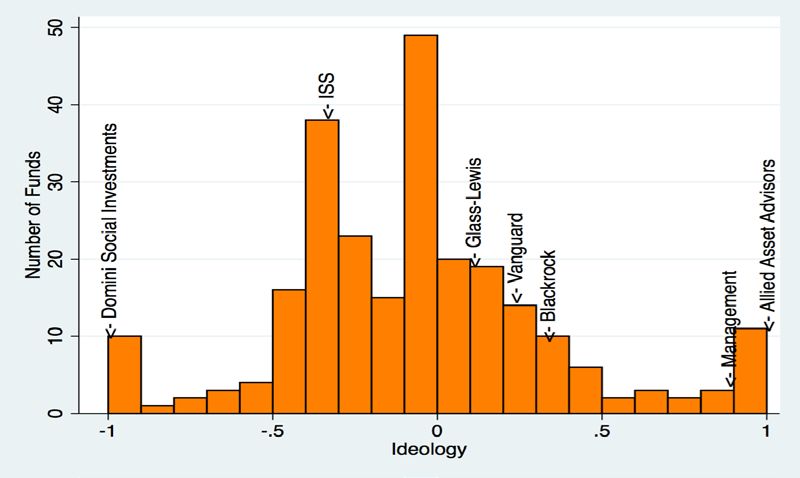
Abstract
This paper analyzes the voting patterns of institutional investors from their proxy
voting records. It estimates a spatial model of voting, using the W-NOMINATE
scaling for voting in legislatures. We find that institutional investors’ ideology
(or ideal points) can be mapped onto a left-right dimension, just as legislators’
ideologies can be represented along a left-right spectrum. The far-left investors
are socially responsible investors and the far-right investors are “greedy” inves-
tors, those opposed to proposals that could financially cost shareholders. There
are significant ideological differences across institutional investors and there is
no shareholder unanimity. The proxy adviser Institutional Shareholder Services
(ISS) plays a role similar to a political party. A second adviser, Glass Lewis, has
fewer followers. We find that the ideology of ISS is center-left, to the left of most
institutional investors and Glass Lewis. Furthermore, Vanguard and Blackrock
are center-right, and the ideology reflected in management proposals and voting
recommendations is far to the right. Investors on the left support a more social
orientation of the firm on environmental and other issues. They also support fewer
executive compensation proposals.

Keywords: Institutional Investors, Proxy Voting, Ideal Points, Spatial Model of Voting

JEL Classifications: G23, G30, D72

             Patrick Bolton*
             Barbara and David Zalaznick Professor of Business
             Columbia University, Columbia Business School
             804 Uris Hall
             New York NY 10027 , United States
             phone: +1 212 854 9245
             e-mail: pb2208@columbia.edu

             Tao Li
             Assistant Professor
             University of Florida, Warrington College of Business
             Bryan Hall 100
             Gainesville, FL 32611-7150, United States
             phone: +1 352 392 6654
             e-mail: tao.li@warrington.ufl.edu

             Enrichetta Ravina
             Visiting Assistant Professor of Finance
             Northwestern University, Kellogg School of Management
             2211 Campus Drive
             Evanston, IL 60208 , United States
             phone: +1 847 467 6872
             e-mail: enrichetta.ravina@kellogg.northwestern.edu

             Howard Rosenthal
             Professor of Politics
             New York University, Department of Politics
             19 W. 4th Street
             New York, NY 10012, United States
             phone: +1 212 998 8512
             e-mail: hr31@nyu.edu

             *Corresponding Author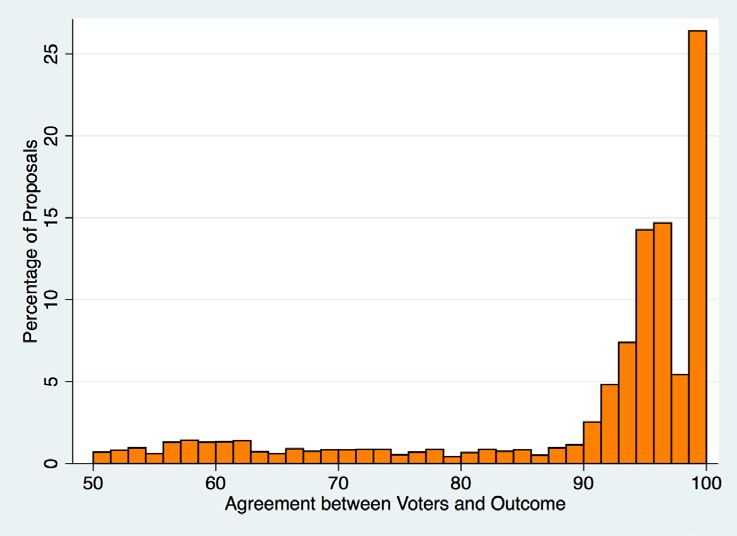
Investor Ideology1

              Patrick Bolton§, Tao Li#, Enrichetta Ravina*, and Howard Rosenthalφ
                                                      February 11, 2018

Abstract: This paper analyzes the voting patterns of institutional investors from their proxy voting records. It
estimates a spatial model of voting, using the W-NOMINATE scaling for voting in legislatures. We find that
institutional investors’ ideology (or ideal points) can be mapped onto a left-right dimension, just as legislators’
ideologies can be represented along a left-right spectrum. The far-left investors are socially responsible investors
and the far-right investors are “greedy” investors, those opposed to proposals that could financially cost
shareholders. There are significant ideological differences across institutional investors and there is no
shareholder unanimity. The proxy adviser Institutional Shareholder Services (ISS) plays a role similar to a
political party. A second adviser, Glass Lewis, has fewer followers. We find that the ideology of ISS is center-
left, to the left of most institutional investors and Glass Lewis. Furthermore, Vanguard and Blackrock are
center-right, and the ideology reflected in management proposals and voting recommendations is far to the
right. Investors on the left support a more social orientation of the firm on environmental and other issues.
They also support fewer executive compensation proposals.

§ Columbia University
# Warrington College of Business, University of Florida
* Kellogg School of Management, Northwestern University
φ Politics Department, New York University
1  We are grateful to Mohammadreza Bolandnazar, Ariza Gusti, Roya Arab Loodaricheh, Umberto Mignozzetti, and Da
Tian for very helpful research assistance.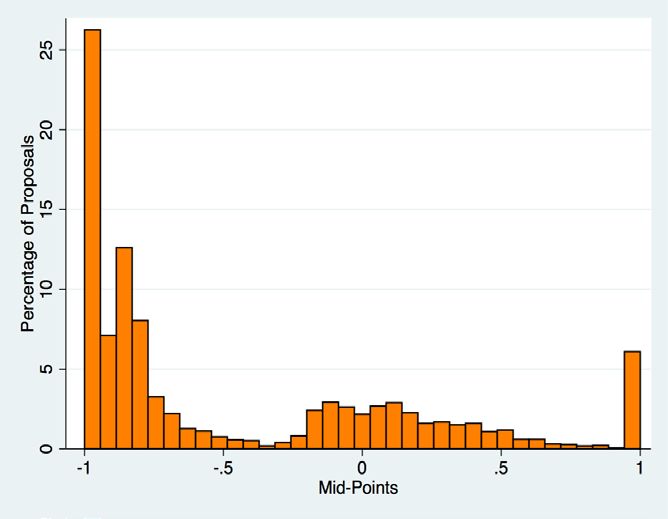
1 Introduction
We conduct an empirical analysis of proxy ballot voting by several hundred institutional investors and pension
funds that exercise voting rights in publicly listed Russell 3000 firms. We follow a “political” approach
pioneered by Poole and Rosenthal (1985), which seeks to estimate voters’ ideal points based on their proxy
voting records, along one, or possibly two, most salient policy dimensions. We can thus allow for a broad
“ideological” interpretation of the diverse ideal points of the multiple institutional asset managers and owners
that goes beyond pure shareholder value considerations. This political approach, which has also been adopted
by Bubb and Catan (2018) in simultaneous and independent work, is in contrast to the economic and financial
approaches taken in the existing proxy voting literature, that emphasize the financial and agency considerations
in institutional investor proxy voting.

Kenneth J. Arrow explains that he was led to formulate his celebrated Impossibility Theorem by his attempts
to generalize the theory of the firm to include multiple owners: “To be sure, it could be assumed that all were
seeking to maximize profits; but suppose they had different expectations of the future? They would then have
different preferences over investment projects. I first supposed that they would decide, as the legal framework
would imply, by majority voting…It was immediately clear that majority voting did not necessarily lead to an
ordering.” He further recounts: “Sometime in the winter of 1947-48 my mind again turned involuntarily to
voting. This time I happened to start with a political context and thought of parties arrayed in a natural left-
right ordering." [pages 2-3, Collected Papers of Kenneth J. Arrow, Volume 1, 1984]
In this paper, we reverse the path that led Arrow from the theory of the firm to political science, and ask what
light political science could shed on institutional shareholder voting. Could institutional investor ideology be
uncovered from institutional shareholder votes just like congressmen’s ideology has been uncovered from their
roll calls (Poole and Rosenthal, 2007)? More tantalizingly, are institutional investors arrayed along a left-right
ideological dimension? And if so, what substantive differences about corporate policy are represented by this
dimension?
As Duncan Black (1948) notably established, majority voting does result in a well-defined social ordering if
voters have single-peaked preferences, and if their ideal points are disposed along a single left-right dimension.
Thus, if it turns out that institutional investors’ ideological differences can be projected onto one dimension
then Arrow’s difficulty with majority voting by shareholders would be conveniently resolved.
Another convenient resolution of the majority voting problem is to observe that in a competitive economy
with complete markets there is unanimity among shareholders on the objectives of the firm (Grossman and
Stiglitz, 1976, and Grossman and Hart, 1979). A related argument is that only shareholder value maximization
is compatible with the no-arbitrage equilibrium condition in financial markets. Any deviation from value
maximization would expose the firm to a takeover. The most extreme form of this latter argument is that the
firm has no choice but to maximize shareholder value even in an economy where financial markets are
incomplete and firms cause externalities through their operations (Friedman, 1970).
However, even if a capital gain could be generated by taking over a non-value-maximizing firm and changing
its policies, it is far from obvious that a takeover would succeed under such circumstances (Grossman and Hart,
1980). When a takeover is not an immediate threat, socially-minded shareholders may well prefer a non-value-
maximizing policy that causes less negative externalities, all the more so if externalities are difficult to undo,
and if the government cannot be relied on to internalize all socially harmful activities (Hart and Zingales, 2016).
When business operations cannot be entirely separated from their social and environmental effects, when
economic forces do not completely shape a firm’s policies, there is inevitably a political facet to the exercise of
corporate control. But how does this political aspect manifest itself in practice?

                                                                                                                 2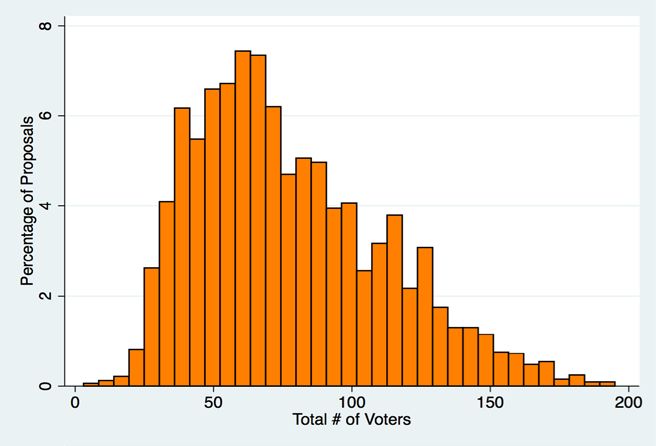
A key institutional consideration absent from the literature on the objectives of firms is the fact that most shares
of publicly traded corporations are managed by institutional investors. In practice the determining votes are
cast by asset managers, not by retail investors. Hence, the politics of corporate voting is manifest in the way in
which institutional investors exercise the voting rights of their clients. This paper is a first exploratory attempt
to uncover institutional investor ideology based on how they vote.
In its (2017) Annual Investment Stewardship Report, Vanguard writes “This year, for the first time, our funds
supported a number of climate-related shareholder resolutions opposed by company management.” The report
further states that Vanguard supports effective corporate governance practices that include advocacy,
engagement and “voting proxies at company shareholder meetings across each of our portfolios and around
the globe. Because of our ongoing advocacy and engagement efforts, companies should be aware of our
governance principles and positions by the time we cast our funds’ votes.” Our estimation of investor ideal
points allows us to identify Vanguard’s ideology; where it stands relative to other investors. This may help guide
companies’ policies and coordinate shareholder governance actions.
Our approach closely tracks the ideal point estimation methodology pioneered by Poole and Rosenthal (1985,
2007) and by McCarty, Poole, and Rosenthal (1997) for legislative voting. They apply alternating estimation
methods to a voting model where voters have random utility (McFadden, 1976) with a spatial single-peaked
representation of preferences à la Black (1948), to determine the ideal points of legislators based on their roll
calls. Their multidimensional scaling method is commonly referred to as NOMINATE; it has been widely
applied to study legislative voting and other binary choice problems (see Poole, 2005, and Armstrong et al.,
2014, pages 189-221).
Institutional investor voting data also represents binary choices where investors vote “For” or “Against”
(Investors rarely “abstain” by failing to vote their shares). These choices can therefore be analyzed using the
NOMINATE scaling methods. We frame our analysis by treating each fund family as a single investor with an
ideal point in a latent strategy space. This is a simplifying assumption that reflects the reality that most fund
families consolidate their voting guidelines across all member funds (Morningstar, 2017). As a first
approximation we further assume that the strategy space has only one dimension and that investor ideal points
are time invariant.
What do the institutional shareholder votes reveal about how political objectives are expressed and aggregated
at the firm level? Just as legislators’ ideological differences can be represented along a left-right spectrum, it
turns out that institutional investors’ ideal points can also be mapped onto a line where the far-left investors
are best described as socially responsible investors, those that vote most consistently in favor of pro-social and
pro-environment shareholder proposals, and the far-right investors’ votes can be described as “greedy”
investors, those who oppose again and again any proposal that could financially cost shareholders. In the
conclusion to the paper, we provide more nuance to the social versus greedy distinction.
It is important to emphasize that the NOMINATE scaling method is agnostic as to where ideology comes
from and what it represents. The one-dimensional representation of differences in investor ideology is a
statistical representation, which best explains the voting behavior of investors. That being said, it would not be
entirely surprising that the same ideological differences that are observed in Congress could also be reflected in
shareholder votes.
Still, an important finding is that there actually are significant ideological differences across institutional
investors. The votes are not unanimous. There is no shareholder unanimity. Institutional investors differ
systematically in their ideology. This is all the more remarkable that unlike in the political realm institutional
investors are not organized in sustained political coalitions that impose some form of voting discipline.

                                                                                                                  3
The closest to something resembling party organization in financial markets are the proxy advisers, Institutional
Shareholder Services (ISS) and Glass, Lewis & Co. (Glass Lewis). The management of firms also makes
recommendations about their proxy proposals. They always recommend supporting their own proposals (4,391
of 4,887 proposals in our basic data) but may recommend voting against shareholder proposals. If we treat ISS,
Glass Lewis, and management voting recommendations as votes we find that the ideology of ISS is center-left,
to the left of most institutional investors but to the right of most pension funds. Glass Lewis, Vanguard,
Blackrock, are center-right, and the ideology reflected by management recommendations is far to the right. This
far-right management ideal point reflects the reality that management is generally opposed to shareholder
proposals.
Whether these ideological differences are a reflection of the differences in ideology of their client bases we
cannot say. It is not even clear that clients are aware that the funds they invest in have systematic ideological
biases. Another open question is whether ideological differences are reflected in different portfolio holdings.
Related Literature: The most closely related paper is by Bubb and Catan (2018), who take a similar approach to
ours. The main methodological difference is that they undertake a principal components analysis following
Heckman and Snyder (1997), where we use W-Nominate (McCarty, Poole, and Rosenthal, 1997), a later version
of NOMINATE (Poole and Rosenthal, 1995), the standard scaling method in political science. Also, they treat
mutual funds as the unit of analysis, whereas we take the fund family as the relevant unit. This is more
reasonable because the overwhelming fraction of fund families coordinate the votes across their funds. As we
do, they rely on data on mutual fund voting from ISS, but over a longer time interval (from fiscal years 2009-
10 through 2014-15, while we only consider data from fiscal year 2011-12). Importantly, they do not consider
public pension fund votes. Bubb and Catan emphasize the political party role of proxy advisers ISS and Glass-
Lewis, whereas we highlight the ideological dimension of institutional investors revealed voting pattern, with
socially oriented investors on the left and greedy investors on the right.
The first study of proxy voting is by Gillan and Starks (2000). They study over 2000 governance-related
shareholder proposals at 452 companies between 1987 and 1994. Their main finding is that proposals
sponsored by institutions gain significantly more support than those sponsored by individuals. The subsequent
literature takes the perspective that shareholders seek to maximize shareholder value and that their voting is
motivated by managerial agency problems. Deviations from shareholder value maximization are explained by
conflicts of interest at some institutional investors and by the lack of coordination among institutional investors.
The proxy voting literature was significantly advanced by the change in disclosure requirements of proxy votes
introduced by the SEC in 2003. Under its new rule 30b1-4, registered investment companies are now required
to report to the SEC their complete proxy voting record on an annual basis. One of the first studies to rely on
these data is by Davis and Kim (2007); they find that mutual fund family voting in support of management is
more likely when the fund family is also a manager of the company’s corporate pension plan. (Ashraf,
Jayaraman, and Ryan, 2012, and Cvijanovic, Dasgupta, and Zachariadis, 2016, find additional support for this
hypothesis). In a related study, Rothberg and Lilien (2006) also find that the largest funds are more likely to
vote in support of management, except when proposals on executive compensation or takeover defenses are
under consideration (see also Taub, 2009). Other explanations that have been proposed for the management-
friendly voting behavior of mutual funds are governance failures at mutual funds (Chou, Ng and Wang, 2011),
and that, although mutual funds tend to vote with management, their support is greater for proposals that
increase shareholder wealth (Morgan, Poulsen, Wolf, and Yang, 2011). Cremers and Romano (2011) also find
that the SEC rule change if anything has increased mutual fund support for management (see Ferri, 2012 for a
review of this early literature).
More recently, the literature on proxy voting has explored other issues, in particular: i) whether mutual fund
voting is driven by proxy advisers’ recommendations, and if so why (Bethel and Gillan, 2002; Cai, Garner, and
Walkling, 2009; Ertimur, Ferri, and Oesch, 2013; Larcker, McCall, and Ormazabal, 2014; Iliev and Lowry, 2015;
4Malenko and Shen, 2016; and Li, 2018); ii) whether social networks—a common educational background
between mutual fund managers and portfolio firms’ CEOs—can explain mutual fund voting behavior (Butler
and Gurun, 2012); whether index-investors are active in corporate governance (Appel, Gormley, and Keim,
2016); iv) whether cross-holdings in firms in the same industry affect the management-friendly stance of mutual
funds (He, Huang, and Zhao, 2017), and; v) whether mutual funds vote in support of activist investor actions
(He and Li, 2017; Brav, Jiang, and Li, 2017; Kedia, Starks, and Wang, 2017; and Jiang, Li and Mei, 2018). Finally,
in a survey of mutual fund managers, McCahery, Sautner, and Starks (2016) find that voting against management
is an important channel through which institutional investors exert their influence. They also find that proxy
advisors’ recommendations are important to guide their voting. However, Listokin (2008) observes that
management can strategically time their proposals and avoid putting up a proposal for a vote if it expects that
the proposal could be defeated. This is evidenced by the disproportionately high proportion of close votes that
goes in favor of management. All these studies share the common perspective that institutional investor voting
is mostly concerned with corporate governance issues and does not reflect a broader ideological premise.
The remainder of the paper is organized as follows. Section 2 describes the data and provides summary statistics.
Section 3 explains the basic scaling methodology. Section 4 discusses the main results. Section 5 concludes.
2 Data and Sample Overview
Proxy Voting Rules
Shareholder Proposals
Under Rule 14a-8 of the Securities Exchange Act of 1934 qualifying shareholders can submit a proposal that
will be included in the company’s proxy statement and put forward to a vote at the shareholder meeting. To
qualify a shareholder must have owned for at least one year $2,000 or 1% of voting shares, and must submit
the proposal 120 days before the annual meeting. The proposer must also hold her shares until after the
shareholder meeting. Importantly, a proposal cannot exceed 500 words and generally must be in the form of
precatory petitions to the board of directors. In addition, proposals cannot touch on ordinary business matters.
Once a firm receives a shareholder proposal, it can choose to include the proposal in its proxy materials, work
with the proposer toward a mutual agreement (which may include withdrawal of the proposal), or submit a No-
Action request to the SEC to exclude the proposal from the company’s proxy statement, if the proposal is
deemed to fall outside the rules.
In effect, the proxy voting rules reflect a general delegation principle whereby shareholders have entrusted the
management of the company to officers and directors, who consequently should be protected against
subsequent interference and second-guessing by shareholders. Shareholder proposals are essentially restricted
to be about broader governance and political issues, and exclude business operational issues. It is therefore
natural to interpret shareholder proposals as reflecting the broader political will of shareholders.
Management Proposals
Since January 2011, all U.S. firms are required by the Dodd-Frank Act to sponsor an advisory vote on executive
compensation (“Say-on-Pay” vote) at least once every three years, and an advisory vote on “golden parachutes”
associated with a merger. These non-binding votes apply to top executives of a company. Binding equity-based
compensation plans, such as executive incentive plans, usually are not voted every year (only once every 2-3
years). Management may also sponsor governance-related proposals, such as declassification of the board of
directors, bylaw changes, cumulative voting, establishing/eliminating various committees, proxy access, and so
on.
5Capital-related proposals include dividend payment/increases, share repurchases, stock authorizations, and
restructuring proposals are about M&A transactions, asset sales, spin-offs, and so on. Financial proposals are
generally about approval of financial reports, and are routine proposals. Other routine or miscellaneous
management proposals concern the adjournment of a meeting, or company name changes.
ISS Voting Analytics
Our primary data source is the ISS’s Voting Analytics database. We focus on the Voting Results database
between July 2011 and June 2012 (fiscal year 2012), which contains aggregate voting data covering the annual
and special shareholder meetings. We chose this year because we were able to add votes of pension funds to
the votes of institutional investors in the ISS database. The ISS database provides the identity of the company
(name and CUSIP), description of the proposal, proposal number, shareholder meeting date, the identity of the
sponsor, management and ISS recommendations, and the number of “For”, “Withhold/Against” and
“Abstain” votes, as well as the vote outcome (Pass/Fail). 2 All the Russell 3000 companies are included.
For now we exclude director elections for simplicity. Following ISS’s Proxy Voting Guidelines, we end up with
the following proposals: environment, product safety, diversity, employment rights, human rights, charitable
giving, political, healthcare, animal rights, other social proposals, governance, compensation related proposals,
and financial and investment policy proposals.
We use the proposal ID to merge the voting results with the ISS Mutual Fund Voting Record database, which
provides voting records (For, Against, or Abstain) by individual mutual funds from major families on each
proposal in our sample. The sources for this database are N-PX filings that mutual fund companies are required
to file via the EDGAR website. We aggregate fund level voting information at the corresponding family level.
According to Brav, Jiang, and Li (2017), a fund votes differently from other funds within the same family only
5.5% of the time.
Glass Lewis’s voting recommendations
Glass Lewis's Proxy Paper database contains similar information to ISS’s Voting Results database, covering
both annual and special shareholder meetings. In addition, the database features Glass Lewis recommendations.
We merge the Glass Lewis data with ISS Voting Analytics using CUSIP, meeting date and proposal number.
As CUSIP and proposal number may differ between the two files, we manually check whether the unmatched
proposals exist in ISS Voting Analytics.
In addition to the actual voters, we also treat ISS and Glass Lewis as two separate voters. Similarly, we treat
management recommendations as votes by a generic “management” voter, ignoring heterogeneity in
management across firms. These three “voters” are included primarily as a way of pinning down our scaling
procedure. Our results are robust to excluding them. In the filtered dataset that is the basis of our main
analysis, there are 3,318 proposals. Management made recommendations on 3,314, ISS on 3,313, but Glass
Lewis only on 476 as our data on Glass Lewis recommendations end in December 2011.
Public Pension Fund Voting Records
To our knowledge, this is the first study that systematically examines public pension funds’ voting records
(Davis and Kim (2007) study only Calpers’s voting records for a limited number of proposals). Since there is
no centralized database for U.S. public pension funds (state or city), we have used state public records laws to
2 We categorize sponsors by following the definitions by Proxy Monitor: individual, company, social-other, religious
institution, public policy interest group, proxy service, company-specific labor union pension fund, socially responsible
investing fund, employee-owned asset manager, asset manager, and public pension fund.
6request their proxy voting records. 3 Our list of 100 pension funds comes from Pensions & Investments 1,000 largest
retirement plans: 2016. The data we received is similar in format to the ISS Mutual Fund Voting Record database.
It provides the identity of the company (name and CUSIP), proposal number, description of proposal,
shareholder meeting date, identity of sponsor, and vote cast. We merge this pension fund vote data with ISS
Voting Analytics using CUSIP, meeting date, and proposal number. Again, when CUSIP and proposal number
differ between the two files, we manually check whether the unmatched proposals in the pension fund data
exist in ISS Voting Analytics.
Summary Statistics
Our sample consists of 4,887 proxy proposals in fiscal year 2012 originating from Russell 3000 firms. There are
2,621 shareholder meetings in the data, so the modal meeting generates only one proxy vote. This implies that
meeting (company) fixed effects are unimportant.
As shown in Table 1, Panel A, there are votes by 284 institutional investors, of which 238 are mutual fund
families and 46 are public pension funds. At least one mutual fund family voted on each of the 4,887 proposals.
Shareholders sponsored 496 of these proposals, and the remainder were sponsored by management. A public
pension fund in our sample participated in at least one of 2,057 meetings and voted on at least one of 3,756
proposals. (The 3,756 are a subset of the 4,887 voted on by mutual fund families.) Shareholders sponsored 459
of these proposals, and the remainder were sponsored by management. There are 80 unique shareholder
sponsors. The Glass Lewis data for fiscal year 2012 covers only 428 meetings featuring 805 proposals, 31 of
which are sponsored by shareholders.
Panel B shows the frequency of proposals by proposal type. One salient pattern is that social-related proposals,
all of which are sponsored by shareholders, are concentrated at only several dozen firms. This suggests that
shareholder proponents selectively target firms where social issues are most concerning. The vast majority of
compensation proposals are sponsored by management, reflecting the fact that “Say-on-Pay” proposals have
been mandatory since 2011. Almost half of governance-related proposals are put forth by shareholders, and
they outnumber all social-related proposals combined. This suggests that shareholder proponents pay particular
attention to corporate governance at selected firms. Almost all other proposals are sponsored by management.
In panel C, we report support rates for various shareholder-sponsored proposals broken down by the different
categories of “investors.” For each type of investor, their support rate for each proposal type is defined as the
percentage of “For” votes cast. Note that public pension funds are more likely than mutual funds to support
shareholder proposals. The difference in support rates for all shareholder proposals is 20.9% (t-statistic = 35.6),
but this difference is particularly large for social proposals (50.4% vs. 27.7%), consistent with the notion that
public pension fund votes may also have a broader political motive.
ISS recommended to vote “For” for 73.8% of the shareholder proposals. The top three categories that receive
most ISS support are related to compensation, governance and diversity issues. Glass Lewis recommendations
are available for only half of the proposal types. Governance related proposals attracted most Glass Lewis
support, followed by animal rights. Management almost always recommended against shareholder proposals.
Panel D reports investors’ support rates for seven management-sponsored proposal categories. For all the
categories, mutual funds are more likely than pension funds to support the proposals, suggesting a management
3All 50 states in the U.S. have public records laws that allow members of the public (including non-residents) to obtain
public records from state and local government agencies.
7friendly stance by mutual funds, potentially due to business ties (Davis and Kim, 2007, and Cvijanovic,
Dasgupta, and Zachariadis, 2016). The difference in support rates for all management proposals is 9.8% (t-
statistic = 44.2). The difference is especially large for compensation-related proposals (87.3% vs. 77.5%).
The correlation between mutual fund/pension fund votes and recommendations from both proxy advisors is
high for most proposal types, suggesting that most investors, mutual funds in particular, tend to follow proxy
advisors’ recommendations. Glass Lewis is not only tougher on management than ISS on most proposal types,
consistent with a key finding in Li (2018), but also shows greater opposition to shareholder proposals.
Panel E reports company characteristics. For our sample of firms holding meetings, the average (median) firm
has assets worth $9.5 ($1.5) billion, and a market capitalization of $5.7 ($1.1) billion. The average return on
assets is 9.9%, while the previous-year stock return is -1.4% on average. The average firm has a book-to-market
ratio of 0.62, pays a 1.7% dividend, and has a leverage ratio of 0.33. The Amihud illiquidity measure for the
average firm is 0.07.
We also keep track of various governance metrics. We classify companies by a governance indicator taking the
value 1 if a company has both a classified board and a poison pill and zero otherwise (Bebchuk and Cohen,
2005). Data on classified boards and poison pill are from RiskMetrics. As shown in Panel D, 14.7% of the
sample firms have both policies in place. We report information on board size and the percent of independent
directors. The median board has 9.3 members and comprises 79.7% independent directors. These figures are
consistent with the findings in the extant literature (e.g., Cai, Garner and Walkling, 2009; Li, 2018). Finally, we
report two executive compensation metrics as in Hartzell, Ofek and Yermack (2004). Our source is Standard
& Poor’s ExecuComp database, which includes base salary, bonus and stock option data for the top five
executive officers of companies in the S&P 1500 index. Our two measures are the year-to-year percentage
change in total compensation and cash compensation as a percentage of total compensation. At the median
company, annual growth in executive compensation is 20.3%, and the cash-to-total compensation ratio is 0.35.
8Table 1: Summary Statistics
This table presents summary statistics for 2,621 meetings in which investors participated during fiscal year 2012.
Panel A reports the number of each voter type, the number of meetings they participated in, and the number
of proposals they voted on. Panel B provides the frequency of proposals by proposal type. Panels C and D
show support rates by each investor type for shareholder- and management-sponsored proposals. Panel E
provides the average, median, and standard deviation for firm characteristics. Assets are in billions of dollars.
MV is market capitalization in billions of dollars. ROA is return on assets, defined as EBITDA/assets. Prior-
year stock return is the buy-and-hold stock return during the 12 months prior to the contested meeting. B/M is
the market-to-book ratio defined as (book value of equity)/(market value of equity). Dividend yield equals
(common dividend + preferred dividend)/(market value of common stock + book value of preferred). Leverage
is defined as the ratio of debt to the sum of debt and equity, all in book values. Institutional ownership, is the
fraction of shares held by institutional investors, as reported by the Thomson Reuters Ownership Database.
Amihud illiquidity is the yearly average (using daily data ending quarter t-1 from CRSP) of
1000�|ret|/dollar trading volume. Classified board & poison pill is a dummy variable equal to 1 if the company
has both a classified board and a poison pill, 0 otherwise. A classified board (or “staggered” board) is one in
which the directors are placed into different classes and serve overlapping terms. A poison pill provides
shareholders with special rights in the case of a triggering event such as a hostile takeover bid. Typical poison
pills give the target’s stockholders other than the bidder the right to purchase stock in the target or the bidder’s
company at a steep discount, making the target unattractive or diluting the acquirer’s voting power. Board size
is the number of board members. Ratio of independent directors is the number of independent directors divided by
the total number of directors at the firm. ∆Executive compensation YOY is the percentage change in total executive
compensation year-on-year. Cash/total compensation is the ratio of salary and cash bonus to total compensation.
Panel A: Investor participation in meetings and votes on proposals
Number of Number of Number of all Number of Number of
voters meetings with proposals with proposals by proposals by
at least one at least one vote shareholders management
vote with at least one with at least one
vote vote
Mutual fund families 238 2,621 4,887 496 4,391
Public pension funds 46 2,057 3,756 459 3,297
ISS 1 2,619 4,878 496 4,382
Glass Lewis 1 428 805 31 774
Management 1 2,620 4,867 487 4,380
9Panel B: Frequency of proposals by proposal type
Proposal type Proposal category Number of proposals Number
(by shareholder) of firms
Animal rights Social 14 (14) 14
Charitable giving Social 1 (1) 1
Diversity Social 12 (12) 12
Employment and human rights Social 16 (16) 16
Environment Social 53 (53) 41
Healthcare Social 1 (1) 1
Political Social 77 (77) 69
Product safety Social 4 (4) 4
Social – other Social 1 (1) 1
Compensation Governance and compensation 3627 (67) 2482
Governance Governance and compensation 516 (248) 371
Capital Financials and investment policy 229 (2) 174
Restructuring Financials and investment policy 109 (0) 104
Financials Financials and investment policy 23 (0) 17
Investment policy Financials and investment policy 3 (0) 3
Other (management) Routine/miscellaneous 201 (0) 189
Total 4,887 (496) 3,310
Panel C: Support rates for shareholder proposals
Mutual fund Public pension ISS Glass Management
families funds Lewis
Animal rights 6.2% 17.6% 0.0% 50.0% 0.0%
Capital 2.3% 5.0% 0.0% 0.0% 0.0%
Charitable giving 1.6% 9.5% 0.0% -- 0.0%
Compensation 43.9% 55.6% 89.6% 20.0% 1.5%
Diversity 42.2% 56.9% 83.3% -- 0.0%
Environment 26.1% 39.0% 54.7% 0.0% 0.0%
Governance 64.4% 87.0% 87.5% 85.7% 3.3%
Healthcare 2.9% 22.2% 0.0% -- 0.0%
Employment and Human rights 24.3% 25.0% 50.0% -- 0.0%
Political 27.7% 50.4% 54.5% 25.0% 0.0%
Product safety 5.2% 16.1% 0.0% -- 0.0%
Social – other 0.6% 0.0% 0.0% -- 0.0%
Total 46.4% 67.3% 73.8% 51.6% 1.8%
10Panel D: Support rates for management proposals
Mutual fund Public pension Management ISS Glass Lewis
families funds
Capital 85.0% 69.4% 100% 82.2% 77.3%
Compensation 87.3% 77.6% 100% 86.1% 81.7%
Financials 99.6% 97.8% 100% 100.0% 100.0%
Governance 93.5% 92.1% 100% 91.0% 82.9%
Investment policy 91.2% 90.0% 100% 100.0% --
Other (management) 69.3% 36.3% 100% 66.0% 79.0%
Restructuring 98.5% 97.4% 100% 98.2% 94.7%
Total 87.3% 77.5% 100% 85.7% 82.3%
Panel E: Company characteristics
Average Median Std. Dev.
Firm characteristics
Assets ($billion) 9.464 1.529 32.996
MV ($billion) 5.713 1.116 17.493
ROA 0.099 0.111 0.165
Prior-year stock return -0.014 -0.026 0.349
B/M 0.621 0.531 0.655
Dividend yield 0.017 0.003 0.037
Leverage 0.328 0.254 0.745
Institutional ownership 0.720 0.765 0.222
Amihud illiquidity 0.073 0.043 0.087
Governance measures
Classified board & poison pill 0.147 0.000 0.354
Board size 9.335 9.000 2.306
Ratio of independent directors 0.797 0.818 0.105
∆Executive compensation YOY 0.203 0.094 0.619
Cash/total compensation 0.346 0.302 0.189
3 Methodology
Overview
We scale the data using the Euclidean spatial model approach embedded in McCarty, Poole, and Rosenthal’s
(1997) W-NOMINATE. We use the publicly available R version of the program. W-NOMINATE and the
closely related DW-NOMINATE (Poole and Rosenthal, 2007) have been widely used in the political science
literature to determine the dimensions of ideological disagreements and legislators’ ideal points. Although W-
NOMINATE has been mostly applied to study decision-making in legislatures, this scaling algorithm can in
principle be applied to any collective binary choice problem. To the best of our knowledge this paper is the
first application of the W-NOMINATE scaling method to corporate voting. The basic idea behind W-
NOMINATE is to project the choices shareholders face onto a low-dimensional Euclidean space. In this paper
we only consider a one-dimensional space. In future work we plan to extend the analysis to two or possibly
more dimensions should more explanatory power be obtained by expanding the dimensionality of the space. A
central assumption is that institutional investors have single-peaked preferences and that on average they vote
11in favor of the alternative that is closest to their ideal point. The estimation procedure assumes that voters on
occasion do make mistakes and do not always vote for the alternative closest to their ideal point. Indeed, the
estimation algorithm works best if votes are not perfectly predictable. More precisely, voter utility is a Gaussian
function of the distance between the ideal point and the alternative plus a random component that leads to
logit estimation. Voters who tend to vote similarly on most proposals will have ideal points that are closer
together. For a comprehensive and detailed exposition of W-NOMINATE and other spatial scaling methods,
see Poole (2005).
Characteristics of Proxy Voting that Impact Scaling
Excluding Investors with Few Votes
Our data is very sparse compared to roll call voting in Congress. In the fiscal year 2012 data, there are 1,783,755
proposal-institution pairs. The vast majority of these represents pairs where the institution did not vote because
it did not own common stock in the firm with a proposal. In only 382,221 pairs was the median institution
eligible to vote. Of these, 4,704, or 1.23 percent of the total, were cases of abstention. Because abstentions are
rare, we treat them like non-ownership as missing data. Votes “Against” the proposal were 19.38% and votes
“For” were 79.39%. The presence of substantial voting “Against” is a first indication that shareholders were
far from unanimous.
As compared to the U.S. Senate where nearly 100 senators will vote on hundreds of roll calls in a year, and, a
fortiori to the House of Representatives with 435 members, “turnout” of our investors is sparse, with many
owning shares in only a few dozen companies. A parameter in W-NOMINATE allows us to exclude funds
that vote infrequently. In their initial analysis of Congress, Poole and Rosenthal (1991) set a minimum of 20
votes for a legislator to be included in the estimation. This value has been carried forward as the default in W-
NOMINATE. The analysis of Congress will be insensitive to this parameter, particularly since 1945, when,
except in cases like death, all legislators vote on almost all roll calls. Here we find that results had more face
validity when we set 50 as the minimum. We set the parameter minvotes to 50 to reduce noise in the estimation.
Excluding Lopsided Votes
Among included voters, W-NOMINATE discards lopsided votes that may be more subject to idiosyncratic
behavior. In developing NOMINATE in the 1980s, Poole and Rosenthal discovered that many lopsided roll
calls did not fit the spatial model. Model fit and external validity were improved if such roll calls were not
included in the estimation. They excluded roll calls with fewer than 2.5% of the voters voting in the minority.
The 2.5% threshold became a default that was not subject to systematic investigation. The default value of the
lop (Armstrong et al., 2014) parameter in W-NOMINATE is 2.5% of those voting on the minority side.
Although our votes are not unanimous, they are much less divisive than congressional voting. With our data,
we find that 3% or lop=0.03 is more appropriate.
Although the data contains 284 institutions and 4,887 proposals, imposing the constraints illustrated above
leads us to have at most 251 institutions and 3,318 proposals in our analysis, as shown in Table 2. The deleted
institutions numbered 27 mutual funds and 6 pension funds. In sum, our main analysis includes 251 mutual
funds and pension funds. We also report on analysis for mutual funds only, where we have 210 investors.
Finally, note that each institution is treated as having a single vote. Votes in this initial work are not weighted
by the number of shares owned.
12Table 2: Summary Statistics for Specifications
All voters voting fewer than 50 times are excluded. After excluding voters, proposals that have fewer than 3%
of the remaining voters voting on the minority side are excluded. All specifications include the
recommendations of management, ISS, and Glass Lewis as votes. APRE stands for the Aggregate Proportion
Reduction in Error.
Number of Number of % Correctly APRE Beta
Voters Proposals Classified
Mutual FundsOnly 210 3,057 88.88 0.357 21.40
Mutual Funds and
251 3,318 88.86 0.356 21.86
Pension Funds
Few Voters Per Proposal
Another feature of our data that makes it quite distinct from legislative roll call voting is that there are many
proposals with relatively few voters. In Figure 1, Panel A below, we graph the density of votes across the 3,318
proposals retained in the estimation. It can be seen that the modal proposal has about 60 votes and not 251.
W-NOMINATE does not have a parameter that allows us to exclude proposals with few voters. The “small
legislature” problem is probably concentrated in the smaller firms of the Russell 3000 and could be avoided by
focusing the estimation on the largest firms in the S&P1500 or S&P500.
Panel B of Figure 1 further shows that the number of voters varies by proposal type. “Social” proposals,
represented by the blue bars, appear more likely to have a high number of voters, with a median well above 100
voters. This could be due to the fact that such proposals attract more interest, or involve higher stakes, so that
fewer voters are likely to abstain. Alternatively, this could be due to the fact that such social proposals are more
common at large firms, which have a higher number of institutional shareholders and thus voters. Governance
and Compensation proposals, represented by the orange bars, are next with a median number of voters of
about 60, followed by financial and investment policy proposals, which have a median of around 50 voters.
Figure 1
Panel A. Distribution of Number of Voters on Proposals, Fiscal Year 2012
13Panel B. Distribution of Number of Voters by Proposal Type, Fiscal Year 2012
4 Results
We begin by discussing the overall fit of the W-NOMINATE estimation. Classification is equally good if we
include or exclude pension funds. (Note that the set of proposals in the mutual funds only case is not a strict
subset of those when pension funds are included. Because pensions funds typically vote with the minority,
more proposals get included. But if the pension funds vote with the majority, the minority can fall below 2.5%).
In both cases, as shown in table 2, we correctly classify just under 89% of the votes. Overall fit is assessed by
the Average Proportionate Reduction in Error (APRE), which is simply:
1-(Total Classification Errors)/(Total Votes on Minority Side).
An observation is a classification error if its predicted probability is less than 0.5. The APREs of 0.356 and
0.357 are less than those for congressional roll calls, largely because votes are more one-sided. That is,
minorities are smaller. In contrast, the Beta, or the signal-to-noise parameter, is estimated at approximately 21.5,
considerably larger than those found for Congress (thus, the default starting value for Beta in W-NOMINATE
is 16). The large Betas show that the ideological component of voting is large relative to the random error
components.
Investor Ideology: Ideal Point Estimates
We start discussion of substantive results by reporting the estimated investor ideal points, which reflect the
revealed ideology of institutional investors. Panel A of Figure 2 shows the ideal points when just mutual funds
are included. Panel B includes the pension funds. The pension fund portion of each bar is shown in blue. W-
NOMINATE constrains ideal points to [-1,+1]. The arbitrary (and inconsequential) polarity of the estimation
was chosen such that socially oriented investors appear on the left. The two distributions are quite similar. The
ideal points for mutual funds in both estimations correlate at r=0.976.
The first immediate observation is that institutional investor votes are far from reflecting shareholder unanimity.
Institutional investors differ markedly in their ideologies, with funds like Domini Social Investments on the far
left of our one-dimensional spectrum and Allied Asset Advisors on the far right. Consistent with its voting
record, Domini Social Investments describes its investment philosophy as follows: “We believe that all
14investments have social and environmental implications. We apply social, environmental and governance
standards to all of our investments, believing they help identify opportunities to provide strong financial
rewards to our fund shareholders while also helping to create a more just and sustainable economic system.”
In contrast and somewhat surprisingly Allied Asset Advisors describes itself as a sharia compliant investor
pursuing an investment strategy that is consistent with Islamic principles. One would expect to see the ideal
point of such a fund to be closer to that of other funds with social and environmental goals, and not at the far
right spectrum together with value funds like Leuthold Weeden Capital Management, which “stresses
quantitative measures of value combined with recognition of fundamental and technical trends, [and pursues]
A policy of disciplined, unemotional, and strategic investing, backed by solid and comprehensive research,” or
Needham Asset Management, LLC, which focuses on investments with “an emphasis on tax-efficient capital
appreciation and preservation,” (see Table 3 below). Unlike Allied Asset Advisors none of the other far right
extremist funds in Table 3 mention anything about ethical, environmental, or social concerns. 4
The second salient observation is that the ideal point of management is close to the far right. Recall that we
take management recommendations in support of or against shareholder proposals as votes by a generic
“management” voter. The position of the management ideal point on the far right mostly indicates the near
systematic opposition of management to shareholder proposals. The extremists on the right of management
are in unison with management in opposing (other) shareholders’ proposals. There are only 12 such extremists
and their ideal points are not significantly different from that of the management recommendations.
The third main observation is that the distribution of ideal points is close to unimodal, quite distinct from the
bimodal distribution in Congress where political party polarizes members. (Not much should be made of the
small peaks on the left and right ends; these arise partly through the [-1,+1] constraint in W-NOMINATE).
The highest peak in the center includes the ideal points of Invesco, J.P. Morgan, Prudential and Fidelity. There
is a caveat to unimodality: the proxy adviser Institutional Shareholder Services (ISS) does appear to coordinate
the votes of a significant number of institutional investors. Thus ISS has over 35 funds that have nearly the
same ideal point. The coordinating effect appears as a distinct peak in both panels. Glass Lewis has just short
of twenty investors with the same ideal point, but the histograms provide no hint of coordination. Interestingly,
ISS’s ideology is center-left, while Glass Lewis is center-right. A significant fraction of both institutional
investors and pension funds are in between ISS and Glass Lewis, an indication they sometimes side with one
or the other proxy adviser when the two advisers’ recommendations differ.
The fourth observation is that the large passive asset managers Blackrock and Vanguard have different ideal
points than the two proxy advisers. Both asset managers have communicated that while they rely on the
recommendations of ISS and Glass Lewis to guide their votes, they do not slavishly follow these
recommendations. 5 This voting policy is reflected in their different ideal points. Interestingly, their ideal points
are to the right of the proxy advisers, which suggests that they are both less concerned about environmental
and social issues and that they tend to side more with management. Note, however, that the data is for fiscal
year 2012; in recent years both BlackRock and Vanguard may have moved to the left.
So far we have not distinguished between pension funds and mutual funds. But it is to be expected a priori that
pension funds have different ideologies from mutual funds because they may have a duty to vote in line with
their members’ preferences. This difference in ideologies is reflected in Panel B of Figure 2. The white bars
4 This paragraph is based on a manual search of the web sites of the institutions.
5 In its Proxy Voting and Shareholder Engagement FAQ document Blackrock states “We subscribe to a number of
different research products which we take into consideration when deciding how to vote at U.S. company meetings.
We do not follow the recommendations of any one provider but make our voting decision based on what we consider
to be in the best long-term economic interests of fund investors.” https://www.blackrock.com/corporate/en-
lu/literature/fact-sheet/blk-responsible-investment-faq-global.pdf
15represent the distribution of ideal points for fund families, management, ISS and Glass Lewis, while the blue
bars reflect the ideal points for pension funds. As the figure shows, pension funds are more to the left than
mutual funds and show greater concern for environmental and social issues. In particular, all pension funds,
with the exception of the pension fund of Indiana, are to the left of Vanguard and Blackrock. There is a group
of pension funds on the center left together with Fidelity, Prudential and Invesco.
The overall similarity of panels A and B largely reflects the fact that social investors like Domini continue to
appear at the left end. This is perhaps surprising because state and union pension funds might have appeared
to the left of all private investors. (There are slight differences between the two panels. These differences may
reflect the different set of proposals and the influence of the pension fund votes on the estimated roll call
parameters. As the roll call parameters shift, the ideal points will adjust. The fact that the changes are minor is
an indication of robustness.)
In sum, the ideal point results show a clear spatial structure. The left represents relatively socially-oriented
investors, while the right represents Management recommendations and exclusively profit-oriented investors.
Figure 2
Panel A. Ideal Points, One Dimension W-NOMINATE, Mutual Fund Only Estimation
16Panel B. Ideal Points, One Dimension W-NOMINATE, Mutual and Pension Fund Estimation
Note: Pension Funds Shown in Blue.
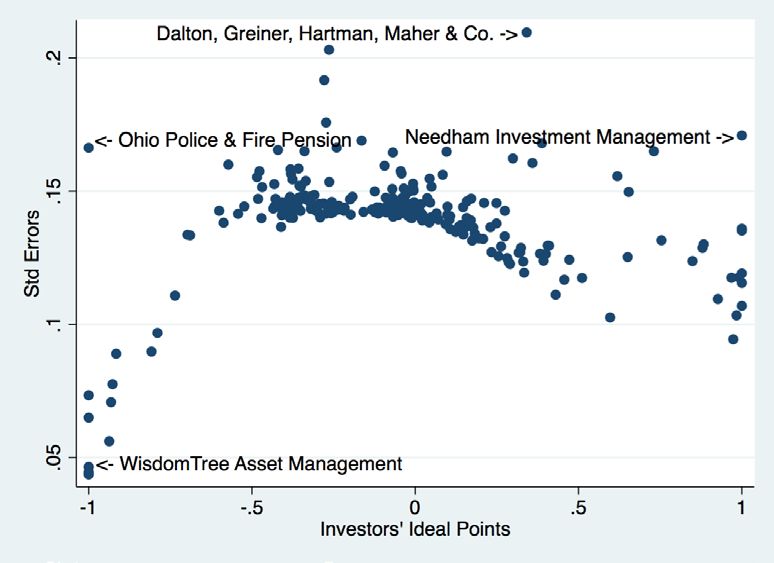
We now provide more context to our interpretation of the ideal point estimates by reporting, in Table 3, the
identity of extremists on the left and the right, their ideal points, standard errors and correct classifications for
the estimation with pension funds. All standard errors reported in this paper come from running 1000
parametric bootstraps in W-NOMINATE. Those in table 3 range from 0.04 to 0.17, showing that the
ideological locations are estimated relatively precisely. Recall that the dimension is of length 2.
Knowing the identity of the extremists allows us to make a first simple exploration on whether their voting
records, summarized by the estimated ideal points, correspond to the advertised investment philosophies of
these funds. As noted above, this is by and large the case, with the possible exception of Allied Asset Advisors.
Both ends include six institutions that are constrained to be at -1. That is, without the constraint, ceteris paribus
they would be moved further left, possibly to outer space. Half of the six constrained organizations on the left
are public pension funds even though pension funds are less than one-fifth of our sample.
The constraint at the ends can induce a jump between the extremes and the first interior ideal point. This is not
a problem on the right end. Moreover, the votes of the institutions on the right are either perfectly classified or
nearly so. They are constrained because their location cannot be pinned down, just as a simple logit will “blow
up” if the dependent variable is perfectly classified. On the left there is a jump, with the first interior institution
being only at -0.937. Moreover, the percent of correct classifications, with the exception of the Ohio Pension
Fund, are below the average for all voters. The difference between the results for left and right extremists
suggests that proposal voting may exhibit considerable heteroscedasticity, contrary to the assumption
underlying W-NOMINATE that all errors are i.i.d from the same distribution. Nonetheless, the results make
substantive sense with socially oriented investors on the left and profit oriented ones on the right.
17Table 3: Extremist Investors in the One-Dimensional W-NOMINATE Scaling
Std. Fraction Correctly
Institution Name Ideology
Error Classified
Socially and Environmentally oriented
AFSCME Employees Pension Plan -1 0.065 0.835
Domini Social Investments LLC -1 0.073 0.793
Empiric Advisors, Inc. -1 0.044 0.765
Ohio Police & Fire Pension Fund -1 0.166 0.925
State Universities Retirement System of Illinois
-1 0.046 0.771
(SURS)
WisdomTree Asset Management -1 0.044 0.767
Jackson National Asset Management, LLC -0.937 0.056 0.771
Colorado Fire & Police Pension Association
-0.932 0.071 0.793
(FPPACO)
Profit Oriented
Leuthold Weeden Capital Management 0.984 0.103 0.981
Reynolds Capital Management 0.992 0.118 0.998
Allied Asset Advisors, Inc. 1 0.116 1
Bridges Investment Management, Inc. 1 0.107 1
Cooke & Bieler, L.P., 1 0.136 1
Friess Associates, LLC 1 0.119 1
Jensen Investment Management, Inc. 1 0.135 1
Needham Investment Management L.L.C. 1 0.171 0.990
18You can also read