Community-wide hackathons to identify central themes in single-cell multi-omics - Genome Biology
←
→
Page content transcription
If your browser does not render page correctly, please read the page content below
Lê Cao et al. Genome Biology     (2021) 22:220
https://doi.org/10.1186/s13059-021-02433-9

 OPEN LETTER                                                                                                                                      Open Access

Community-wide hackathons to identify
central themes in single-cell multi-omics
Kim-Anh Lê Cao1*, Al J. Abadi1, Emily F. Davis-Marcisak2, Lauren Hsu3,28, Arshi Arora4, Alexis Coullomb5,
Atul Deshpande6, Yuzhou Feng1, Pratheepa Jeganathan25, Melanie Loth6, Chen Meng26, Wancen Mu7,
Vera Pancaldi5,8, Kris Sankaran9, Amrit Singh10,29, Joshua S. Sodicoff11,12, Genevieve L. Stein-O’Brien2,6,13,30,
Ayshwarya Subramanian14, Joshua D. Welch11,15, Yue You16,31, Ricard Argelaguet17, Vincent J. Carey18,
Ruben Dries19,32,33, Casey S. Greene20, Susan Holmes21, Michael I. Love7,27, Matthew E. Ritchie16,22,31,
Guo-Cheng Yuan23, Aedin C. Culhane3,28 and Elana Fertig6,24,34

* Correspondence: kimanh.lecao@
unimelb.edu.au
1
 Melbourne Integrative Genomics,
School of Mathematics and
Statistics, University of Melbourne,   Introduction
Melbourne, Australia                   Biological systems are fundamentally multi-scale, with mostly uncharacterized molecu-
Full list of author information is
available at the end of the article    lar pathways, cellular actions, and cellular communities that collectively give rise to
                                       their function. While one high-throughput measurement technology can resolve
                                       specific biological molecules, comprehensive characterization of biological systems can
                                       only be achieved by integration of multi-modal data types across molecular, cellular,
                                       spatial, and population scales. The integration of heterogeneous and complementary
                                       assays from multi-omics can reveal interactions between modalities that drive bio-
                                       logical systems and processes. Recent advances in single-cell multi-omics technologies
                                       provide unprecedented opportunities for such multi-scale characterization but inter-
                                       preting biological processes from these data requires parallel advances in novel compu-
                                       tational techniques.
                                         Advances in multi-omics technologies are creating tremendous new data resources
                                       and emerging atlas-based initiatives to uncover fundamental cellular biology. Single-
                                       cell multi-omics technologies have started to be developed only 6 years after single-cell
                                       sequencing. Their promise to the scientific community has been widely recognized,
                                       and they were even proclaimed the method of the year of 2019 to provide unique
                                       opportunities to characterize each cell at both spatial and molecular levels [1]. To date,
                                       these technologies have mostly focused on matched pairs of datasets such as mRNA-
                                       genome sequence, mRNA-DNA methylation, mRNA-chromatin accessibility, and
                                       mRNA-protein at the single-cell resolution, using assays such as scRNA-seq for tran-
                                       scriptomics, G&T-seq [2] and scTRIO-seq [3] for genomics (DNA and RNA), CITE-
                                       seq [4] for proteomics (surface protein and RNA), scNMT-seq [5] for epigenomics
                                       (DNA methylation and chromatin accessibility), to list a few [6]. These technologies
                                       © The Author(s). 2021 Open Access This article is licensed under a Creative Commons Attribution 4.0 International License, which
                                       permits use, sharing, adaptation, distribution and reproduction in any medium or format, as long as you give appropriate credit to
                                       the original author(s) and the source, provide a link to the Creative Commons licence, and indicate if changes were made. The
                                       images or other third party material in this article are included in the article's Creative Commons licence, unless indicated otherwise
                                       in a credit line to the material. If material is not included in the article's Creative Commons licence and your intended use is not
                                       permitted by statutory regulation or exceeds the permitted use, you will need to obtain permission directly from the copyright
                                       holder. To view a copy of this licence, visit http://creativecommons.org/licenses/by/4.0/. The Creative Commons Public Domain
                                       Dedication waiver (http://creativecommons.org/publicdomain/zero/1.0/) applies to the data made available in this article, unless
                                       otherwise stated in a credit line to the data.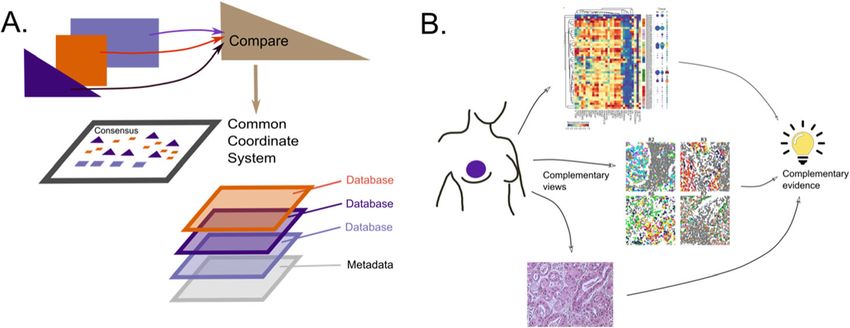
Lê Cao et al. Genome Biology   (2021) 22:220                                                                    Page 2 of 21

                 provide what we refer to in this manuscript as multiple modalities of information.
                 However, the rapid progress of technology development has outpaced the complemen-
                 tary computational advances necessary to analyze these data in an integrated fashion to
                 uncover regulatory biology.
                    The goal of multi-modal single-cell data analysis is ultimately to explore relationships
                 between data modalities, such as cell type-specific cis gene regulatory mechanisms ob-
                 served between chromatin accessibility and gene expression. Computational methods
                 for single-cell data integration have evolved from the extensive literature of multi-
                 omics bulk data integration methods. These broadly fall into two categories. First, clus-
                 ters can be built using pairwise distance matrices to identify common subgroups of fea-
                 tures, such as cell types, in each data modality or between data modalities [7] that are
                 subsequently input to cell type-specific network methods to infer regulatory mecha-
                 nisms. Second, dimension reduction approaches can extract and combine latent com-
                 ponents of global variance that are shared between data modalities [8], thereby learning
                 novel cellular and molecular pathways associated with biological processes directly
                 from the data. However, single-cell data differ in their resolution, size, scale, and spars-
                 ity that present new computational challenges not addressed in the algorithms devel-
                 oped for bulk multi-omics data. For example, the advent of spatial assays requires new
                 adaptations of techniques from environmental statistics to infer cellular communities
                 driving phenotypic fates in biological systems. In addition, one multi-omics dataset may
                 require a breadth of analysis methods to uncover distinct regulatory processes.
                    Novel computational methods to analyze single-cell multi-omics data from these
                 technologies are rapidly emerging. Ground truth is necessary to ensure analysis
                 methods uncover accurate cell biology, but is missing to formulate the optimal models
                 that underlie computational methods for multi-omics analysis. As a result, comprehen-
                 sive assessment of new methods’ performance is often missing. Instead, the efficacy of
                 these methods is usually assessed via visualization and biological and functional assess-
                 ment of marker gene lists derived from prior biological knowledge. Quantitative com-
                 parisons between analysis methods are challenged by the lack of gold standard
                 benchmarking datasets in the field and lack of biological ground truth. In fact, bio-
                 logical discovery of the regulatory processes that span molecular scales is an active area
                 of biological research and a key motivation for generating multi-modal single-cell data-
                 sets. Often, conceptual advances to model innovative regulatory mechanisms make
                 greater advances to multi-modal data analysis than do advances to raw performance
                 metrics. Thus, benchmarking these techniques requires qualitative assessment sup-
                 ported through mechanistic experimental validation rather than the traditional quanti-
                 tative assessment used in computational disciplines for methodological performance.
                    Collaborative community analysis of standardized datasets provides a transparent, re-
                 producible, and reliable way to review the current state of the art in single-cell multi-
                 modal data analysis [9]. In addition, enabling these analyses through open science on
                 publicly available datasets can identify the range of computational challenges for the
                 single-cell multi-omics community and catalyze the development of unforeseen algo-
                 rithmic advances. Indeed, the wealth of biological knowledge that can be gleaned from
                 independent analysis approaches can help identify not only common themes but also
                 technology-specific challenges to be solved. To enable these efforts, we designed a
                 series of three hackathons emblematic of current challenges that spanned spatial
Lê Cao et al. Genome Biology   (2021) 22:220                                                                  Page 3 of 21

                 transcriptomics, spatial proteomics, and epigenomics. Although these tasks involved
                 different biological processes and systems, we leveraged common analysis approaches,
                 software infrastructures, and visualizations that are technology independent, while also
                 demonstrating that some multi-omics approaches should also be biology or
                 technology-specific. Datasets and analysis codes are publicly available on https://github.
                 com/birsbiointegration as a resource to the community to expedite and advance the fu-
                 ture of multi-omics data analysis.
                   This article articulates the needs for technologies, data, tools, and computational
                 methods to model the multi-scale regulatory processes of biological systems in single-
                 cell identified our three hackathon studies. It leverages these challenges to present a
                 broad overview of the different types of analysis methods that can be currently applied
                 to identify regulatory processes from multi-omics single-cell data sets and promising
                 areas of future algorithmic development.

                 Computational benchmarks are missing in cell biology
                 In spite of the widespread demand for single-cell, multi-omics analysis methods, the
                 computational biology community lacks standardized benchmarks to assess the per-
                 formance and applicability of these methods. Benchmarking methods for multi-modal
                 data is inherently difficult, as ground truth is rarely available. Many of the mechanisms
                 through which molecular and cellular pathways interact across scales remain unknown.
                 In the case of well-defined data integration tasks, ground truth can be introduced to as-
                 sess computational performance by simulating high-throughput data in silico. Yet, the
                 simulation of a realistic covariance structure across features is challenging and further
                 complicated when modeling data across modalities in the context of data integration
                 [10]. Common experimental designs to overcome these challenges involve creating arti-
                 ficial samples through the mixing of cells in known proportions [11–13] or creating di-
                 lution series to simulate variation in cell size [11, 14]. Simulating data is also popular
                 and made more convenient through software such as the splatter R package [15] (Fig. 1).
                 Still, these simulated data also rely on an underlying generative model that may intro-
                 duce further biases based on the assumptions of that model and often cannot account
                 for regulatory mechanisms that have yet to be discovered biologically.
                    The ideal benchmark datasets for multi-omics would be based on the biological real-
                 ity of molecular and cellular networks, with full capacity to predict the biological im-
                 pact of perturbations and temporal evolution. No universal benchmark data scheme
                 may suit every combination of single-cell data modalities or biological problems. In-
                 stead, benchmark datasets should be established for commonly used combinations of
                 modalities or technologies tailored to specific data integration tasks. For example, gene
                 expression depends on gene regulatory element activity and thus requires an experi-
                 mental design that must also account for spatial and temporal elements for a given cell.
                 Therefore, defining a specific data integration task, and benchmarking the computa-
                 tional performance of the method for assessment relies on multi-modal data with spe-
                 cific study designs. These study designs should account for the biological dependencies
                 between data modalities in sufficiently powered sample cohorts. The pervasive technical
                 biases of high-throughput data require that the benchmark datasets and computational
                 approaches also account for technical variability, leveraging block design and
Lê Cao et al. Genome Biology (2021) 22:220 Page 4 of 21
Fig. 1 Systematic benchmarking of single-cell multi-omic analysis methods can involve experimental data
(as per our hackathons), custom control datasets, where a known structure is imposed through the
experimental design, or simulated data. The amount of biological signal and ground truth available varies
considerably between these types of data. The generated multi-omics datasets are analyzed by competing
methods and the results are compared using generic metrics (e.g., method stability, runtime, consistency
via data splitting) or by considering the ground truth available (e.g., cell type labels or number of cell types)
randomization to ensure that the data integration algorithm distinguishes intended
regulatory processes from unintended technical variation.
Assessing single-cell multi-omics analysis methods through hackathon
studies
One powerful means of engaging the community for comparison of multi-omics tech-
niques is hackathon studies. These studies can leverage real data for benchmarking and
defining challenges in multi-omics, even though ground truth is inherently unknown.
Notably, the biology underlying a specific dataset can guide the question underlying the
design of a specific multi-modal data challenge. Once a specified analysis task is identi-
fied, cross-validation within a study or across studies allows to assess whether solutions
found by multi-modal methods generalize to held-out observations or held-out studies.
We can also use subsampling on real-world data to assess the stability of the results
(Fig. 2: 12, Additional file 1: Supplemental Notes S1 and S4). Finally, we can validateLê Cao et al. Genome Biology (2021) 22:220 Page 5 of 21
Fig 2 Vignettes for reproducible analyses are available at https://github.com/BIRSBiointegration/Hackathon/blob/
master/analysis-vignettes.md. The hackathons analyses conducted in R were assembled into R packages as well as
Docker containers. This allows reproducing the analysis environment in a seamless manner. Those conducted in
Python marked with an asterisk (*) enabled automatic installation and deploymentLê Cao et al. Genome Biology (2021) 22:220 Page 6 of 21
analysis approaches by benchmarking several algorithms and methods on the same
dataset, allowing for open comparison of both standard and new methodologies. Al-
though hackathons aim to standardize assessment of algorithm quality across research
groups, the lack of ground truth of multi-omics data requires qualitative analysis of the
inferred features across algorithms. Qualitative comparison of the classes of models
used for analysis can also elucidate the range of biological questions and regulatory
processes that can be determined from a single omics dataset. Most importantly, using
community engagement in a hackathon enables us to define the specific problems in
multi-modal data analysis that remain to be solved.
To review the latest computational frameworks for multi-modal analysis, we cu-
rated and designed hackathons for three datasets in single-cell multi-omics. Our
studies focused on emblematic and emerging challenges in data integration across
molecular and cellular scales, as well as emerging technologies. Our challenges
ranged from the incorporation of cell spatial coordinates information (Hackathon 1
“Spatial transcriptomics” and Hackathon 2 “Spatial proteomics”), integration across
different assays (Hackathon 3 “scNMT-seq”), and independent studies (Hackathon
2), epigenetic regulation of transcription (Hackathon 3), and cell type label predic-
tion (all hackathons). The associated computational challenges are described in de-
tail in Additional file 1: Supplemental Notes S1, S2, S3. In addition to reflecting
different technologies, our hackathon studies were also designed to explore dispar-
ate challenges to multi-omics from different measurement technologies, while uni-
fied by the underlying problem of data integration. The complexity of the analysis
challenges depended on the common information available across datasets, i.e.,
whether ‘omics included overlapping features but with various molecular resolution
(Hackathon 1), were measured across independent studies or tissues (Hackathon
2), or were matched on the same cells (Hackathon 3).
All of our hackathon datasets are open access with complementary code for multi-
omics analyses from our contributors on https://github.com/birsbiointegration. We lev-
eraged and built on open frameworks to distribute the multi-omics data and share our
analyses, using tools for continuous integration of changes to source codes (e.g.,
GitHub actions) and container snapshots of the analyses environments for reproducible
analysis (Fig. 2). These open-source software efforts facilitate a community-level coordi-
nated approach to support these validations through collaboration rather than duplica-
tion of effort between groups working on similar problems. A wide array of genomics
frameworks for multi-platform single-cell data developed in R and Python are also
available to the community (Table 1). We used the R/Bioconductor ecosystem for
multi-omics to support our data structures, and the MultiAssayExperiment class from
Bioconductor that provided not only efficient data storage but also enabled the imple-
mentation of further data processing and extraction of spatial information (Additional
file 1: Supplemental Note S6). All participants provided vignettes describing their solu-
tions to enable reproducible, open-source, and open development analysis (Fig. 2). In
total, we pursued fourteen distinct analysis approaches that together illustrate
technology-specific challenges as well as common themes for multi-omics analysis. Sev-
eral challenges identified within each hackathon were addressed with a different set of
methods that are listed in Table 2. The analyses conducted in each hackathon are de-
tailed in the Additional file 1: Supplemental Notes S1, S2, S3.Lê Cao et al. Genome Biology (2021) 22:220 Page 7 of 21
Table 1 List of software for multi-modal single-cell analysis
Type Name Description
Matlab CytoMAP CytoMAP: A Spatial Analysis Toolbox Reveals Features of Myeloid Cell
package Organization in Lymphoid Tissues
Matlab histoCAT histoCAT: analysis of cell phenotypes and interactions in multiplex
package image cytometry data
Python library PyTorch General framework for deep learning
Python & R TensorFlow General framework for deep learning
Python SpaCell SpaCell: integrating tissue morphology and spatial gene expression to
package predict disease cells
Python Scanpy Python package for single-cell analysis
package
R data class MultiAssayExperiment unify multiple experiments
R data class SpatialExperiment SpatialExperiment: a collection of S4 classes for Spatial Data
R package Giotto Spatial transcriptomics
R package cytomapper cytomapper: Visualization of highly multiplexed imaging cytometry
data in R
R package Spaniel Spaniel: analysis and interactive sharing of Spatial Transcriptomics data
R package Seurat R toolkit for single-cell genomics
R package SpatialLIBD Transcriptome-scale spatial gene expression in the human dorsolateral
prefrontal cortex
R package Cardinal Cardinal: an R package for statistical analysis of mass spectrometry-
based imaging experiments
R package CoGAPS scCoGAPS learns biologically meaningful latent spaces from sparse
scRNA-Seq data
R package projectR ProjectR is a transfer learning framework to rapidly explore latent
spaces across independent datasets
R package SingleCellMultiModal Serves multiple datasets obtained from GEO and other sources and
represents them as MultiAssayExperiment objects
R scripts SpatialAnalysis Scripts for SpatialExperiment usage
Self-contained ST viewer ST viewer: a tool for analysis and visualization of spatial transcriptomics
GUI datasets
Shiny app Dynverse A comparison of single-cell trajectory inference methods: towards
more accurate and robust tools
R package mixOmics R toolkit for multivariate analysis of multi-modal data
R package Corral R package for dimension reduction and integration of single-cell data,
using correspondence analysis
Python totalVI A variational autoencoder (deep learning model) to integrate RNA and
package protein data from CITE-seq experiments
Python web ImJoy Deep learning web interface
application
Python napari Interactive big multi-dimensional 3D image viewer
package
Software QuPath Multiplex whole slide image analysis
Python Cytokit Multiplex whole slide image analysis
package
Python cmIF Multiplex whole slide image analysis
package
Software Facetto Multiplex whole slide image analysis, not available yet
Software, CellProfiler Image analysis
Python based
Python library Squidpy Spatial single-cell analysisLê Cao et al. Genome Biology (2021) 22:220 Page 8 of 21
Table 2 Different methods were used in the hackathons and are also available as reproducible
vignettes
Common Tasks Hackathon 1 Hackathon 2 (spatial Hackathon 3 (scNMT-seq)
challenges (spatial proteomics)
transcriptomics)
Pre- Normalization Data distribution Variance Stabilization Summaries of DNA measurements
processing & data checks (Fig. 2: 1, Normalization [16] (Fig. 2: 8) (input data provided in hackathon)
transformation Fig. 2: 4) Arcsinh transformation (Fig. 2: 9).
High Variable Inverse transformation (Fig. 2: 9)
Genes selection Selection of patients (Fig. 2: 9)
(Fig. 2: 5)
Managing Data LIGER [17] (Fig. 2: Multiblock PCA [19] LIGER [17] (Fig. 2: 13) (sc)
differences integration 2) (sc) Weighting matrices based on their Projection method sGCCA [18]
in scale ComBat (Fig. 2: 4) similarities: STATIS, MFA (Fig. 2: 8) (Fig. 2: 11) (bulk)
(bulk) (bulka) Multi Omics Supervised Integrative
Projection Scale MIBI-TOF to the range of Clustering with weights (Fig. 2: 14)
methods MFA, CyTOF values (Fig. 2: 9) (bulk)
sGCCA [18] (Fig. 2:
4a) (bulk)
UMAP/tSNE
(Fig. 2: 2) (sc)
Overlap Cell overlap Dimension reduction and
(features not projection methods:
matching) LIGER [17] (Fig. 2: 13) (sc)
sGCCA [18] (Fig. 2: 11) (bulk)
Partial feature Imputation:
overlap Direct inversion with latent
(cells not variables
matching) Optimal transport to predict
protein expression (Fig. 2: 10)
K-nearest neighbor averaging
(Fig. 2: 9)
No imputation:
Biological Network Interactiona
Partial cell Multiblock PCA [19] (Fig. 2: 8a)
overlap
(features not
matching)
No cell Transfer cell type label with LIGER [17] (Fig. 2: 13)
overlap Random Forest (Fig. 2: 7)
(complete
feature overlap)
No cell Topic modeling to predict cell
overlap spatial co-location or spatial ex-
(partial feature pression (Fig. 2: 9, partial feature
overlap) overlap)
No overlap RLQa [20]
Generic Classification Backward Multi Omics Supervised Integrative
approaches & feature selection with Clustering (Fig. 2: 14) (bulk)
selection SVM (Fig. 2: 1) Lasso penalization in regression-
Self-training ENet type models (bulk)
(Fig. 2: 4)
Balanced error
rate (Fig. 2: 1)
Fig. 2: 4)
Recursive Feature
Elimination (Fig. 2:
5)
(all bulk)
Cell type Projection with
prediction LIGER [17] (Fig. 2:
2)
SVM (Fig. 2: 1,
Fig. 2: 5)
ssEnet (Fig. 2: 4)
(all bulk)
Spatial Hidden Markov Spatial autocorrelation with
analysis random field Moran’s Index (Fig. 2: 7, Fig. 2: 10)
Voronoi Selection of spatial discriminative
tesselation (Fig. 2: features:
1) (bulk) Moran’s Index, NN correlation, Cell
type, interaction composition, LLê Cao et al. Genome Biology (2021) 22:220 Page 9 of 21
Table 2 Different methods were used in the hackathons and are also available as reproducible
vignettes (Continued)
Common Tasks Hackathon 1 Hackathon 2 (spatial Hackathon 3 (scNMT-seq)
challenges (spatial proteomics)
transcriptomics)
function (Fig. 2: 10)
(all bulk)
Inclusion of Survival prediction: Cox regression Include annotated hypersensitive
additional based on spatial features (Fig. 2: sites index to anchor new/unseen
information 10) data from DNase-seq, (sc)ATAC-seq,
scNMT-seq, for de novo peak calling
(bulka)
a
indicates that the method was not applied on the hackathon data, “bulk” indicates the method was originally
developed for bulk omics, “sc” indicates the method was specifically developed for single-cell data, other methods
are generic
Hackathon-specific challenges
Hackathon 1: spatial transcriptomics and integration of scRNA-seq with seqFISH
The first hackathon focused on the integration of spatial transcriptomic profiling data
with non-spatial scRNA-seq data. While spatial approaches are gaining popularity, they
often provide lower molecular resolution than non-spatial methods. Strategies to integrate
these data hold the promise to enhance the molecular resolution of spatially resolved pro-
filing. This hackathon included spatial transcriptional data of 125 genes for 1597 single
cells from seqFISH with corresponding non-spatial whole-transcriptome profiling of 1723
cells from the mouse visual cortex [21]. These datasets share measurements for 113 genes.
The first challenge was to predict cell types in the seqFISH data, based on the putative cell
types learnt from the scRNA-seq data, and determine a minimal number of genes neces-
sary for data integration. The second challenge questioned whether gene signatures of cel-
lular co-localization were preserved in the non-spatial transcriptional data.
In the first challenge, we explored several strategies to assign the most likely cell types to
single cells in the seqFISH dataset based on information obtained from the scRNA-seq data-
set (the latter being considered as a training data set). We used supervised and semi-
supervised methods with feature selection, including support vector machines, sparse Partial
Least Squares Discriminant Analysis (sPLS-DA) [22], and generalized linear models with
elastic net penalty. Unsupervised integrative methods based on non-negative matrix
factorization (NMF) [23] were also investigated. As ground truth, we considered the pre-
dicted cell types based on the original study from [24] that integrated the seqFISH and
scRNA-seq data. Overall, our analyses achieved a prediction accuracy greater than 80%.
This challenge highlighted typical issues encountered when conducting statistical learning
from similar data types (here gene expression) measured using different assays (scRNA-
seq and seqFISH) on different cells. First, training the classifier model required an already
established ground truth. Second, the prediction assessment from the seqFISH data was
limited by the lack of biological knowledge, the non-targeted nature of the genes se-
quenced—as those genes are not necessarily characteristics of those cell types, and the ex-
ploratory nature of our analyses. Third, the type of classifier (linear or non-linear,
supervised, or semi-supervised) and the gene selection strategies were also found to influ-
ence the performance of the methods. Finally, the evaluation of the methods required an
adequate choice of metrics to account for cell type imbalance inherent to the study.
In the second challenge, we sought to transfer spatial information obtained from the
seqFISH dataset to that of the scRNA-seq dataset. We built spatial networks from cells’Lê Cao et al. Genome Biology (2021) 22:220 Page 10 of 21
positions in the seqFISH dataset by Delaunay triangulation [25]. The clusters of cells ob-
tained from the spatial data did not necessarily overlap with specific cell types, suggesting
that the spatial dimension cannot be captured from gene expression data only. In
addition, we were unable to extract combinatorial spatial patterns directly from scRNA-
seq data, even though previous studies have demonstrated cellular mapping between gene
expression profiles and known spatial locations [26, 27]. Thus, we faced both techno-
logical and analytical challenges that will require careful benchmarking in the near future.
Hackathon 2: cross-platform and cross-study integration with spatial proteomics
The second hackathon focused on an integrative data analysis across studies and plat-
forms with limited overlap in proteins between the two datasets. It included spatial pro-
teomics matched with non-spatial data. Here we dealt with a typical scenario in clinical
omics whereby datasets are obtained on different tissues using related but different
platforms, studying the same disease. This hackathon contained two breast cancer co-
horts. The first cohort included 143 subjects with 73 proteins profiled with single-cell
proteomics mass cytometry (CyTOF) [28] and the second cohort 41 patients with 36
spatial in situ proteins profiled from Multiplexed Ion Beam Imaging (MIBI) [29]. A
total of 20 proteins were assayed in both studies, with 6 patients in the CyTOF dataset
and all 41 patients in the MIBI dataset of the triple-negative subtype of breast cancer.
The main challenge was to predict cell labels and cell compositions from one dataset to
the other when proteomics data are partially overlapping from different patients with
similar phenotypes, in a cross-platform and cross-study setting.
Two main challenges emerged. The first challenge investigated whether analytical methods
could integrate partially overlapping proteomics data collected on different patients with simi-
lar phenotypes, and whether measurements from one technology (MIBI spatial location and
expression of proteins) could be transferred and used to predict information in the second
technology (spatial expression patterns of proteins measured on CyTOF). Several semi-
supervised and supervised algorithms were applied to transfer cell labels and cell compositions
from one dataset to the other, including random forests [30] and entropic regularization opti-
mal transport [31, 32]. The analyses highlighted a critical lack of methods for cell type assign-
ment, classification, or extraction of differentially expressed proteins for targeted proteomics.
In particular, we identified an urgent need for a unifying map between cells present in differ-
ent datasets, and for annotation resources to provide quality metrics or priors of protein cell
type markers. One solution would be to construct protein expression atlases across different
studies to support cell type classification.
The second challenge explored the added value of spatial technologies to uncover information
about immune cell populations in breast cancer beyond cell composition. K-nearest neighbor
graph, topic models [33], and graph-based neighborhood measures were used, demonstrating
the prognostic potential of spatial single-cell proteomics data. This challenge highlighted the
need to develop new spatial measures specifically for single-cell spatial proteomics data.
Hackathon 3: scNMT-seq experiments and integration of RNA and DNA features on the
same cells
The third hackathon explored multi-modal integration of data of different molecular
modalities from the same cells. This study leveraged single-cell epigenetics data toLê Cao et al. Genome Biology (2021) 22:220 Page 11 of 21
investigate how genetic and epigenetic alterations to DNA drive the transcriptional
regulation underlying cellular state transitions. Specifically, this third hackathon in-
cluded scNMT-seq data from 826 cells with concurrent DNA methylation, chromatin
accessibility, and RNA expression from the same cells during mouse embryonic devel-
opment, spanning post-implantation and early gastrulation [34]. This hackathon pre-
sented the specific challenge of identifying associations between disparate molecular
components where data sets differ in scale, size, and noise levels in integrative
frameworks.
After defining different types of genomic contexts (e.g., promoters, enhancers), we
conducted integrative analyses of five data modalities (Additional file 1: Figure S3A,
gene expression, promoter, gene body, CGI and DHS methylation) using methods
based on distance measures, NMF, and PLS. We assessed the ability of these methods
to cluster cells based on their developmental stages. We additionally used data splitting
to assess whether methods trained on one part of the scNMT-seq dataset had similar
model performance on held-out cells (Additional file 1: Supplemental Note S4 and Fig-
ure S5). Our analyses showed that different data sets led to different clustering per-
formance. Thus, identifying appropriate data sets to explain a phenotype (here
developmental stage) is critical for integrative analysis.
In a second challenge, we examined the effect of imputing the numerous missing
values in DNA methylation using methods such as nearest neighbor averaging. We
found that clustering was improved when using imputed data, rather than dealing with
methods (such as PLS) that handle missing values internally. Thus, more methodo-
logical developments for missing value imputation would be highly beneficial for the
analysis of single-cell methylation data.
Common challenges across hackathons
Choice of pre-processing approach
Due to the established impact of pre-processing on genomics analysis, we used our
hackathons to assess the effect of normalization and data transformation (e.g., variance
stabilization, arcsinh or inverse transformation in Hackathon 2), preliminary feature se-
lection (mostly based on highly variable genes, Hackathon 1), or feature summarization
(Hackathon 3). The best way to pre-process emerging data remains a challenge when
there is a lack of ground truth. We used visualization of step-by-step transformations
to clarify how certain methods fit models or reduce data dimensionality. These visuali-
zations can often be very specialized (e.g., goodness of fit QQ-plots or rootograms,
mean-variance fitting plots), but serve as intermediary checks to understand seemingly
black box analytical processes. We also recommend applying different analyses to dif-
ferent input data and comparing the final results both from a numerical and biological
perspective.
Pre-processing may also include how we define molecular units for each data modal-
ity. RNA-seq has well-defined units and IDs (e.g., transcript names), but other assays
may need to be summarized at different genomic scales (e.g., gene promoters, exons,
introns, or gene bodies, see Hackathon 3). Tools that compute summaries at different
scales and different overlaps between signal (e.g., ATAC-seq peaks) and genomic anno-
tation can address those challenges (e.g., R/GenomicRanges [35]). Finally, anotherLê Cao et al. Genome Biology (2021) 22:220 Page 12 of 21
challenge is that observations of different modalities may not be directly comparable:
for instance, gene expression may be measured from individual cells in scRNA-seq, but
spatial transcriptomics may have a finer (sub-cellular) or coarser (multi-cellular) reso-
lution. Deconvolution methods of multi-cellular spots signal are currently emerging to
address this issue [36].
Managing heterogeneity across datasets
Differences in data set sizes and the specific molecular features measured in the assays con-
stitute a major challenge for data integration. One solution to manage size was to reduce
data to a common set of features (genes for Hackathon 1, or proteins for Hackathon 2,
Fig. 3A) or via feature selection, either embedded in the methods (Hackathon 1) or ad hoc
with highly variable features (Hackathon 3). Another alternative was to use projection-based
methods that can manage differences in sizes across datasets (Hackathon 3).
Differences in data scale may result in one dataset contributing to either too much
variation or noise during data integration. Existing approaches we have tested across all
hackathons offered further improvement in the analyses, but there is still room for new
techniques to be further developed to either (re)scale, remove batch effects (here due
to systematic differences between platforms), or weighting specific data sets (e.g., [37]
proposed by one of our participants).
Multiple domains of knowledge can be combined easily if there is a common coord-
inate system, as is the case in geospatial analyses. In both Hackathons 1 and 2, a spatial
dimension was already naturally available, where we could leverage spatial statistics
methods to quantify spatial effects. In these studies, similarity between expression pro-
files and inferred clusters could be tested and easily understood in the spatial context.
Thus, for spatial data, layers of information can be mapped to the natural coordinate
system in the same way a geographic information system framework incorporates them
to identify a “consensus space” that provides a common reference system, as we further
discuss in Additional file 1: Supplemental Note S5.
Managing lack of information overlap
The degree of feature or cell overlap between datasets varied dramatically within each
hackathon. Intuitively, it is necessary that at least one type of overlap, whether on the
features (Fig. 3A) or cells (Fig. 3C), is present to integrate information across disparate
modalities. The field has made progress in developing methods to integrate data sets
that match the same cells (Hackathon 3), especially based on dimension reduction tech-
niques (e.g., NMF, or PLS, see Hackathons 1 and 3). However, when there is no cell
overlap (spatial Hackathons 1 and 2), imputation methods are required to predict gene,
protein, or spatial expression values (Fig. 3B). Methods ranged from nearest neighbors,
latent variables, or optimal transport with some approaches that can also be used to
predict cell types. When there is a complete lack of overlap between cells or features—
the so-called fourth corner (Hackathon 2, Fig. 3D), one solution is to rely on (common)
phenotypes of the cells to create some sort of overlap of information. We anticipate
that this scenario will be avoided once technological progress and an increase in data
availability is achieved [38].Lê Cao et al. Genome Biology (2021) 22:220 Page 13 of 21
Fig. 3 Common challenge in data integration: Addressing partial overlap of information across cells or
features. A Overlap of features but not cells (e.g., Hackathon 1 where we considered the overlap of genes
between seqFISH and scRNA-seq data). B Partial overlap of features but no overlap of cells (e.g., Hackathon
2 that required data imputation or cell type prediction, with different patients for each set of cells and only
some proteins overlapping). C Overlap of cells across assays, but no overlap of features (e.g., Hackathon 3).
D Lack of overlap between cells and features (the so-called fourth corner problem in Hackathon 2)
Interpretation of results
The analyses from each hackathon emphasized that regardless of the common difficul-
ties faced by our participants, there was no “one method fits all” for multi-omics inte-
gration. An equally important complement to the diverse computational methods used
to solve multi-omics analysis problems rests in the biological interpretation of their so-
lutions. The high-dimensional nature of single-cell data already poses a challenge to in-
terpretation and is further confounded by the often higher dimension resulting from
concatenating datasets across molecular scales with multi-omics technologies. Inter-
pretation hinges on the analytical methods selected for a given dataset. Some methods
used in the hackathons and summarized in Table 2 aimed to predict a clearly defined
outcome (e.g., cell labels). Supervised analyses often provide easier interpretations, as
one can easily rank the covariates and contiguous data in terms of their predictive po-
tential (Hackathon 1). However, when data are collected without the availability of aLê Cao et al. Genome Biology (2021) 22:220 Page 14 of 21
clear response (e.g., survival time, tumor size, cell growth) using multiple different tech-
nologies, data integration requires organizing patterns that enable interpretation.
Unsupervised analyses are widely applied to single-cell datasets to provide lower di-
mensional representations that facilitate interpretation and even latent variables that
can reflect biological processes in the system. Low-dimensional representation of
single-cell multi-omics data often requires additional contiguous data, such as spatial
coordinates to capture higher-level cellular structure or prognostics (Hackathons 1 and
2). Clustering is often used as an unsupervised method that can use latent variables—
for example using a categorical variable such as cell type, which was not directly mea-
sured on the data but enables simple interpretations [39] (Hackathon 3). Unfortunately,
biological phenomena are often not as clear-cut. During clustering, over separating data
by forcing the data into types only provides a static description when the variation
should often be along a continuum. Indeed, although a latent factor can be a useful first
approximation, the development of cells and their fate is a dynamic process. Thus, we
recommend referring back to the original data that enabled interpretation of the cell
trajectories: in our case, where the underlying latent variable of interest is expressed
along a gradient of development (e.g., pseudo-time, disease progression).
While methods to automatically interpret low-dimensional representations remains
an open question, even in absence of biological annotation latent variables represent a
rich anchor for many multi-modal methods and can often be useful in highlighting
what the modalities have in “common” and how they differ, as highlighted in Hacka-
thon 3. Disparate sources of evidence, or in this case, data from different technologies,
are more compelling than many replicates of the same technology. Thus, if different
technologies allow a consensus on underlying latent variables, this information is worth
retaining. The commonalities are well understood in the case of classical multivariate
factor analysis, where the data are decomposed into common and unique components
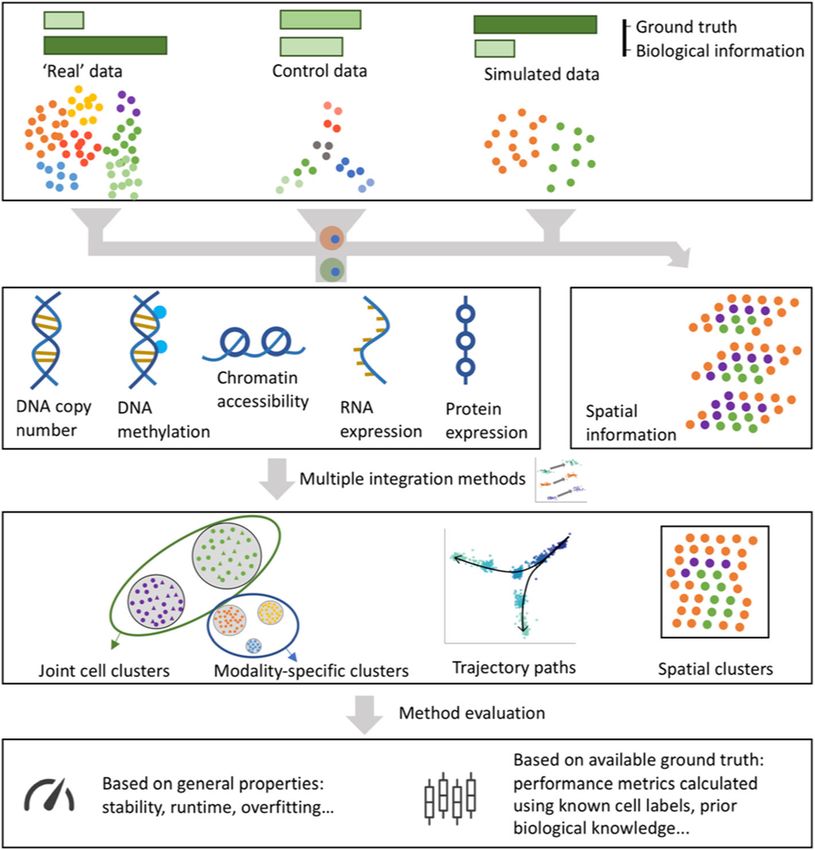
[40]. A schematic summary of the different stages in interpretation is provided in
Fig. 4).
Improving interpretation
Information from external databases can be incorporated into the final output to im-
prove interpretation (Fig. 4A). However, biological interpretation is often limited to the
integration of contiguous information available from metadata or from exterior sources
such as Gene Ontologies, Biomart [41], Kegg, Human Cell Atlas (HCA), or within soft-
ware systems. As the high-dimensional nature of single-cell data can allow computa-
tional algorithms to have multiple solutions of similar accuracy, redundant biological
knowledge can be enlightening. By providing information on the extreme points in a
map or “brushing a map” with respect to known gene expression features, one can de-
lineate orientations and clusters. As an example, it is only through coloring trajectories
on UMAPs of selected genes that allows us to see the dynamics of cell-state transitions,
similar to the principle behind the interactive brushing illustrated in Fig. 4B.
Interpretation of complex and rich data often relies on visualization strategies that
use color, leading to difficulties in perceiving patterns for a substantial proportion of
the population with color vision deficiencies and leading to different data interpreta-
tions between individuals. We recommend presenting accessible scientific informationLê Cao et al. Genome Biology (2021) 22:220 Page 15 of 21
Fig. 4 A Schematic diagram of stages of interpretation and integration of data sources. B Integrative
analysis across multiple modes of data results in complementary evidence, allowing stronger conclusions,
an instance of Cardinal Newman’s principle: “Supposes a thesis (e.g., the guilt of an accused man) is
supported by a great deal of circumstantial evidence of different forms, but in agreement with each other;
then even if each piece of evidence is in itself insufficient to produce any strong belief, the thesis is
decisively strengthened by their joint effect.”
using colorblind-friendly visualizations and palettes [42–45] with a limit of 10 colors.
Additional hatched areas or point shapes can also reduce the dependence on colors.
The inclusion of a self-standing caption accompanying figures can guide the reader’s
perception of the images and would greatly benefit broader data accessibility.
Finally, spanning all of these interpretation challenges is a central communication
barrier between data analysts and the community of practitioners who do not have the
same vocabulary or background. Many tools are used as black boxes where users do
not have a clear understanding of the statistical or mathematical principles underpin-
ning the methods. We recommend to the community the establishment of a clear
glossary of terms, and how we are using those terms to improve communication. For
example, many synonyms for multi-modal data exist and some have nuances, as we
have collated in Table 3. Understanding the relationship between methods described by
different teams is essential. Data scientists often start by categorizing methods first;
thus, it is useful to present a dichotomy of methods and their underlying properties for
biology collaborators.
Discussion
Our article highlights the power of hackathons to both inform and develop new ana-
lysis methods to capture the complex, multi-scale nature of biological datasets from
high-throughput data modalities. Notably, our hackathon studies were specifically de-
signed to span state-of-the-art multi-omics challenges to map the epigenetic, molecular,
and cellular interactions across time and sample populations. Single-cell measurements
spanning molecular modalities can inherently simplify the challenge of linking disparate
biological scales, but layering new sets of molecular measurements increases the com-
plexity of the analyses to interpret these data. The computational needs hinge on the
underlying biological question being asked as well as on the characteristics of the data
themselves.
In our analyses, different modeling considerations had to be made for multi-modal
integration, as highlighted in Hackathons 1 and 3 (matching on the same genes, or
cells) and Hackathon 2 (partially unmatched measurements). Our participants chose aLê Cao et al. Genome Biology (2021) 22:220 Page 16 of 21
wide range of approaches for each case study, common challenges were encountered,
and common types of analyses were applied. Some analytical methods derived from
bulk RNA-seq literature were able to answer the biological question posed in our
hackathons, spanning from data integration, to cell type prediction, or spatial analysis.
Some of the methods developed specifically for single-cell data did not necessarily per-
form well in our real case studies. Data heterogeneity and lack of overlap between data
sets constitute the most important challenges for multi omics single-cell data
integration.
Through these hackathons, we identified several common analysis themes spanning
algorithmic advances, interpretation, benchmarking, and software infrastructure neces-
sary for biological interpretation. All hackathons required methods for dealing with
data quality, data loss from summarization, timing variances between and within omics
layers, and batch effects. These represent the necessary challenges to overcome in the
coming years, along with efficient and insightful data visualization strategies to infer
regulatory relationships between different omics.
Technologies to profile biological systems at single-cell resolution and across molecu-
lar scales are advancing at an unprecedented pace. Analytically, these advances require
the computational community to pursue research that can first enable analyses tailored
to specific biological features or measurement technology, and second, that can scale
and adapt to these rapid advances. Our hackathons highlighted current technologies
for spatial molecular profiling. The two technologies used in this study both have lim-
ited molecular resolution. Therefore, multi-platform data combining the spatial mo-
lecular data from either seqFISH, MIBI, or imaging mass cytometry require integration
of complementary data from other single-cell technologies to provide both high spatial
and molecular resolution. We note that additional technologies, such as slide-seq [58]
and Visium from 10X Genomics produce spatially resolved molecular measurements
approaching measurements of the whole transcriptome, but lack the fine spatial reso-
lution of imaging technologies. As such, emerging technologies still require further
multi-platform data integration for comprehensive analysis. Hackathon 3 did not in-
clude spatially resolved data but highlighted the potential of further inference of gene
regulation through concurrent profiling of RNA, methylation, and chromatin state.
Technological advances for multi-omics spatial data and epigenetics data are rapidly
advancing and becoming increasingly available through Nanostring, 10X Genomics,
Akoya Biosciences, and others. New research-level technological advances enable three-
dimensional spatial molecular profiling [59]. Other technologies are currently expand-
ing to allow for temporally resolved profiling [60] or ATAC and gene expression on
matched cells (chromium single-cell multiome). Integration strategies aware of these
future directions and the mathematical challenges that span technologies will be most
adept at advancing biological knowledge: this was the primary aim of our hackathons.
The implementation of novel analysis tools requires further software ecosystems, in-
cluding Bioconductor [61], Biopython, and toolkits such as Scanpy [62], Seurat [63], or
Giotto [64], in which users can implement their analysis approaches, while anticipating
stable and adaptive data structures that are applicable for these emerging technologies.
The size of these emerging datasets, particularly in the context of their application to
atlas projects (e.g., the Human Tumor Atlas Network [65], Human Cell Atlas [66],
Allen Brain Initiative, Brain Initiative Cell Census Network, or ENCODE/Roadmap/4DLê Cao et al. Genome Biology (2021) 22:220 Page 17 of 21
Table 3 Glossary of terms
Consensus Related terms Description Citation
term
Network Graph, adjacency matrix A set of nodes, representing objects of [46]
interest, linked by edges, representing
specific relationships between nodes.
Node Vertex Element of interest in a network and [46]
linked to other nodes. For example:
people, cells, proteins or genes. Nodes can
have several properties called attributes
like cell type or position.
Edge Link The relationship between 2 nodes in a [46]
network. For example: friendship in social
networks, cells in contact in a spatial
network, or gene-gene interactions in a
gene regulatory network.
Concordant Common Agreement between multiple modalities [47, 48]
with respect to feature/variable selection
and correlation of latent factors.
Consistent Coherent, self-consistent, within-study Similar performance obtained from [49]
evaluation applying methods for multi-modal data
during multiple rounds of data splitting.
Contributions Variable weights, loadings, eigenvector, Contributions of the original variables in [50, 51]
axis, direction, dimension, coefficients, constructing the components.
slopes
Latent Variates, scores, projections, components, Weighted linear combinations of the [50, 51]
factors latent/hidden/unobserved variables/ original variables.
factors
Multi-modal Multiview, multiway arrays, multi-modal, Methods pertaining to the analysis of [50, 52,
multidomain, multiblock, multitable, multiple data matrices for the same set of 53]
multi-omics, multi-source data analysis observations.
methods, N-integration
Conjoint P-integration, meta-analysis, multigroup Methods pertaining to the analysis of [50, 51,
analysis data analysis multiple data matrices for the same set of 54]
variables.
Variable Feature A measurable quantity that describes an [46]
observation’s attributes. Variables from
different modalities include age, sex, gene
or protein abundance, single nucleotide
variants, operational taxonomic units, pixel
intensity etc.
Biomarker Marker A variable that is associated with normal [55]
or disease processes, or responses to
exposures, or interventions. Any change in
this variable is also associated with a
change in the associated clinical outcome.
These variables may be used for
diagnostic, monitoring, Pharmacodynamic
responses. Examples include LDL
cholesterol, CD4 counts, hemoglobin A1C.
Panel Biomarker panel, biomarker signature A subset of the originally measured [56, 57]
variables that are determined to be
associated with the outcome or response
variable. This may be determined using
statistical inference, feature selection
methods, or machine/statistical learning.
Observation Sample, observation, array A single entity belonging to a larger [46]
grouping. Examples include patients,
subjects, participants, cells, biological
sample, and usually the unit of
observation on which the variables are
measuredLê Cao et al. Genome Biology (2021) 22:220 Page 18 of 21
nucleome, to cite a few), are key examples that computational efficiency and scalability
of these implementations are becoming ever more critical.
In addition to new technologies, we wish to emphasize that arising multi-omics ana-
lysis methods can support the generation of new data sources to resolve the multi-scale
nature of biological systems. For example, our hackathons posed the scNMT-seq data
(Hackathon 3) and spatial molecular datasets (Hackathons 1 and 2) as distinct chal-
lenges for data integration. However, integration of matched datasets between these
spatial and epigenetic profiling techniques could further resolve the dependence of cell
type and cellular interactions of regulatory networks. By embedding prior biological
knowledge as rules in the analysis approaches, additional sources of data can generate a
new representation of a biological system. For example, curated regulatory networks
from databases such as KEGG, Biocarta, GO, TRANSFAC, reactome, or MSigDB pro-
vide commonly used frameworks for this prior knowledge. These gene regulatory net-
works must be extended to map the impact of cellular context on transcriptional
regulation that are being uncovered by emerging single-cell atlases. The regulatory net-
works and dynamic features captured in single-cell data also provide the potential for
techniques to predict molecular and cellular states, catalyzing new areas of research.
Supplementary Information
The online version contains supplementary material available at https://doi.org/10.1186/s13059-021-02433-9.
Additional file 1: S1. Case study for spatial transcriptomics: integration of scRNA-seq + seqFISH. S2. Case study
for cross-study and cross-platform analysis: spatial proteomics. S3. Case study for epigenetic regulation: scNMT-seq.
S4. Further considerations on benchmarking. S5. Further considerations on results interpretation. S6. Further
considerations on software.
Authors’ contributions
KALC, ACC, and EF organized the Banff workshop. AJA, EFDM, and LH (alphabetical order) processed the hackathon
data. AJA, AA, AC, AD, YF, PJ, ML, CM, WM, KS, AD, JSS, GLSOB, and JDW (alphabetical order) analyzed the hackathon
data and/or contributed to the Supplemental Notes S1, S2, and S3 (VP, AS). RA, VJC, RD, CSG, SH, MIL, MER, GCY
(alphabetical order), KALC, ACC, and EF led the theme discussions and wrote sections of the manuscript. YY and MER
designed Fig. 1. KS contributed in designing Figs. 3 and 4. KALC and EF wrote and edited the final manuscript. All
authors read and approved the final manuscript.
Funding
We wish to acknowledge the following funding bodies:
National Health of Medical Research Council Career Development Fellowship AU, (KALC); Chan Zuckerberg initiative
(AJA, VJC, ACC);
Australian Research Council (AJA, KALC, MER);
National Institute of Health, (EFDM, AD, SH);
National Cancer Institute, (EFDM, VJC, CSG, GCY, EJF);
Chair of bioinformatics in oncology of the CRCT (INSERM, Fondation Toulouse Cancer Santé, Pierre Fabre Research
Institute, (AC, VP);
Fondation Toulouse Cancer Santé, (AC, VP);
Pierre Fabre Research Institute, (AC, VP);
Michael Smith Foundation for Health Research, (AS);
Mitacs, (AS);
Kavli Neuroscience Discovery Institute, (GLSO);
Johns Hopkins Provost Postdoctoral Fellowship, (GLSO);
National Human Genome Research Institute, NIH, (JDW, VJC, CSG, WM, MIL);
National Institute of Allergy and Infectious Diseases, NIH, (JDW, SH);
National Institute of Mental Health, NIH, (JDW, MIL);
EMBL PhD program, (RA);
National Institutes of Health, National Institute on Aging, (GCY);
DoD, (ACC);
National Institute of Health, National Institute of Dental and Craniofacial Research, (EJF);
Lustgarten Foundation, (EJF);
Emerson Foundation, (EJF);
Allegheny Health Network, (EJF).Lê Cao et al. Genome Biology (2021) 22:220 Page 19 of 21
Competing interests
All authors declare they have no conflict of interests.
Author details
1
Melbourne Integrative Genomics, School of Mathematics and Statistics, University of Melbourne, Melbourne, Australia.
2
McKusick-Nathans Institute of the Department of Genetic Medicine, Johns Hopkins School of Medicine, Baltimore, MD,
USA. 3Data Science, Dana-Farber Cancer Institute, Boston, MA, USA. 4Department of Epidemiology and Biostatistics,
Memorial Sloan Kettering Cancer Center, New York, NY, USA. 5Centre de Recherches en Cancérologie de Toulouse
(INSERM), Université Paul Sabatier III, Toulouse, France. 6Cancer Convergence Institute and Division of Quantitative
Sciences, Department of Oncology, Sidney Kimmel Comprehensive Cancer Center, Johns Hopkins University School of
Medicine, Baltimore, MD, USA. 7Department of Biostatistics, UNC, Chapel Hill, NC, USA. 8Barcelona Supercomputing
Center, Barcelona, Spain. 9Department of Statistics, University of Wisconsin, Madison, WI, USA. 10Department of
Pathology and Laboratory Medicine, University of British Columbia, Vancouver, BC, Canada. 11Department of
Computational Medicine and Bioinformatics, University of Michigan, Ann Arbor, MI, USA. 12Department of Biomedical
Engineering, University of Michigan, Ann Arbor, MI, USA. 13Department of Neuroscience, Johns Hopkins University,
Baltimore, MD, USA. 14Klarman Cell Observatory, Broad Institute of MIT and Harvard, Cambridge, MA, USA.
15
Department of Computer Science and Engineering, University of Michigan, Ann Arbor, MI, USA. 16Epigenetics and
Development Division, The Walter and Eliza Hall Institute of Medical Research, University of Melbourne, Melbourne,
Australia. 17Epigenetics Programme, Babraham Institute, Cambridge CB22 3AT, UK. 18Channing Division of Network
Medicine, Brigham and Women’s Hospital, Harvard Medical School, Boston, MA, USA. 19Department of Hematology
and Oncology, Boston Medical Center, Boston, MA, USA. 20Center for Health AI and Department of Biochemistry and
Molecular Genetics, University of Colorado School of Medicine, Aurora, CO, USA. 21Department of Statistics, Stanford
University, Stanford, CA, USA. 22School of Mathematics and Statistics, University of Melbourne, Melbourne, Australia.
23
Department of Genetics and Genomic Sciences, Charles Bronfman Institute for Personalized Medicine, Icahn School
of Medicine at Mount Sinai, New York, NY, USA. 24Department of Biomedical Engineering, Johns Hopkins University
School of Medicine, Baltimore, MD, USA. 25Department of Mathematics and Statistics, McMaster University, Hamilton,
Canada. 26Bavarian Center for Biomolecular Mass Spectrometry (BayBioMS), School of Life Sciences, Technical University
of Munich, Munich, Germany. 27Department of Genetics, UNC, Chapel Hill, NC, USA. 28Biostatistics, Harvard TH Chan
School of Public Health, Boston, MA, USA. 29PROOF Centre of Excellence, Vancouver, BC, Canada. 30Kavli Neuroscience
Discovery Institute, Johns Hopkins University, Baltimore, MD, USA. 31Department of Medical Biology, University of
Melbourne, Melbourne, Australia. 32Department of Computational Biomedicine, Boston University School of Medicine,
Boston, MA, USA. 33Center for Regenerative Medicine (CReM), Boston University, Boston, MA, USA. 34Department of
Applied Mathematics and Statistics, Johns Hopkins University Whiting School of Engineering, Baltimore, MD, USA.
References
1. Method of the Year 2019: Single-cell multimodal omics. Nat Methods (2020-01) https://www.nature.com/articles/s41592-
019-0703-5. https://doi.org/10.1038/s41592-019-0703-5.
2. Macaulay IC, et al. G&T-seq: parallel sequencing of single-cell genomes and transcriptomes. Nat Methods. 2015;12:519–
22 https://doi.org/10.1038/nmeth.3370.
3. Hou Y, et al. Single-cell triple omics sequencing reveals genetic, epigenetic, and transcriptomic heterogeneity in
hepatocellular carcinomas. Cell Res. 2016;26:304–19 https://doi.org/10.1038/cr.2016.23.
4. Stoeckius M, et al. Simultaneous epitope and transcriptome measurement in single-cells. Nat Methods. 2017;865 https://
doi.org/10.1038/nmeth.4380.
5. Stephen J, Clark RA, Kapourani C-A, Stubbs TM, Lee HJ, Alda-Catalinas C, et al. scNMT-seq enables joint profiling of
chromatin accessibility DNA methylation and transcription in single-cells. Nat Commun. https://doi.org/10.1038/s41467-
018-03149-4. PMID: 29472610, PMCID: PMC5823944.
6. Lee J, Hyeon DY, Hwang D. Single-cell multiomics: technologies and data analysis methods. Ex Mol Med. 2020;52:1428–
42 https://doi.org/10.1038/s12276-020-0420-2.
7. Kim T, Chen IR, Lin Y, Wang AY, Yang JYH, Yang P. Impact of similarity metrics on single-cell RNA-seq data clustering.
Brief Bioinform. 20(6):2316–26. https://doi.org/10.1093/bib/bby076. PMID: 30137247.
8. Kiselev VY, Andrews TS, Hemberg M. Challenges in unsupervised clustering of single-cell RNA-seq data. Nat Rev Genet.
2019;20:273–82 https://doi.org/10.1038/s41576-018-0088-9.
9. Hon C-C, Shin JW, Carninci P, Stubbington MJT. The Human Cell Atlas: Technical approaches and challenges. Brief Funct
Genomics. 2018;17(4):283–94 https://doi.org/10.1093/bfgp/elx029.
10. Singh A, Shannon CP, Gautier B, Rohart F, Vacher M, Tebbutt SJ, et al. DIABLO: an integrative approach for identifying
key molecular drivers from multi-omics assays. Bioinformatics. https://doi.org/10.1093/bioinformatics/bty1054. PMID:
30657866, PMCID: PMC6735831.
11. Tian L, Dong X, Freytag S, Cao K-AL, Su S, JalalAbadi A, et al. Benchmarking single-cell RNA-sequencing analysis
pipelines using mixture control experiments. Nat Methods. https://doi.org/10.1038/s41592-019-0425-8. PMID: 31133762.
12. Mereu E, Lafzi A, Moutinho C, Ziegenhain C, McCarthy DJ, Álvarez-Varela A, et al. Benchmarking single-cell RNA-
sequencing protocols for cell atlas projects. Nat Biotechnol. https://doi.org/10.1038/s41587-020-0469-4. PMID: 32518403.
13. Ding J, Adiconis X, Simmons SK, Kowalczyk MS, Hession CC, Marjanovic ND, et al. Systematic comparison of single-cell
and single-nucleus RNA-sequencing methods. Nat Biotechnol. https://doi.org/10.1038/s41587-020-0465-8. PMID:
32341560, PMCID: PMC7289686.
14. Brennecke P, Anders S, Kim JK, Kołodziejczyk AA, Zhang X, Proserpio V, et al. Accounting for technical noise in single-
cell RNA-seq experiments. Nat Methods. https://doi.org/10.1038/nmeth.2645. PMID: 24056876.
15. Zappia L, Phipson B, Oshlack A. Splatter: simulation of single-cell RNA sequencing data. Genome Biol. https://doi.org/1
0.1186/s13059-017-1305-0. PMID: 28899397, PMCID: PMC5596896.You can also read