SINGLE-CELL RNA SEQUENCING REVEALS SARS-COV-2 INFECTION DYNAMICS IN LUNGS OF AFRICAN GREEN MONKEYS
←
→
Page content transcription
If your browser does not render page correctly, please read the page content below
RESEARCH ARTICLES

                                                                                                                       Cite as: E. Speranza et al., Sci. Transl. Med.
                                                                                                                             10.1126/scitranslmed.abe8146 (2021).
CORONAVIRUS

Single-cell RNA sequencing reveals SARS-CoV-2 infection
dynamics in lungs of African green monkeys
Emily Speranza1,4, Brandi N. Williamson1, Friederike Feldmann2, Gail L. Sturdevant1, Lizzette Pérez- Pérez1,
Kimberly Meade-White1, Brian J. Smith2, Jamie Lovaglio2, Craig Martens3, Vincent J. Munster1, Atsushi
Okumura1, Carl Shaia2, Heinz Feldmann1, Sonja M. Best1, Emmie de Wit1*
1Laboratory of Virology, Division of Intramural Research, National Institute of Allergy and Infectious Diseases, National Institutes of Health, Hamilton, MT 59840, United

States of America. 2Rocky Mountain Veterinary Branch, Division of Intramural Research, National Institute of Allergy and Infectious Diseases, National Institutes of Health,
Hamilton, MT 59840, United States of America. 3Research Technologies Branch, Division of Intramural Research, National Institute of Allergy and Infectious Diseases,

                                                                                                                                                                               Downloaded from http://stm.sciencemag.org/ by guest on March 24, 2021
National Institutes of Health, Hamilton, MT 59840, United States of America. 4Laboratory of Immune System Biology, Lymphocyte Biology Section, Division of Intramural
Research, National Institute of Allergy and Infectious Diseases, National Institutes of Health, Bethesda, MD, United States of America.
*Corresponding author. Email: emmie.dewit@nih.gov

Detailed knowledge about the dynamics of SARS-CoV-2 infection is important for uncovering the viral and
host factors that contribute to COVID-19 pathogenesis. Old-World nonhuman primates recapitulate mild to
moderate cases of COVID-19, thereby serving as important pathogenesis models. We compared African
green monkeys inoculated with infectious SARS-CoV-2 or irradiated, inactivated virus to study the
dynamics of virus replication throughout the respiratory tract. Interestingly, genomic RNA from the animals
inoculated with the irradiated virus was found to be highly stable, whereas sub-genomic RNA, an indicator
of viral replication, was found to degrade quickly. We combined this information with single-cell RNA
sequencing of cells isolated from the lung and lung-draining mediastinal lymph nodes and developed new
analysis methods for unbiased targeting of important cells in the host response to SARS-CoV-2 infection.
Through detection of reads to the viral genome, we were able to determine that replication of the virus in
the lungs appeared to occur mainly in pneumocytes, while macrophages drove the inflammatory response.
Interestingly, monocyte-derived macrophages recruited to the lungs, rather than tissue resident alveolar
macrophages, were most likely to be responsible for phagocytosis of infected cells and cellular debris early
in infection, with their roles switching during clearance of infection. Together, our dataset provides a
detailed view of the dynamics of virus replication and host responses over the course of mild COVID-19 and
serves as a valuable resource to identify therapeutic targets.

INTRODUCTION                                                                              since the presence of genomic RNA (gRNA) alone does not
    A wealth of clinical and laboratory studies have been re-                             equate to productive virus infection, this study did not ad-
ported concerning severe acute respiratory syndrome corona-                               dress whether this detection of RNA was the result of virus
virus 2 (SARS-CoV-2), the causative agent of coronavirus                                  replication in these cells.
disease 2019 (COVID-19) (1, 2). A key issue among the many                                    Beyond viral replication dynamics, a thorough study of
unanswered questions that remain involves the dynamics of                                 the host response to infection at the major site of virus repli-
SARS-CoV-2 infection, including the identity of the cells that                            cation, the lungs, is needed to better understand potential
support active virus replication and the immune cells that                                causes of organ damage and targets for therapeutic interven-
contribute to the response to infection. Though multiple cell                             tion. The use of single cell technologies such as multi-param-
types in the respiratory tract have been reported to express                              eter flow cytometry and single cell sequencing allow for
the critical receptor needed for entry, angiotensin-converting                            analysis of individual cell states. Sequencing of single cells in
enzyme 2 (ACE2), as well as the transmembrane protease,                                   BALF (6) and upper respiratory tract swabs (7) collected from
serine 2 (TMPRSS2) needed to initiate replication (3, 4), it is                           patients with COVID-19 has detected markers of severe dis-
not clear which of these cell types is the site of SARS-CoV-2                             ease in hospitalized individuals. Others have examined the
replication. One study using a new algorithm (Viral Track) to                             immune response to infection by utilizing single cell sequenc-
detect viral reads in single cell sequencing samples, suggested                           ing to profile peripheral blood mononuclear cell samples
that both epithelial cells and macrophages contain viral RNA                              from patients with COVID-19 (8, 9). However, both ap-
in human bronchoalveolar lavage fluid (BALF) (5). However,                                proaches have limited power to address the dynamics of

First release: 11 January 2021                                             stm.sciencemag.org                (Page numbers not final at time of first release) 1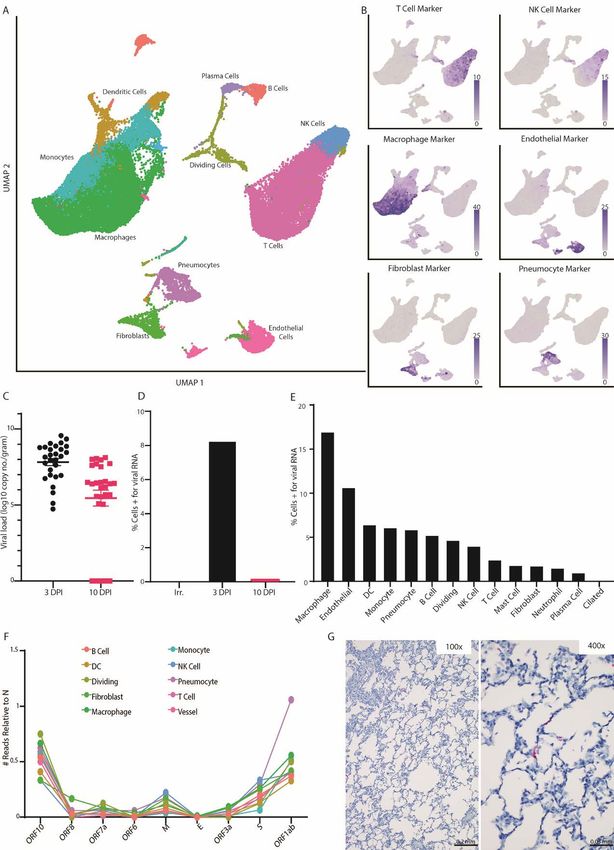
infection, the host response in the lungs, the main site of vi-   dpi for all animals and 5, 7, and 10 dpi for 4 of the animals
rus replication, and disease pathogenesis. Furthermore, nei-      we collected nose, throat, and rectal swabs. High amounts of
ther strategy provides insight into the immune response in        viral genomic RNA (gRNA) were detected in nose and throat
the lung-draining lymph nodes.                                    swabs after inoculation with SARS-CoV-2 and declined over
    The limitations of human studies with respect to time of      time (Fig. 1 A-B). Rectal swabs were positive for gRNA at most
sampling relative to exposure, differences in exposure dose       time points for one animal with a severely reduced appetite
and route, and capacity for analyzing tissues in-depth can be     (AGM8) (Fig. 1C).
overcome using animal models, albeit currently at the cost of         Nasal swabs, although not throat or rectal swabs, from
not fully replicating the severe disease observed in humans.      control animals inoculated with gamma-irradiated virus con-
Indeed, multiple animal models of SARS-CoV-2 infection are        tained high amounts of gRNA at 1 dpi and were still positive
being developed to test therapeutics and vaccines and to bet-     at 3 dpi. To determine whether detection of subgenomic RNA
ter understand the dynamics of COVID-19 disease progres-          (sgRNA) would be able to distinguish between RNA originat-
sion and the immune response to infection in a time-resolved      ing from the inoculum from that derived from replicating vi-
manner. Non-human primates are often used as models for           rus, all swabs positive for gRNA were evaluated by

                                                                                                                                       Downloaded from http://stm.sciencemag.org/ by guest on March 24, 2021
infection and pathogenesis since they often recapitulate hu-      quantitative real time reverse transcriptase polymerase chain
man disease. African green monkeys are a commonly used            reaction (qRT-PCR) to detect subgenomic RNA (sgRNA). Alt-
non-human primate model for studies of respiratory viruses,       hough sgRNA derived from infected, lysing cells in the cell
including SARS-CoV (10). Recently, two studies showed that        culture in which the virus stock was produced was present at
inoculation of African green monkeys with SARS-CoV-2 re-          high copy numbers in both inocula, sgRNA could not be de-
sults in mild respiratory disease with virus detected in the      tected in swabs collected from control animals. sgRNA was
upper and lower respiratory tract, suggesting that African        detected in nose and throat swabs from animals inoculated
green monkeys are a suitable nonhuman primate disease             with infectious virus (Fig. 1A and B), indicating that sgRNA
model to study SARS-CoV-2 infection and host response dy-         likely reflects that virus replication occurred and that gRNA
namics (11, 12).                                                  is highly stable, especially in the nasal cavity. Infectious virus
    Here, we used traditional virological methods, single cell    could be detected by virus titration early after inoculation in
RNA sequencing, and immunohistopathology to address               nose and throat swabs; no infectious virus could be detected
some of the major questions about SARS-CoV-2 replication          in rectal swabs (Fig. 1C). As a measure of virus replication in
and host responses. Our combined approach, using inocula-         the lower respiratory tract, we collected BALF from the two
tion with infectious as well as inactivated SARS-CoV-2, deter-    control animals at 1 and 3 dpi and at 1, 3, and 5 dpi from the
mined which cell types are productively infected and assessed     four SARS-CoV-2 infected animals euthanized at 10 dpi.
the host response to virus replication in the lung. Together,     gRNA could be detected on 1 and 3 dpi in one of the two con-
the result is an emerging picture of the viral and immune         trol animals; however, sgRNA could not be detected. High
events associated with mild COVID-19 disease, aiding our un-      copy numbers of gRNA and sgRNA were detected in BALF
derstanding of the dynamics of SARS-CoV-2 infection with          from the four infected animals evaluated, in line with detec-
high resolution.                                                  tion of infectious virus through 5 dpi (Fig. 1D).
RESULTS                                                           Virus replication is mostly confined to the lowery respir-
                                                                  atory tract in African green monkeys.
Subgenomic RNA, but not genomic RNA, detection re-
                                                                      At 3 dpi, the two control animals and four of the SARS-
veals active virus replication in the respiratory tract of
                                                                  CoV-2 infected animals were euthanized. The remaining four
SARS-CoV-2 infected African green monkeys.
                                                                  SARS-CoV-2 animals were euthanized at 10 dpi. Upon nec-
    To study SARS-CoV-2 infection and its consequences, two
                                                                  ropsy, lungs were examined for gross lesions. No abnormali-
groups of four African green monkeys were inoculated with
                                                                  ties were detected in the lungs of the two control animals. At
a total dose of 2.6x10⁶ 50% Tissue Culture Infectious Dose
                                                                  3 dpi, all four animals inoculated with active SARS-CoV-2
(TCID50) of replication-competent virus, while two control
                                                                  showed varying degrees of gross lung lesions and enlarged
animals were inoculated with virus inactivated by gamma-ir-
                                                                  mediastinal lymph nodes (Table 1 and fig. S1B). By 10 dpi, one
radiation. Clinical signs in the control animals were limited
                                                                  animal did not show gross abnormalities whereas the other
to reduced appetite, likely as a response to repeated anesthe-
                                                                  three animals showed gross lung lesions and enlarged medi-
sia and intubation, on 0 and 1 days post inoculation (dpi) (Ta-
                                                                  astinal lymph nodes (Table 1 and Fig.S1B). Tissue samples
ble 1). Tachypnea was observed in five of eight animals
                                                                  from these animals were assessed for the presence of gRNA
inoculated with infectious SARS-CoV-2. In these animals, dis-
                                                                  and sgRNA. Viral gRNA loads were highest in samples col-
ease was mild to moderate and transient, with animals recov-
                                                                  lected from the lung lobes and were higher at 3 dpi than 10
ering between 5 and 9 dpi (fig. S1A and Table 1). At 1 and 3
                                                                  dpi. Despite high copy numbers of sgRNA in lung tissue

First release: 11 January 2021                         stm.sciencemag.org      (Page numbers not final at time of first release)   2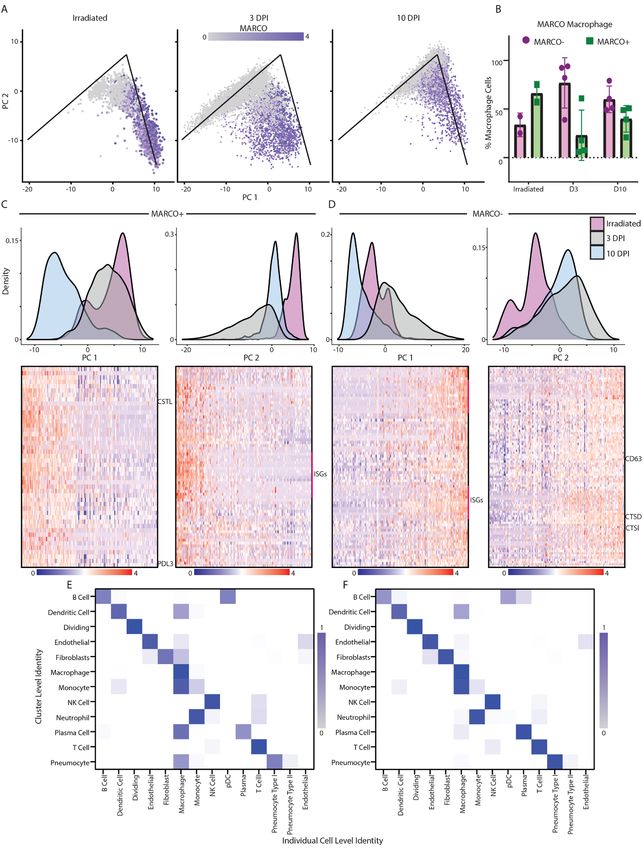
through 10 dpi, virus could only be isolated at 3 dpi (fig. S1C annotated with its likely cell identity (Fig. 3A). For the latter
and Table S1), indicating that in tissue, sgRNA is a much analysis, we developed an algorithm to perform unbiased cell
more sensitive detection method than virus isolation in tissue classification, which is a correlation-based method that uses
culture. Analysis of other respiratory tract tissues showed transcriptional profiles from annotated lung tissue and de-
that although gRNA can be detected in all tested sites early termines the most likely identity for an individual cell or a
after inoculation, sgRNA can be detected consistently only in cluster of cells and learns from the local neighbor infor-
the trachea and right bronchus (fig. S1D). mation for each cell its most likely identity. To validate the
We also analyzed tissues of the gastrointestinal (GI) tract results, we built a marker gene set for each cell type of inter-
for the presence of viral RNA. Only gRNA could be detected est, showing that the expected gene expression profile
in the GI tract of several animals after inoculation with SARS- matched the cell type annotation (Fig. 3B). Using these as-
CoV-2 at 3 dpi and 10 dpi. However, in AGM8, the animal signments, we compared the percentage of cells in each sam-
with severely reduced appetite, high copy numbers of both ple belonging to each annotation and found an increase in
gRNA and sgRNA could be detected in duodenum, jejunum, the number of pneumocytes (p-value of 10dpi to irradiated =
ileum, cecum and colon (fig. S1E) and virus was isolated from 0.06) and dividing cells (p-value of 10dpi to irradiated = 0.04)
Downloaded from http://stm.sciencemag.org/ by guest on March 24, 2021
the ileum and cecum (Table S1). Histologically, the intestinal as infection progressed (fig. S3). This is consistent with the
tract from this animal appeared normal. However, immuno- histology results showing an influx of inflammatory cells and
histochemistry (IHC) imaging revealed epithelial cells con- type II pneumocyte hyperplasia at 10 dpi (Fig. 2F).
taining SARS-CoV-2 antigen in the ileum of AGM8 (fig. S2A- Since SARS-CoV-2 is a poly-adenylated virus, with such
C). modification present in both the genome (gRNA) and the
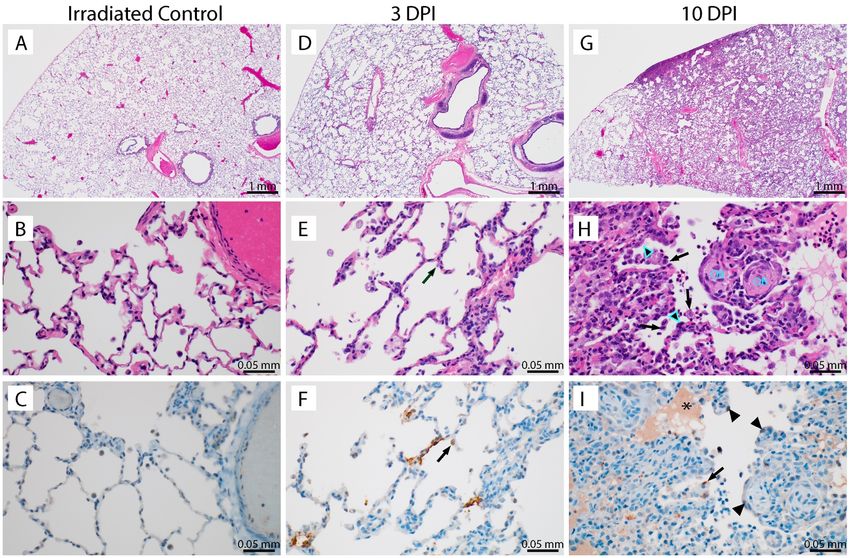
Histological analysis of the lungs of the two control ani- transcripts (sgRNA), we could map reads to both the African
mals showed no abnormalities (Fig. 2 A-C). The lungs of the green monkey and the SARS-CoV-2 genomes and determine
four animals inoculated with SARS-CoV-2 and euthanized at which cell types contained viral RNA. The single cell RNA se-
3 dpi showed subtle alveolar thickening, indicative of an early quencing (scRNA-Seq) data showed a similar pattern to the
inflammatory response (Fig. 2 D-F). Viral antigen could be qRT-PCR data described, with the highest percentage of pos-
detected by IHC in type I pneumocytes and alveolar macro- itive cells identified at 3 dpi and decreasing by 10 dpi (fig.
phages of all four animals. Alveolar thickening was still visi- S1C). Further, no viral RNA was detected in the animals inoc-
ble in the four animals inoculated with SARS-CoV-2 and ulated with gamma-irradiated virus (Fig. 3C and D). We then
euthanized at 10 dpi. Two of these animals showed histo- parsed these data down to individual cell types. At 3 dpi, viral
pathological changes consistent with interstitial pneumonia RNA could be detected in several cell types, with the macro-
frequently centered on terminal bronchioles and early lesions phage population having the highest percentage of cells pos-
in terminal airways, resembling obstructive bronchiolitis itive for viral RNA (Fig. 3E). The viral RNA in these cells could
(Fig. 2 G-I). At this time, viral antigen could only be detected be due to virus replication, phagocytosis of infected cells,
in type I pneumocytes and alveolar macrophages of one of abortive infections, or having virus particles partitioned with
four animals (AGM10). Three of four mediastinal lymph cells during creation of gel-beads in emulsion in the 10X ge-
nodes from the 10 dpi samples exhibited a mild to moderate nomics processing steps. To discriminate between cells sup-
follicular hyperplasia and the lymph nodes of all four animals porting active virus replication versus those containing viral
exhibited rare mononuclear cell immunoreactivity (fig. S2D- RNA due to other processes, we looked at the distribution of
E). reads across the genome. Due to the 3′ bias of sequencing
RNA sequencing of single cells identified pneumocytes with the 10X platform, we saw an expected enrichment of
as the main site of productive virus replication. reads in the 3′ end (fig. S4A), with a bias to the location of
On the day of necropsy, we collected sections of the lungs the nucleocapsid (N) gene in the genome. Additionally, in the
of each animal that contained an active lesion, except in ani- pseudo-bulk data read pileups, we were able to detect small
mals where gross lung lesions were not observed at necropsy enrichments of reads in specific areas at the most 3′ end of
(Table 1). These sections were processed directly following all the transcripts, including open reading frame (ORF) 1ab,
necropsy into single cell suspensions and single cell RNA se- as well as pileups in the first 5000 base pairs (bp) of the
quencing was conducted using cDNA generated immediately ORF1ab region (fig. S4B). These points of enrichment in the
without freezing or fixation of the cells, thereby allowing col- first 5000 bp matched to locations of non-canonical sgRNA
lection of whole cell data. This allowed for high-quality single formed by a jump of the RNA-dependent RNA polymerase in
cell data to be collected with a high fraction of reads in cells ORF1ab to N in the SARS-CoV-2 transcriptome and were sug-
(> 80%) and a low fraction of cells enriched in mitochondrial gestive of actively replicating virus (13). Based on these find-
genes (< 5%). Uniform manifold approximation and projec- ings, we examined each cell type for reads showing such
tion (UMAP) was used to display the data with each cell evidence of subgenomic transcripts involving a region other
First release: 11 January 2021 stm.sciencemag.org (Page numbers not final at time of first release) 3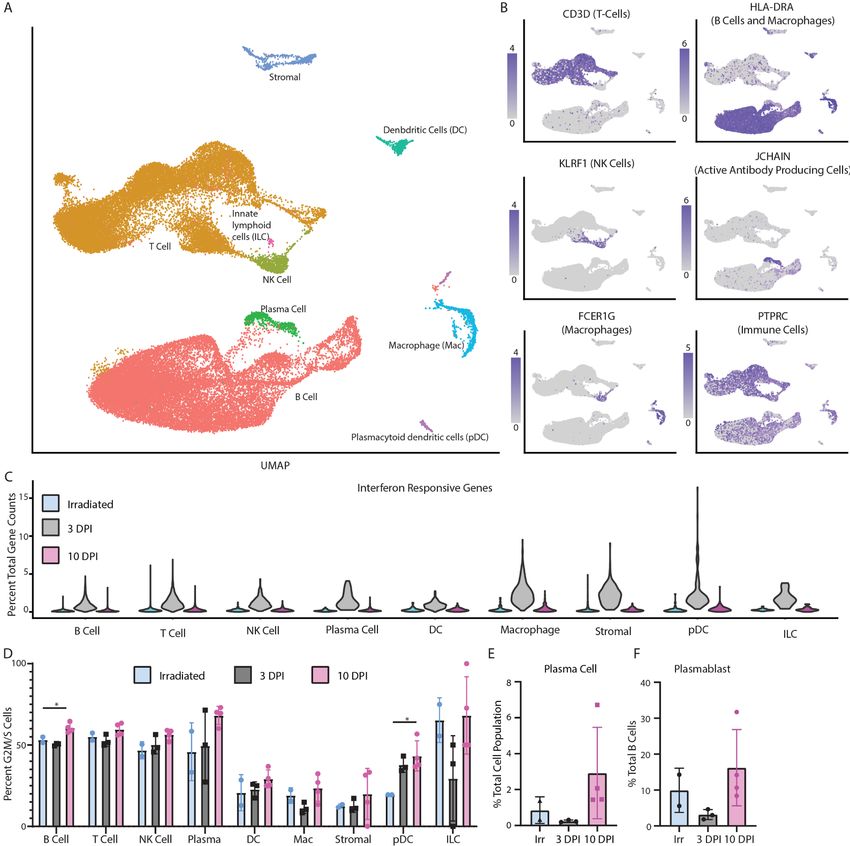
than the N gene. We observed an expected ratio of gene             to normalize by 10 dpi as the animals recovered (Fig. 4B).
counts across the SARS-CoV-2 genome, where genes closer to             To identify the major pathways whose genes were respon-
N and longer genes had higher counts associated with them          sible for the analytical differences between these two cell
across all cell types. Only one annotated cell type, pneumo-       populations, we performed a similar sub-cluster analysis on
cytes, had an abnormally high proportion of cells that were        the MARCO+ versus MARCO- cells (table S2). For the
positive for the N gene and for ORF1ab when compared to all        MARCO+ cells, there was a transcriptional shift at 10 dpi
other cell types (Fig. 3F). This suggests that despite many cell   along principal component 1 (PC1) (Fig. 4C). Using gene set
types containing viral RNA, pneumocytes were likely the            enrichment analysis, we found pathways associated with ly-
dominant cell type supporting productive viral replication, as     sosomes and extracellular matrix modification enriched
higher than expected counts to ORF1ab is suggestive of high        along this component, which are also enriched during active
amounts of sgRNA and non-conical sgRNA. To examine this            phagocytosis (fig. S6A). This suggests these macrophages
hypothesis further, we performed IHC and in-situ hybridiza-        were active in clearing cell debris from the infected lungs,
tion (ISH) on lung tissues at 3 dpi. Although a few macro-         potentially explaining why the macrophages stain for viral
phages were positive for viral antigen by IHC (Fig. 2F), only      antigen at this timepoint (Fig. 2I). Comparatively, along PC2,

                                                                                                                                        Downloaded from http://stm.sciencemag.org/ by guest on March 24, 2021
pneumocytes were positive by in situ hybridization (ISH) for       we see a shift at 3 dpi and to a lesser extent at 10 dpi. The
the viral genome, consistent with the notion that this is the      genes associated with this component were enriched for pro-
only cell type analyzed supporting active virus replication in     inflammatory pathways, including the gene set of interferon-
the lungs of African green monkeys (Fig. 3G).                      stimulated genes (Fig. 4C, fig. S6B). In distinction to the
Infection-related changes occur in the transcriptional             MARCO+ cells, we saw a shift for MARCO- cells along PC1,
states of cells isolated from the lungs of African green           mostly associated with pro-inflammatory pathways in sam-
monkeys.                                                           ples at 3 dpi (Fig. 4D, fig. S6C). Along PC2 in the MARCO-
    To gain insight into the biological effects of SARS-CoV-2      cells, we see similar pathways that were found in the
infection on diverse cells in the lungs, we examined the tran-     MARCO+ cells along PC1, suggesting an active phagocytosis
scriptional signatures in cells recovered from animals under       state, as well as migratory genes (CD63) (fig. S6D and S6E).
each of the viral-exposure conditions. To this end, we devel-      This was observed both at 3 and 10 dpi (Fig. 4D). These data
oped a new algorithm in which each population of cells was         suggest that the macrophages were in an inflammatory state
examined for a clustering bias in a pair-wise comparison           at 3 dpi that was beginning to resolve by 10 dpi and that
along individual principal components. We then used the            MARCO- macrophages, but not MARCO+ macrophages, were
principal component information and gene set enrichment            primarily involved in cleanup of cells and cellular debris at 3
analysis to determine gene signatures driving the differences      dpi.
between two experimental groups. Using this method, we                 To assess interactions between macrophages and other
found that macrophages showed large clustering biases in all       cell types, we looked at a combination of the cluster identity
the comparisons, suggesting they had the biggest transcrip-        as compared to the individual cell identity. Using the same
tional shift over the course of infection (fig. S5). The 10 dpi    cell identity algorithm, and the clusters calculated by Seurat
samples changes also showed changes in plasma cells and            (16) we looked within individual clusters to identify which
pneumocytes relative to 3 dpi, likely due to changes in cell       cells had a strong macrophage gene marker. At 3 dpi, the clus-
numbers as described above (fig. S5).                              ters associated with pneumocytes, fibroblasts, and endothe-
    The macrophage analysis was extended by selecting and          lial cells all had strong gene markers for macrophages,
re-analyzing cells that had either a macrophage or monocyte-       suggesting these cells were being actively phagocytosed by
like phenotype and further classified to cells with a more tis-    the macrophages (Fig. 4E). This signature was mostly absent
sue-resident phenotype, indicative of alveolar macrophages,        by 10 dpi, possibly because the MARCO+ macrophages were
or more monocyte-derived phenotype, indicative of intersti-        picking up more dead cells and cellular debris by this time
tial macrophages and monocytes using the expression of the         rather than whole cells with replicating virus (Fig. 4F).
macrophage receptor with collagenous structure (MARCO)             Mediastinal lymph nodes are in an inflammatory state
gene (Fig. 4A). The MARCO gene was selected as it is highly        at 3 dpi
expressed in alveolar macrophages and is absent in intersti-           To relate these virus replication and inflammatory
tial macrophages or monocytes based on previous data in hu-        changes in the lungs to changes in secondary lymphoid tis-
man lung samples (14). A comparison of the percentage of the       sues, we sampled cells from the mediastinal lymph nodes. We
MARCO+ to MARCO- cells showed that, at 3 dpi, there was a          collected whole mediastinal lymph nodes from animals at the
large influx of monocyte-derived cells, as most of the macro-      time of necropsy and prepared the samples along with the
phages detected at that time were MARCO-, consistent with          lung tissue. We were not able to detect any viral RNA in the
pathology findings in human samples (15). This shift began         lymph node by single-cell RNA sequencing, despite a few

First release: 11 January 2021                          stm.sciencemag.org      (Page numbers not final at time of first release)   4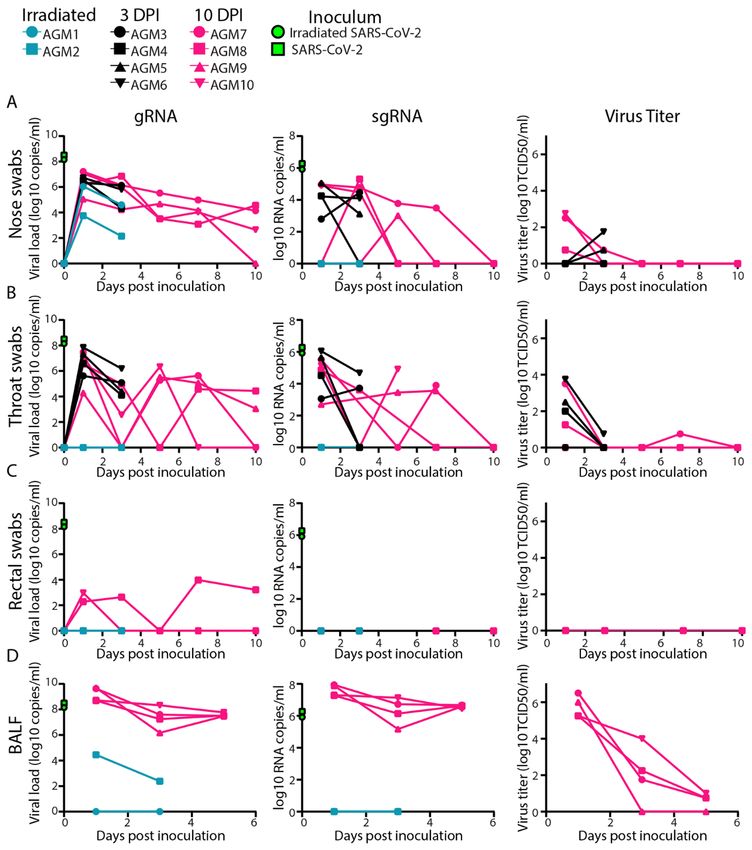
mononuclear cells staining for viral antigen by IHC (fig. S2E).     follicular helper genes that showed an expansion at 10 dpi in
This could be due to low abundance of RNA, low sensitivity          the lymph node (fig. S8C). These cells are often associated
of the scRNA-Seq assay in its ability to detect lowly abundant      with anti-inflammatory cytokines (such as IL-10) which again
transcripts, or an inability to capture high abundance of non-      further suggests that the inflammatory state observed in the
lymphocyte populations from the lymph node when generat-            lymph node and lung at 3 dpi is being cleared by 10 dpi.
ing cell suspensions (17). Using an annotation strategy like
                                                                    DISCUSSION
that used for lung cells, we could detect most of the major
                                                                        This study used large scale single cell sequencing in a non-
cell populations of the lymph node, with most cells annotat-
                                                                    human primate model of SARS-CoV-2 infection. The benefit
ing as T or B lymphocytes (Fig. 5A). Again, as with the lung,
                                                                    of using animal models to study SARS-CoV-2 lies in the ability
the annotated cell types expressed known marker genes asso-
                                                                    to collect time-resolved datasets of the lungs instead of being
ciated with their phenotype (Fig. 5B). The largest transcrip-
                                                                    limited to sampling at terminal timepoints (18, 19). Using tra-
tional change observed across all the cell types was an
                                                                    ditional virological methods as well as scRNA-Seq, we have
increase in interferon responsive genes at 3 dpi, suggesting
                                                                    begun to parse out the infection dynamics which occur as the
an inflammatory state in the draining lymph nodes. This

                                                                                                                                         Downloaded from http://stm.sciencemag.org/ by guest on March 24, 2021
                                                                    disease progresses and virus is eventually cleared in the Afri-
transcriptional profile was resolved by 10 dpi and was absent
                                                                    can green monkey model of mild COVID-19. These findings
in the lymph nodes from animals that received gamma-irra-
                                                                    are consistent with other studies done in African green mon-
diated virus (Fig. 5C). The genes characterized in the set at 3
                                                                    keys (11, 12), which share a similar disease pathology to that
dpi include many classical type I interferon responsive genes
                                                                    seen with rhesus macaques (20) and cynomolgus macaques
(Supplemental Table 2) that are up-regulated across many vi-
                                                                    (21). In all cases, the animals display mild disease signs lead-
ral infections.
                                                                    ing to clearance of the virus and recovery.
    There was an increase in the percentage of dividing cells
                                                                        One unique aspect of this study was the inclusion of two
(cells identified as in G2M or S-phase) among B cells (p-value
                                                                    animals inoculated with gamma-irradiated SARS-CoV-2,
of 10 dpi to irradiated = 0.02) and plasmacytoid dendritic
                                                                    which renders the virus unable to replicate (22). Unlike pre-
cells (p-value of 10 dpi to irradiated = 0.02) as infection pro-
                                                                    vious studies in non-human primate models of disease, this
gressed (Fig. 5D). This is consistent with histology findings of
                                                                    enabled us to directly compare the detection of viral genomic
lymph node hyperplasia later at 10 dpi (fig. S2D). Evaluation
                                                                    RNA from replicating vs. non-replicating virus. We found
of antibody secreting cells revealed an increase in plasma
                                                                    that gRNA was highly stable even in the absence of replicat-
cells (p-value of 10dpi to 3dpi = 0.03, Fig. 5E). The develop-
                                                                    ing virus and was detectable at 1 and 3 dpi in nose swabs and
ment of plasmablasts at 3 dpi in animals that received SARS-
                                                                    BALF from the animals inoculated with gamma-irradiated vi-
CoV-2 was lacking (Fig. 5F), potentially due to the inflamma-
                                                                    rus, whereas the sgRNA appeared to degrade quickly in
tory state of the lymph node and early time of collection.
                                                                    swabs in the absence of virus replication. Such viral dynamics
When looking at which cell type showed the strongest tran-
                                                                    could be due to gRNA being encapsulated or due to secondary
scriptional changes, we found that even at 10 dpi, macro-
                                                                    structures which help prevent degradation (23). This has po-
phages showed the strongest transcriptional shift when
                                                                    tential implications in patient testing, as positive gRNA re-
compared to samples from animals inoculated with gamma-
                                                                    sults by PCR may not represent replication-competent SARS-
irradiated virus (fig. S7A). Within the macrophage popula-
                                                                    CoV-2, especially since the highest amount of gRNA detected
tion, we saw an up-regulation in a small subset of macro-
                                                                    in the samples from the animals inoculated with irradiated
phages with markers for fully mature monocyte-derived
                                                                    virus were found in the nasal swabs currently used for most
macrophages, such as Chitinase 1, at 10 dpi (fig. S7B).
                                                                    patient diagnostics. Our data suggests that PCR-based tests
    Further analysis of the T cells in the mediastinal lymph
                                                                    which specifically target SARS-CoV-2 sgRNA may provide a
nodes and their relation to the lung T cell compartment was
                                                                    more realistic signature of replicating virus than detection of
performed. To identify CD4 vs. CD8 T cells, we used a similar
                                                                    gRNA, improving models to determine patient infectivity (24,
matching algorithm as above, using splenic T cells as back-
                                                                    25). Since animals cleared sgRNA faster than gRNA the dura-
ground (14). In both the lung and lymph node T cell compart-
                                                                    tion of time PCR-positive patients needs to remain in isola-
ment, we observed an increase in the percentage of CD4+ T
                                                                    tion could potentially be reduced.
cells in the lung (p = 0.003) and lymph node (p = 0.0026) at
                                                                        Using the African green monkey model, we have been able
10 dpi relative to irradiated control lungs (fig. S8A-B). We also
                                                                    to explore the dynamics of SARS-CoV-2 infection at the time
saw a decrease in proportion of CD8+ T cells at 10 dpi relative
                                                                    of peak disease in the lungs when most virus replication is
to irradiated control lungs (p = 0.0009) and lymph nodes (p
                                                                    occurring. Due to the nature of the 10X genomics platform
= 0.008, fig. S8A-B). No change in the regulatory T cell com-
                                                                    and the poly-adenylation of the SARS-CoV-2 genome and
partment was observed (fig. S8A-B). We were able to identify
                                                                    sgRNA, we were able to determine which cell types were pos-
a small subset of cells enriched for genes associated with T
                                                                    itive for viral RNA in a method similar to previously

First release: 11 January 2021                           stm.sciencemag.org      (Page numbers not final at time of first release)   5
published reports (5), though we did not include any other are reduced by the time infection is cleared. In contrast to the
alignments beyond SARS-CoV-2. To expand upon detection of African green monkey model, the role of the interferon re-
viral RNA reads, we looked at the distribution of the reads sponse has been proposed as a driver of disease if it is in-
across the genome to determine if we could find a unique duced with delayed kinetics relative to peak virus replication
pattern of alignment associated with replicating virus. Fur- (33, 34). Single-cell approaches in human peripheral blood
ther investigation into the distribution of reads across the ge- monomuclear cells and BALF from patients stratified by
nome suggests that productive virus replication is mostly COVID-19 severity have revealed that type I, II and III inter-
occurring in infected pneumocytes, though the macrophage ferons are sustained at higher amounts in severe patients,
population contained the highest percentage of cells positive while interferons declined in moderate patients over time
for viral RNA. These data provide evidence that macrophages from symptom onset (6, 9, 35). In the African green monkey
do not support efficient virus replication in vivo. A potential model, monocyte recruitment and interferon-stimulated gene
reason that the macrophages could have such high viral RNA responses were temporally controlled along with virus repli-
and immunoreactivity without supporting full replication is cation. These responses were diminished in the lungs during
through phagocytosis of virus particles or infected cells or recovery and were not sustained in the lymph nodes beyond
Downloaded from http://stm.sciencemag.org/ by guest on March 24, 2021
through abortive replication. This is similar to what has been the stage of peak virus replication. Therefore, the African
observed with SARS-CoV infection, where macrophages can green monkey model reflects effective viral control and re-
become infected but do not appear to support virus replica- veals transcriptional signatures within tissues associated
tion (26). Interestingly, abortive replication could result in with protective responses.
the production of aberrant replication products that induce This study presents early evidence of changes during a
a proinflammatory response as has been shown for influenza mild SARS-CoV-2 infection in the African green monkey
A virus in the lungs (27, 28). model. One obvious limitation of the animal model is that it
In the conditions examined here, macrophages appeared does not recapitulate the more severe manifestations of
to be the major drivers of inflammation in the lungs. This is COVID-19 disease. This is an apparent limitation of all cur-
especially interesting as it has been suggested through the rent non-human primate models of SARS-CoV-2 infection
study of healthy human tissue that macrophages interact (10–12, 20). Additionally, this study does not directly address
with ACE2 expressing cells at higher frequencies than other the more specific development of an adaptive immune re-
populations (4). Both the resident and monocyte-derived sponse due to lack of T or B cell receptor sequencing, espe-
macrophages at 3 dpi were enriched for pro-inflammatory cially at 10 dpi. Further studies with this model should be
genes, likely caused by having higher titers of virus in the performed to not only increase the sample size being tested,
lungs driving the inflammatory state. Interestingly, the but also to include single cell sequencing of samples of the
MARCO+, or tissue-resident, and MARCO-, or monocyte-de- upper respiratory tract such as nasal brushings and the addi-
rived, macrophage populations showed distinct patterns of tion of T and B cell receptor sequencing for an in-depth char-
gene expression in the 3 and 10 dpi samples. The MARCO+ acterization of the adaptive immune response.
cells were enriched for interferon-stimulated genes at 3 dpi, Together, the data reported here provide unique insights
but were enriched in pathways associated with pro-phago- into the dynamics of SARS-CoV-2 infection over time in the
cytic lysosomes only at 10 dpi (29). This is surprising, as lungs and associated secondary lymphoid tissue, the identity
MARCO+ macrophages have been found to be important in of the cells hosting replicating virus, and the transcriptional
controlling a variety of lung infections (30, 31). Only the changes in these and other cells during this infectious pro-
MARCO- cells at 3 dpi were enriched in genes associated with cess. Although the African green monkey model did not result
migration and lysosomes, suggesting that, at 3 dpi, the non- in severe disease upon inoculation with SARS-CoV-2, it did
alveolar macrophages were playing a more prominent role in allow for a deeper understanding of virus replication, host
lung cleanup. Similar alterations have been observed in se- response dynamics, and gene signatures associated with a
vere lung conditions such as chronic obstructive pulmonary successful resolution of infection. Together, these data can be
disease (32). Follow-up experiments validating and investi- used to inform development of host-targeted therapeutics for
gating which macrophage populations are responsible for in- SARS-CoV-2 infection.
nate immune host defense and for clearing up the lung
MATERIALS AND METHODS
environment of cellular debris at different stages post-inocu-
lation may help lead to unravel the causes of lung damage Study design
and indicate potential targets for therapeutic intervention. In the search for a nonhuman primate model that recapit-
Interferon stimulated genes represented dominant re- ulates severe COVID-19, we decided to inoculate African
sponses in monocyte and macrophage populations in both green monkeys with SARS-CoV-2 since they are often used as
the lungs and lymph nodes in the early stages of infection but models for respiratory virus infections and are known to
First release: 11 January 2021 stm.sciencemag.org (Page numbers not final at time of first release) 6develop acute respiratory distress syndrome when inoculated light and 12-hour dark). Animals were monitored at least
with Nipah virus (34, 35). To evaluate the pathogenesis of twice daily throughout the experiment. Commercial monkey
SARS-CoV-2 in African green monkeys, eight adult African chow, treats, and fruit were provided twice daily by trained
green monkeys (4 males, and 4 females, body weight 3.5-6kg) personnel. Water was available ad libitum. Environmental
were inoculated via a combination of intranasal (0.5 ml per enrichment consisted of a variety of human interaction, ma-
nostril), intratracheal (4 ml), oral (1 ml) and ocular (0.25 ml nipulanda, commercial toys, videos, and music. The Institu-
per eye) administration of a 4x10⁵ TCID50/ml (3x10⁸ genome tional Biosafety Committee (IBC) approved work with
copies/ml) virus dilution in sterile Dulbecco’s Modified Eagle infectious SARS-CoV-2 strains under biosafety level 3 condi-
Media (DMEM). Two control animals (1 male and 1 female, tions. Sample inactivation was performed according to IBC-
body weight 4.5-5.5kg) were included in the study for com- approved standard operating procedures for removal of spec-
parison. These animals were inoculated via the same routes imens from high containment (20, 22, 36, 37).
with the same dose and volume of inoculum. However, the Virus and cells
inoculum was gamma-irradiated to render the virus nonin- SARS-CoV-2 isolate nCoV-WA1-2020 (MN985325.1) (38)
fectious (21). The animals were observed daily (19); the same (Vero passage 3) was kindly provided by the Centers for Dis-
Downloaded from http://stm.sciencemag.org/ by guest on March 24, 2021
person assessed the animals throughout the study. The pre- ease Control and Prevention and propagated once in Vero E6
determined endpoint for this experiment was 3 days post in- cells in DMEM (Sigma) supplemented with 2% fetal bovine
oculation (dpi) for the two control animals that were serum (Gibco), 1 mM L-glutamine (Gibco), 50 U/ml penicillin
inoculated with irradiated virus and one group of four ani- and 50 μg/ml streptomycin (Gibco) (virus isolation medium).
mals inoculated with infectious SARS-CoV-2, and 10 dpi for Next generation sequencing using Illumina MiSeq showed
the remaining four animals inoculated with infectious SARS- that the used virus stock was 100% identical to the initial de-
CoV-2. Clinical exams were performed on 0, 1, 3, 5, 7, and 10 posited GenBank sequence (MN985325.1) with 6 SNPs de-
dpi on anesthetized animals. On exam days, clinical parame- tected in 1-4% of sequence reads, and no contaminants were
ters such as body weight, body temperature, and respiration detected. Virus was gamma-irradiated with a dose of 2 MRad
rate were collected, as well as ventro-dorsal and lateral chest using a JLS Model 484 Co-60 Irradiator to produce a non-
radiographs. Blood and nasal, throat, and rectal swabs were infectious inoculum (22). Absence of infectious virus after
collected during all clinical exams. Additionally, on 1, 3, and gamma-irradiation was confirmed in Vero E6 cells. Vero E6
5 dpi, animals were intubated and bronchoalveolar lavages cells were maintained in DMEM supplemented with 10% fe-
were performed using 10-20ml sterile saline. After euthana- tal calf serum, 1 mM L-glutamine, 50 U/ml penicillin and 50
sia, necropsies were performed. The percentage of gross lung μg/ml streptomycin.
lesions was scored by a board-certified veterinary pathologist
Quantitative PCR
and samples of the following tissues were collected: cervical
RNA was extracted from swabs and BALF using the Qi-
lymph node, conjunctiva, nasal mucosa, nasal septum, oro-
aAmp Viral RNA kit (Qiagen) according to the manufac-
pharynx, tonsil, trachea, all six lung lobes, mediastinal lymph
turer’s instructions. Tissues (30 mg) were homogenized in
node, right and left bronchus, heart, liver, spleen, kidney,
RLT buffer and RNA was extracted using the RNeasy kit (Qi-
stomach, duodenum, jejunum, ileum, cecum, colon, and uri-
agen) according to the manufacturer’s instructions. Five μl
nary bladder. Histopathological analysis of tissue slides was
RNA was used in a one-step real-time RT-PCR assay to detect
performed by a board-certified veterinary pathologist blinded
gRNA (forward primer 5′-
to the group assignment of the animals.
ACAGGTACGTTAATAGTTAATAGCGT-3′; reverse primer
All animal experiments were approved by the Institu-
5′- ATATTGCAGCAGTACGCACACA-3′; probe 5′-FAM-
tional Animal Care and Use Committee of Rocky Mountain
ACACTAGCCATCCTTACTGCGCTTCG-3IABkFQ-3′) and
Laboratories at the National Institutes of Health (NIH) and
sgRNA (forward primer 5′-
carried out by certified staff in an Association for Assessment
and Accreditation of Laboratory Animal Care (AAALAC) In- CGATCTCTTGTAGATCTGTTCTC-3′; reverse primer 5′-
ternational accredited facility, according to the institution’s ATATTGCAGCAGTACGCACACA-3′; probe 5′-FAM-
guidelines for animal use, following the guidelines and basic ACACTAGCCATCCTTACTGCGCTTCG-ZEN-IBHQ-3′) (39,
principles in the NIH Guide for the Care and Use of Labora- 40) using the Rotor-Gene probe kit (Qiagen) according to in-
tory Animals, the Animal Welfare Act, United States Depart- structions of the manufacturer. In each run, standard dilu-
ment of Agriculture and the United States Public Health tions of counted RNA standards were run in parallel to
Service Policy on Humane Care and Use of Laboratory Ani- calculate copy numbers in the samples.
mals. African green monkeys were housed in adjacent indi- Virus titration and isolation
vidual primate cages allowing social interactions, in a Virus titrations were performed by end-point titration in
climate-controlled room with a fixed light-dark cycle (12-hour Vero E6 cells. Cells were inoculated with 10-fold serial
First release: 11 January 2021 stm.sciencemag.org (Page numbers not final at time of first release) 7dilutions of swab and BALF samples. Virus isolation was per- protocols and the libraries were extracted from the AVL using
formed on tissues by homogenizing the tissue in 1ml DMEM the Qiagen AllPrep DNA spin columns (Cat 80204). Samples
and inoculating Vero E6 cells in a 24 well plate with 250 μl were then quantified and sequenced. Samples were se-
of cleared homogenate and a 1:10 dilution thereof. One hour quenced on the NextSeq550 using the 10X suggested cycling.
after inoculation of cells, the inoculum was removed and re- Processing of single-cell RNA sequencing data
placed with 100 μl (virus titration) or 500 μl (virus isolation) Data were processed through the cellRanger pipeline to
medium. Six days after inoculation, CPE was scored and the perform de-multiplexing and generate count tables. Align-
TCID50 was calculated. ment was done against the African green monkey Ensembl
Histopathology genome (ChlSab1.1) with the SARS-CoV-2 genome
Histopathology, immunohistochemistry, and in situ hy- (NC_045512.2) included to be able to parse out reads associ-
bridization were performed on African green monkey tissues. ated with the viral genome. Samples were then read into R
After fixation for a minimum of 7 days in 10% neutral-buff- (V3.6.2) using Seurat (V3.1.5) (16). Since samples were col-
ered formalin and embedding in paraffin, tissue sections lected across two different days (day 3 and day 10 post inoc-
were stained with hematoxylin and eosin (HE). Immuno- ulation), we wanted to account for potential batch effects in
Downloaded from http://stm.sciencemag.org/ by guest on March 24, 2021
histochemistry was performed using a custom-made rabbit the global dataset. For this reason, we then integrated the
antiserum against SARS-CoV-2 N at a 1:1000 dilution, using samples using the IntegrateData function. Cells were filtered
a CD68 clone KP1 mouse monoclonal antibody (Agilent Dako, that contained abnormally high mitochondrial genes (greater
#M0814) at a 1:100 dilution to identify macrophages, and us- than 3 standard deviations above the median) and cells that
ing Cytokeratin clone AE1/AE3 mouse monoclonal antibody were likely doublets were re-labeled (ratio of unique features
(Agilent Dako, #M3515) at a 1:100 dilution to identify epithe- to unique mapped identifier (UMI) per cell < 0.15). Also, cells
lial cells; antibodies were incubated with tissues for 1 hour. containing less than or greater than 3 standard deviations of
Secondary antibodies Discovery OmniMap anti-Rabbit horse- UMI compared to the population total were removed to filter
radish peroxidase (HRP) (Roche Tissue Diagnostics; cat# 760- for noise. Finally, the PCA and UMAP projections were calcu-
4311 predilute) or Discovery OmniMap anti-mouse HRP lated for the samples and clusters of cells were identified.
(Roche Tissue Diagnostics; cat# 760-4310 predilute) were Lung and the lymph node samples were analyzed separately.
then incubated with the tissues for 15 min. In situ hybridiza- Gene set enrichment analysis was performed using fgsea (42)
tion was used for detection of SARS-CoV-2 RNA in selected and the MSig DB (43) c2cp gene sets.
whole tissue sections of the lungs using the RNAscope VS Cell type identification using single-cell RNA sequenc-
Universal AP assay (Advanced Cell Diagnostics Inc.) as de- ing data
scribed previously (41) and using probe directed against the To determine the identity of either clusters of cells or in-
SARS-CoV-2 spike (S) gene (cat# 848569). Stained slides were dividual cells, we developed an unbiased method that uses a
analyzed by a board-certified veterinary pathologist. transcriptional profile of cells instead a few known marker
Single-Cell RNA sequencing of lung and mediastinal genes. For the reference data, we used an annotated single
lymph node samples cell sequencing dataset from (14). For each of the cell type
Lung sections and mediastinal lymph nodes were taken at present in the dataset of lung or spleen tissue, we calculated
the time of necropsy and processed. Cell suspensions were the differential gene expression using the FindMarkers func-
generated by manually dicing tissue, enzymatically digesting tion in Seurat. To find genes strongly associated with each
in RPMI-1640 containing 0.1 mg/ml Liberase TM (Sigma Al- individual cell type, we filtered the data to contain only those
drich, 5401127001) and 0.02 mg/ml DNase I (Sigma Aldrich, genes with an average logFC (log fold change) greater than 1
11284932001) at 37°C, and then passing through a 100 μm fil- and where the difference in the percentage of cells in the cell
ter (Becton Dickinson). Suspensions were subjected to ACK type of interest expressing the gene compared to the percent-
lysis and final washes in phosphate buffered saline (PBS) con- age of cells in all other cell types expressing the gene was
taining 0.1% MACS bovine serum albumin (Miltenyi 130-091- greater than 0.5. We used this gene set in either the lung or
386). 10,000 cells were prepared for 10X Genomics gel bead spleen of the human samples (14) to develop the marker gene
emulsions. The 10X genomics version 3.0 chemistry was used. set and calculated the average expression of the marker gene
cDNA for the individual cells was generated and libraries set in each cell type. This generated a matrix of the marker
prepped according to the manufacturer’s protocol. After final genes to cell types. Then a correlation of the marker genes in
libraries were generated, samples were inactivated for any the annotated data was compared to the individual cell or
potentially remaining virus using 500 μl of AVL buffer (Qi- cluster in the African green monkey dataset. This generated
agen) with 500 μl of ethanol with a sample volume of 140 μl. a score for the unknown cell or cluster to a known annota-
After a minimum 10-min incubation, samples were removed tion. Using this method, we found that most clusters con-
from the high-containment laboratory following standard tained predominately just one cell type. This is a similar
First release: 11 January 2021 stm.sciencemag.org (Page numbers not final at time of first release) 8method that was developed for the mouse cell atlas (44). The p-value for multiple testing. A p-value of 0.05 was considered
results were validated by looking at the expression of the significant. Statistical tests for gene expression in single cell
marker genes across the different cell annotations. Our ratios data was carried in Seurat V3.6. Graphs were generated ei-
of cell populations was similar to other studies that have per- ther in ggplot2 (46) or in GraphPad Prism Version 8.
formed similar tissue processing steps to collect lung cells
from suspension without any enrichment for a given cell type SUPPLEMENTARY MATERIALS
(14). When determining the identity on an individual cell stm.sciencemag.org/cgi/content/full/scitranslmed.abe8146/DC1
level, an additional step was added to help correct falsely Figure S1. Clinical scores, gross lung lesions and viral loads in respiratory and
identified cells. Using the k-nearest neighbors (knn) graph gastrointestinal tract of African green monkeys inoculated with SARS-CoV-2.
Figure S2. Histological changes in intestinal tract and lymph nodes of African green
generated in the FindNeighbors function in Seurat, for each monkeys infected with SARS-CoV-2.
cell, its closest neighbors were determined. Once the nearest Figure S3. Percentage of cell types in the lung determined by single cell RNA
neighbors were determined, the identities of these neighbors sequencing.
were pulled out. If > 70% of the nearest neighbors had one Figure S4. Coverage of reads from the pseudo-bulk data across the SARS-CoV-2
genome.
specific identity, the cell identity was reassigned as such. This Figure S5. Clustering bias across cell populations in the lungs.
Downloaded from http://stm.sciencemag.org/ by guest on March 24, 2021
was run multiple times until a stable number of unidentified Figure S6. Gene set enrichment analysis of macrophages across the principal
cells was found (determined by small changes in unknown components.
cell identities). For those that were not able to be identified, Figure S7. Comparison of different cell populations in the mediastinal lymph node.
Figure S8. Analysis of T cell populations in lung and mediastinal lymph node.
the identity from the original transcriptional profile was Table S1. Virus isolation from tissues of African green monkeys inoculated with SARS-
used. The cell proportions were found to be fairly consistent CoV-2 and euthanized at 3 and 10 days post inoculation.
between individual animals, suggesting there were not addi- Data file S1. Raw data.
tional strong batch effects. Data file S2. Gene correlations along principal components of the macrophages and
ISG gene set.
Finally, to identify clusters that were specifically cells un-
dergoing rapid cell division, we used the CellCycleScore func-
tion in Seurat to identify which cell cycle each cell was likely REFERENCES AND NOTES
1. M. Z. Tay, C. M. Poh, L. Rénia, P. A. MacAry, L. F. P. Ng, The trinity of COVID-19:
in. We then determined that clusters where greater than 95% Immunity, inflammation and intervention. Nat. Rev. Immunol. 20, 363–374
of the cells were in G2M or S phase were dividing clusters (2020). doi:10.1038/s41577-020-0311-8 Medline
and were labeled as such. 2. H. Ge, X. Wang, X. Yuan, G. Xiao, C. Wang, T. Deng, Q. Yuan, X. Xiao, The
epidemiology and clinical information about COVID-19. Eur. J. Clin. Microbiol.
SARS-CoV-2 read enrichment Infect. Dis. 39, 1011–1019 (2020). doi:10.1007/s10096-020-03874-z Medline
To analyze the enrichment of reads across the SARS-CoV- 3. W. Sungnak, N. Huang, C. Bécavin, M. Berg, R. Queen, M. Litvinukova, C. Talavera-
2 genome, we used Integrative Genome Viewer (45) to find López, H. Maatz, D. Reichart, F. Sampaziotis, K. B. Worlock, M. Yoshida, J. L.
Barnes; HCA Lung Biological Network, SARS-CoV-2 entry factors are highly
read pile-ups. Cells were labeled as positive for viral RNA if
expressed in nasal epithelial cells together with innate immune genes. Nat. Med.
they contained any counts to the viral genome. 26, 681–687 (2020). doi:10.1038/s41591-020-0868-6 Medline
Clustering biases in scRNA-Seq data 4. F. Qi, S. Qian, S. Zhang, Z. Zhang, Single cell RNA sequencing of 13 human tissues
identify cell types and receptors of human coronaviruses. Biochem. Biophys. Res.
To determine if there were clustering biases between two Commun. 526, 135–140 (2020). doi:10.1016/j.bbrc.2020.03.044 Medline
cell types, a new method was developed. Across any cluster of 5. P. Bost, A. Giladi, Y. Liu, Y. Bendjelal, G. Xu, E. David, R. Blecher-Gonen, M. Cohen,
cells, the dataset was subset and re-normalized internally to C. Medaglia, H. Li, A. Deczkowska, S. Zhang, B. Schwikowski, Z. Zhang, I. Amit,
that cluster. Then the significant principal components (con- Host-Viral Infection Maps Reveal Signatures of Severe COVID-19 Patients. Cell
181, 1475–1488.e12 (2020). doi:10.1016/j.cell.2020.05.006 Medline
taining up to 99% of the variance explained) were calculated. 6. M. Liao, Y. Liu, J. Yuan, Y. Wen, G. Xu, J. Zhao, L. Cheng, J. Li, X. Wang, F. Wang, L.
Along each principal component, the location of the cells was Liu, I. Amit, S. Zhang, Z. Zhang, Single-cell landscape of bronchoalveolar immune
pulled and grouped based on the two conditions that were cells in patients with COVID-19. Nat. Med. 26, 842–844 (2020).
being compared. The median location of each of the cell pop- doi:10.1038/s41591-020-0901-9 Medline
7. R. L. Chua, S. Lukassen, S. Trump, B. P. Hennig, D. Wendisch, F. Pott, O. Debnath,
ulations along the PC was calculated and the distance meas- L. Thürmann, F. Kurth, M. T. Völker, J. Kazmierski, B. Timmermann, S. Twardziok,
ured. This was carried out for all principal components and S. Schneider, F. Machleidt, H. Müller-Redetzky, M. Maier, A. Krannich, S. Schmidt,
all clusters. To identify outliers with the strongest clustering F. Balzer, J. Liebig, J. Loske, N. Suttorp, J. Eils, N. Ishaque, U. G. Liebert, C. von
bias, points outside the mean and two standard deviations Kalle, A. Hocke, M. Witzenrath, C. Goffinet, C. Drosten, S. Laudi, I. Lehmann, C.
Conrad, L.-E. Sander, R. Eils, COVID-19 severity correlates with airway epithelium-
across all the principal components and cell types were immune cell interactions identified by single-cell analysis. Nat. Biotechnol. 38,
noted. 970–979 (2020). doi:10.1038/s41587-020-0602-4 Medline
Statistical Analysis 8. W. Wen, W. Su, H. Tang, W. Le, X. Zhang, Y. Zheng, X. Liu, L. Xie, J. Li, J. Ye, L. Dong,
X. Cui, Y. Miao, D. Wang, J. Dong, C. Xiao, W. Chen, H. Wang, Immune cell profiling
Statistical tests comparing cell numbers were carried out of COVID-19 patients in the recovery stage by single-cell sequencing. Cell Discov.
in GraphPad Prism Version 8 using a one way ANOVA. All 6, 31 (2020). doi:10.1038/s41421-020-0168-9 Medline
comparisons between the three groups are reporting adjusted 9. A. J. Wilk, A. Rustagi, N. Q. Zhao, J. Roque, G. J. Martínez-Colón, J. L. McKechnie, G.
T. Ivison, T. Ranganath, R. Vergara, T. Hollis, L. J. Simpson, P. Grant, A.
First release: 11 January 2021 stm.sciencemag.org (Page numbers not final at time of first release) 9Subramanian, A. J. Rogers, C. A. Blish, A single-cell atlas of the peripheral immune Irradiation as an Effective Method for Inactivation of Emerging Viral Pathogens.
response in patients with severe COVID-19. Nat. Med. 26, 1070–1076 (2020). Am. J. Trop. Med. Hyg. 100, 1275–1277 (2019). doi:10.4269/ajtmh.18-0937
doi:10.1038/s41591-020-0944-y Medline Medline
10. J. McAuliffe, L. Vogel, A. Roberts, G. Fahle, S. Fischer, W. J. Shieh, E. Butler, S. Zaki, 23. H. Wakida, K. Kawata, Y. Yamaji, E. Hattori, T. Tsuchiya, Y. Wada, H. Ozaki, N.
M. St Claire, B. Murphy, K. Subbarao, Replication of SARS coronavirus Akimitsu, Stability of RNA sequences derived from the coronavirus genome in
administered into the respiratory tract of African Green, rhesus and cynomolgus human cells. Biochem. Biophys. Res. Commun. 527, 993–999 (2020).
monkeys. Virology 330, 8–15 (2004). doi:10.1016/j.virol.2004.09.030 Medline doi:10.1016/j.bbrc.2020.05.008 Medline
11. A. L. Hartman, S. Nambulli, C. M. McMillen, A. G. White, N. L. Tilston-Lunel, J. R. 24. J. Bullard, K. Dust, D. Funk, J. E. Strong, D. Alexander, L. Garnett, C. Boodman, A.
Albe, E. Cottle, M. D. Dunn, L. J. Frye, T. H. Gilliland, E. L. Olsen, K. J. O’Malley, M. Bello, A. Hedley, Z. Schiffman, K. Doan, N. Bastien, Y. Li, P. G. Van Caeseele, G.
M. Schwarz, J. A. Tomko, R. C. Walker, M. Xia, M. S. Hartman, E. Klein, C. A. Poliquin, Predicting infectious SARS-CoV-2 from diagnostic samples. Clin. Infect.
Scanga, J. L. Flynn, W. B. Klimstra, A. K. McElroy, D. S. Reed, W. P. Duprex, SARS- Dis. ciaa638 (2020). doi:10.1093/cid/ciaa638 Medline
CoV-2 infection of African green monkeys results in mild respiratory disease 25. C. G. Huang, K.-M. Lee, M.-J. Hsiao, S.-L. Yang, P.-N. Huang, Y.-N. Gong, T.-H.
discernible by PET/CT imaging and shedding of infectious virus from both Hsieh, P.-W. Huang, Y.-J. Lin, Y.-C. Liu, K.-C. Tsao, S.-R. Shih, Culture-Based Virus
respiratory and gastrointestinal tracts. PLOS Pathog. 16, e1008903 (2020). Isolation To Evaluate Potential Infectivity of Clinical Specimens Tested for COVID-
doi:10.1371/journal.ppat.1008903 Medline 19. J. Clin. Microbiol. 58, e01068-20 (2020). doi:10.1128/JCM.01068-20 Medline
12. C. Woolsey, V. Borisevich, A. N. Prasad, K. N. Agans, D. J. Deer, N. S. Dobias, J. C. 26. M. S. Yip, N. H. Leung, C. Y. Cheung, P. H. Li, H. H. Lee, M. Daëron, J. S. Peiris, R.
Heymann, S. L. Foster, C. B. Levine, L. Medina, K. Melody, J. B. Geisbert, K. A. Bruzzone, M. Jaume, Antibody-dependent infection of human macrophages by
Downloaded from http://stm.sciencemag.org/ by guest on March 24, 2021
Fenton, T. W. Geisbert, R. W. Cross, Establishment of an African green monkey severe acute respiratory syndrome coronavirus. Virol. J. 11, 82 (2014).
model for COVID-19 and protection against re-infection. Nat. Immunol. 22, 86–98 doi:10.1186/1743-422X-11-82 Medline
(2021). doi:10.1038/s41590-020-00835-8 Medline 27. A. J. W. Te Velthuis, J. C. Long, D. L. V. Bauer, R. L. Y. Fan, H.-L. Yen, J. Sharps, J.
13. D. Kim, J.-Y. Lee, J.-S. Yang, J. W. Kim, V. N. Kim, H. Chang, The Architecture of Y. Siegers, M. J. Killip, H. French, M. J. Oliva-Martín, R. E. Randall, E. de Wit, D. van
SARS-CoV-2 Transcriptome. Cell 181, 914–921.e10 (2020). Riel, L. L. M. Poon, E. Fodor, Mini viral RNAs act as innate immune agonists during
doi:10.1016/j.cell.2020.04.011 Medline influenza virus infection. Nat. Microbiol. 3, 1234–1242 (2018).
14. E. Madissoon, A. Wilbrey-Clark, R. J. Miragaia, K. Saeb-Parsy, K. T. Mahbubani, N. doi:10.1038/s41564-018-0240-5 Medline
Georgakopoulos, P. Harding, K. Polanski, N. Huang, K. Nowicki-Osuch, R. C. 28. M. Brandes, F. Klauschen, S. Kuchen, R. N. Germain, A systems analysis identifies
Fitzgerald, K. W. Loudon, J. R. Ferdinand, M. R. Clatworthy, A. Tsingene, S. van a feedforward inflammatory circuit leading to lethal influenza infection. Cell 154,
Dongen, M. Dabrowska, M. Patel, M. J. T. Stubbington, S. A. Teichmann, O. Stegle, 197–212 (2013). doi:10.1016/j.cell.2013.06.013 Medline
K. B. Meyer, scRNA-seq assessment of the human lung, spleen, and esophagus 29. N. A-Gonzalez, J. A. Quintana, S. García-Silva, M. Mazariegos, A. González de la
tissue stability after cold preservation. Genome Biol. 21, 1 (2019). Aleja, J. A. Nicolás-Ávila, W. Walter, J. M. Adrover, G. Crainiciuc, V. K. Kuchroo, C.
doi:10.1186/s13059-019-1906-x Medline V. Rothlin, H. Peinado, A. Castrillo, M. Ricote, A. Hidalgo; N. A-Gonzalez et al,
15. C. Wang, J. Xie, L. Zhao, X. Fei, H. Zhang, Y. Tan, X. Nie, L. Zhou, Z. Liu, Y. Ren, L. Phagocytosis imprints heterogeneity in tissue-resident macrophages. J. Exp.
Yuan, Y. Zhang, J. Zhang, L. Liang, X. Chen, X. Liu, P. Wang, X. Han, X. Weng, Y. Med. 214, 1281–1296 (2017). doi:10.1084/jem.20161375 Medline
Chen, T. Yu, X. Zhang, J. Cai, R. Chen, Z.-L. Shi, X.-W. Bian, Alveolar macrophage 30. M. Arredouani, Z. Yang, Y. Ning, G. Qin, R. Soininen, K. Tryggvason, L. Kobzik, The
dysfunction and cytokine storm in the pathogenesis of two severe COVID-19 scavenger receptor MARCO is required for lung defense against pneumococcal
patients. EBioMedicine 57, 102833 (2020). doi:10.1016/j.ebiom.2020.102833 pneumonia and inhaled particles. J. Exp. Med. 200, 267–272 (2004).
Medline doi:10.1084/jem.20040731 Medline
16. T. Stuart, A. Butler, P. Hoffman, C. Hafemeister, E. Papalexi, W. M. Mauck 3rd, Y. 31. N. Stichling, M. Suomalainen, J. W. Flatt, M. Schmid, M. Pacesa, S. Hemmi, W.
Hao, M. Stoeckius, P. Smibert, R. Satija, Comprehensive integration of single-cell Jungraithmayr, M. D. Maler, M. A. Freudenberg, A. Plückthun, T. May, M. Köster,
data. Cell 177, 1888–1902.e21 (2019). doi:10.1016/j.cell.2019.05.031 Medline G. Fejer, U. F. Greber, Lung macrophage scavenger receptor SR-A6 (MARCO) is
17. M. Y. Gerner, W. Kastenmuller, I. Ifrim, J. Kabat, R. N. Germain, Histo-cytometry: A an adenovirus type-specific virus entry receptor. PLOS Pathog. 14, e1006914
method for highly multiplex quantitative tissue imaging analysis applied to (2018). doi:10.1371/journal.ppat.1006914 Medline
dendritic cell subset microanatomy in lymph nodes. Immunity 37, 364–376 32. J. Jubrail, N. Kurian, F. Niedergang, Macrophage phagocytosis cracking the defect
(2012). doi:10.1016/j.immuni.2012.07.011 Medline code in COPD. Biomed. J. 40, 305–312 (2017). doi:10.1016/j.bj.2017.09.004
18. T. Menter, J. D. Haslbauer, R. Nienhold, S. Savic, H. Hopfer, N. Deigendesch, S. Medline
Frank, D. Turek, N. Willi, H. Pargger, S. Bassetti, J. D. Leuppi, G. Cathomas, M. 33. R. Channappanavar, A. R. Fehr, R. Vijay, M. Mack, J. Zhao, D. K. Meyerholz, S.
Tolnay, K. D. Mertz, A. Tzankov, Postmortem examination of COVID-19 patients Perlman, Dysregulated Type I Interferon and Inflammatory Monocyte-
reveals diffuse alveolar damage with severe capillary congestion and variegated Macrophage Responses Cause Lethal Pneumonia in SARS-CoV-Infected Mice.
findings in lungs and other organs suggesting vascular dysfunction. Cell Host Microbe 19, 181–193 (2016). doi:10.1016/j.chom.2016.01.007 Medline
Histopathology 77, 198–209 (2020). doi:10.1111/his.14134 Medline 34. R. Channappanavar, A. R. Fehr, J. Zheng, C. Wohlford-Lenane, J. E. Abrahante, M.
19. S. Tian, Y. Xiong, H. Liu, L. Niu, J. Guo, M. Liao, S.-Y. Xiao, Pathological study of the Mack, R. Sompallae, P. B. McCray Jr., D. K. Meyerholz, S. Perlman, IFN-I response
2019 novel coronavirus disease (COVID-19) through postmortem core biopsies. timing relative to virus replication determines MERS coronavirus infection
Mod. Pathol. 33, 1007–1014 (2020). doi:10.1038/s41379-020-0536-x Medline outcomes. J. Clin. Invest. 129, 3625–3639 (2019). doi:10.1172/JCI126363 Medline
20. V. J. Munster, F. Feldmann, B. N. Williamson, N. van Doremalen, L. Pérez-Pérez, J. 35. C. Lucas, P. Wong, J. Klein, T. B. R. Castro, J. Silva, M. Sundaram, M. K. Ellingson,
Schulz, K. Meade-White, A. Okumura, J. Callison, B. Brumbaugh, V. A. Avanzato, T. Mao, J. E. Oh, B. Israelow, T. Takahashi, M. Tokuyama, P. Lu, A. Venkataraman,
R. Rosenke, P. W. Hanley, G. Saturday, D. Scott, E. R. Fischer, E. de Wit, A. Park, S. Mohanty, H. Wang, A. L. Wyllie, C. B. F. Vogels, R. Earnest, S. Lapidus,
Respiratory disease in rhesus macaques inoculated with SARS-CoV-2. Nature I. M. Ott, A. J. Moore, M. C. Muenker, J. B. Fournier, M. Campbell, C. D. Odio, A.
585, 268–272 (2020). doi:10.1038/s41586-020-2324-7 Medline Casanovas-Massana, R. Herbst, A. C. Shaw, R. Medzhitov, W. L. Schulz, N. D.
21. B. Rockx, T. Kuiken, S. Herfst, T. Bestebroer, M. M. Lamers, B. B. Oude Munnink, Grubaugh, C. Dela Cruz, S. Farhadian, A. I. Ko, S. B. Omer, A. Iwasaki; Yale IMPACT
D. de Meulder, G. van Amerongen, J. van den Brand, N. M. A. Okba, D. Schipper, P. Team, Longitudinal analyses reveal immunological misfiring in severe COVID-19.
van Run, L. Leijten, R. Sikkema, E. Verschoor, B. Verstrepen, W. Bogers, J. Nature 584, 463–469 (2020). doi:10.1038/s41586-020-2588-y Medline
Langermans, C. Drosten, M. Fentener van Vlissingen, R. Fouchier, R. de Swart, M. 36. S. C. Johnston, T. Briese, T. M. Bell, W. D. Pratt, J. D. Shamblin, H. L. Esham, G. C.
Koopmans, B. L. Haagmans, Comparative pathogenesis of COVID-19, MERS, and Donnelly, J. C. Johnson, L. E. Hensley, W. I. Lipkin, A. N. Honko, Detailed analysis
SARS in a nonhuman primate model. Science 368, 1012–1015 (2020). of the African green monkey model of Nipah virus disease. PLOS ONE 10, e0117817
doi:10.1126/science.abb7314 Medline (2015). doi:10.1371/journal.pone.0117817 Medline
22. F. Feldmann, W. L. Shupert, E. Haddock, B. Twardoski, H. Feldmann, Gamma 37. J. B. Geisbert, V. Borisevich, A. N. Prasad, K. N. Agans, S. L. Foster, D. J. Deer, R.
First release: 11 January 2021 stm.sciencemag.org (Page numbers not final at time of first release) 10You can also read