Drift sands, lakes, and soils: the multiphase Holocene history of the Laarder Wasmeren area near Hilversum, the Netherlands - Cambridge University ...
←
→
Page content transcription
If your browser does not render page correctly, please read the page content below
Netherlands Journal of Geosciences — Geologie en Mijnbouw | 92 – 2/3 | 243-266 | 2013

                      Drift sands, lakes, and soils: the multiphase Holocene history
                      of the Laarder Wasmeren area near Hilversum, the Netherlands

                      J. Sevink1,*, E.A. Koster2, B. van Geel1 & J. Wallinga3

           1 Institute for Biodiversity and Ecosystem Dynamics (IBED), University of Amsterdam, the Netherlands
           2 Department of Physical Geography, Faculty of Geosciences, Utrecht University, the Netherlands
           3 Soil Geography and Landscape group, Wageningen University / Netherlands Centre for Luminescence dating (NCL), Delft University of
               Technology, the Netherlands
           * Corresponding author. Email: j.sevink@uva.nl

           Manuscript received: August 2012, accepted: April 2013

                      Abstract

           A unique complex of multiphased Holocene drift sands and paleosols, with at least two lacustrine phases, was discovered during a major sanitation
           project in the Laarder Wasmeren area near Hilversum, the Netherlands. The complex could be studied in detail, highly facilitated by the excellent
           and large-scale exposure of the various deposits and soils. OSL dating was used to establish ages of the phases, where possible differentiating
           between time of deposition and time of burial by taking into account the potential effects of bioturbation. Pollen analysis served to reconstruct
           the vegetation during the various phases.
               A first minor phase of aeolian activity already started before approx. 5,000 BC, followed around 4,000 BC by a second phase and a rather massive
           third phase around 3,000 BC. After a long phase of soil formation, the latest, massive drift sand phase started around the 14th to 15th century. It
           clearly represents the classic drift sand phase that started in the Late Middle Ages in the Netherlands. Sand drifting followed on soil forming phases
           during which the vegetation became increasingly dominated by ericaceous plants and culminated in heathlands. The first three aeolian phases and
           associated heathlands are much older than generally assumed for heathland and drift sand to occur in the Netherlands. Moreover, podzolisation
           was found to have started very early, true podzols already occurring before 4,000 BC.
               Around 3,000 BC groundwater in the area reached a maximum altitude of about 230 cm +NAP, resulting in local open water in the area. This rise
           is probably linked to the development of the Dutch coastal area, where at that time peat accumulated and drainage was poor, inducing a rise of the
           groundwater level in ‘het Gooi’. This groundwater level fell later on, to never reach this altitude again. The Groot Wasmeer was formed by local stagnation
           on a slowly permeable podzol and already reached a level of 320-325 cm +NAP by 400 BC, which more or less equals its 20th century level.
               The results demonstrate that earlier concepts on the occurrence and age of aeolian phases, podzols and heathland vegetations in the
           Netherlands are far too schematic, and that early, pre-agricultural cultures may already have had an impact on the stability of fragile cover sand
           landscapes, e.g. through burning. Results are in line with those from several contemporary studies on early prehistoric cultures and their impact
           in river dune areas in the Central and Eastern Netherlands.

           Keywords: Holocene, OSL dating, Polycyclic drift sands, Podzolisation, Paleohydrology

                      Introduction                                                                Ages, when serious soil degradation induced renewed aeolian
                                                                                                  activity and the genesis of so-called drift sands (e.g. Koster,
           Large parts of North-West Europe were covered with a blanket                           2010). Recent work by Tolksdorf & Kaiser (2012), however,
           of aeolian sands during the Weichselian. For a long time it was                        suggests that sand drifting continued until the mid Atlantic
           assumed that these cover sand landscapes were marked by low                            (4,500 BC) and started again around 2,000 BC, likely due to
           dynamics during most of the Holocene, i.e. up to the Late Middle                       intensified land-use in the Late Neolithic. Furthermore, Willemse

                                                                                                                                                                           243
Downloaded from https://www.cambridge.org/core. IP address: 46.4.80.155, on 16 Aug 2021 at 01:51:21, subject to the Cambridge Core terms of use, available at https://www.cambridge.org/core/terms
. https://doi.org/10.1017/S0016774600000196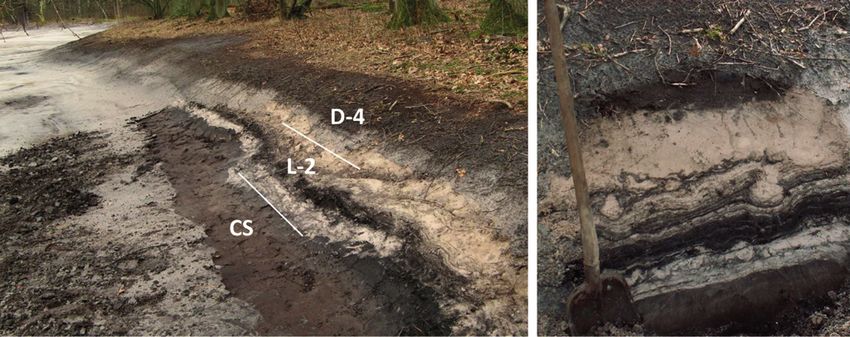
Netherlands Journal of Geosciences — Geologie en Mijnbouw                             92 – 4 | 2013

           & Groenewoudt (2012) showed that sand drifting along streams                           situated in this valley at approximately 2-5 m +NAP (Dutch
           and rivers in the Netherlands may have occurred as early as                            Ordnance Datum), whereas the eroded remains of the original
           3,800 BC, and was widespread from around 2,000 BC. This early                          ice-pushed ridges reach heights of 10-27.5 m +NAP (Fig. 1).
           onset of sand drifting was attributed to agricultural activity on                         The groundwater system in ‘het Gooi’ has been extensively
           soils that were impoverished as a result of natural soil depletion.                    studied (Schot, 1989 and Velstra et al., 2004). The ‘Wasmeren’
               In this paper, we contribute to the understanding of Holocene                      were Late Holocene fens and bogs that originated through
           landscape evolution in the Dutch cover sand area by exploiting                         stagnation of water on impervious podzols and were fed by
           a unique research opportunity offered by a large-scale soil                            precipitation. Under ‘natural conditions’ groundwater flowed
           remediation project in the Laarder Wasmeren area near                                  from the higher ridges towards the meltwater valley. During
           Hilversum, the Netherlands, which started in 2007. This nature                         the last century, from around 1925 onward, the groundwater
           reserve with drift sands and several lakes that originally were                        level was lowered through extraction for drinking water and
           fens or bogs, is set in a large glacial meltwater valley, cut                          flow paths were seriously altered and in places even inversed.
           through ice-pushed ridges and with a thick Late Pleistocene                            This extraction was partly compensated by discharge of
           fill, topped by Late Weichselian cover sands and Holocene drift                        wastewater from an urban sewage system of Hilversum into the
           sands (Fig. 1a-c). The project involved the removal of heavily                         LWM area, creating and feeding lakes where this water infil-
           polluted sludge that occurred as a more or less continuous layer                       trated, leaving behind a highly polluted sludge. Groundwater
           in the lakes and on the adjacent land surface, and as infill of an                     extraction was reduced, from about 20 million m3 in the seventies
           intricate network of ditches and canals (Sevink et al., 2008;                          to 14 million m3 in 1989 and later on to 7 million m3. Upon the
           Sevink, 2010) (Fig. 2a and b). Upon its removal the underlying                         recent sanitation of the LWM area, the discharge of water
           soils and sediments were exceptionally well exposed over large                         stopped, leading to partial restoration of the ‘natural’ ground-
           areas and to a considerable depth (up to 3 metres), allowing for                       water level and groundwater flow. Fens once more became solely
           detailed observations on a complex of Late Weichselian and                             fed by precipitation. Several authors (e.g. Schot & Engelen,
           Holocene sandy deposits (Fig. 1d-h).                                                   1989; Colaris, 1998; Sevink et al., 2012) described the complex
               The Holocene deposits exhibit a very complex stratigraphy and                      recent history of extraction, infiltration and lateral seepage
           genesis, i.e. four drift sand phases, two aquatic phases (marshy                       towards deep polders (e.g. Horstermeer). At present, the
           to lacustrine) and five phases of soil formation. Such complex                         seasonally highest groundwater level in the LWM area is at
           stratigraphy is unique for the Netherlands. Consequently, the                          about 1.5 m +NAP, i.e. distinctly below the natural ground
           area has been studied in detail, including a.o. OSL dating of the                      surface.
           various local deposition phases and pollen analysis of a number                           A detailed review of earlier studies on the vegetation during
           of sedimentary sequences. Results from this multidisciplinary                          the Holocene has been given by Colaris (1998), including results
           study are reported in this paper and though pertaining to local                        from various palynological studies on the impact of prehistoric
           phases in a relatively small Dutch region – ‘het Gooi’ – they                          land use (e.g. Casparie & Groenman-van Waateringe, 1980). As
           provide new data on the origin and age of early drift sands, on                        to the early land use history of ‘het Gooi’, Wimmers et al.
           the Holocene vegetation history, and on the onset and timing                           (1993) state that the first evidence of significant agriculture
           of podzolisation in the Netherlands. Only the generals of this                         dates back to the Middle Neolithic Funnel Beaker culture
           vegetation history are described, a detailed study will be                             (around 3,400-2,900 BC), but the ‘landnam’ (or slash and burn)
           published elsewhere (Doorenbosch, in prep).                                            during that period had a limited impact on the vegetation, with
                                                                                                  only local and temporal transformation of forest into herbaceous
                      General information                                                         vegetation with minor occurrence of Calluna vulgaris (see also
                                                                                                  De Smidt, 1975). In the subsequent Late Neolithic (2,900-2,000
                 The Laarder Wasmeren area (LWM): geology,                                        BC), land use became more intensive and cultural remains of its
                 hydrology, and history                                                           Beaker cultures (e.g. Bell Beaker and Corded Beaker) are
                                                                                                  widespread, including a fairly large number of burial mounds,
           During and after ice advance in the Saalian, a NW-SE orientated                        such as on the Zuiderheide immediately N of the LWM area.
           glacial meltwater valley was incised through the ice-pushed
           ridges in the southern part of ‘het Gooi’ and adjacent province                        Fig. 1. Location of the LWM area and sites. a. Location and altitude of the
           Utrecht (see Fig. 1). Fluvio-glacial sands and gravels subse-                          Laarder Wasmeren area. Ice-pushed ridges are in red; b. Details of the area,
           quently filled this valley, with a total thickness of several tens                     with its former lakes; c. Location of the major sections (Roman numbers);
           of metres. During the Weichselian, fluvio-periglacial and aeolian                      d. Early paleosol (S1-3) in a former canal; e. Lake bottom of the Groot
           sediments further flattened the relief to a few tens of metres                         Wasmeer with bleached sands; f. Complex surface of the former Vuilwaterplas
           (Koopman & Pfeifer, 2012). In the valley, drift sand dunes and                         after its sanitation; g. Surface of the Langewater with two parallel canals,
           sheets were deposited during the Holocene as a consequence of                          exhibiting a single podzol; h. NE of the Groot Wasmeer with abundant cart
           local reworking of cover sand. The Laarder Wasmeren are                                tracks.

              244
Downloaded from https://www.cambridge.org/core. IP address: 46.4.80.155, on 16 Aug 2021 at 01:51:21, subject to the Cambridge Core terms of use, available at https://www.cambridge.org/core/terms
. https://doi.org/10.1017/S0016774600000196
Netherlands Journal of Geosciences — Geologie en Mijnbouw                             92 – 4 | 2013

           a.                                                                                                                                                                   b.

           d.

           e.

           f.

           g.

           h.                                                                                                                                                                   c.

                                                                                                                                                                           245
Downloaded from https://www.cambridge.org/core. IP address: 46.4.80.155, on 16 Aug 2021 at 01:51:21, subject to the Cambridge Core terms of use, available at https://www.cambridge.org/core/terms
. https://doi.org/10.1017/S0016774600000196
Netherlands Journal of Geosciences — Geologie en Mijnbouw                             92 – 4 | 2013

           According to Wimmers et al. (1993), it was during the Bronze                           conditions, including the Little Ice Age (see e.g. Heidinga,
           Age (2,000-800 BC) that the earlier, Neolithic Oak-Lime forest                         1984 and 2010; Jungerius & Riksen, 2010). However, the latter
           was gradually transformed into Oak-Birch forest and heathland                          attribution remains rather hypothetical, not being based on
           dominated by Ericales became more prominent. It should be                              systematic dating of drift sand deposits and their phasing.
           emphasised that the attribution to man-induced degradation                                Until fairly recently dating drift sands and their phases was
           of the general change of the forest vegetation towards Ericales                        notoriously problematic in case that archaeological materials
           dominated heathland is challenged by Van Geel & Bos (2007).                            were absent as well as organic material that allowed for reliable
           They found that heath vegetation already occurred during the                           and precise 14C dating such as peat layers and charcoal. This
           Early Atlantic on Pleistocene sands to the west of ‘het Gooi’                          holds for most drift sands, as has been extensively described by
           (Nederhorst den Berg), which gradually became covered by                               Castel (1991), Koster et al. (1993), and Van Mourik et al. (1988
           peat as a result of sea level rise during the Atlantic. However,                       and 1995). AMS 14C dating solved some of these problems,
           it is not clear whether this was a local phenomenon, linked to                         allowing for dating of specific plant remains. However, such
           the deteriorating drainage of the area concerned (i.e. a wet                           remains (e.g. seeds) are largely limited to peat layers and
           heath), or a more regional phenomenon. The chronology for                              intercalated peat layers are truly rare in the predominantly dry
           the various archaeological cultures is after Louwe Kooijmans et                        drift sands, thus hampering improved radiocarbon dating of
           al. (2005).                                                                            phases. Early attempts to date aeolian deposits by thermolumi-
                                                                                                  nescence (Dijkmans et al., 1988 and 1992; Dijkmans & Wintle,
                 Drift sands                                                                      1991) were fraught with uncertainties and apparently resulted
                                                                                                  in an underestimation of ages by 20-40%, when compared with
           Extensive reviews on the origin and development of inland                              existing radiocarbon chronology. Moreover, these early attempts
           drift sands in the Netherlands are by Koster (2005b), Riksen et                        largely concerned the dating of cover sands (Koster 2005a;
           al. (2006) and Koster (2009), while recently Fanta & Siepel                            Wallinga et al., 2007). Recent relevant OSL studies concern
           (2010) published a multi-authored book on ‘Inland drift sand                           coastal dune sites in the Netherlands and adjacent countries
           landscapes’ that contains several contributions on the topic.                          (Radtke, 1998; Strickertsson & Murray, 1999; Murray &
           Studies on the drift sands of the LWM area and in fact the                             Clemmensen, 2001; Ballarini et al., 2003; Bateman & Godby,
           whole ‘het Gooi’ do not exist, but it is generally assumed that                        2004; Madsen et.al., 2007; Cunningham et al., 2011), and a few
           the genesis and characteristics of these sands conform to the                          inland dune sites (Hilgers et al., 2001; Schilder et al., 2006;
           overall trend in the Netherlands (e.g. Koopman et al., 2010).                          Hilgers, 2007; Van Mourik et al., 2010; Derese et al., 2010;
           Relevant information from the above reviews is summarised                              Tolksdorf & Kaiser, 2012; Willemse & Groenewoudt 2012).
           below. For the terminology used we refer to Koster (1982),                                OSL results for the inland dunes confirmed that most 14C
           while the lithostratigraphic subdivision of the cover sand is                          datings of soil organic matter from drift sand are indeed
           according to van der Hammen et al. (1967).                                             unreliable and shed doubt on the earlier published ages of drift
              In the Netherlands, inland drift sand areas formed largely as                       sands and drift sand phases. Moreover, the OSL datings show
           a result of anthropogenic degradation of podzols, developed in                         that in the Netherlands and Germany, in addition to the ‘classic’
           Pleistocene cover sands. Minor source areas were river dunes                           medieval and later drift sands, older drift sands occur that even
           along the Rhine-Meuse system and smaller rivers in the east of                         date back to prehistoric times. Van Beek (2009) and Willemse
           the Netherlands (e.g. Overijsselse Vecht and Dinkel). The bulk                         & Groenewoudt (2012), for example, documented anthropogenic
           of the drift sands is assumed to result from serious agricultural                      drift sands from the Netherlands that date from the Neolithic
           overexploitation, which started during the early Late Middle                           to Late Iron Age and are fairly common in river dune areas in
           Ages (e.g. Castel et al., 1989; Spek, 2004; Heidinga, 2010; Koster,                    the east of the Netherlands. In their regional study, Tolksdorf
           2010), when agriculture massively expanded in hitherto ‘waste                          & Kaiser (2012) convincingly demonstrated that aeolian
           lands’ with fragile sandy soils. Drift sands reached their zenith                      activity continued after the end of the Early Dryas up to the
           by the late 19th century, when land pressure was such that                             Mid-Atlantic (cf. 4,500 BC) throughout North-West Europe,
           farmers were forced to exploit heathlands to the maximum. At                           though at a more local scale than the well-known medieval and
           that time, active drift sand covered about 950 km2 (Koster, 2010).                     post-medieval drift sands. From the Late Neolithic onward,
           The degradation virtually stopped when fertilizers became                              aeolian sedimentation repeatedly occurred and was linked to
           available at a large scale and the ‘waste lands’ were reclaimed                        periods of increased human impact. Similar results were found
           for agriculture or were afforested with Scots Pine. Nowadays,                          in England (Bateman & Godby, 2004). In conclusion, there is an
           active inland drift sand is scarce and disappearing as a result of                     increasing recent body of evidence for early drift sands in the
           ongoing vegetation succession (e.g. Fanta & Siepel, 2010;                              Netherlands, though predominantly from river dune areas
           Sparrius, 2011). Drift sands thus were typically linked to                             where sources of ‘fresh sand’ were nearby.
           agricultural overexploitation, though some researchers stress                             While drift sands are typically composed of well-sorted
           the role of wind erosion during periods of adverse climatic                            quartzitic sands, they exhibit a range in facies types and

              246
Downloaded from https://www.cambridge.org/core. IP address: 46.4.80.155, on 16 Aug 2021 at 01:51:21, subject to the Cambridge Core terms of use, available at https://www.cambridge.org/core/terms
. https://doi.org/10.1017/S0016774600000196
Netherlands Journal of Geosciences — Geologie en Mijnbouw                             92 – 4 | 2013

           associated structures. Thus, Koster (1988, 2005b), following                           thus the presence of a podzol alone cannot be used as decisive
           studies by Schwan (1986, 1988) and Ruegg (1983), distinguished                         argument for the age – Holocene or Pleistocene – of the sand
           a series of facies types on the basis of primary sedimentary                           in which it formed (e.g. Sevink et al., 1970; Koster, 1982;
           structures, indicative of tractional or grainfall deposition. In                       Van Mourik et al., 1995). It should be emphasised that such
           summary, these included: a) structures representing completely                         problematic field identification is largely restricted to profiles
           dry aeolian transport and accumulation; b) structures reflecting                       observed in isolated pits and small exposures. In large sections,
           moist to wet aeolian sedimentary conditions; and c) structures                         such as encountered in the LWM area, stratigraphic relations
           indicating aeolian-lacustrine conditions to conditions of low or                       are far less problematic and can generally be established
           high energy running water in aeolian settings. The structures                          unambiguously (see also Koster, 1982).
           involved vary from a) evenly laminated, (sub)horizontal                                   Samples were taken for soil chemical analyses to characterise
           lamination or slightly undulated lamination, dune-foreset                              the podzolic paleosols, for radiocarbon dating (incidental), and
           cross-bedding, granule ripples and deflation horizons, to b)                           for grain-size analyses. From all major profiles, large monoliths
           ‘layer-cake’ alternating sand and silt layers, wavy and crinkly                        were taken for additional studies, particularly the identifi-
           laminae, adhesion lamination and small-scale low-angle cross-                          cation of pollen and other palynomorphs, and smaller monoliths
           lamination, and to c) ripple cross-lamination, scour and fill                          in opaque PVC tubes for OSL dating. Lastly, large plastic peel
           structures and large-scale trough cross-bedding.                                       monoliths were made of all profiles for description of
               Drift sands (and cover sands) also display a wide range of                         sedimentologial features and facies types following Koster
           (secondary) syn- and post-depositional deformation structures                          (1988, 2005b).
           (Pye & Tsoar, 1990). Amongst these load structures are particu-
           larly relevant, since these were widely encountered in the drift                             Laboratory methods
           sands of the LWM-area. Load structures (Reineck & Singh,
           1980) are commonly found in shallow-water environments,                                Soil chemical analyses aimed at characterising (the extent of
           where wet surficial conditions are occasionally interrupted by                         podzolisation in) the main paleosols. EC25 was estimated in a
           sand deposition. Naturally, these conditions preferentially                            demineralised H2O extract (w/v: 1 : 2.5) in which subsequently
           occur on relatively flat aeolian surfaces and interdune areas                          soil pH was measured with a glass electrode. Soil pH was also
           under the effect of temporary heavy rainfall or a high                                 measured in a 0.01 M CaCl2 soil solution (w/v: 1 : 2.5). Total
           groundwater level. More or less similar features may develop                           carbon (C) and nitrogen (N) were measured with a VarioEL
           by the filling of scour marks by flowing water.                                        (Elementar) CNS auto-analyser. C equals organic carbon, since
                                                                                                  carbonates were absent. LOI375 was estimated by heating
                      Methods                                                                     oven-dry soil to 375° C for 16 hours. Sodium pyrophosphate
                                                                                                  extractable Al, Fe and Si (Alp, Fep and Sip) were determined in
                 Field methods                                                                    field-moist samples (fine earth fraction), while dithionite-citrate
                                                                                                  extractable Fe and Al (Fed, Ald) were determined in ground and
           For the area as a whole, a detailed GPS-based topographic survey                       dried samples (Van Reeuwijk, 2002).
           with several thousand points (x, y and z coordinates) was                                  According to Van Reeuwijk (2002) sodium pyrophosphate
           available, through which topographic features were recorded.                           extracts Fe and Al that is associated with organic matter from
           Numerous observations in ditches, trenches, and other exposures                        soils. It dissolves amorphous inorganic oxides only slightly and
           provided a detailed insight into the geological structure of the                       silicate minerals and crystalline Fe and Al oxides are not attacked
           area and allowed for the selection of representative profiles in                       to a significant extent, while dithionite/citrate extracts both
           which the complex history was well recorded. Profiles were                             crystalline and non-crystalline compounds. Ratios of Fep /Fed
           described using the FAO guidelines for soil profile description                        etc. thus provide an indication for the extent to which Fe and
           and sampled for further studies. X/Y/Z coordinates were based                          Al occur in complexed form in the soil and of their illuvial
           on the detailed topographic survey and checked by additional                           accumulation.
           GPS measurements. Lateral relations between layers and horizons                            Grain-size distributions were established, after pretreatment
           observed in these profiles were established through observations                       of samples by H2O2 and HCl, and wet sieving over a 63 μm sieve,
           in existing ditches and trenches, or by hand digging additional                        by dry sieving the fraction >63 μm (5 subfractions), and by
           pits/profiles.                                                                         sedimentation and pipetting of the fraction
Netherlands Journal of Geosciences — Geologie en Mijnbouw                             92 – 4 | 2013

           Table 1. Grain-size distributions of cover sands (LWM III and V: 100-105               may be complicated by the eventual presence of older pollen
           cm) and drift sands (LWM III 30-35 cm and LWM V 25-30 cm). Geometric                   that was deposited at the sampling site together with the
           parameter values according to the method of Folk & Ward (1957).                        accumulating sand, such as in case that the aeolian material is
                                                                                                  reworked from older pollen bearing strata or soils (e.g. Van
           Profile                      LWM III                        LWM V                      Mourik, 2003, Van Mourik et al., 2011). In summary, most
           Depth                        30-35       100-105            25-30       100-105        indicative for the contemporary site conditions is pollen in the
           Median (D50 - μm)            179.8       176.4              167.9       172.1          (former) topsoils, e.g. Ah horizons, while in lower soil horizons
           Mean (x - μm)                180.7       176.9              168.1       173.4          with low pollen content the origin and age of the pollen
           Sorting ( )                  1.623       1.456              1.452       1.578          assemblage is rather uncertain.
           Skewness (Sk)                –0.004      0.021              0.033       0.015             AMS radiocarbon dating was carried out at the Centre for
           Kurtosis (K)                 1.091       1.089              1.166       1.109          Isotope Research of Groningen University. The result is reported
                                                                                                  in conventional Radiocarbon years, which includes correction
                                                                                                  for isotopic fractionation using the stable isotope ratio ∂13C,
           2005b, see Table 2) and standard statistical grain-size parameters                     and usage of the conventional half-life (Mook & Van der Plicht,
           are according to Folk and Ward (1957).                                                 1999). For calibration into calendar age the recommended
              For pollen analysis, sub-samples of ca 1 cc were treated with                       calibration curve intcal09 (Reimer et al., 2009) was used. The
           KOH and subsequently acetolysed according to Faegri & Iversen                          14C date is reported in y cal BC (Table 3).

           (1989). For the separation of organic material from mineral
           particles, a bromoform-ethanol mixture (specific gravity 2) was                              OSL dating
           used. The microfossils were embedded in glycerine jelly and
           microscope slides were sealed with paraffin. Pollen was identified                     Optically Stimulated Luminescence dating (OSL) was used to
           using Beug (2004), Moore et al. (1991) and a pollen reference                          determine the time of deposition and burial of the deposits.
           collection.                                                                            Analysis was performed at the Netherlands Centre of
              In podzols, the complex interaction over time between                               Luminescence dating (NCL) of the Delft University of
           acidification/podzolisation and bioturbation results in a                              Technology. For a general description of the OSL dating
           characteristic distribution of pollen with depth (Dimbleby, 1985).                     method, we refer to Wintle (2008). The OSL samples were
           Taxa dominating the lower soil horizons indicate vegetation                            collected in opaque PVC tubes. Material from the outer ends
           types that previously occupied the land, while those in the                            was light-exposed during sampling and was used for dose rate
           original topsoil reflect the vegetation immediately prior to the                       estimation, whereas luminescence measurements were
           burial of the soil, such as by younger drift sand. This pattern                        performed on material from inside the tubes.
                                                                                                     For the dose rate calculation methods, we refer to Wallinga
           Table 2. Sedimentary structure of section LWM III. For the units distinguished,        and Bos (2010). To account for the effect of soil moisture on
           see Fig. 7.                                                                            the dose rate, we used the measured water content (% weight
                                                                                                  of water / weight of dried sediment) with a minimum of 10%
           Unit Description                                                                       for lacustrine samples and 5% for aeolian samples. In all cases
           1       More or less structureless sand with abundant root structures,                 a relative uncertainty of 25% was attributed to account for
                   the lower 5-7 cm of this unit shows distinct deformation by                    moisture content variations in the past. Contributions of cosmic
                   scour and fill structures and convolute bedding                                rays to the dose rate were included based on Prescott and
           2       Distinct, even parallel horizontal lamination, only the                        Hutton (1994). Depending on the local stratigraphy we assumed
                   lowermost few centimetres shows small-scale, low-angle                         immediate burial to present depth or gradual burial.
                   cross-lamination                                                                  Equivalent-dose measurements were performed on quartz
           3       Partly structureless, partly strongly deformed lamination due                  grains of 180-212 μm, mounted on 3-mm aliquots. The Single-
                   to scour and fill structures and convolute bedding, erosive                    Aliquot Regenerative dose procedure (Murray & Wintle, 2003)
                   lower boundary                                                                 was used for equivalent dose estimation. Based on preheat-
           4       Fine-grained sand layer with relatively high organic matter                    plateau tests, we selected a preheat of 220° C for 10 s; for the
                   content, strongly deformed by (secondary) load casting                         three youngest samples a 200° C preheat was used to avoid
           5       Cover sand with indistinct structures due to soil formation                    thermal transfer effects. In all cases heating after the testdose
           6       Wavy parallel lamination with fine scour and fill structures,                  (cutheat, 0 s) was to the same temperature as for the preheat.
                   especially at the top, and occasionally small-scale                            To maximise the contribution of the fast OSL component to the
                   cross-lamination                                                               signal, early background subtraction was used (Ballarini et al.,
           7       Strongly deformed wavy parallel lamination with scour and fill                 2007; Cunningham & Wallinga, 2010). The net OSL signal used
                   structures and small-scale cross-lamination, possibly small-scale              for analysis comprised of the OSL signal measured during the first
                   frost cracks and fine adhesion structures                                      0.8 s of stimulation, minus the signal during the subsequent

               248
Downloaded from https://www.cambridge.org/core. IP address: 46.4.80.155, on 16 Aug 2021 at 01:51:21, subject to the Cambridge Core terms of use, available at https://www.cambridge.org/core/terms
. https://doi.org/10.1017/S0016774600000196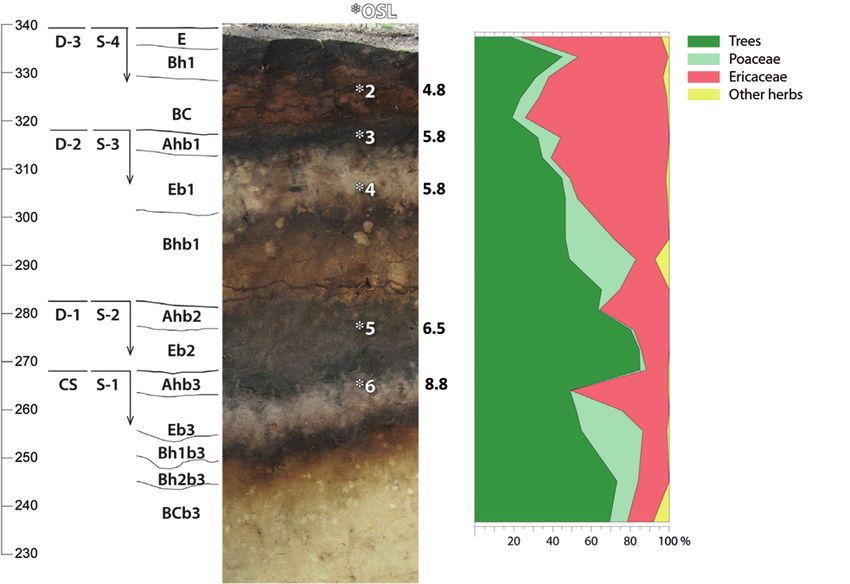
Netherlands Journal of Geosciences — Geologie en Mijnbouw                             92 – 4 | 2013

           0.8 s. After each SAR cycle, a 40 s high-temperature bleach                            estimates deviating more than three standard deviations from
           with blue diodes is performed at 20° C above the preheat                               the sample mean were removed prior to further analysis.
           temperature to avoid build-up of charge in traps that are not                             Three young samples (LWM VI-15 and -16, LWM VII-18)
           light sensitive. Single-aliquot equivalent-dose estimations                            showed high overdispersion (>35%) and skewed equivalent dose
           were accepted if recycling was within 10% from unity, response                         distributions. This scatter is attributed to incomplete resetting
           to a zero dose was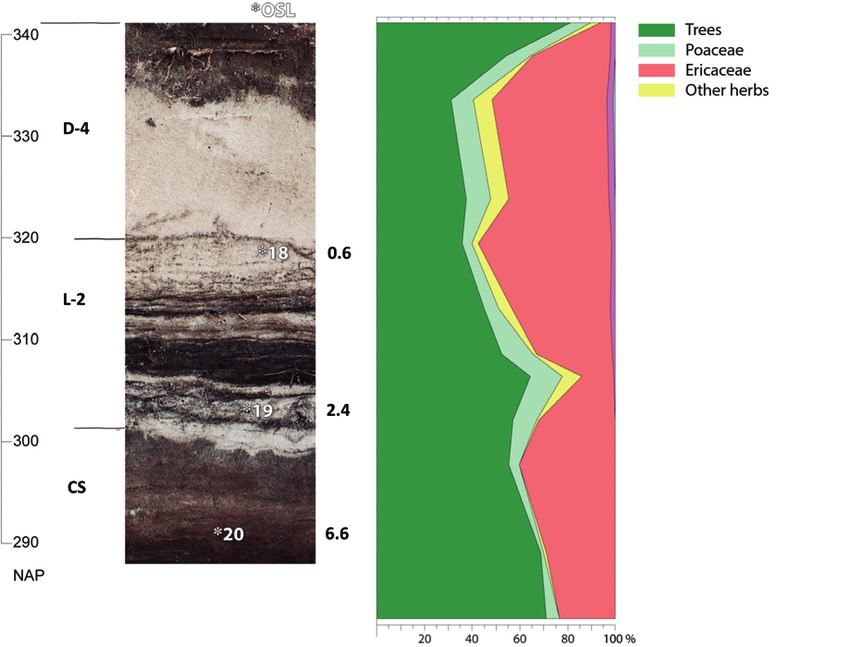
Netherlands Journal of Geosciences — Geologie en Mijnbouw                             92 – 4 | 2013

              OSL ages were calculated by dividing the sample burial dose                              Distinction could be made between a) the central area with
           by the dose rate and are expressed in ka relative to the year of                        a complex stratigraphy (the Vuilwaterplas area), b) the Groot
           sampling, which was 2008 (Table 3). Quoted uncertainties                                Wasmeer and particularly its southeastern border area with
           contain random and systematic errors in both the dose rate and                          complex deposits, and c) the northern and eastern areas with a
           burial dose assessment, and reflect the 1-sigma confidence                              simpler stratigraphy (the Langewater area). General charac-
           interval.                                                                               teristics of the three sub-areas are described first, followed by
                                                                                                   the profiles studied in more detail. Phases in soil formation and
                      Results                                                                      sedimentation, indicated in the sections (see e.g. Fig. 2a and b)
                                                                                                   were distinguished in the field. They are indicated with the
                 General observations                                                              character D and a numerical suffix in the case of drift sand
                                                                                                   phases, or the letter L with similar suffix for ‘lacustrine’ phases
           In Fig. 1 an overview of the area is shown, while cross-sections                        (i.e. phases of temporarily or permanently open water due to a
           with profiles that were studied in detail are given in Fig. 2a                          high groundwater level or to stagnation on an impervious
           and 2b.                                                                                 layer). A ‘lacustrine phase’ is evidenced by the occurrence of
               In the field, cover sand – most probably Younger Cover Sand                         such phenomena as load casting, strongly bleached sand as
           II, deposited during the Younger Dryas – could be easily distin-                        encountered in fens and similar acid lakes (see e.g. Fig. 1e), or
           guished from drift sand, the boundary being marked by the                               peat layers. Phases of soil formation are indicated with the
           presence of an earliest paleosol, which considering its habitus                         character S and a suffix. ‘Recent drift sand’ was identified as
           – distinct podzolisation – must be of Holocene age and could                            such by the very limited development of its soil, which consisted
           be traced over large areas. The various profiles presented in                           of a litter layer over an Ah or AEh horizon, and lacked an E or
           Fig. 2a and 2b exemplify this. As to the area as a whole,                               B horizon.
           deflation seemed to have been of minor importance and drift
           sands accumulated in particular in the NE, partly in the form of                        Central area
           a more or less continuous sheet and some more isolated dunes.
           Evidently, the absence of a clear erosional hiatus at the base of                       Complex drift sand profiles were particularly encountered in
           the drift sand(s) enhanced the identification of the stratigraphic                      the Vuilwaterplas and its NE-border zone, with a rather
           boundary between the Pleistocene and Holocene aeolian sands.                            prominent aeolian relief. The Pleistocene cover sand had an
           At the same time, this absence evidenced that the source areas                          undulating surface, with a shallow large depression of which
           of drift sand most probably were situated to the southwest,                             the lowest part was at around 215 cm +NAP near LWM III (see
           outside the LWM area.                                                                   Fig. 1d and Fig. 2b). Over most of the area, drift sands covered

           Table 3. OSL ages and 14C age. OSL ages are in ka relative to year of sampling (2008).

           Sample            Equivalent dose (Gy) Dose rate (Gy/ka) Age (ka)                (syst.) (rand.) Age (AD)                  OD (%)         Age Model Validity
           LWM-II-2           5.03±0.17                 1.04±0.03               4.8±0.2     0.17       0.15                           14.5           CAM            OK
           LWM-II-3           5.45±0.28                 0.94±0.03               5.8±0.3     0.20       0.27                           22.0           CAM            Questionable
           LWM-II-4           6.01±0.21                 1.03±0.03               5.8±0.3     0.20       0.18                           12.7           CAM            OK
           LWM-II-5           6.06±0.26                 0.94±0.03               6.5±0.4     0.22       0.27                           19.9           CAM            OK
           LWM-II-6           8.36±0.24                 0.95±0.03               8.8±0.4     0.31       0.23                           13.3           CAM            OK
           LWM-V-27           5.23±0.18                 0.99±0.03               5.3±0.2     0.18       0.14                           15.0           CAM            OK
           LWM-V-28           6.26±0.23                 0.98±0.03               6.4±0.3     0.21       0.20                           14.1           CAM            OK
           LWM-III-9          4.88±0.19                 0.93±0.03               5.2±0.3     0.19       0.18                           15.7           CAM            OK
           LWM-III-10         4.73±0.17                 0.95±0.03               5.0±0.2     0.18       0.16                           14.3           CAM            OK
           LWM-III-11         4.93±0.16                 0.98±0.03               5.0±0.2     0.18       0.14                           14.0           CAM            OK
           LWM-III-12         4.75±0.19                 0.84±0.03               5.7±0.3     0.22       0.20                           15.8           CAM            OK
           LWM-III-13       10.01±0.46                  0.88±0.03              11.4±0.7     0.48       0.50                           26.0           CAM            Questionable
           LWM-VI-15          0.11±0.02                 0.70±0.03              0.16±0.03 0.007         0.032       1843±32            39.5           MAM3           Likely OK
           LWM-VI-16          0.12±0.01                 0.65±0.03              0.19±0.02 0.009         0.020       1820±22            37.7           MAM3           Likely OK
           LWM-VII-18         0.57±0.04                 0.92±0.03              0.62±0.04 0.022         0.038       1391±44            42.1           MAM3           Questionable
           LWM-VII-19         1.85±0.07                 0.78±0.03               2.4±0.1     0.09       0.08                           16.0           CAM            Likely OK
           LWM-VII-20         5.67±0.21                 0.86±0.04               6.6±0.4     0.29       0.23                           16.6           CAM            OK
                             Groningen number                                                                      Age in y cal BC
           LWM-VII           GrA-47532                                                                                20±40

              250
Downloaded from https://www.cambridge.org/core. IP address: 46.4.80.155, on 16 Aug 2021 at 01:51:21, subject to the Cambridge Core terms of use, available at https://www.cambridge.org/core/terms
. https://doi.org/10.1017/S0016774600000196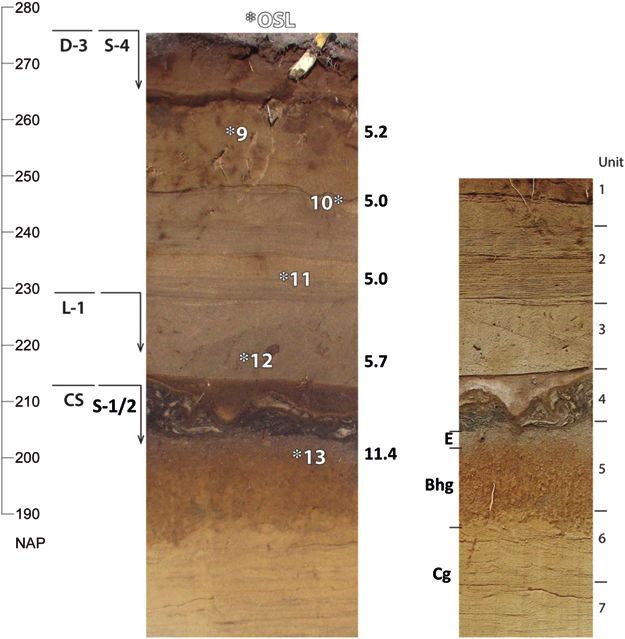
Netherlands Journal of Geosciences — Geologie en Mijnbouw 92 – 4 | 2013
this surface. The modern land surface exhibited a prominent in cover sand (presumably Younger Cover Sand II) that repre-
podzol, in places with abundant cart tracks (see Fig. 1h). Recent sented the combined S-1, S-2 and S-3 soil phases, covered by
drift sand was absent. drift sand (D-3) with the prominent podzol of S-4. This sequence
The most complex profiles occurred in between LWM IV and was very prominent in the NE-SW running ridge between the
V to the NE of the depression. Three drift sand layers were found former Vuilwaterplas and the Groot Wasmeer, which showed
on top of the cover sand, with four soil phases (see e.g. LWM II). abundant cart tracks, as well as to the N of the Vuilwaterplas
The first two drift sand phases (D-1 and -2) were of limited (see e.g. Fig. 1h).
dimensions, while the third (D-3) was widespread and covered
most of the central area. In the latter drift sand, a prominent The Groot Wasmeer and its southern border
and highly characteristic podzol with a thick stagnative spodic
B had formed (S-4). Further NE, the soil phases S-1, S-2 and, In the central part of the Groot Wasmeer, a single soil occurred
eventually, S-3 graded into one single phase, represented by a with a thick (more than 50 cm) very compact brown hydromorphic
distinct and thick Ah/E/Bh sequence in cover sand (see e.g. spodic B horizon overlain by a layer of bleached, white sand
Fig. 2b). (reworked albic material, see Fig. 1e) with abundant load
In the large depression, the soil phases S-1, S-2, and S-3 casting features, well visible in both horizontal and vertical
could not be separated, and graded into a single soil in cover sections, particularly in the northeastern border zone. Along
sand. Based on the observed lateral relations (see e.g. Fig. 2a), its southeastern border, the stagnative podzol was very well
the drift sand covering the soil dates from phase D-3, but in its preserved, with a thick albic horizon and highly stagnative
lower part evidently had been deposited in an aquatic spodic B horizon. A complex of well-stratified bleached, white
environment (phase L-1, see Fig. 7). The buried soil could be sands with common thin peaty intercalations covered the podzol
traced over large distances (see e.g. Fig. 1d and Fig. 11) and (see Figs 3b, 5a and 11). This peat at least partially consisted of
was a hydromorphic incipient podzol with weakly developed E well-identifiable plant remains, allowing for radiocarbon
and Bhs horizons (e.g. LWM IV). In the lowest parts of the dating by AMS (see datings, Table 3). Remarkable was the
depression, the surface layers of this podzol had been strongly pronounced load casting in the upper part of the albic E and
disturbed by later load coasting (see Fig. 13) in most probably overlying white sandy complex, which in combination with the
shallow open water (see LWM III), but originally these surface occurrence of peaty layers testified to the lacustrine origin of
layers were highly organic (more or less peaty). Lateral, at these sands (phase L-2). Examples of this load casting are
slightly higher altitude, i.e. about 250 cm +NAP, the soil lacked given in Fig. 3b. The lake formed by stagnation on the dense
the prominent load casting features as well as the peaty spodic B horizon. Upward, the stratified bleached sand graded
surface layer (e.g. LWM IV), but its pedogenic features were into yellowish drift sand (phase D-4) that extended in the form
rather invariable (incipient hydromorphic podzol). of large dunes to the south and east. These dunes are known to
Both to the south and the north, the sequence was less have been active drift sand till the early twentieth century.
complex, being generally composed of a well-developed podzol
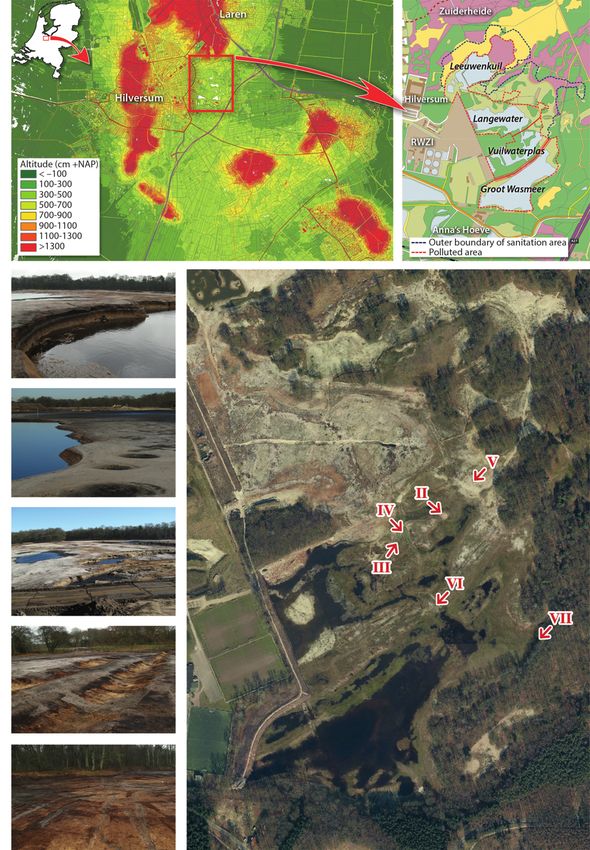
Fig. 3. Former southern border of the Groot Wasmeer: a. podzol (CS), covered by stratified bleached sands and peat (L-2), with on top yellowish recent
drift sand (D-4); b. detail with load casting phenomena.
a. b.
251
Downloaded from https://www.cambridge.org/core. IP address: 46.4.80.155, on 16 Aug 2021 at 01:51:21, subject to the Cambridge Core terms of use, available at https://www.cambridge.org/core/terms
. https://doi.org/10.1017/S0016774600000196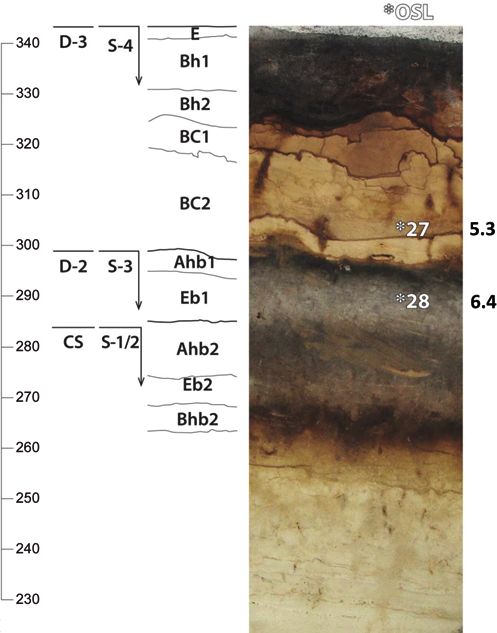
Netherlands Journal of Geosciences — Geologie en Mijnbouw                             92 – 4 | 2013

              The highest altitude reached by the white sands complex                             Distinction between cover sand and drift sand
           with prominent load coasting was about 320 to 325 cm +NAP,
           an altitude which could be traced all along the border of the                          The field distinction between cover sand and drift sand was
           Groot Wasmeer and is just about 10-20 cm below the original                            confirmed by the OSL and pollen data (see further on), though in
           top of the ridge that separated the Groot Wasmeer from the                             some cases superficial aeolian reworking of the upper horizons
           Vuilwaterplas (see Fig. 1b). The white sands clearly mark the                          (Ah and E) of the podzol in the top of the cover sand could be
           highest lake level at the time of their deposition and were only                       observed (e.g. profile Groot Wasmeer, Fig. 9). In the field,
           observed in the Groot Wasmeer area. In the N and E, cart tracks                        systematic differences in grain size between cover sand and
           ran through the top of the bleached sands complex and in places                        drift sand were not observed. Grain-size distribution of several
           exhibited clear contemporary load casting, testifying that these                       drift and cover sand samples (see Table 1) were compared to
           carts had been driven through shallow water (see Fig. 1h).                             check potential differences.
                                                                                                      The drift and cover sands show remarkably small differences
           The north and east                                                                     in grain-size distribution. The grain-size fraction 150-210 μm
                                                                                                  is by far dominant and reaches weight percentages of 33-42%.
           In this part of the area, the aeolian relief was less pronounced                       The fraction
Netherlands Journal of Geosciences — Geologie en Mijnbouw 92 – 4 | 2013
Profiles studied evidenced by the marked illuvial concentration of Al, Fe and C
(Fep, Alp and C) in the Bh horizons, as compared to the low
The central area (Fig. 3a) values for these compounds in the E horizon (Table 5). Overall
Fe losses due to leaching are also very distinct in the Fed
LWM II is the most complex profile with 4 soil phases and 3 values, while the characteristic accumulation of illuvial Al in
drift sand phases (see Fig. 5). The pollen analysis shows that the Bh horizon of Podzols clearly shows up in both Alp and Ald
over time considerable variation occurred in the composition values (see e.g. Buurman, 1985; Lundström et al., 2000).
of the vegetation. The overall picture for phase S-1 is one of LWM III is from the centre of the depression (see Fig. 7).
rather open moist/wet heathland vegetation, following on an Here, the upper horizons of the soil S-1, which is developed in
early Pinus and Corylus dominated wet phase, which probably cover sand, exhibit marked load casting. This soil, which is an
dates back to the Boreal considering the pollen spectra (Van incipient podzol and has a non-stagnant Bh horizon with
Geel et al., 1981). It is during this phase S-1 that an incipient abundant biopores, is covered by drift sand that because of its
hydromorphic podzol was formed. Later soil and drift sand lateral extension towards LWM II must largely date from phase
phases all show a large component of Ericales and Poaceae D-3, resting on drift sand that was deposited in open water
indicative for the presence of heathland, in combination with (phase L-1) and is slightly older (see OSL dating). In this drift
Alnus and declining Corylus. Overall, from S-2 to S-4/D1-D3, sand a strongly developed Podzol (S-4) has formed, extending
Ericales increase, while the erstwhile dominant Corylus gradually from the surface of D-3 downward. Humic substances connected
decreases to very low values in S-4/D-3. Alnus, first appearing with S-4 migrated into D-3, accumulating as dark brown fibres
in significant quantities in S-2/D-1, remains more or less stable and, on top of S-1, as a dense brownish layer. In Table 2 a more
at about 20%. Phase S-3 is marked by clear podzolisation, which extensive description of the sedimentary structures is presented,
however does not reach the intensity of phase 4. with 7 units or sets being distinguished in the plastic peel
LWM V (Fig. 6) is less complex than LWM II. The soil in cover monolith (see also Fig. 7b).
sand is well represented but probably includes two phases (S-1 Structures in units 3 and 4 indicate conditions of open water
and S-2) and is covered with a thin layer of drift sand (D2) in during or soon after accumulation. The lower unit in cover sand
which a distinct Ah and albic E has formed (S-3). The Ah is (7) also reflects some influence of water during or soon after
overlain by a thick sheet of drift sand (D-3) in which a prominent deposition, but on a very minor scale compared to the above-
podzol has developed (S-4). The prominent development is mentioned units. Unit 2 typifies dry aeolian accumulation,
Fig. 5. Section LWM II. Left:
soil horizons, soils (S) and
aeolian phases (D). CS = cover
sand; * = Location and age of
OSL samples. Right: Pollen
diagram with percentages of
major plant groups (trees,
poaceae, ericaceae and other
herbs).
253
Downloaded from https://www.cambridge.org/core. IP address: 46.4.80.155, on 16 Aug 2021 at 01:51:21, subject to the Cambridge Core terms of use, available at https://www.cambridge.org/core/terms
. https://doi.org/10.1017/S0016774600000196Netherlands Journal of Geosciences — Geologie en Mijnbouw 92 – 4 | 2013
Table 4. Analytical data on profile LWM IV: a. chemical data; b. grain-size distributions.
a.
Horizon cm pH H2O pH CaCl2 EC Fe2O3-p Al2O3-p Fe2O3-d Al2O3-d C N C/N
(µS/cm) (mmol/kg) (mmol/kg) (mmol/kg) (mmol/kg)
Ah 0-8 6.29 5.81 229 0.088 32.3 0.37 35.8 2.61 0.112 23.3
E 8-13 6.40 5.86 127 0.287 13.9 0.45 15.0 0.89 0.041 21.6
Bh1 13-18 6.44 5.91 145 0.297 16.3 1.21 19.9 0.65 0.032 20.7
Bh2 18-26 6.29 5.96 171 0.339 14.6 1.45 19.7 0.44 0.023 19.3
Cg >26 6.29 5.93 186 0.305 6.40 3.32 20.1 0.08 0.006 17.6
b.
Horizon Ah E Bh1 Bh2 Cg LWM IV is close to LWM III and with an identical sedimentary
cm 0-8 8-13 13-18 18-26 >26 sequence (D-3 with S-4 in its top), but at slightly higher altitude,
2,000-1,000 μm 0.0 0.0 0.1 0.0 0.1 lacking the distinct load casting (and thus also phase L-1) (
1,000-500 μm 0.8 0.4 0.7 1.0 0.4 Fig. 8). The composition of the pollen assemblage in the cover
500-250 μm 20.2 20.0 17.0 15.2 12.5 sand (with S-1/3) is quite uniform, with only a slight decline of
250-125 μm 59.5 67.5 63.6 57.7 69.7 tree pollen and increase of Ericales in the upper centimetres of
125-63 μm 12.6 10.2 13.9 17.2 15.5 the Ah horizon. Alnus and Corylus and to a lesser extent UlmusNetherlands Journal of Geosciences — Geologie en Mijnbouw 92 – 4 | 2013
Table 5. Analytical data on profile LWM V: a. chemical data; b. grain-size distributions..
a.
Horizon cm pH H2O pH CaCl2 EC Fe2O3-p Al2O3-p Fe2O3-d Al2O3-d C N C/N
(µS/cm) (mmol/kg) (mmol/kg) (mmol/kg) (mmol/kg)
E 0-3 3.81 2.95 53 0.32 3.6 0.62 4.9 1.30 0.041 31.6
Bh1 3-8 3.68 2.98 80 0.44 17.9 0.71 20.2 2.12 0.066 32.3
Bh2 8-15 3.61 3.09 111 0.61 38.9 0.95 42.2 3.67 0.130 28.3
BC1 15-26 3.84 3.42 57 0.66 15.5 1.59 18.3 0.73 0.022 33.8
BC2 26-42 4.10 3.73 38 0.69 14.9 2.79 19.0 0.47 0.014 34.9
b. The top of the podzol is eroded by water and marked by its
Horizon E Bh1 Bh2 BC1 BC2 extreme contortion, most probably by load casting (see Fig. 3a,
cm 0-3 3-8 8-15 15-26 26-42 b). The structures in the greyish-white sand on top of the
2,000-1,000 μm 0.4 0.4 0.5 0.1 0.0 podzol evidence the deposition of this sand in a lake by large
1,000-500 μm 3.1 5.2 5.2 1.5 2.7 scour and fill structures and contorted layers of re-deposited
500-250 μm 25.3 24.8 29.3 20.5 41.0 peat (load casting), similar to the top of the underlying podzol.
250-125 μm 59.3 58.1 53.5 66.5 49.9 Whether this sand represents drift sand blown into a lake or
125-63 μm 9.9 10.0 10.4 10.7 6.2 sand from the lake bank that was reworked by wave action isNetherlands Journal of Geosciences — Geologie en Mijnbouw 92 – 4 | 2013
Fig. 8. Section LWM IV. Left: soil
horizons, soils (S) and aeolian phases
(D). CS = cover sand. Right: Pollen
diagram with percentages of major
plant groups (trees, poaceae, ericaceae
and other herbs).
Fig. 9. a. Section LWM VII with location and
age of OSL samples, top of podzol in cover sand
(CS), lacustrine deposit (L-2) and drift sand
a. (D-4); b. Pollen diagram with percentages of
major plant groups (trees, poaceae, ericaceae,
b. other herbs, cerealia and Fagopyrum.
256
Downloaded from https://www.cambridge.org/core. IP address: 46.4.80.155, on 16 Aug 2021 at 01:51:21, subject to the Cambridge Core terms of use, available at https://www.cambridge.org/core/terms
. https://doi.org/10.1017/S0016774600000196Netherlands Journal of Geosciences — Geologie en Mijnbouw 92 – 4 | 2013
Evidence for agriculture is evident in these deposits from the composed of a mixture of grains, of which the ‘age’ may have
presence (in low quantities) of pollen of anthropogenic been more or less reset as a result of post-depositional exposure
indicators (weeds and cereal-type plants) like Artemisia, other to light. In case of strong bioturbation, the OSL age may
Asteraceae, Plantago lanceolata, P. major/media, Fagopyrum approach the ‘time of burial’ rather than ‘time of deposition’. If
and Cerealia (among which Secale). only part of the grains were exposed to light due to biotur-
LWM VI is a profile through cart tracks in the ridge that bation, this will result in a mix of grains with different OSL
constitutes the northern border of the Groot Wasmeer. OSL and ages. Such mixing will be reflected by overdispersed dose
pollen samples (see Fig. 10) were taken from these tracks. From distributions (see section ‘OSL dating’).
plastic peel monoliths it became clear that the sandy infill of Although the overdispersion will be damped due to
the tracks was two-phased, the OSL samples being from the latest averaging within the 3-mm aliquots each consisting of about
infill and the pollen samples from both phases (see Fig. 10). 160 grains, additional overdispersion will still be apparent
The podzol (S-4), in which the cart tracks occur, is in drift sand because the OSL signal of each aliquot is dominated by a few
from phase D-3 that rests on cover sand with a podzol (S1-3). grains with large OSL sensitivity. Equivalent-dose distributions
The pollen record indicates a dominance of Ericales (more will also be overdispersed in cases where light exposure was
than 50%) with in addition around 30% tree pollen (most Corylus not sufficient to completely reset the OSL signal in all grains
and Alnus). Pollen of Secale, Fagopyrum and Cannabis pollen prior to deposition and burial. In aeolian depositional environ-
point to contemporary agriculture in the region. ments as studied here, this is expected to be only relevant for
very young deposits, for which remnant doses can be large
Chronostratigraphy compared to the burial dose. For the samples investigated here,
overdispersion values were around 15% for most samples.
OSL dose distribution and dating This overdispersion is attributed to spread inherent to the
measurement procedure (9% overdispersion in dose-recovery
The various phases can be dated on the basis of the OSL experiment), combined with grain-to-grain variations in dose
datings, but these datings need to be handled with care (see rate (for these samples estimated to be ~20% at single-grain
e.g. Van Mourik et al., 2010). In sediment that is not affected level; ~10% for 3-mm aliquots; see Cunningham et al., 2011).
by bioturbation, the OSL age refers to the time elapsed These two error yields in combination yield the observed 15%
since deposition. However, in case of bioturbation a sample is overdispersion. The three youngest samples show much larger
Fig 10. Section LWM VI, with detail of cart track. Left: soil horizons, soils (S) and aeolian phases (D). OSL 15 and 16 are resp. 0.16 and 0.19 ka.
Fig. 11. Well-developed podzol of
phases S-1/3 in cover sand, buried
under drift sand (phase D-3) in
central part of Vuilwaterplas.
257
Downloaded from https://www.cambridge.org/core. IP address: 46.4.80.155, on 16 Aug 2021 at 01:51:21, subject to the Cambridge Core terms of use, available at https://www.cambridge.org/core/terms
. https://doi.org/10.1017/S0016774600000196Netherlands Journal of Geosciences — Geologie en Mijnbouw 92 – 4 | 2013
overdispersion (>35%). This is attributed to incomplete
resetting of the OSL signal in some of the grains, or sampling of
deposits formed in different periods. For these samples a
Minimum Age Model was used to estimate the burial dose of the
youngest phase (Galbraith et al., 1999). Examples of the various
situations encountered are given in Fig. 12.
For the other samples, only three samples showed over-
dispersion greater than 16%. This concerned samples LWM II-3
and -5, and LWM III-13. The latter sample was from near the top
of the cover sand unit (Fig. 7), and likely was close to the
palaeosurface for a very long time. We attribute the over-
dispersion (26%) to incorporation of light-exposed grains
through bioturbation. This may have led to a slight under-
estimation of the actual burial dose and age. Samples LWM II-3
and -5 show a slightly elevated overdispersion (22 and 20%,
respectively). Both samples are taken from weakly developed
Ah horizons, where bioturbation is likely to induce some mixing.
Moreover, the lower sample is obtained from a thin deposit
attributed to drift sand phase D-1. This 10-15 cm deposit is
sandwiched between cover sand and younger drift sand (D-2).
Light-exposed grains may have been transported down to the
sample position due to bioturbation at the time of soil
formation (S-2). On the other hand, bioturbation may have
introduced older grains from below. It is therefore not possible
to judge whether the true depositional age of D-1 may be
slightly younger or older than the OSL age suggests. Thus, the
reported age remains the best estimate and any deviations are
likely small. Sample LWM II-3 is taken from near the boundary
between the drift sands attributed to phases D-2 and -3. The
OSL age is identical to that obtained on the sample below and
hence the effect of bioturbation on the age is apparently
negligible. Sample LWM II-6 is taken from the Ah horizon in
the cover sand soil (S-1). The absence of overdispersion in
combination with the well-developed soil suggests that
bioturbation may have been rather intense. We suggest that
this OSL date is likely to reflect the time of burial of this soil,
rather than the time of deposition of the cover sand.
Lastly, while our original OSL ages were expressed in ka (see
Table 3), relative to time of sampling (2008), we use year BC or
year AD for the phases distinguished on the basis of these OSL
ages, since this allows for easier comparison with ages
published in other studies. Fig. 12. Radial plots (Galbraith, 1990) show the spread in ages obtained
on individual aliquots including their relative error. Uncertainties in
The central area (see Fig. 2a for overview) equivalent dose estimation are included, errors in dose rate are shared by
all aliquots and hence not shown here. Extreme outliers (>3 standard
In LWM III (Fig. 9), the cover sand is OSL dated to 11.4 ± 0.7 ka deviations from sample mean) were iteratively removed prior to analysis;
(Bh horizon). This is in good agreement with other chronological these are shown as open triangles. The blue bar shows the age determined
evidence suggesting that it was deposited at least 11,500 years for the sample; filled points agree with this estimate within errors (2 sigma).
ago (see e.g. Kasse, 2002). The OSL age obtained on the Ah Shown are examples of a sample with normal spread (A = LWM V-27), a
horizon of S-1 in LWM II (8.8±0.4 ka) is interpreted to reflect poorly-bleached sample (B = LWM VII-18) with CAM (green) and MAM3
the age of burial of the soil (see above). This earliest paleosol (blue) age indicated, and a sample expected to be affected by bioturbation
is a hydromorphic, more or less incipient podzol, lacking a dense, (C = LWM III-13). For sample NCL-7408058 a high precision estimate at
prominent illuvial Bh horizon and with well-recognisable former 1.27, 0.01 ka was omitted from the graph to enhance readability.
258
Downloaded from https://www.cambridge.org/core. IP address: 46.4.80.155, on 16 Aug 2021 at 01:51:21, subject to the Cambridge Core terms of use, available at https://www.cambridge.org/core/terms
. https://doi.org/10.1017/S0016774600000196Netherlands Journal of Geosciences — Geologie en Mijnbouw 92 – 4 | 2013
root channels and bio-macropores throughout. That bioturbation The Groot Wasmeer (see Fig. 2b for overview)
was important is also evidenced by the pollen analysis, which
showed that pollen as well as plant macroremains are found Whereas in the central area D-3 is the latest drift sand phase
down to a depth of 25-30 cm below the top of the paleosol. and soil formation prevails from around 3,000 BC onward, the
As to phase D-3, it is clear that this is a major phase as later history of the Groot Wasmeer clearly is more complex.
compared to the phases D-1 and D-2, and involved the deposition LWM VII shows that following on the development of a
of relatively fresh sand (C-material) rather than of reworked pronounced podzol with dense spodic B and thick albic E
soil material (A, E and B horizons). The soil (S-4), developed in horizon, a lake developed through stagnation on this podzol
this drift sand layer, is marked by intense podzolisation and in (phase L-2). Though the lake may already have existed earlier,
its lower horizons still retains sedimentary stratification, it is only after phase D-3 (around 3,000 BC), when the ridge
evidencing a very low degree of bioturbation. Samples from that separated the Groot Wasmeer from the central area
this drift sand are quite uniform in their OSL age (4.8±0.2 to reached its current elevation, that the lake level may have
5.2±0.3 ka) These ages clearly represent the ‘time of deposition’ reached the altitude of about 300 cm +NAP. Such altitude was
and point to a short intensive phase of aeolian deposition needed to flood the border zone of the Groot Wasmeer. The lake
around 3,000 BC. must have reached that altitude somewhere around 400 BC
OSL ages also constrain the timing of phases D-1 and D-2. The (the earliest bleached sand, sample 19) and reached a maximum
top of D-1 in LWM II (Ah horizon) has an OSL age of 6.5±0.4 ka, level of about 325 cm +NAP around 1,400 AD. This leaves a
and in LWM V the sand at the base of D-2 (lower E horizon) has period of at least about 5,500 years (from the early Holocene
an age of 6.4±0.3 ka. The soil phase S-2 is thus constrained till at least 3,000 BC) for the genesis of the podzol in the
to have occurred till at latest about 4,500 BC. Its duration is central lake area and a further 2,500 years for continued
apparently short considering the limited dimensions of the Ah podzolisation in the higher border zone, totalling about 8,000
and E horizon. Other research has also shown that such soil years for podzolisation prior to the installation of lacustrine
may form in several hundred years only (e.g. Van Mourik et al., conditions in this zone and explaining the strong development
2010). The age of D-1, i.e. the deposition of the drift sand in of this podzol. Clearly in the southern border zone (LWM VII)
which S-2 developed, thus can be defined as broadly in between drift sand phases D2 and D3 are absent, given the OSL date of
about 4,500 and 6,500 BC, leaving between 3,000-5,000 for the 6.6 ka (4,600 BC) for the sand of the albic horizon.
soil phase S-1. The OSL dating of the lower sandy lake sediment is confirmed
For the dating of D-2 a similar line of reasoning can be by the radiocarbon dating of the intercalated peat layer. Around
followed. In LWM II, the OSL ages for the upper horizons in this 1,400 AD the lacustrine sediments were covered by terrestrial
D-2 (Ah and E horizon) are 5.8±0.3 ka. In LWM V bioturbation drift sands, evidenced by the yellowish colour of the latter
is less conspicuous and the OSL age (lower part of E horizon) is sands that is due to thin iron coatings, which disappear upon
slightly older (6.4±0.3 ka). Given the ages obtained for D-3 deposition in aquatic conditions. The altitude of this transition
(around 5 ka, see above), this leaves about 1,000 years for soil is about 325 cm + NAP, which is the highest lake level found in
phase S-3, which seems adequate since this podzol is not this Groot Wasmeer area and corresponds with the highest
strongly developed (see LWM II) and was largely formed in drift altitude of the lacustrine deposits to the N. Interestingly, it is
sand with a significant component of material derived from precisely at this altitude and in this transitional zone that cart
podzolised Ah and E horizons. tracks were found with clear load casting and covered by the
In LWM III, phase L-1 is represented by the sands directly recent aeolian sands close to LWM VII. Based on the datings of
overlying S-1, for which an OSL age of 5.7±0.3 ka was obtained. LWM VII these cart tracks can be dated as ca 700 years old, i.e.
They rapidly grade into sands that were deposited during phase from the 14th to 15th century AD. This conforms to the age of
D-3 from about 230cm +NAP. The transition from ‘lacustrine’ the various early roads in this area, including the Oude
(shallow open water) conditions with marked load casting Postweg, which is known to roughly date from that period
during L-1/early phase D-3 to drier conditions later on dates (Groeneveld, 2001).
from about 3,000 BC. Thus, around 3,000 BC the shallow open In LWM VI multiphased cart tracks were visible that are
water in the central depression reached a level of about 230 cm connected with the large complex of cart tracks to the NE and
+NAP. Arguments for truly poorly drained conditions and open E, of which the cart track near LWM VII also forms part. Though
water in this depression were also found in the pollen record of the youngest phase of infill was OSL dated at around 1830 AD,
LWM IV: in the lower samples of LWM IV, at about 250 cm +NAP, the pollen data show that the earlier phases contain hemp and
Lycopodiella inundata occurred, which is characteristic for buckwheat pollen, pointing to an at earliest Late Mediaeval
open, wet sandy habitats and wet heaths (Dorland et al., 2005; formation of the tracks (Bieleman, 1992).
Van der Meijden, 2005). The later drift sands to the S of the Groot Wasmeer clearly
belong to the ‘recent drift sands’ (phase D-4), lacking significant
soil formation. Moreover, the adjacent area to the SW is known
259
Downloaded from https://www.cambridge.org/core. IP address: 46.4.80.155, on 16 Aug 2021 at 01:51:21, subject to the Cambridge Core terms of use, available at https://www.cambridge.org/core/terms
. https://doi.org/10.1017/S0016774600000196You can also read