The Cascade Stage of the Blackout
←
→
Page content transcription
If your browser does not render page correctly, please read the page content below
6. The Cascade Stage of the Blackout
Chapter 5 described how uncorrected problems in            complex that it may be impossible to ever com-
northern Ohio developed to 16:05:57 EDT, the last          pletely prove these or other theories about the
point at which a cascade of line trips could have          fast-moving events of August 14. Final modeling
been averted. However, the Task Force’s investiga-         results will be published by NERC as a technical
tion also sought to understand how and why the             report in several months.
cascade spread and stopped as it did. As detailed
below, the investigation determined the sequence           Why Does a Blackout Cascade?
of events in the cascade, and how and why it
                                                           Major blackouts are rare, and no two blackout sce-
spread, and how it stopped in each general geo-
                                                           narios are the same. The initiating events will
graphic area.
                                                           vary, including human actions or inactions, sys-
Based on the investigation to date, the investiga-         tem topology, and load/generation balances. Other
tion team concludes that the cascade spread                factors that will vary include the distance between
beyond Ohio and caused such a widespread black-            generating stations and major load centers, voltage
out for three principal reasons. First, the loss of the    profiles across the grid, and the types and settings
Sammis-Star 345-kV line in Ohio, following the             of protective relays in use.
loss of other transmission lines and weak voltages         Some wide-area blackouts start with short circuits
within Ohio, triggered many subsequent line trips.         (faults) on several transmission lines in short suc-
Second, many of the key lines which tripped                cession—sometimes resulting from natural causes
between 16:05:57 and 16:10:38 EDT operated on              such as lightning or wind or, as on August 14,
zone 3 impedance relays (or zone 2 relays set to           resulting from inadequate tree management in
operate like zone 3s) which responded to over-             right-of-way areas. A fault causes a high current
loads rather than true faults on the grid. The speed       and low voltage on the line containing the fault. A
at which they tripped spread the reach and accel-          protective relay for that line detects the high cur-
erated the spread of the cascade beyond the Cleve-         rent and low voltage and quickly trips the circuit
land-Akron area. Third, the evidence collected             breakers to isolate that line from the rest of the
indicates that the relay protection settings for the       power system.
transmission lines, generators and under-fre-
quency load-shedding in the northeast may not be           A cascade is a dynamic phenomenon that cannot
entirely appropriate and are certainly not coordi-         be stopped by human intervention once started. It
nated and integrated to reduce the likelihood and          occurs when there is a sequential tripping of
consequences of a cascade—nor were they                    numerous transmission lines and generators in a
intended to do so. These issues are discussed in           widening geographic area. A cascade can be trig-
depth below.                                               gered by just a few initiating events, as was seen
                                                           on August 14. Power swings and voltage fluctua-
This analysis is based on close examination of the         tions caused by these initial events can cause
events in the cascade, supplemented by complex,            other lines to detect high currents and low volt-
detailed mathematical modeling of the electrical           ages that appear to be faults, even if faults do not
phenomena that occurred. At the completion of              actually exist on those other lines. Generators are
this report, the modeling had progressed through           tripped off during a cascade to protect them from
16:10:40 EDT, and was continuing. Thus this                severe power and voltage swings. Protective relay
chapter is informed and validated by modeling              systems work well to protect lines and generators
(explained below) up until that time. Explanations         from damage and to isolate them from the system
after that time reflect the investigation team’s best      under normal and abnormal system conditions.
hypotheses given the available data, and may be
confirmed or modified when the modeling is com-            But when power system operating and design cri-
plete. However, simulation of these events is so           teria are violated because several outages occur

        G U.S.-Canada Power System Outage Task Force G August 14th Blackout: Causes and Recommendations G   73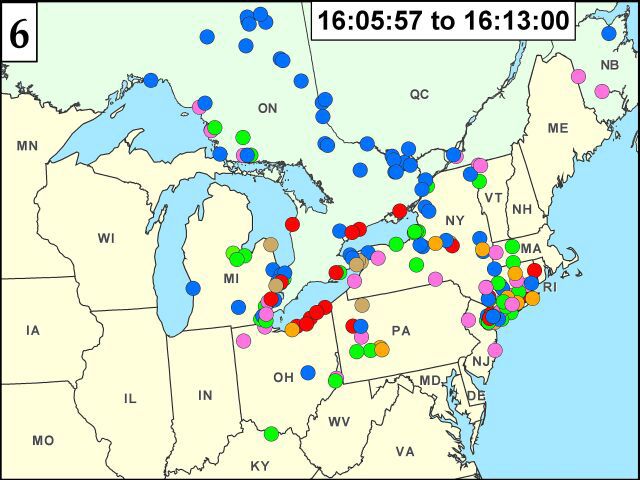
simultaneously, commonly used protective relays            Chapter 5 described the four phases that led to the
that measure low voltage and high current cannot           initiation of the cascade at about 16:06 EDT. After
distinguish between the currents and voltages              16:06 EDT, the cascade evolved in three distinct
seen in a system cascade from those caused by a            phases:
fault. This leads to more and more lines and gener-
                                                           u Phase 5. The collapse of FE’s transmission sys-
ators being tripped, widening the blackout area.
                                                             tem induced unplanned shifts of power across
How Did the Cascade Evolve on                                the region. Shortly before the collapse, large
                                                             (but normal) electricity flows were moving
August 14?
                                                             across FE’s system from generators in the south
A series of line outages in northeast Ohio starting          (Tennessee and Kentucky) and west (Illinois
at 15:05 EDT caused heavy loadings on parallel               and Missouri) to load centers in northern Ohio,
circuits, leading to the trip and lock-out of FE’s           eastern Michigan, and Ontario. A series of lines
Sammis-Star 345-kV line at 16:05:57 Eastern Day-             within northern Ohio tripped under the high
light Time. This was the event that triggered a cas-
cade of interruptions on the high voltage system,          Figure 6.1. Rate of Line and Generator Trips During
causing electrical fluctuations and facility trips         the Cascade
such that within seven minutes the blackout rip-
pled from the Cleveland-Akron area across much
of the northeast United States and Canada. By
16:13 EDT, more than 508 generating units at 265
power plants had been lost, and tens of millions of
people in the United States and Canada were with-
out electric power.
The events in the cascade started relatively
slowly. Figure 6.1 illustrates how the number of
lines and generation lost stayed relatively low dur-
ing the Ohio phase of the blackout, but then
picked up speed after 16:08:59 EDT. The cascade
was complete only three minutes later.

 Impedance Relays
 The most common protective device for trans-                just inside the line or just beyond the line. In
 mission lines is the impedance (Z) relay (also              this case, the zone 2 relay on the far end trips
 known as a distance relay). It detects changes in           the breakers after a short delay, after the zone 1
 currents (I) and voltages (V) to determine the              relay near the fault opens the line on that end
 apparent impedance (Z=V/I) of the line. A relay             first.
 is installed at each end of a transmission line.
                                                           u The third zone is slower acting and looks for
 Each relay is actually three relays within one,
                                                             line faults and faults well beyond the length of
 with each element looking at a particular “zone”
                                                             the line. It can be thought of as a remote relay
 or length of the line being protected.
                                                             or breaker backup, but should not trip the
 u The first zone looks for faults over 80% of the           breakers under typical emergency conditions.
     line next to the relay, with no time delay before
     the trip.                                             An impedance relay operates when the apparent
                                                           impedance, as measured by the current and volt-
 u The second zone is set to look at the entire line       age seen by the relay, falls within any one of the
     and slightly beyond the end of the line with a        operating zones for the appropriate amount of
     slight time delay. The slight delay on the zone       time for that zone. The relay will trip and cause
     2 relay is useful when a fault occurs near one        circuit breakers to operate and isolate the line.
     end of the line. The zone 1 relay near that end       All three relay zone operations protect lines from
     operates quickly to trip the circuit breakers on      faults and may trip from apparent faults caused
     that end. However, the zone 1 relay on the            by large swings in voltages and currents.
     other end may not be able to tell if the fault is

74      G U.S.-Canada Power System Outage Task Force G August 14th Blackout: Causes and Recommendations G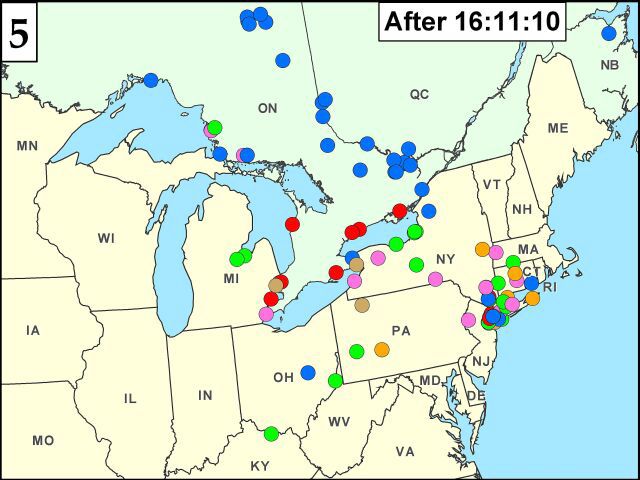
loads, hastened by the impact of Zone 3 imped- Although much of the disturbance area was
ance relays. This caused a series of shifts in fully blacked out in this process, some islands
power flows and loadings, but the grid stabi- were able to reach equilibrium without total
lized after each. loss of service. For example, the island consist-
ing of most of New England and the Maritime
u Phase 6. After 16:10:36 EDT, the power surges
Provinces stabilized and generation and load
resulting from the FE system failures caused
returned to balance. Another island consisted of
lines in neighboring areas to see overloads that
load in western New York and a small portion of
caused impedance relays to operate. The result
Ontario, supported by some New York genera-
was a wave of line trips through western Ohio
tion, the large Beck and Saunders plants in
that separated AEP from FE. Then the line trips
Ontario, and the 765-kV interconnection to
progressed northward into Michigan separating
Québec. This island survived but some other
western and eastern Michigan, causing a power
areas with large load centers within the island
flow reversal within Michigan toward Cleve-
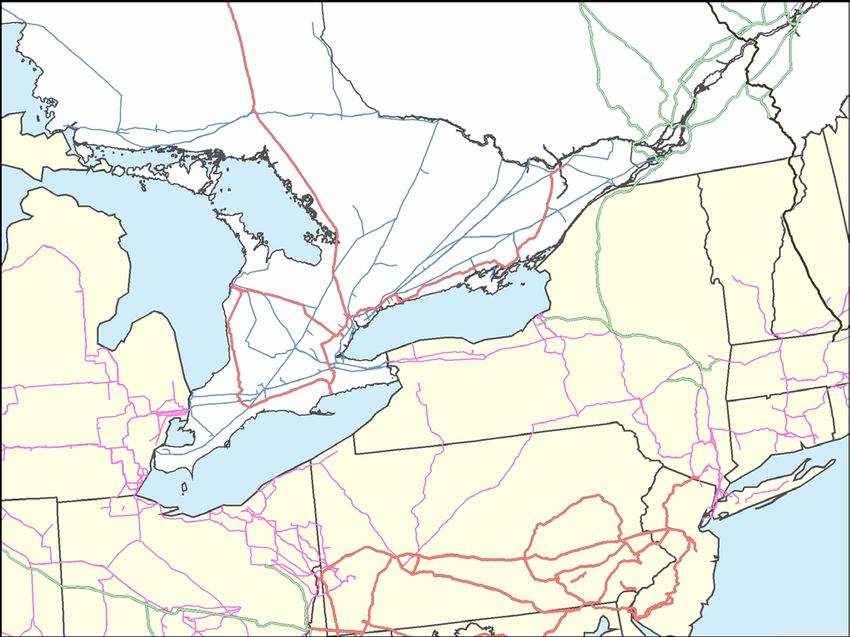
collapsed into a blackout condition (Figure 6.2).
land. Many of these line trips were from Zone 3
impedance relay actions that accelerated the What Stopped the August 14 Blackout
speed of the line trips and reduced the potential from Cascading Further?
time in which grid operators might have identi-
The investigation concluded that a combination of
fied the growing problem and acted construc-
the following factors determined where and when
tively to contain it.
the cascade stopped spreading:
With paths cut from the west, a massive power u The effects of a disturbance travel over power
surge flowed from PJM into New York and lines and become damped the further they are
Ontario in a counter-clockwise flow around from the initial point, much like the ripple from
Lake Erie to serve the load still connected in a stone thrown in a pond. Thus, the voltage and
eastern Michigan and northern Ohio. Relays on current swings seen by relays on lines farther
the lines between PJM and New York saw this away from the initial disturbance are not as
massive power surge as faults and tripped those severe, and at some point they are no longer suf-
lines. Ontario’s east-west tie line also became ficient to cause lines to trip.
overloaded and tripped, leaving northwest u Higher voltage lines and more densely net-
Ontario connected to Manitoba and Minnesota. worked lines, such as the 500-kV system in PJM
The entire northeastern United States and east- and the 765-kV system in AEP, are better able to
ern Ontario then became a large electrical absorb voltage and current swings and thus
island separated from the rest of the Eastern serve as a barrier to the spread of a cascade. As
Interconnection. This large area, which had seen in Phase 6, the cascade progressed into
been importing power prior to the cascade, western Ohio and then northward through
quickly became unstable after 16:10:38 as there Michigan through the areas that had the fewest
was not sufficient generation on-line within the transmission lines. Because there were fewer
island to meet electricity demand. Systems to
the south and west of the split, such as PJM,
Figure 6.2. Area Affected by the Blackout
AEP and others further away, remained intact
and were mostly unaffected by the outage. Once
the northeast split from the rest of the Eastern
Interconnection, the cascade was isolated.
u Phase 7. In the final phase, after 16:10:46 EDT,
the large electrical island in the northeast had
less generation than load, and was unstable
with large power surges and swings in fre-
quency and voltage. As a result, many lines and
generators across the disturbance area tripped,
breaking the area into several electrical islands.
Generation and load within these smaller
islands was often unbalanced, leading to fur-
ther tripping of lines and generating units until
equilibrium was established in each island.
G U.S.-Canada Power System Outage Task Force G August 14th Blackout: Causes and Recommendations G 75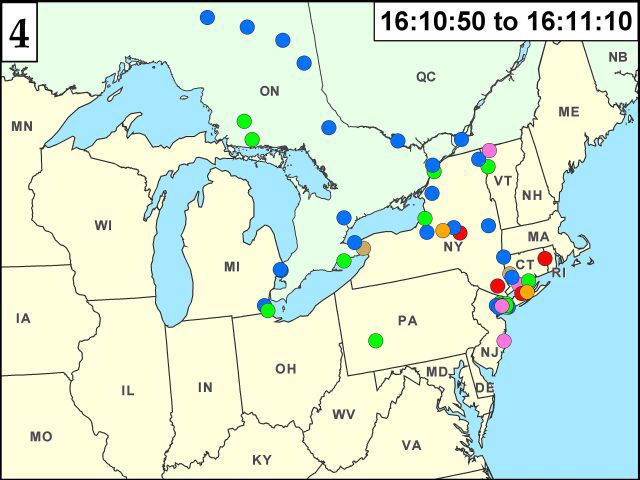
System Oscillations, Stable, Transient, and Dynamic Conditions
 The electric power system constantly experi-          rare cases when a disturbance occurs, the system
 ences small power oscillations that do not lead to    may appear to rebalance quickly, but it then
 system instability. They occur as generator rotors    over-shoots and the oscillations can grow, caus-
 accelerate or slow down while rebalancing elec-       ing widespread instability that spreads in terms
 trical output power to mechanical input power,        of both the magnitude of the oscillations and in
 to respond to changes in load or network condi-       geographic scope. This can occur in a system that
 tions. These oscillations are observable in the       is heavily loaded, causing the electrical distance
 power flow on transmission lines that link gener-     (apparent impedance) between generators to be
 ation to load or in the tie lines that link different longer, making it more difficult to keep the
 regions of the system together. But with a distur-    machine angles and speeds synchronized. In a
 bance to the network, the oscillations can            system that is well damped, the oscillations will
 become more severe, even to the point where           settle out quickly and return to a steady balance.
 flows become progressively so great that protec-      If the oscillation continues over time, neither
 tive relays trip the connecting lines. If the lines   growing nor subsiding, it is a poorly damped
 connecting different electrical regions separate,     system.
 each region will find its own frequency, depend-
 ing on the load to generation balance at the time     The illustration below, of a weight hung on a
 of separation.                                        spring balance, illustrates a system which oscil-
                                                       lates over several cycles to return to balance. A
 Oscillations that grow in amplitude are called        critical point to observe is that in the process of
 unstable oscillations. Such oscillations, once ini-   hunting for its balance point, the spring over-
 tiated, cause power to flow back and forth across     shoots the true weight and balance point of the
 the system like water sloshing in a rocking tub.      spring and weight combined, and must cycle
                                                       through a series of exaggerated overshoots and
 In a stable electric system, if a disturbance such
                                                       underweight rebounds before settling down to
 as a fault occurs, the system will readjust and
                                                       rest at its true balance point. The same process
 rebalance within a few seconds after the fault
                                                       occurs on an electric system, as can be observed
 clears. If a fault occurs, protective relays can trip
                                                       in this chapter.
 in less than 0.1 second. If the system recovers
 and rebalances within less than 3 seconds, with       If a system is in transient instability, the oscilla-
 the possible loss of only the faulted element and     tions following a disturbance will grow in magni-
 a few generators in the area around the fault, then   tude rather than settle out, and it will be unable
 that condition is termed “transiently stable.” If     to readjust to a stable, steady state. This is what
 the system takes from 3 to 30 seconds to recover      happened to the area that blacked out on August
 and stabilize, it is “dynamically stable.” But in     14, 2003.

76     G U.S.-Canada Power System Outage Task Force G August 14th Blackout: Causes and Recommendations G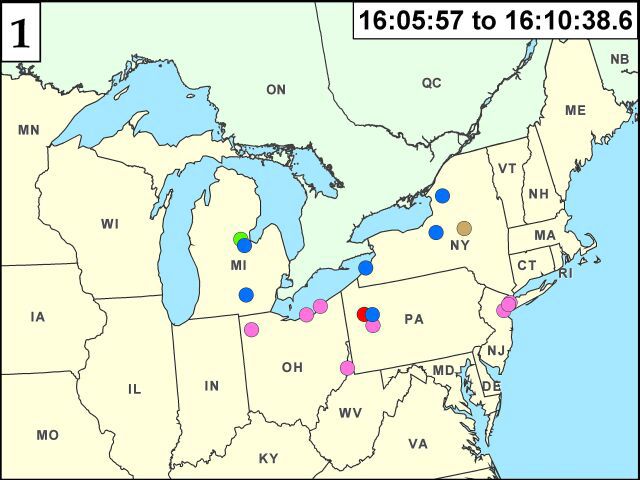
lines, each line absorbed more of the power and         transmission paths west and northwest into Mich-
  voltage surges and was more vulnerable to trip-         igan, causing a sequential loss of lines and power
  ping. A similar effect was seen toward the east         plants.
  as the lines between New York and Pennsylva-
  nia, and eventually northern New Jersey trip-
                                                          Key Events in This Phase
  ped. The cascade of transmission line outages           5A) 16:05:57 EDT: Sammis-Star 345-kV tripped
  became contained after the northeast United                 by zone 3 relay.
  States and Ontario were completely separated            5B) 16:08:59 EDT: Galion-Ohio Central-Mus-
  from the rest of the Eastern Interconnection and            kingum 345-kV line tripped on zone 3 relay.
  no more power flows were possible into the              5C) 16:09:06 EDT: East Lima-Fostoria Central
  northeast (except the DC ties from Québec,                  345-kV line tripped on zone 3 relay, causing
  which continued to supply power to western                  major power swings through New York and
  New York and New England).                                  Ontario into Michigan.
u Line trips isolated some areas from the portion         5D) 16:09:08 EDT to 16:10:27 EDT: Several power
  of the grid that was experiencing instability.              plants lost, totaling 937 MW.
  Many of these areas retained sufficient on-line         5A) Sammis-Star 345-kV Tripped: 16:05:57 EDT
  generation or the capacity to import power from
                                                          Sammis-Star did not trip due to a short circuit to
  other parts of the grid, unaffected by the surges
                                                          ground (as did the prior 345-kV lines that tripped).
  or instability, to meet demand. As the cascade
                                                          Sammis-Star tripped due to protective zone 3
  progressed, and more generators and lines trip-
                                                          relay action that measured low apparent imped-
  ped off to protect themselves from severe dam-
                                                          ance (depressed voltage divided by abnormally
  age, some areas completely separated from the
                                                          high line current) (Figure 6.4). There was no fault
  unstable part of the Eastern Interconnection. In
                                                          and no major power swing at the time of the
  many of these areas there was sufficient genera-
                                                          trip—rather, high flows above the line’s emer-
  tion to match load and stabilize the system.
                                                          gency rating together with depressed voltages
  After the large island was formed in the north-
                                                          caused the overload to appear to the protective
  east, symptoms of frequency and voltage decay
                                                          relays as a remote fault on the system. In effect, the
  emerged. In some parts of the northeast, the sys-
                                                          relay could no longer differentiate between a
  tem became too unstable and shut itself down.
                                                          remote three-phase fault and an exceptionally
  In other parts, there was sufficient generation,
                                                          high line-load condition. Moreover, the reactive
  coupled with fast-acting automatic load shed-
                                                          flows (VAr) on the line were almost ten times
  ding, to stabilize frequency and voltage. In this
                                                          higher than they had been earlier in the day
  manner, most of New England and the Maritime
                                                          because of the current overload. The relay oper-
  Provinces remained energized. Approximately
                                                          ated as it was designed to do.
  half of the generation and load remained on in
  western New York, aided by generation in
  southern Ontario that split and stayed with
                                                          Figure 6.3. Sammis-Star 345-kV Line Trip,
  western New York. There were other smaller
                                                          16:05:57 EDT
  isolated pockets of load and generation that
  were able to achieve equilibrium and remain
  energized.

             Phase 5:                                                             Remaining Paths

    345-kV Transmission System
   Cascade in Northern Ohio and                                                                     5A
      South-Central Michigan
Overview of This Phase
After the loss of FE’s Sammis-Star 345-kV line and
the underlying 138-kV system, there were no
large capacity transmission lines left from the
south to support the significant amount of load in
northern Ohio (Figure 6.3). This overloaded the

       G U.S.-Canada Power System Outage Task Force G August 14th Blackout: Causes and Recommendations G     77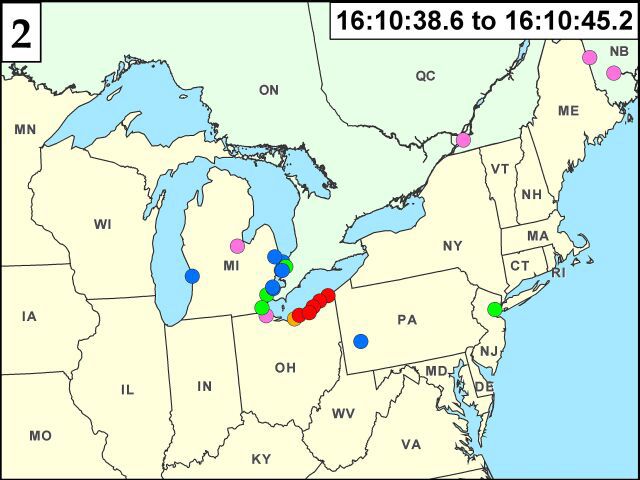
The Sammis-Star 345-kV line trip completely sev-          overloading and tripping within Ohio, this was
ered the 345-kV path into northern Ohio from              happening slowly enough under relatively stable
southeast Ohio, triggering a new, fast-paced              conditions that the system could readjust—after
sequence of 345-kV transmission line trips in             each line loss, power flows would redistribute
which each line trip placed a greater flow burden         across the remaining lines. This is illustrated in
on those lines remaining in service. These line           Figure 6.5, which shows the MW flows on the
outages left only three paths for power to flow into      Michigan Electrical Coordinated Systems (MECS)
western Ohio: (1) from northwest Pennsylvania to          interfaces with AEP (Ohio), FirstEnergy (Ohio)
northern Ohio around the south shore of Lake              and Ontario. The graph shows a shift from 150
Erie, (2) from southwest Ohio toward northeast            MW imports to 200 MW exports from the MECS
Ohio, and (3) from eastern Michigan and Ontario.          system into FirstEnergy at 16:05:57 EDT after the
The line interruptions substantially weakened             loss of Sammis-Star, after which this held steady
northeast Ohio as a source of power to eastern            until 16:08:59, when the loss of East Lima-Fostoria
Michigan, making the Detroit area more reliant on         Central cut the main energy path from the south
345-kV lines west and northwest of Detroit, and           and west into Cleveland and Toledo. Loss of this
from northwestern Ohio to eastern Michigan. The           path was significant, causing flow from MECS into
impact of this trip was felt across the grid—it           FE to jump from 200 MW up to 2,300 MW, where
caused a 100 MW increase in flow from PJM into            it bounced somewhat before stabilizing, roughly,
New York and through to Ontario.1 Frequency in            until the path across Michigan was cut at 16:10:38
the Eastern Interconnection increased momen-              EDT.
tarily by 0.02 Hz.
                                                          Transmission Lines into Northwestern Ohio
Soon after the Sammis-Star trip, four of the five 48      Tripped, and Generation Tripped in South
MW Handsome Lake combustion turbines in                   Central Michigan and Northern Ohio: 16:08:59
western Pennsylvania tripped off-line. These              EDT to 16:10:27 EDT
units are connected to the 345-kV system by the
Homer City-Wayne 345-kV line, and were operat-            5B) 16:08:59 EDT: Galion-Ohio Central-Mus-
ing that day as synchronous condensers to partici-            kingum 345-kV line tripped
pate in PJM’s spinning reserve market (not to             5C) 16:09:06 EDT: East Lima-Fostoria Central
provide voltage support). When Sammis-Star trip-              345-kV line tripped, causing a large power
ped and increased loadings on the local transmis-             swing from Pennsylvania and New York
sion system, the Handsome Lake units were close               through Ontario to Michigan
enough electrically to sense the impact and trip-
ped off-line at 16:07:00 EDT on under-voltage.            The tripping of the Galion-Ohio Central-
                                                          Muskingum and East Lima-Fostoria Central
During the period between the Sammis-Star trip
and the trip of East Lima-Fostoria at 16:09:06.3
                                                          Figure 6.5. Line Flows Into Michigan
EDT, the system was still in a steady-state condi-
tion. Although one line after another was

Figure 6.4. Sammis-Star 345-kV Line Trip

                                                            Note: These curves use data collected from the MECS
                                                          Energy Management System, which records flow quantities
                                                          every 2 seconds. As a result, the fast power swings that
                                                          occurred between 16:10:36 to 16:13 were not captured by the
                                                          recorders and are not reflected in these curves.

78     G U.S.-Canada Power System Outage Task Force G August 14th Blackout: Causes and Recommendations G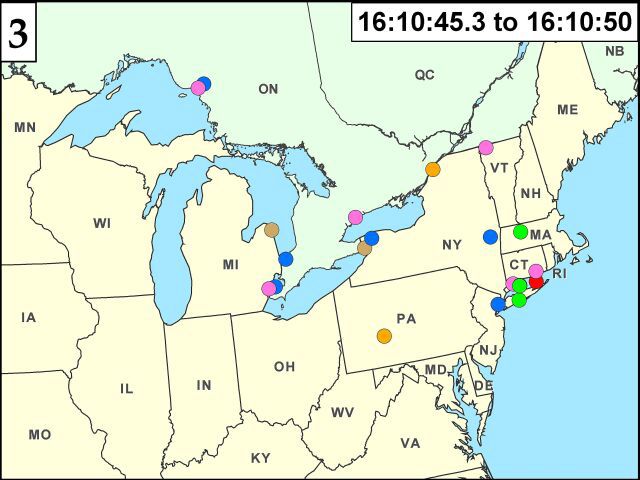
345-kV transmission lines removed the transmis-               shows the impact of the East Lima-Fostoria Cen-
sion paths from southern and western Ohio into                tral and the New York to Ontario power swing,
northern Ohio and eastern Michigan. Northern                  which continued to oscillate for over 10 seconds.
Ohio was connected to eastern Michigan by only                Looking at the MW flow line, it is clear that when
three 345-kV transmission lines near the south-               Sammis-Star tripped, the system experienced
western bend of Lake Erie. Thus, the combined                 oscillations that quickly damped out and
northern Ohio and eastern Michigan load centers               rebalanced. But East Lima-Fostoria triggered sig-
were left connected to the rest of the grid only by:          nificantly greater oscillations that worsened in
(1) transmission lines eastward from northeast                magnitude for several cycles, and returned to sta-
Ohio to northwest Pennsylvania along the south-               bility but continued to flutter until the
ern shore of Lake Erie, and (2) westward by lines             Argenta-Battle Creek trip 90 seconds later. Volt-
west and northwest of Detroit, Michigan and from              ages also began declining at this time.
Michigan into Ontario (Figure 6.6).
                                                              After the East Lima-Fostoria Central trip, power
The Galion-Ohio Central-Muskingum 345-kV line                 flows increased dramatically and quickly on the
tripped first at Muskingum at 16:08:58.5 EDT on a             lines into and across southern Michigan.
phase-to-ground fault, reclosed and tripped again             Although power had initially been flowing north-
at 16:08:58.6 at Ohio Central, reclosed and tripped           east out of Michigan into Ontario, that flow sud-
again at Muskingum on a Zone 3 relay, and finally             denly reversed and approximately 500 to 700 MW
tripped at Galion on a ground fault.                          of power (measured at the Michigan-Ontario bor-
                                                              der, and 437 MW at the Ontario-New York border
After the Galion-Ohio Central-Muskingum line
                                                              at Niagara) flowed southwest out of Ontario
outage and numerous 138-kV line trips in central
                                                              through Michigan to serve the load of Cleveland
Ohio, the East Lima-Fostoria Central 345-kV line
                                                              and Toledo. This flow was fed by 700 MW pulled
tripped at 16:09:06 EDT on Zone 3 relay operation
                                                              out of PJM through New York on its 345-kV net-
due to high current and extremely low voltage
                                                              work.2 This was the first of several inter-area
(80%). Investigation team modeling indicates that             power and frequency events that occurred over
if automatic under-voltage load-shedding had                  the next two minutes. This was the system’s
been in place in northeast Ohio, it might have                response to the loss of the northwest Ohio trans-
been triggered at or before this point, and dropped           mission paths (above), and the stress that the
enough load to reduce or                                      still-high Cleveland, Toledo, and Detroit loads put
eliminate the subsequent              Recommendation s
                                                              onto the surviving lines and local generators.
                                  8, page 147; 21, page 158
line overloads that spread
the cascade.                                                  Figure 6.7 also shows the magnitude of subse-
                                                              quent flows and voltages at the New York-Ontario
Figure 6.7, a high-speed recording of 345-kV flows            Niagara border, triggered by the trips of the
past Niagara Falls from the Hydro One recorders,              Argenta-Battle Creek, Argenta-Tompkins, Hamp-
                                                              ton-Pontiac and Thetford-Jewell 345-kV lines in
Figure 6.6. Ohio 345-kV Lines Trip, 16:08:59 to               Michigan, and the Erie West-Ashtabula-Perry
16:09:07 EDT
                                                              Figure 6.7. New York-Ontario Line Flows at Niagara
                                   ONTARIO

                    5C

                                  5B

        G U.S.-Canada Power System Outage Task Force G August 14th Blackout: Causes and Recommendations G     79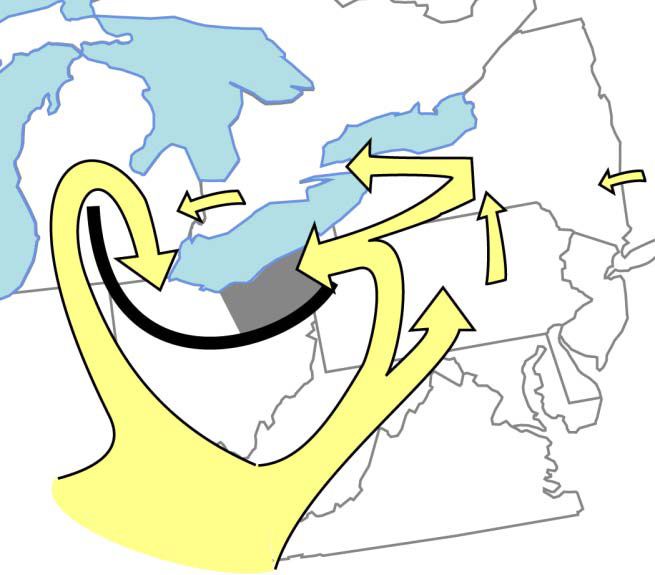
345-kV line linking the Cleveland area to Pennsyl-        reach of the line and its zone 1 and zone 2 settings,
vania. Farther south, the very low voltages on the        a zone 3 relay waits through a 1 to 2 second time
northern Ohio transmission system made it very            delay to allow the primary line protection to act
difficult for the generation in the Cleveland and         first. A few lines have zone 3 settings designed
Lake Erie area to maintain synchronism with the           with overload margins close to the long-term
Eastern Interconnection. Over the next two min-           emergency limit of the line, because the length
utes, generators in this area shut down after reach-      and configuration of the line dictate a higher
ing a point of no recovery as the stress level across     apparent impedance setting. Thus it is possible for
the remaining ties became excessive.                      a zone 3 relay to operate on line load or overload in
                                                          extreme contingency conditions even in the
Figure 6.8, of metered power flows along the New
                                                          absence of a fault (which is why many regions in
York interfaces, documents how the flows head-
                                                          the United States and Canada have eliminated the
ing north and west toward Detroit and Cleveland
                                                          use of zone 3 relays on 230-kV and greater lines).
varied at different points on the grid. Beginning at
                                                          Some transmission operators set zone 2 relays to
16:09:05 EDT, power flows jumped simulta-
                                                          serve the same purpose as zone 3s—i.e., to reach
neously across all three interfaces—but when the
                                                          well beyond the length of the line it is protecting
first power surge peaked at 16:09:09, the change in
                                                          and protect against a distant fault on the outer
flow was highest on the PJM interface and lowest
                                                          lines.
on the New England interface. Power flows
increased significantly on the PJM-NY and NY-             The Sammis-Star line tripped at 16:05:57 EDT on
Ontario interfaces because of the redistribution of       a zone 3 impedance relay although there were no
flow around Lake Erie. The New England and Mar-           faults occurring at the time, because increased real
itime systems maintained the same generation to           and reactive power flow caused the apparent
load balance and did not carry the redistributed          impedance to be within the impedance circle
flows because they were not in the direct path of         (reach) of the relay. Between 16:06:01 and
the flows, so that interface with New York showed         16:10:38.6 EDT, thirteen more important 345 and
little response.                                          138-kV lines tripped on zone 3 operations that
                                                          afternoon at the start of the cascade, including
Before this first major power swing on the Michi-
                                                          Galion-Ohio Central-Muskingum, East Lima-
gan/Ontario interface, power flows in the NPCC
                                                          Fostoria Central, Argenta-Battle Creek, Argenta-
Region (Québec, Ontario and the Maritimes, New
                                                          Tompkins, Battle Creek-Oneida, and Perry-
England and New York) were typical for the sum-
                                                          Ashtabula (Figure 6.9). These included several
mer period, and well within acceptable limits.
                                                          zone 2 relays in Michigan that had been set to
Transmission and generation facilities were then
                                                          operate like zone 3s, overreaching the line by more
in a secure state across the NPCC region.
                                                          than 200% with no intentional time delay for
Zone 3 Relays and the Start of the Cascade                remote breaker failure protection.3 All of these
                                                          relays operated according to their settings. How-
Zone 3 relays are set to provide breaker failure and      ever, the zone 3 relays (and zone 2 relays acting
relay backup for remote distance faults on a trans-       like zone 3s) acted so quickly that they impeded
mission line. If it senses a fault past the immediate     the natural ability of the electric system to hold
                                                          together, and did not allow for any operator inter-
Figure 6.8. First Power Swing Has Varying Impacts         vention to attempt to stop the spread of the cas-
Across the Grid                                           cade. The investigation team concluded that
                                                          because these zone 2 and 3 relays tripped after
                                                          each line overloaded, these relays were the com-
                                                          mon mode of failure that accelerated the geo-
                                                          graphic spread of the cascade. Given grid
                                                          conditions and loads and the limited operator
                                                          tools available, the speed of the zone 2 and 3 oper-
                                                          ations across Ohio and Michigan eliminated any
                                                          possibility after 16:05:57 EDT that either operator
                                                          action or automatic intervention could have lim-
                                                          ited or mitigated the growing cascade.
                                                          What might have happened on August 14 if these
                                                          lines had not tripped on zone 2 and 3 relays? Each

80     G U.S.-Canada Power System Outage Task Force G August 14th Blackout: Causes and Recommendations G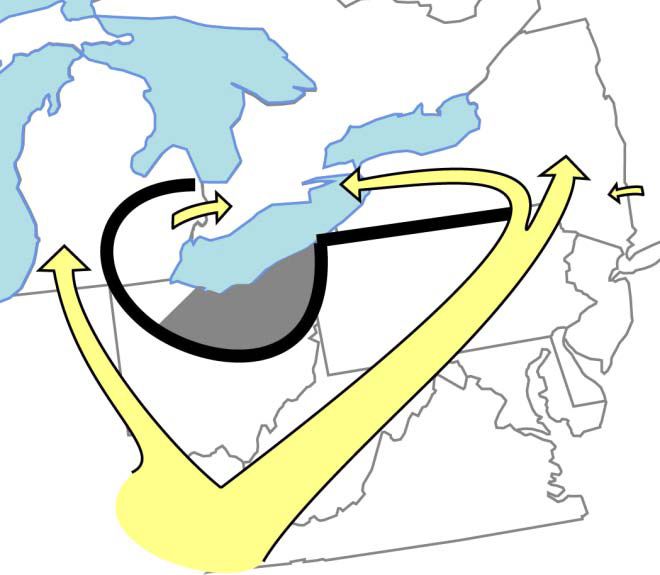
Figure 6.9. Map of Zone 3 (and Zone 2s Operating Like Zone 3s) Relay Operations on August 14, 2003

 Voltage Collapse
 Although the blackout of August 14 has been              workable bounds before individual transmission
 labeled by some as a voltage collapse, it was not a      trips began, and those trips occurred within nor-
 voltage collapse as that term has been tradition-        mal line ratings rather than in overloads. With
 ally used by power system engineers. Voltage             fewer lines operational, current flowing over the
 collapse occurs when an increase in load or loss         remaining lines increased and voltage decreased
 of generation or transmission facilities causes          (current increases in inverse proportion to the
 dropping voltage, which causes a further reduc-          decrease in voltage for a given amount of power
 tion in reactive power from capacitors and line          flow)—but it stabilized after each line trip until
 charging, and still further voltage reductions. If       the next circuit trip. Soon northern Ohio lines
 the declines continue, these voltage reductions          began to trip out automatically on protection
 cause additional elements to trip, leading to fur-       from overloads, not from insufficient reactive
 ther reduction in voltage and loss of load. The          power. Once several lines tripped in the Cleve-
 result is a progressive and uncontrollable decline       land-Akron area, the power flow was rerouted to
 in voltage, all because the power system is              other heavily loaded lines in northern Ohio,
 unable to provide the reactive power required to         causing depressed voltages which led to auto-
 supply the reactive power demand. This did not           matic tripping on protection from overloads.
 occur on August 14. While the Cleveland-Akron            Voltage collapse therefore was not a cause of the
 area was short of reactive power reserves they           cascade.
 were just sufficient to supply the reactive power
 demand in the area and maintain stable albeit            As the cascade progressed beyond Ohio, it spread
 depressed voltages for the outage conditions             due not to insufficient reactive power and a volt-
 experienced.                                             age collapse, but because of dynamic power
                                                          swings and the resulting system instability.
 But the lines in the Cleveland-Akron area tripped        Figure 6.7 shows voltage levels recorded at the
 as a result of tree contacts well below the nomi-        Niagara area. It shows clearly that voltage levels
 nal rating of the lines and not due to low volt-         remained stable until 16:10:30 EDT, despite sig-
 ages, which is a precursor for voltage collapse.         nificant power fluctuations. In the cascade that
 The initial trips within FirstEnergy began               followed, the voltage instability was a compan-
 because of ground faults with untrimmed                  ion to, not a driver of, the angle instability that
 trees, not because of a shortage of reactive power       tripped generators and lines.
 and low voltages. Voltage levels were within

       G U.S.-Canada Power System Outage Task Force G August 14th Blackout: Causes and Recommendations G   81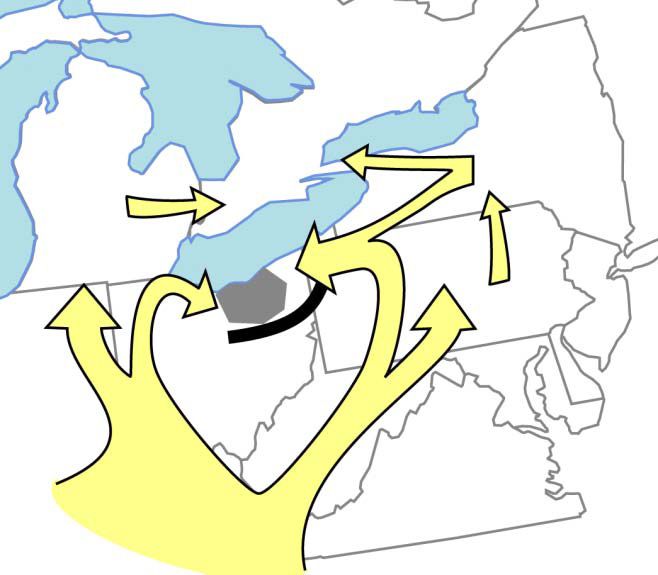
was operating with high load, and loads on each           and limited       transmission       and   generation
line grew as each preceding line tripped out of ser-      capability.
vice. But if these lines had not tripped quickly on
zone 2s and 3s, each might have remained heavily                 Phase 6: The Full Cascade
loaded, with conductor temperatures increasing,
for as long as 20 to 30 minutes before the line           Between 16:10:36 EDT and 16:13 EDT, thousands
sagged into something and experienced a ground            of events occurred on the grid, driven by physics
fault. For instance, the Dale-West Canton line took       and automatic equipment operations. When it was
20 minutes to trip under 160 to 180% of its normal        over, much of the northeastern United States and
rated load. Even with sophisticated modeling it is        the province of Ontario were in the dark.
impossible to predict just how long this delay            Key Phase 6 Events
might have occurred (affected by wind speeds,
line loadings, and line length, tension and ground        Transmission Lines Disconnected Across
clearance along every span), because the system           Michigan and Northern Ohio, Generation Shut
did not become dynamically unstable until at least        Down in Central Michigan and Northern Ohio,
after the Thetford-Jewell trip at 16:10:38 EDT.           and Northern Ohio Separated from
During this period the system would likely have           Pennsylvania: 16:10:36 to 16:10:39 EDT
remained stable and been able to readjust after           6A) Transmission and more generation tripped
each line trip on ground fault. If this period of             within Michigan: 16:10:36 to 16:10:37 EDT:
deterioration and overloading under stable condi-             16:10:36.2 EDT: Argenta-Battle Creek 345-kV
tions had lasted for as little as 15 minutes or as            line tripped
long as an hour, it is possible that the growing
problems could have been recognized and action                16:10:36.3 EDT: Argenta-Tompkins 345-kV
taken, such as automatic under-voltage load-                  line tripped
shedding, manual load-shedding in Ohio or other               16:10:36.8 EDT: Battle Creek-Oneida 345-kV
measures. So although the operation of zone 2 and             line tripped
3 relays in Ohio and Michigan did not cause the                16:10:37 EDT: Sumpter Units 1, 2, 3, and 4
blackout, it is certain that                                   units tripped on under-voltage (300 MW near
they greatly expanded and           Recommendation
                                                               Detroit)
                                      21, page 158
accelerated the spread of
the cascade.                                                   16:10:37.5 EDT: MCV Plant output dropped
                                                               from 963 MW to 109 MW on over-current
5D) Multiple Power Plants Tripped, Totaling                    protection.
946 MW: 16:09:08 to 16:10:27 EDT
  16:09:08 EDT: Michigan Cogeneration Venture             Together, the above line outages interrupted the
  plant reduction of 300 MW (from 1,263 MW to             west-to-east transmission paths into the Detroit
  963 MW)                                                 area from south-central Michigan. The Sumpter
                                                          generation units tripped in response to
  16:09:17 EDT: Avon Lake 7 unit trips (82 MW)
  16:09:17 EDT: Burger 3, 4, and 5 units trip (355        Figure 6.10. Michigan and Ohio Power Plants Trip
  MW total)
  16:09:30 EDT: Kinder Morgan units 3, 6 and 7                                             ONTARIO

  trip (209 MW total)
The Burger units tripped after the 138-kV lines                                     5D
into the Burger 138-kV substation (Ohio) tripped
from the low voltages in the Cleveland area (Fig-
ure 6.10). The MCV plant is in central Michigan.
Kinder Morgan is in south-central Michigan. The
Kinder-Morgan units tripped due to a transformer
fault and one due to over-excitation.
Power flows into Michigan from Indiana
increased to serve loads in eastern Michigan and
northern Ohio (still connected to the grid through
northwest Ohio and Michigan) and voltages
dropped from the imbalance between high loads

82     G U.S.-Canada Power System Outage Task Force G August 14th Blackout: Causes and Recommendations G
under-voltage on the system. Michigan lines west is no evidence that the reclose caused harm to the
of Detroit then began to trip, as shown in Figure local generators.
6.11.
6B) Western and Eastern Michigan separation
The Argenta-Battle Creek relay first opened the started: 16:10:37 EDT to 16:10:38 EDT
line at 16:10:36.230 EDT, reclosed it at 16:10:37, 16:10:38.2 EDT: Hampton-Pontiac 345-kV
then tripped again. This line connects major gen- line tripped
erators—including the Cook and Palisades
nuclear plants and the Campbell fossil plant—to 16:10:38.4 EDT: Thetford-Jewell 345-kV line
the MECS system. This line is designed with tripped
auto-reclose breakers at each end of the line, After the Argenta lines tripped, the phase angle
which do an automatic high-speed reclose as soon between eastern and western Michigan began to
as they open to restore the line to service with no increase. The Hampton-Pontiac and Thetford-
interruptions. Since the majority of faults on the Jewell 345-kV lines were the only lines remaining
North American grid are temporary, automatic connecting Detroit to power sources and the rest of
reclosing can enhance stability and system reli- the grid to the north and west. When these lines
ability. However, situations can occur when the tripped out of service, it left the loads in Detroit,
power systems behind the two ends of the line Toledo, Cleveland, and their surrounding areas
could go out of phase during the high-speed served only by local generation and the lines north
reclose period (typically less than 30 cycles, or one of Lake Erie connecting Detroit east to Ontario and
half second, to allow the air to de-ionize after the the lines south of Lake Erie from Cleveland east to
trip to prevent arc re-ignition). To address this and northwest Pennsylvania. These trips completed
protect generators from the harm that an the extra-high voltage network separation
out-of-synchronism reconnect could cause, it is between eastern and western Michigan.
worth studying whether a synchro-check relay is
needed, to reclose the second breaker only when The Power System Disturbance Recorders at Keith
the two ends are within a certain voltage and and Lambton, Ontario, captured these events in
phase angle tolerance. No such protection was the flows across the Ontario-Michigan interface,
installed at Argenta-Battle Creek; when the line as shown in Figure 6.12 and Figure 6.16. It shows
reclosed, there was a 70o difference in phase clearly that the west to east Michigan separation
across the circuit breaker reclosing the line. There (the Thetford-Jewell trip) was the start and Erie
West-Ashtabula-Perry was the trigger for the 3,700
MW surge from Ontario into Michigan. When
Figure 6.11. Transmission and Generation Trips in Thetford-Jewell tripped, power that had been
Michigan, 16:10:36 to 16:10:37 EDT flowing into Michigan and Ohio from western
Michigan, western Ohio and Indiana was cut off.
The nearby Ontario recorders saw a pronounced
impact as flows into Detroit readjusted to draw
power from the northeast instead. To the south,
Figure 6.12. Flows on Keith-Waterman 230-kV
6A Ontario-Michigan Tie Line
G U.S.-Canada Power System Outage Task Force G August 14th Blackout: Causes and Recommendations G 83Erie West-Ashtabula-Perry was the last 345-kV 6C) Cleveland separated from Pennsylvania, eastern link for northern Ohio loads. When that flows reversed and a huge power surge line severed, all the power that moments before flowed counter-clockwise around Lake Erie: had flowed across Michigan and Ohio paths was 16:10:38.6 EDT now diverted in a counter-clockwise direction 16:10:38.6 EDT: Erie West-Ashtabula-Perry around Lake Erie through the single path left in 345-kV line tripped at Perry eastern Michigan, pulling power out of Ontario, 16:10:38.6 EDT: Large power surge to serve New York and PJM. loads in eastern Michigan and northern Ohio Figures 6.13 and 6.14 show the results of investi- swept across Pennsylvania, New Jersey, and gation team modeling of the line loadings on the New York through Ontario into Michigan. Ohio, Michigan, and other regional interfaces for Perry-Ashtabula was the last 345-kV line connect- the period between 16:05:57 until the Thetford- ing northern Ohio to the east south of Lake Erie. Jewell trip, to understand how power flows shifted This line’s trip at the Perry substation on a zone 3 during this period. The team simulated evolving relay operation separated the northern Ohio system conditions on August 14, 2003, based on 345-kV transmission system from Pennsylvania the 16:05:50 power flow case developed by the and all eastern 345-kV connections. After this trip, MAAC-ECAR-NPCC Operations Studies Working the load centers in eastern Michigan and northern Group. Each horizontal line in the graph indicates Ohio (Detroit, Cleveland, and Akron) remained a single or set of 345-kV lines and its loading as a connected to the rest of the Eastern Interconnec- function of normal ratings over time as first one, tion only to the north at the interface between the then another, set of circuits tripped out of service. Michigan and Ontario systems (Figure 6.15). East- In general, each subsequent line trip causes the ern Michigan and northern Ohio now had little remaining line loadings to rise; where a line drops internal generation left and voltage was declining. (as Erie West-Ashtabula-Perry in Figure 6.13 after The frequency in the Cleveland area dropped rap- the Hanna-Juniper trip), that indicates that line idly, and between 16:10:39 and 16:10:50 EDT loading lightened, most likely due to customers under-frequency load shedding in the Cleveland dropped from service. Note that Muskingum and area interrupted about 1,750 MW of load. How- East Lima-Fostoria Central were overloaded before ever, the load shedding did not drop enough load they tripped, but the Michigan west and north relative to local generation to rebalance and arrest interfaces were not overloaded before they trip- the frequency decline. Since the electrical system ped. Erie West-Ashtabula-Perry was loaded to always seeks to balance load and generation, the 130% after the Hampton-Pontiac and Thetford- high loads in Detroit and Cleveland drew power Jewell trips. over the only major transmission path remain- The Regional Interface Loadings graph (Figure ing—the lines from eastern Michigan into Ontario. 6.14) shows that loadings at the interfaces Mismatches between generation and load are between PJM-NY, NY-Ontario and NY-New Eng- reflected in changes in frequency, so with more land were well within normal ratings before the generation than load frequency rises and with less east-west Michigan separation. generation than load, frequency falls. Figure 6.13. Simulated 345-kV Line Loadings from Figure 6.14. Simulated Regional Interface Loadings 16:05:57 through 16:10:38.4 EDT from 16:05:57 through 16:10:38.4 EDT 84 G U.S.-Canada Power System Outage Task Force G August 14th Blackout: Causes and Recommendations G
At 16:10:38.6 EDT, after the above transmission           and black out (as evidenced by the rapid power
paths into Michigan and Ohio failed, the power            oscillations decaying after 16:10:43 EDT).
that had been flowing at modest levels into Michi-
gan from Ontario suddenly jumped in magnitude.
While flows from Ontario into Michigan had been           Figure 6.15. Michigan Lines Trip and Ohio
                                                          Separates from Pennsylvania, 16:10:36 to
in the 250 to 350 MW range since 16:10:09.06
                                                          16:10:38.6 EDT
EDT, with this new surge they peaked at 3,700
MW at 16:10:39 EDT (Figure 6.16). Electricity
moved along a giant loop through Pennsylvania
and into New York and Ontario and then into
Michigan via the remaining transmission path to
                                                                                  6B
serve the combined loads of Cleveland, Toledo,
and Detroit. This sudden large change in power
flows drastically lowered voltage and increased
current levels on the transmission lines along the
Pennsylvania-New York transmission interface.                                           6C
This was a power surge of large magnitude, so fre-
quency was not the same across the Eastern Inter-
connection. As Figure 6.16 shows, the power
swing resulted in a rapid rate of voltage decay.
Flows into Detroit exceeded 3,700 MW and 1,500
MVAr—the power surge was draining real power
out of the northeast, causing voltages in Ontario
and New York to drop. At the same time, local
voltages in the Detroit area were plummeting
because Detroit had already lost 500 MW of local
generation. Detroit would soon lose synchronism

 Modeling the Cascade
 Computer modeling of the cascade built upon the          verify a close correspondence for line flows and
 modeling conducted of the pre-cascade system             voltages. If there was too much of a gap between
 conditions described in Chapter 5. That earlier          modeled and actual results, they looked at the
 modeling developed steady-state load flow and            timing of key events to see whether actual data
 voltage analyses for the entire Eastern Intercon-        might have been mis-recorded, or whether the
 nection from 15:00 to 16:05:50 EDT. The                  modeled variance for an event not previously
 dynamic modeling used the steady state load              recognized as significant might influence the
 flow model for 16:05:50 as the starting point to         outcome. Through 16:10:40 EDT, the team
 simulate the cascade. Dynamic modeling con-              achieved very close benchmarking of the model
 ducts a series of load flow analyses, moving from        against actual results.
 one set of system conditions to another in steps         The modeling team consisted of industry mem-
 one-quarter of a cycle long—in other words, to           bers from across the Midwest, Mid-Atlantic and
 move one second from 16:10:00 to 16:10:01                NPCC areas. All have extensive electrical engi-
 requires simulation of 240 separate time slices.         neering and/or mathematical training and experi-
 The model used a set of equations that incorpo-          ence as system planners for short- or long-term
 rate the physics of an electrical system. It             operations.
 contained detailed sub-models to reflect the             This modeling allows the team to verify its
 characteristics of loads, under-frequency load-          hypotheses as to why particular events occurred
 shedding, protective relay operations, generator         and the relationships between different events
 operations (including excitation systems and             over time. It allows testing of many “what if” sce-
 governors), static VAr compensators and other            narios and alternatives, to determine whether a
 FACTS devices, and transformer tap changers.             change in system conditions might have pro-
 The modelers compared model results at each              duced a different outcome.
 moment to actual system data for that moment to

       G U.S.-Canada Power System Outage Task Force G August 14th Blackout: Causes and Recommendations G   85
Just before the Argenta-Battle Creek trip, when cases, this adjustment was unsuccessful and the
Michigan separated west to east at 16:10:37 EDT, generators tripped out from milliseconds to sev-
almost all of the generators in the eastern intercon- eral seconds thereafter.
nection were moving in synchronism with the
The Perry-Ashtabula-Erie West 345-kV line trip at
overall grid frequency of 60 Hertz (shown at the
16:10:38.6 EDT was the point when the Northeast
bottom of Figure 6.17), but when the swing
entered a period of transient instability and a loss
started, those machines absorbed some of its ener-
of generator synchronism. Between 16:10:38 and
gy as they attempted to adjust and resynchronize
16:10:41 EDT, the power swings caused a sudden
with the rapidly changing frequency. In many
extraordinary increase in system frequency, hit-
ting 60.7 Hz at Lambton and 60.4 Hz at Niagara.
Figure 6.16. Active and Reactive Power and Voltage Because the demand for power in Michigan, Ohio,
from Ontario into Detroit and Ontario was drawing on lines through New
York and Pennsylvania, heavy power flows were
moving northward from New Jersey over the New
York tie lines to meet those power demands, exac-
erbating the power swing. Figure 6.17 shows
actual net line flows summed across the interfaces
between the main regions affected by these
swings—Ontario into Michigan, New York into
Ontario, New York into New England, and PJM
into New York. This shows clearly that the power
swings did not move in unison across every inter-
face at every moment, but varied in magnitude
and direction. This occurred for two reasons. First,
the availability of lines to complete the path across
Figure 6.17. Measured Power Flows and Frequency Across Regional Interfaces, 16:10:30 to 16:11:00 EDT,
with Key Events in the Cascade
86 G U.S.-Canada Power System Outage Task Force G August 14th Blackout: Causes and Recommendations Geach interface varied over time, as did the amount Majestic 345-kV Substation: one terminal
of load that drew upon each interface, so net flows opened sequentially on all 345-kV lines
across each interface were not facing consistent 16:10:41.8 EDT: Fostoria Central-Galion
demand with consistent capability as the cascade 345-kV line
progressed. Second, the speed and magnitude of
the swing was moderated by the inertia, reactive 16:10:41.911 EDT: Beaver-Davis Besse
power capabilities, loading conditions and loca- 345-kV line
tions of the generators across the entire region. Under-frequency load-shedding in Ohio:
After Cleveland was cut off from Pennsylvania
FirstEnergy shed 1,754 MVA load
and eastern power sources, Figure 6.17 shows the
start of the dynamic power swing at 16:10:38.6. AEP shed 133 MVA load
Because the loads of Cleveland, Toledo and
Detroit (less the load already blacked out) were Seven power plants, for a total of 3,294 MW of
now hanging off Michigan and Ontario, this forced generation, tripped off-line in Ohio:
a gigantic shift in power flows to meet that 16:10:42 EDT: Bay Shore Units 1-4 (551 MW
demand. As noted above, flows from Ontario into near Toledo) tripped on over-excitation
Michigan increased from 1,000 MW to 3,700 MW
shortly after the start of the swing, while flows 16:10:40 EDT: Lakeshore unit 18 (156 MW,
from PJM into New York were close behind. But near Cleveland) tripped on under-frequency
within two seconds from the start of the swing, at 16:10:41.7 EDT: Eastlake 1, 2, and 3 units
16:10:40 EDT flows reversed and coursed back (304 MW total, near Cleveland) tripped on
from Michigan into Ontario at the same time that under-frequency
frequency at the interface dropped, indicating that
significant generation had been lost. Flows that 16:10:41.7 EDT: Avon Lake unit 9 (580 MW,
had been westbound across the Ontario-Michigan near Cleveland) tripped on under-frequency
interface by over 3,700 MW at 16:10:38.8 dropped 16:10:41.7 EDT: Perry 1 nuclear unit (1,223
down to 2,100 MW eastbound by 16:10:40, and MW, near Cleveland) tripped on under-
then returned westbound starting at 16:10:40.5. frequency
A series of circuits tripped along the border
between PJM and the NYISO due to zone 1 imped- 16:10:42 EDT: Ashtabula unit 5 (184 MW,
ance relay operations on overload and depressed near Cleveland) tripped on under-frequency
voltage. The surge also moved into New England 16:10:43 EDT: West Lorain units (296 MW)
and the Maritimes region of Canada. The combi- tripped on under-voltage
nation of the power surge and frequency rise
caused 380 MW of pre-selected Maritimes genera- Four power plants producing 1,759 MW tripped
tion to drop off-line due to the operation of the off-line near Detroit:
New Brunswick Power “Loss of Line 3001” Special 16:10:42 EDT: Greenwood unit 1 tripped (253
Protection System. Although this system was MW) on low voltage, high current
designed to respond to failure of the 345-kV link
between the Maritimes and New England, it oper- 16:10:41 EDT: Belle River unit 1 tripped (637
ated in response to the effects of the power surge. MW) on out-of-step
The link remained intact during the event. 16:10:41 EDT: St. Clair unit 7 tripped (221
6D) Conditions in Northern Ohio and Eastern MW, DTE unit) on high voltage
Michigan Degraded Further, With More
Transmission Lines and Power Plants Fail- 16:10:42 EDT: Trenton Channel units 7A, 8
ing: 16:10:39 to 16:10:46 EDT and 9 tripped (648 MW)
Line trips in Ohio and eastern Michigan: Back in northern Ohio, the trips of the Bay
16:10:39.5 EDT: Bay Shore-Monroe 345-kV Shore-Monroe, Majestic-Lemoyne, Allen Junc-
line tion-Majestic-Monroe 345-kV lines, and the
Ashtabula 345/138-kV transformer cut off Toledo
16:10:39.6 EDT: Allen Junction-Majestic- and Cleveland from the north, turning that area
Monroe 345-kV line into an electrical island (Figure 6.18). Frequency
16:10:40.0 EDT: Majestic-Lemoyne 345-kV in this large island began to fall rapidly. This
line caused a series of power plants in the area to trip
G U.S.-Canada Power System Outage Task Force G August 14th Blackout: Causes and Recommendations G 87off-line due to the operation of under-frequency running at maximum mechanical output, they
relays, including the Bay Shore units. When the began to pull out of synchronous operation with
Beaver-Davis Besse 345-kV line between Cleve- the rest of the grid. When voltage in Detroit
land and Toledo tripped, it left the Cleveland area returned to near-normal, the generators could not
completely isolated and area frequency rapidly fully pull back its rate of revolutions, and ended
declined. Cleveland area load was disconnected up producing excessive temporary output levels,
by automatic under-frequency load-shedding still out of step with the system. This is evident in
(approximately 1,300 MW), and another 434 MW Figure 6.19, which shows at least two sets of gen-
of load was interrupted after the generation erator “pole slips” by plants in the Detroit area
remaining within this transmission “island” was between 16:10:40 EDT and 16:10:42 EDT. Several
tripped by under-frequency relays. This sudden large units around Detroit—Belle River, St. Clair,
load drop would contribute to the reverse power Greenwood, Monroe, and Fermi—all tripped in
swing. In its own island, portions of Toledo response. After formation of the Cleveland-Toledo
blacked out from automatic under-frequency island at 16:10:40 EDT, Detroit frequency spiked
load-shedding but most of the Toledo load was to almost 61.7 Hz before dropping, momentarily
restored by automatic reclosing of lines such as equalized between the Detroit and Ontario sys-
the East Lima-Fostoria Central 345-kV line and tems, but Detroit frequency began to decay at 2
several lines at the Majestic 345-kV substation. Hz/sec and the generators then experienced
under-speed conditions.
The Perry nuclear plant is in Ohio on Lake Erie,
not far from the Pennsylvania border. The Perry Re-examination of Figure 6.17 shows the power
plant was inside a decaying electrical island, swing from the northeast through Ontario into
and the plant tripped on under-frequency, as Michigan and northern Ohio that began at
designed. A number of other units near Cleveland 16:10:37, and how it reverses and swings back
tripped off-line by under-frequency protection. around Lake Erie at 16:10:39 EDT. That return was
caused by the combination of natural oscillations,
The tremendous power flow into Michigan, begin- accelerated by major load losses, as the northern
ning at 16:10:38, occurred when Toledo and Ohio system disconnected from Michigan. It
Cleveland were still connected to the grid only caused a power flow change of 5,800 MW, from
through Detroit. After the Bay Shore-Monroe line 3,700 MW westbound to 2,100 eastbound across
tripped at 16:10:39, Toledo-Cleveland were sepa- the Ontario to Michigan border between
rated into their own island, dropping a large 16:10:39.5 and 16:10:40 EDT. Since the system
amount of load off the Detroit system. This left was now fully dynamic, this large oscillation east-
Detroit suddenly with excess generation, much of bound would lead naturally to a rebound, which
which was greatly accelerated in angle as the began at 16:10:40 EDT with an inflection point
depressed voltage in Detroit (caused by the high reflecting generation shifts between Michigan and
demand in Cleveland) caused the Detroit units to Ontario and additional line losses in Ohio.
pull nearly out of step. With the Detroit generators
Figure 6.18. Cleveland and Toledo Islanded, Figure 6.19. Generators Under Stress in Detroit,
16:10:39 to 16:10:46 EDT as Seen from Keith PSDR
6D
88 G U.S.-Canada Power System Outage Task Force G August 14th Blackout: Causes and Recommendations GWestern Pennsylvania Separated from New small area so a power swing is less likely to enter
York: 16:10:39 EDT to 16:10:44 EDT the relay target circle at all, averting a zone 1 trip.
6E) 16:10:39 EDT, Homer City-Watercure Road At 16:10:44 EDT, the northern part of the Eastern
345 kV Interconnection (including eastern Michigan) was
16:10:39 EDT: Homer City-Stolle Road 345 connected to the rest of the Interconnection at
kV only two locations: (1) in the east through the
500-kV and 230-kV ties between New York and
6F) 16:10:44 EDT: South Ripley-Erie East 230 kV,
northeast New Jersey, and (2) in the west through
and South Ripley-Dunkirk 230 kV
the long and electrically fragile 230-kV transmis-
16:10:44 EDT: East Towanda-Hillside 230 kV sion path connecting Ontario to Manitoba and
Responding to the swing of power out of Michigan Minnesota. The separation of New York from
toward Ontario and into New York and PJM, zone Pennsylvania (leaving only the lines from New Jer-
1 relays on the 345-kV lines separated Pennsylva- sey into New York connecting PJM to the north-
nia from New York (Figure 6.20). Homer east) buffered PJM in part from these swings.
City-Watercure (177 miles or 285 km) and Homer Frequency was high in Ontario at that point, indi-
City-Stolle Road (207 miles or 333 km) are very cating that there was more generation than load,
long lines and so have high impedance. Zone 1 so much of this flow reversal never got past
relays do not have timers, and operate instantly Ontario into New York.
when a power swing enters the relay target circle. 6G) Transmission paths disconnected in New
For normal length lines, zone 1 relays have small Jersey and northern Ontario, isolating the
target circles because the relay is measuring a less northeast portion of the Eastern
than the full length of the line—but for a long line Interconnection: 16:10:43 to 16:10:45 EDT
the large line impedance enlarges the relay’s target
circle and makes it more likely to be hit by the 16:10:43 EDT: Keith-Waterman 230-kV line
power swing. The Homer City-Watercure and tripped
Homer City-Stolle Road lines do not have zone 3 16:10:45 EDT: Wawa-Marathon 230-kV lines
relays. tripped
Given the length and impedance of these lines, it 16:10:45 EDT: Branchburg-Ramapo 500-kV line
was highly likely that they would trip and separate tripped
early in the face of such large power swings. Most At 16:10:43 EDT, eastern Michigan was still con-
of the other interfaces between regions are on nected to Ontario, but the Keith-Waterman
short ties—for instance, the ties between New 230-kV line that forms part of that interface dis-
York and Ontario and Ontario to Michigan are connected due to apparent impedance (Figure
only about 2 miles (3.2 km) long, so they are elec- 6.21). This put more power onto the remaining
trically very short and thus have much lower interface between Ontario and Michigan, but
impedance and trip less easily than these long
lines. A zone 1 relay target for a short line covers a
Figure 6.21. Northeast Separates from Eastern
Interconnection, 16:10:45 EDT
Figure 6.20. Western Pennsylvania Separates from
New York, 16:10:39 EDT to 16:10:44 EDT
6F 6G
6E
6F
G U.S.-Canada Power System Outage Task Force G August 14th Blackout: Causes and Recommendations G 89You can also read